For personal use only
|
|
|
- Linda Flowers
- 5 years ago
- Views:
Transcription

1 Ruralco 2012 Full Year Results Briefing 20 November
2 Presentation Outline Performance Overview Activity Performance Capital Management Strategy Update Summary & Outlook 2
3 Key Outcomes Performance Overview Sales growth of 13.3% despite lower livestock and wool prices, benefiting from selective footprint expansion in key farming regions. Earnings Before Interest & Tax (EBIT) up 1.8% against backdrop of reduced agency commodity prices and generally drier climatic conditions. Sector expansion strategy delivering strong growth led by grain marketing and water & environment portfolios. Net Profit After Tax (NPAT) down 7.5% driven by reduced profitability in the 100%- owned businesses relative to the joint venture operations, plus higher finance costs associated with sales growth initiatives and the Elders investment. Continuous safety focus has seen Lost Time Injury Frequency Rate (LTIFR) reach historically low levels. Restructure of the Tasmanian residential real estate business starting to take effect. Productivity improvement initiatives across the mainland agency activities ongoing in the face of falling commodity prices and mixed confidence levels. Capital management continues to track satisfactorily with only limited impact from the Elders investment and other acquisition capex. 3
4 Financial Performance Performance Overview Full Year ended 30 th September ($m) % change Sales Revenue 1, , % Gross Profit % EBIT (underlying) (0.8%) EBIT (reported) % NPAT (underlying) (11.4%) NPAT (reported) (7.5%) Gearing (Net Debt / Equity) 26.4% 9.4% 180.9% Gearing (excl Elders) 19.2% 9.4% 104.3% Earnings per share (cents) (6.5%) Final dividend per share (cents) % Sales growth on pcp includes headline 17% increase in rural supplies revenue. Gross profit increase on pcp underwritten by grain marketing (40%), rural supplies (27%) and water & environment (22%) respectively. Livestock activity increased head volumes compared to pcp but gross profit was down 9% due to significantly reduced livestock prices impacting commission yields, with wool similarly affected. Non-controlling interest increased $1.9m (32%) on pcp reflecting the stronger performance of the nonagency focussed joint venture businesses. 4
5 Financial Performance Performance Overview Non Recurring Items ($m) Reported Profit after tax Restructuring Costs (1.0) (0.5) Contingent Goodwill Expensed (0.9) (1.0) Long-service Leave Legislation (Tas) (0.4) - Profit (Loss) on Discontinued Businesses 0.4 (1.0) Profit (Loss) on Sale of Assets (0.7) 1.3 Acquisition Costs - (0.4) Operational One off Costs (0.4) (1.5) Elders Mark to Market Project Advisory Costs (0.3) - Total Non Recurring Items before Tax (2.1) (3.1) Tax on Non-Recurring Items Total Non Recurring Items after Tax (1.8) (2.6) Underlying NPAT to Shareholders
6 Long-term Growth Trend Performance Overview $m 2,000 1,600 1, Revenue ($mil) & Total Transaction Turnover ($bn) ,003 CAGR 8.2% 1,136 $b Underlying EBIT ($mil) & Return on Capital Employed (%) CAGR 13.5% 19% % % % 0 A2006 A2007 A2008 A2009 A2010 A2011 A2012 Sales Revenue Transaction Turnover A2006 A2007 A2008 A2009 A2010 A2011 A2012 Underlying EBIT Underlying ROCE 3% Underlying NPAT ($mil) & Return on Equity (%) CAGR 12.7% A2006 A2007 A2008 A2009 A2010 A2011 A % 13% 11% 9% 7% 5% 3% 6 Underlying NPAT Underlying ROE

7 Underlying NPAT Performance Overview 7


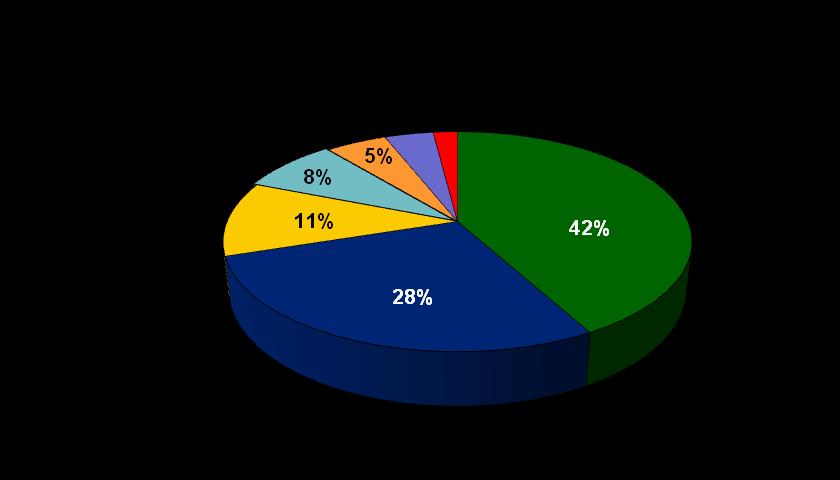
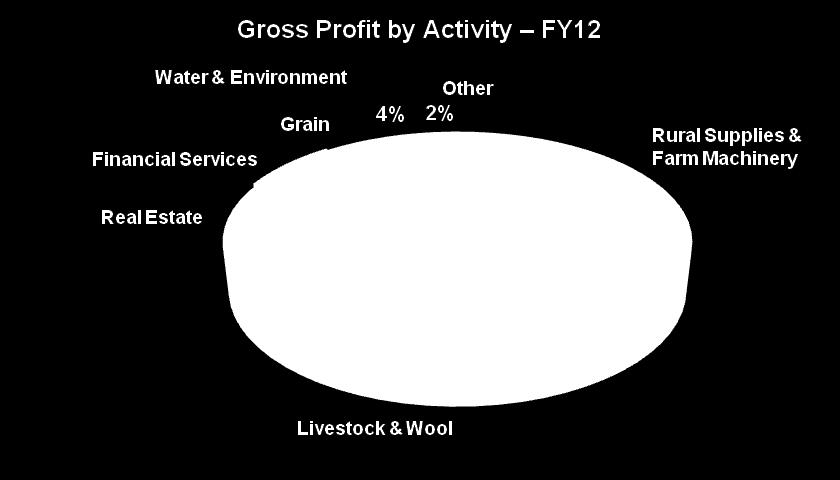
8 Gross Profit up 6.8% Activity Performance Pre- Intercompany sales eliminations 8


9 Commodity Prices & Conditions Activity Performance Seasonal conditions Rainfall deciles 1 October March 2012 Rainfall deciles 1 April September 2012 Highly variable seasonal conditions throughout the year with dry conditions in the second half softening cropping and animal health spend. 9

10 Commodity Prices & Conditions Activity Performance Commodities Source: Meat & Livestock Aust 10 Source: AWEX Source: Agfarm
11 Capital Management Capital Management (as at 30 Sep 12) Financial Gearing 26.4% 120 Net Debt ($m) & Gearing (%) 89.0% 100% - Elders investment contributed 7.2% to measure. - Net debt $45.4m, up from $15.7m as at 30 Sep 11 (business acquisitions represent $13.0m of the movement). Interest cover ratio of 7.5 times within covenants times as at 30 Sep % 68.3% 33.8% 26.3% 9.4% 26.4% 80% 60% 40% 20% Working capital utilisation - Operating cash Inflow $15.4m down on prior year $53.7m with inventories increase reflecting rural supplies acquisitions,greenfield outlets and drier conditions affecting stock turns. - Working capital increased by $12.1m on a pcp basis. - Investing activities comprise: $ 5.5m Depreciating fixed assets (capex) $14.3m Acquisition & other investment capital $12.7m Elders investment (incl Project costs) $32.5m Total ($18.7m prior year) EPS & Dividend - EPS of 25.5 cents (2011: 27.2 cents prior year) - Final dividend of 10.0 cents per share fully franked (2011: 9.0 cents) - The dividend reinvestment plan will not apply A2006 A2007 A2008 A2009 A2010 A2011 A2012 Net Debt Gearing % Capex. Depn & Amort A2007 A2008 A2009 A2010 A2011 A2012 Capital Expenditure Spend Depreciation and Amortisation 0% 11
12 Cash Flow Capital Management Sep 2012 $m Sep 2011 $m Net operating cash flow Net capital spend (5.5) (4.3) Free cash flow Payment for share in subsidiaries (14.4) (14.4) Purchase of investments (12.7) - Proceeds from sale of assets Dividends paid (15.3) (12.5) Working capital movement (29.2) 33.2 Proceeds from (repayment of) borrowings 16.1 (2.4) Net cash movement (13.1) 30.8 * * Net Debt (45.4) (15.7) * FY11 comparative include re-classification of $0.7m contingent goodwill from Operating to Investing segment within the Statement of Cash Flows 12
13 Net Debt Capital Management Sep 2012 $m Sep 2011 $m Cash Current Borrowings * (70.4) (60.1) Non-Current Borrowings ** (27.7) (23.3) Net Debt (45.4) (15.7) * Current Borrowings include $66.1m of unsecured deposits (Sep 11 $54.1m) ** Non-Current Borrowings mature 28 Feb 2015 Bank Facilities as at 30 Sep 2012 Facilities Drawn Facilities Limit Facilities Available Key Metrics Gearing 26.4% 9.4% Interest Cover *** 7.5 times 7.6 times *** Net profit before interest, tax, depreciation & amortisation / Total interest expense 13
14 Balance Sheet Capital Management Sep 2012 $m Sep 2011 $m Trade Receivables Inventory Trade Payables (314.1) (307.4) Working Capital Property, Plant & Equipment Intangibles Net Debt (45.4) (15.7) Investments & Other Items 6.8 (13.4) Shareholders Equity Gearing 26.4% 9.4% ROE 8.9% 9.7% 14

15 Strategy Strategy Update Focus on our core strategies remains strong Broaden the company s operating platform geographically by partnering with quality regional businesses and people on a majority equity basis. Add product / activity portfolio throughout expanded operating platform. ELDERS Capture the benefits of one back office, providing scale benefits to our regional businesses and actively manage our portfolio of assets. Significantly contribute to our local communities within which we operate. Underpin these strategies by fostering in our people a culture of innovation, customer focus and operational excellence throughout the Group characteristics inherent with independent, local businesses 15
16 Elders investment Strategy Update Strategic investment made by Ruralco in June 2012 (current stake 12.04%). Supportive of decision to sell Automotive (announced August) to create a pure-play Rural Services business. Recent announcement of Rural Services sale has created considerable uncertainty for all stakeholders. We are concerned over the poor result for shareholder value this process will generate. Ruralco continues to monitor situation and reserves position on participation in sale process, currently no clear understanding of process or timing. Participation would only be considered where clearly value accretive to Ruralco shareholders. Ruralco expects to benefit under either outcome. 16


")

17 Platform Growth Strategy Update Key contributors to Footprint growth EBIT - FY12 (Full year contribution) Footprint growth FY12 Acquisition outlets 19 Greenfield outlets 3 Total 22 17

18 Sector Expansion Strategy Update Grain Marketing - Grain throughput up 43% to 3.0m tonnes lead by the Advantage managed pool products increasing 600kt compared to prior year. - Agfarm continues to drive innovation with its expanding suite of grain marketing product options and blend of personal and web engagement with its client base. - Dedicated grain accumulation teams added into newer geographic markets. - Launch of freight broking business with throughput of 250kt. 18
.")
19 Sector Expansion Strategy Update Water & Environment - Traded water up 13% despite generally full catchments through the lower Murray Darling Basin. - Waternet successfully tendered to market 17,000 meg parcel of permanent entitlement (10,000 meg sold to date to commercial irrigators). - Developed ProWater Nationwide to bring together our irrigation and water product segment sales specialists under common brand and strategy now one of the largest water groups nationally. - On-farm irrigation solutions business up 20% on prior year led by Archards Irrigation and Roberts Irrigation. Source: Waternet 19
 in FY12 driven by targeted appointments of insurance specialists into the network.")


20 Sector Expansion Strategy Update Financial Services - CGU and NAS alliances grew insurance premium by 32% (+$4.6m) in FY12 driven by targeted appointments of insurance specialists into the network. - Term and seasonal finance book (off-balance sheet) passed $230m as at September 12, with 130% growth achieved on prior year. - Ruralco Finance broking business now achieving scale benefits and lifted EBIT 153% on prior year. - NAB Ruralcard approved limits increased 47% on prior year with on-balance sheet lending continuing to run-off. Soft Commodities - Ag Concepts joint venture gaining strong traction in its wool forward contracting product, which is one of the few of its kind backed by a transparent trading platform. EBIT up 317% on pcp. 20
21 Capturing the benefits of one back office & active portfolio asset management Strategy Update Consolidation momentum now building with benefit of IT platform capacity investment: SAP major server upgrade completed as key enabler for bulk store migrations. Planned SAP migrations completed across Queensland business units. Additional 23 outlets in WA scheduled for 1Q13 and 9 outlets in Victoria for 2Q13. Conversion of these sites will result in 90% of the Group being converted to the common platform. Livestock sales migration to common platform completed for 5 business units. Centralised payables processing continued to absorb additional business units in FY12 and SAP integrations will see further consolidation 1H13. Ruralco s Perth hub absorbed Farmworks back-office in July. Monds & Affleck sale completed which continues strong momentum on non-core business divestments Tasmanian freehold properties recently re-valued and rationalisation efforts continue on non-core assets in order to release capital. 21


22 Our People and Our Communities Strategy Update Our People - Safety at Ruralco continues to be our first priority. Continuous review of safety processes, including monitoring any near miss and medical treatment injuries, contributed to the LTIFR reaching historic lows. - Incentive Program and General Employee Share Scheme closely linked to key deliverables. - Leadership development program via Diploma Study Assistance. Our Communities 22 At the heart of Ruralco s culture is a commitment to giving back to the communities that support our businesses. In excess of $1.6 million in assistance to local community groups through the whole Ruralco family Over $108,000 donated to Ronald McDonald House Charities from funds raised during the Ride for Rural Kids charity bike ride $15,000 donated to Autism Awareness Australia from the proceeds of an auction of a specially commissioned portrait of Ruralco Ambassador, Lee Kernaghan, at Beef Australia $30,000 raised by Ruralco staff in support of the MS Society at the 24 hour MS Mega Swim Ride for Rural Kids bike ride Oct 2011 Ruralco Reefers Mega-Swim for MS
23 Summary & Outlook Rural Supplies and Sector activities delivered important revenue growth and evidence key strategies being executed well. Productivity improvements in the commission sensitive businesses still a work in progress and will be a focus in FY13. High grain prices should provide an injection of liquidity into cropping enterprise cash flows, with Ruralco well-placed to benefit from upside in general confidence levels and spend capacity. Lower store sheep and cattle prices have the potential to stimulate livestock fattening activity, although customers will remain cautious pending evidence of adequate rainfall and stabilised market prices. Balance sheet continues to be strongly positioned to execute growth strategies. Back-office initiatives approaching key milestone events. Targeted footprint and people investment remain a priority through FY13. 23
24 Disclaimer This presentation may contain forward-looking statements with respect to Ruralco's business and operations, market conditions, results of operations and financial condition, capital adequacy and risk management practices. Readers are cautioned not to place undue reliance on any forward-looking statements. Actual results or performance could be significantly different from those expressed in, or implied by, any forward-looking statements. Forward-looking statements are not guarantees of future performance and involve known and unknown risks, uncertainties and other factors, many of which are beyond the control of Ruralco. Ruralco does not undertake to publicly release the result of any revisions to these forward-looking statements to reflect any change in expectations, assumptions or circumstances after the date of this presentation. The information contained in this presentation is given in summary form and does not purport to be complete. It is not financial product advice and does not take into account the investment objectives, financial situation or particular needs of individual investors. These should be considered, with or without professional advice, before deciding if an investment is appropriate. This presentation is not an offer, invitation, solicitation or recommendation with respect to the subscription for, purchase or sale of any security and neither this presentation nor anything in it shall form the basis for any contract or commitment whatsoever. The distribution of this presentation in jurisdictions outside Australia may be restricted by law and you should observe such restrictions. The securities have not been, and will not, be registered under the Securities Act, or the securities laws of any state of the U.S. or other jurisdiction and the securities may not be offered or sold within the U.S. or to, or for the account or benefit of, U.S. persons (as defined in Regulation S under the Securities Act). 24
OneVue Holdings Limited (OVH)
") OneVue Holdings Limited (OVH) H1 FY 2018 results presentation 26 February 2018 1 HIGHLIGHTS 2 FINANCIALS 3 OUTLOOK 4 APPENDICES Page 2 1 HIGHLIGHTS . BENEFITTING FROM SECTORAL GROWTH AND STRUCTURAL DISRUPTION
OneVue Holdings Limited (OVH) H1 FY 2018 results presentation 26 February 2018 1 HIGHLIGHTS 2 FINANCIALS 3 OUTLOOK 4 APPENDICES Page 2 1 HIGHLIGHTS . BENEFITTING FROM SECTORAL GROWTH AND STRUCTURAL DISRUPTION
2011 Interim Results. Keith Gordon, Managing Director & Chief Executive Officer Stephen Gobby, Chief Financial Officer
 2011 Interim Results Keith Gordon, Managing Director & Chief Executive Officer Stephen Gobby, Chief Financial Officer Emeco 2011 Interim Results Overview Financials Strategy & Outlook Questions Appendices
AUB GROUP LTD FULL YEAR RESULTS
 AUB GROUP LTD FULL YEAR RESULTS FOR THE PERIOD ENDED 30 JUNE 207 (FY7) 28 TH AUGUST 207 Page - AUB Group Ltd FY7 Results NOTICE SUMMARY INFORMATION This document has been prepared by AUB Group Limited
HALF YEAR 2018 RESULTS WE RE HERE FOR AUSTRALIAN FARMERS TM
 HALF YEAR 2018 RESULTS WE RE HERE FOR AUSTRALIAN FARMERS TM CONTENTS 1H18 Highlights & Strategy Update 3 Financial Performance 8 Divisional Performance 16 Outlook 21 Appendices 23 2 [PLACEHOLDER PICTURE]
FULL YEAR RESULTS WE RE HERE FOR AUSTRALIAN FARMERS TM
 FULL YEAR RESULTS 2017 WE RE HERE FOR AUSTRALIAN FARMERS TM Pg. FY17 Highlights and Strategy Update 3 Financial Overview 6 Balance Sheet, Cash Flow & Funding 9 Review by Segment 14 Outlook 22 Appendices
For personal use only
 HY14 Results 15 May 2014 Disclaimer This presentation includes both information that is historical in character and information that consists of forward looking statements. Forward looking statements are
For personal use only
 FY16 FULL YEAR RESULTS REVIEW Agenda GROUP RESULTS OVERVIEW BUSINESS UNIT REVIEW OUTLOOK Eastlands Shopping Centre BSA completed the mechanical services upgrade and extension to one 29/08/2016 BSA Limited
Affinity Education Group. Half Year Results
 Affinity Education Group Half Year Results 29 August 2014 Disclaimer This presentation contains general information in summary form which is current as at 29 August 2014. It presents financial information
For personal use only
 ASX Release 17 November 2015 Ruralco Holdings Ltd 2014/15 Full Year Results Results Summary Sales revenue of $1.6 billion, an 18% increase on the pcp (FY14: $1.4 billion) Gross profit of $307.0 million,
Annual General Meeting
 Annual General Meeting Agenda Chairman s Address MD & CEO Presentation - Highlights - Financial overview - Strategy Update - Market Update - Equity Raise Business of the Meeting Meeting Opening and Chairman
For personal use only. F Y R e s u l t s P r e s e n t a t i o n
 F Y 2 0 1 6 R e s u l t s P r e s e n t a t i o n Our Brands 2 Disclaimer The material in this presentation has been prepared by Bapcor Limited ( Bapcor ) ABN 80 153 199 912 and is general background information
FY 2018 results presentation
 FY 2018 results presentation EMERGING FINANCIAL SERVICES COMPANY STRONGLY LEVERAGED TO SUPERANNUATION SECTOR, DELIVERS RECORD GROWTH OneVue Holdings Limited (OVH) 27 August 2018 1 HIGHLIGHTS Market leading
FIRST HALF FINANCIAL YEAR 2018 RESULTS PRESENTATION
 FIRST HALF FINANCIAL YEAR 2018 RESULTS PRESENTATION 15 February 2018 Steve Gostlow, Managing Director 2 Our corporate ideals are based on safety, reliability and sustainability. 1H18 - Highlights Safety
2017 Results Presentation.
 2017 Results Presentation www.moelisaustralia.com 20 February 2018 Moelis Australia Overview Moelis Australia is a leading diversified financial services group incorporating Corporate Advisory, Equities
FY12 Results 22 May 2012
 FY12 Results 22 May 2012 DISCLAIMER --- Important Notice This presentation has been prepared by Thorn Group Limited (Thorn). This presentation is not a financial product or investment advice or recommendation,
For personal use only
 August 2011 Page 2 Highlights FY11 A year of consolidation, consistent delivery and ongoing, profitable, organic growth: Consolidated NPAT of $43.5m (normalised growth of +56%). Normalised (1) Basic EPS
LIFE STARTS HERE. FY18 Full Year Results Presentation. 27 August 2018
 LIFE STARTS HERE FY18 Full Year Results Presentation 27 August 2018 Disclaimer The presentation has been prepared by Monash IVF Group Limited (ACN 169 302 309) ( MVF ) (including its subsidiaries, affiliates
Business Update. USPP Conference Miami. Luis Damasceno Group CFO Michael Williams Group Finance Director & Treasurer January 2019
 Business Update USPP Conference Miami Luis Damasceno Group CFO Michael Williams Group Finance Director & Treasurer 23-25 January 2019 www.alsglobal.com IMPORTANT NOTICE AND DISCLAIMER This presentation
Capital raising. May Doug Rathbone Managing Director and Chief Executive Officer. Kevin Martin Chief Financial Officer
 May 15 2009 Capital raising Doug Rathbone Managing Director and Chief Executive Officer Kevin Martin Chief Financial Officer Robert Reis Group GM - Corporate Strategy & External Affairs Important information
FINANCIAL RESULTS PRESENTATION FY2018
 Virtus Health (ASX:VRT) FINANCIAL RESULTS PRESENTATION FY2018 Tuesday 21 August, 2018 AEST DISCLAIMER The material in this presentation has been prepared by Virtus Health Limited ABN 80 129 643 492 ( Virtus
2017 Full Year Results. Tuesday 21 November 2017
 2017 Full Year Results Tuesday 21 November 2017 Disclaimer Certain information included in the following presentation is forward looking and involves risks, assumptions and uncertainties that could cause
Monash IVF Group. FY16 Results Presentation 26 August 2016
 Monash IVF Group FY16 Results Presentation 26 August 2016 Disclaimer The presentation has been prepared by Monash IVF Group Limited (ACN 169 302 309) ( MVF ) (including its subsidiaries, affiliates and
Select Harvests Limited ( SHV )
") Select Harvests Limited ( SHV ) 2016 Annual General Meeting Growing Together 25 November 2016 Disclaimer & Basis of Preparation This presentation is provided for information purposes only and has been
Select Harvests Limited ( SHV ) 2016 Annual General Meeting Growing Together 25 November 2016 Disclaimer & Basis of Preparation This presentation is provided for information purposes only and has been
For personal use only
 11 May 2017 The Manager Company Announcements Office ASX Limited 20 Bridge Street SYDNEY NSW 2000 GRAINCORP LIMITED: GNC INVESTOR PRESENTATION FINANCIAL HALF YEAR ENDED 31 MARCH 2017 Please find attached
OneVue Holdings Limited (OVH)
") OneVue Holdings Limited (OVH) FY 2017 results presentation 28 August 2017 Regulators, fund managers and investors are calling for greater transparency of platform costs and revenue drivers Platform differentiation
OneVue Holdings Limited (OVH) FY 2017 results presentation 28 August 2017 Regulators, fund managers and investors are calling for greater transparency of platform costs and revenue drivers Platform differentiation
FINANCIAL RESULTS PRESENTATION H1FY18
 Virtus Health (ASX:VRT) FINANCIAL RESULTS PRESENTATION H1FY18 Tuesday 20 th February, 2018 9.15am AEDT DISCLAIMER The material in this presentation has been prepared by Virtus Health Limited ABN 80 129
For personal use only
 Affinity Education Group (ASX:AFJ) Morgans Conference 10 October 2014 Disclaimer This presentation contains general information in summary form which is current as at 10 October 2014. It presents financial
2016 Half Year Results
 2016 Half Year Results Agenda 1 Half year highlights 2 Financial overview 3 Balance sheet, Cash flow and Capital management 4 Review by activity 5 Strategy update 6 Outlook Half year highlights Half year
Transpacific FY15 Half Year Results Presentation
 Transpacific FY15 Half Year Results Presentation Robert Boucher CEO Brendan Gill CFO 20 February 2015 - Disclaimer Forward looking statements - This presentation contains certain forward-looking statements,
Investor Presentation
 Investor Presentation Full Year Results FY2018 Raj Naran, Managing Director and CEO, ALS Limited 28 May 2018 www.alsglobal.com IMPORTANT NOTICE AND DISCLAIMER This presentation has been prepared by ALS
AUSTRALIAN PHARMACEUTICAL INDUSTRIES LIMITED HALF YEAR FY14 RESULTS PRESENTATION WEDNESDAY 30 APRIL 2014
 AUSTRALIAN PHARMACEUTICAL INDUSTRIES LIMITED HALF YEAR FY14 RESULTS PRESENTATION WEDNESDAY 30 APRIL 2014 Important Notice The material in this presentation is of general information about API s activities
For personal use only
 FY15 FULL YEAR RESULTS REVIEW Progressing to plan Agenda GROUP RESULTS OVERVIEW BUSINESS UNIT REVIEW OUTLOOK 150 Collins Street, Westpac Building. Mechanical work was completed by Allstaff Airconditioning
25 February The Manager Market Announcements Australian Securities Exchange Limited 20 Bridge Street SYDNEY NSW 2000.
 Level 1 157 Grenfell Street Adelaide SA 5000 GPO Box 2155 Adelaide SA 5001 Adelaide Brighton Ltd ACN 007 596 018 Telephone (08) 8223 8000 International +618 8223 8000 Facsimile (08) 8215 0030 www.adbri.com.au
For personal use only
 ACN 072 507 147 ASX & MEDIA RELEASE 25 May 2017 THORN FY17 KEY NUMBERS UP, ISSUES BEING ADDRESSED Consumer leasing and business finance company, Thorn Group Limited (ASX: TGA), has lifted revenue, EBIT
FY2018 Results Presentation
 FY2018 Results Presentation Disclaimer The material in this presentation has been prepared by Bapcor Limited ( Bapcor ) ABN 80 153 199 912 and is general background information about Bapcor s activities
For personal use only. Investor Update. January
 1 Investor Update January 2019 www.aspermont.com The leading media services provider to the global resources industry 2 Aspermont is ASX listed with offices in Australia, UK, Brazil, North America and
INVESTOR PRESENTATION SG FLEET GROUP LIMITED - FY2016 RESULTS
 INVESTOR PRESENTATION SG FLEET GROUP LIMITED - FY2016 RESULTS 16 August 2016 Important Notice and Disclaimer IMPORTANT INFORMATION The information in this presentation is general in nature and does not
FY 2018 Full Year Results Investor Presentation. 27 th August 2018
 FY 2018 Full Year Results Investor Presentation 27 th August 2018 Corporate Overview Cash Converters is a leading international operator and franchisor in personal financial services and second hand goods
Macquarie Securities Western Australia Forum. 15 October 2014
 Macquarie Securities Western Australia Forum 15 October 2014 Disclaimer Summary information This presentation contains summary information of TOX Solutions Limited ( TOX ) and is dated 15 October 2014.
2008 Annual Results Briefing. 21 August 2008
 2008 Annual Results Briefing 21 August 2008 Presentation Outline Group Performance Highlights Richard Goyder Home Improvement & Office Supplies John Gillam Coles Ian McLeod Resources Stewart Butel Other
FY Alliance Aviation Services Limited Results Presentation. August 2018
 FY 2018 Alliance Aviation Services Limited Results Presentation August 2018 Key Messages Alliance Aviation Services Limited announces a full year result which includes: $ 26.1m A strong financial performance
For personal use only
 DWS Limited 2017 Half Year Results Presentation Contents Introduction Danny Wallis (CEO) / Stuart Whipp (CFO) Results Highlights Half Year Results Summary Review Capital Management Operations Update Summary
Cleanaway Waste Management Limited
 Cleanaway Waste Management Limited Australia s leading total waste management services company FY16 Results Presentation For the twelve months ended 30 June 2016 19 August 2016 Vik Bansal CEO and Managing
Interim FY 2015 results 6 months ended 31 December February 2015
 Interim FY 2015 results 31 December 2014 18 February 2015 Highlights Solid trading result for 1H FY2015; change in accounting policy for acquisition of healthcare practices First half result highlights
Select Harvests Limited ( SHV )
") Select Harvests Limited ( SHV ) Half Year ending 31 December 2015 - Results Presentation 25 February 2016 Disclaimer & Basis of Preparation This presentation is provided for information purposes only and
Select Harvests Limited ( SHV ) Half Year ending 31 December 2015 - Results Presentation 25 February 2016 Disclaimer & Basis of Preparation This presentation is provided for information purposes only and
AUB GROUP LTD HALF YEAR RESULTS
 AUB GROUP LTD HALF YEAR RESULTS FOR THE PERIOD ENDED 31 DECEMBER 2017 (1H18) 26 FEBRUARY 2018 Page 1 - AUB Group Ltd 1H18 Results NOTICE SUMMARY INFORMATION This document has been prepared by AUB Group
2015 Annual General Meeting. October2015
 2015 Annual General Meeting October2015 FY15 Results Significant restructuring and capital management to support profit recovery in FY16. Statutory EBIT loss of $33.2m Statutory NPAT loss of $36.9m Trading
OneVue Holdings Limited (OVH)
") OneVue Holdings Limited (OVH) Morgan Stanley Emerging Companies Conference Thursday 7 June 2018 A FINTECH COMPANY THAT PARTNERS TO DISRUPT ALONG THE SUPERANNUATION VALUE CHAIN Market leading businesses,
OneVue Holdings Limited (OVH) Morgan Stanley Emerging Companies Conference Thursday 7 June 2018 A FINTECH COMPANY THAT PARTNERS TO DISRUPT ALONG THE SUPERANNUATION VALUE CHAIN Market leading businesses,
1H18 Results Presentation Sid Takla Interim Chief Executive Officer Lyndal York Chief Financial Officer
 1H18 Results Presentation Sid Takla Interim Chief Executive Officer Lyndal York Chief Financial Officer 21 August 2018 Important Notice and Disclaimer This presentation has been prepared by Asaleo Care
For personal use only
 NATIONAL STORAGE REIT JP MORGAN AUSTRALIAN REIT FORUM ASIA MARCH 2017 IMPORTANT NOTE & DISCLAIMER This presentation has been prepared by National Storage REIT ( NSR ) comprising National and may involve
For personal use only. FY17 AGM Presentation
 FY17 AGM Presentation 22 November 2017 1 Agenda Chairman s Address Items of Business 2 Murray River Organics is a leading Australian producer, manufacturer, packer and seller of organic, natural and better-for-you
Interim Results Presentation
 Interim Results Presentation Half Year 31 December 2015 Released 15 February 2016 Scott McMillan, Managing Director Lee Schofield, Chief Executive Officer Matt Dyer, Chief Financial Officer Key Messages
AUB GROUP LTD FULL YEAR RESULTS FOR THE PERIOD ENDED 30 JUNE 2018 (FY18) 27 AUGUST 2018
 27 AUGUST 2018") AUB GROUP LTD FULL YEAR RESULTS FOR THE PERIOD ENDED 30 JUNE 2018 (FY18) 27 AUGUST 2018 NOTICE SUMMARY INFORMATION This document has been prepared by AUB Group Limited(ABN 60 000 000 715)(AUB). It is a
AUB GROUP LTD FULL YEAR RESULTS FOR THE PERIOD ENDED 30 JUNE 2018 (FY18) 27 AUGUST 2018 NOTICE SUMMARY INFORMATION This document has been prepared by AUB Group Limited(ABN 60 000 000 715)(AUB). It is a
FOR THE HALF-YEAR ENDED 28 FEBRUARY Bank of Queensland Limited ABN AFSL No
 FOR THE HALF-YEAR ENDED 28 FEBRUARY 2017 Bank of Queensland Limited ABN 32 009 656 740. AFSL No 244616. JON SUTTON Managing Director & CEO ANTHONY ROSE Chief Financial Officer JON SUTTON Managing Director
FY18 Results Presentation 31 July Thomas Beregi, CEO Michael Eadie, CFO
 FY18 Results Presentation 31 July 2018 Thomas Beregi, CEO Michael Eadie, CFO Leadership in the credit impaired consumer segment ANALYTICS & DISCIPLINE OPERATIONAL EXCELLENCE SUSTAINABILITY & COMPLIANCE
Acquisition of European herbicide product portfolio from FMC
 Acquisition of European herbicide product portfolio from FMC 8 November 2017 Important notice and disclaimer This presentation has been prepared by Nufarm Limited ACN 091 2 12 ( Nufarm" or the "Company").
For personal use only. Investor Presentation November 2012
 Investor Presentation November 2012 Page 2 Cash Converters Overview 28 Years in Business. Deep, experienced management team. MD, Peter Cumins joined in 1990 Network of 708 stores across 18 countries. 106
FY2015. For personal use only. Full Year Results
 2015 For personal use only Full Year Results Create Build Operate Global Minerals Message from the Board & Executive GROUP Group PERFORMANCE Performance Our NPAT for 2015 is a solid performance and testament
Sigma Pharmaceuticals Limited
 Investor Relations Contact: Gary Woodford Corporate Affairs Manager Gary.Woodford@signet.com.au Phone: 03 9215 9632 Mobile: 0417 399 204 Mark Hooper CEO and Managing Director Gary Woodford Corporate Affairs
asx/media release ALS result up 18% as commodities recovery continues
 asx/media release 20 November 2017 ALS result up 18% as commodities recovery continues H1FY18 Underlying NPAT 1 within guidance at $70.1 million Goodwill impairment charges of $63 million Asset Care business
VIRTUS HEALTH (ASX: VRT) FINANCIAL RESULTS PRESENTATION FY2017
 FINANCIAL RESULTS PRESENTATION FY2017") VIRTUS HEALTH (ASX: VRT) FINANCIAL RESULTS PRESENTATION FY2017 Tuesday 22 nd August, 2017 AEST DISCLAIMER The material in this presentation has been prepared by Virtus Health Limited ABN 80 129 643 492
VIRTUS HEALTH (ASX: VRT) FINANCIAL RESULTS PRESENTATION FY2017 Tuesday 22 nd August, 2017 AEST DISCLAIMER The material in this presentation has been prepared by Virtus Health Limited ABN 80 129 643 492
1H 19 Investor Presentation February 2019
 1H 19 Investor Presentation February 2019 1 About Raiz Raiz (formerly Acorns) is a mobile first micro-investing platform via mobile phone or web app, which allows customers to invest in a portfolio of
For personal use only. FY2017 Results Presentation
 FY2017 Results Presentation Disclaimer The material in this presentation has been prepared by Bapcor Limited ( Bapcor ) ABN 80 153 199 912 and is general background information about Bapcor s activities
For personal use only. JB Hi-Fi Limited. HY17 Results Presentation
 JB Hi-Fi Limited HY7 Results Presentation 3 5 FEBRUARY AUGUST 06 07 PAGE Agenda. Group Performance Overview. JB HI-FI 3. The Good Guys 4. Stores 5. Group Balance Sheet and Cash Flow 6. Outlook Richard
YEAR END RESULTS 31 MARCH Russell Down, Chief Executive Chris Morgan, Group Finance Director
 YEAR END RESULTS 31 MARCH 2018 Russell Down, Chief Executive Chris Morgan, Group Finance Director Customer service strategy improving performance Revenue (excluding disposals) 371.6m 6.4% FY17: 349.1m
Photo by James Ball - Coffey International Limited FY2013 Half Year Results Presentation. 11 February 2013
 Photo by James Ball - www.dlscape.com Coffey International Limited FY2013 Half Year Results Presentation 11 February 2013 Agenda Financial Performance Business Performance Outlook Presenters John Douglas
2017/18 Half Year Results De La Rue plc 21 November 2017
 2017/18 Half Year Results De La Rue plc 21 November 2017 Page 1 Agenda Overview Martin Sutherland Financial performance Jitesh Sodha Strategic update Martin Sutherland Operational review Martin Sutherland
MotorCycle Holdings (MTO) New HOLD: Harley still lacking traction. Key points. Risks and catalysts
 New HOLD: Harley still lacking traction. Key points. Risks and catalysts") Date Theme Company Update Company MotorCycle Holdings (MTO) New HOLD: Harley still lacking traction We moderate to HOLD (from Buy) with a revised target of $2.36 p/share. We were previously encouraged
Date Theme Company Update Company MotorCycle Holdings (MTO) New HOLD: Harley still lacking traction We moderate to HOLD (from Buy) with a revised target of $2.36 p/share. We were previously encouraged
For personal use only. JB Hi-Fi Limited. HY18 Results Presentation
 JB Hi-Fi Limited HY8 Results Presentation 5 FEBRUARY AUGUST 06 08 PAGE Agenda. Group Performance Overview. JB HI-FI 3. The Good Guys 4. Group Balance Sheet and Cash Flow 5. Outlook Richard Murray Group
OneVue Holdings Limited (OVH)
") OneVue Holdings Limited (OVH) Goldman Sachs Ninth Annual Small and Mid-Cap Conference Tuesday 17 April 2018 . BENEFITTING FROM SECTORAL GROWTH AND STRUCTURAL DISRUPTION Legislated superannuation growth
OneVue Holdings Limited (OVH) Goldman Sachs Ninth Annual Small and Mid-Cap Conference Tuesday 17 April 2018 . BENEFITTING FROM SECTORAL GROWTH AND STRUCTURAL DISRUPTION Legislated superannuation growth
For personal use only. NRW HOLDINGS Macquarie Western Australia Forum 2018
 NRW HOLDINGS Macquarie Western Australia Forum 2018 1 RESULTS OVERVIEW Revenue: $754.3M (1) double the same period last year. EBITDA (2): $93.5M compared to $58.9M in the prior comparative period. Net
Ramsay Health Care Christopher Rex, Managing Director. Australia and New Zealand 7th Annual Investment Conference London 9 March, 2010
 Ramsay Health Care Christopher Rex, Managing Director Australia and New Zealand 7th Annual Investment Conference London 9 March, 2010 DISCLAIMER This Presentation has been prepared by Ramsay Health Care
Half Year Results Presentation 14 February 2012
 Half Year Results Presentation 14 February 2012 Key Highlights 1H12 $8.0m reported profit after tax, up 186% or $5.2m from $2.8m in 1H11. 1H12 $6.9m trading profit after tax, up 36% or $1.8m from $5.1m
For personal use only
 2012 Wilson HTM Rapid Insights Conference Nick Jukes Chief Executive Officer Ian Poole Chief Financial Officer 12 November 2012 Disclaimer 2 The following disclaimer applies to this presentation and any
Interim Results Presentation. For the six months ended 31 December 2018
 Interim Results Presentation For the six months ended 31 December 2018 1 STEEL & TUBE IS One of New Zealand s leading providers of steel solutions, and a proud New Zealand company, with over 65 years of
Tabcorp Holdings Limited 2015/16
 Tabcorp Holdings Limited ABN 66 063 780 709 2015/16 Full Year Results Presentation 4 August 2016 Draft version 15 (01-08-13) FY16 overview Statutory results NPAT $169.7m, down 49.3% EPS 20.4 cents per
 ASX ANNOUNCEMENT DATE: 22 February 2017 Attached is the Presentation regarding Pact s Half year Financial Results for the half year ended 31 December 2016. The Presentation will occur at 10am (Melbourne
HILLS INDUSTRIES LIMITED HALF YEAR RESULTS PRESENTATION 6 Months to 31 December 2009
 HILLS INDUSTRIES LIMITED HALF YEAR RESULTS PRESENTATION 6 Months to 31 December 2009 Graham Twartz, Managing Director Andrew Muir, General Manager Finance FEBRUARY 2010 Headlines Improved net profit in
For personal use only
 23 August 2013 Full Year Results June 2013 We attach an Investor Presentation for the FY13 Full Year Results. As previously announced, a results briefing for analysts will be held at 10:30am Sydney time
Vita Group (VTG)! Results Presentation!
! Results Presentation!") Vita Group (VTG) Results Presentation First half FY14 Group highlights Sustained trend of strong profit, dividend growth Underlying EBITDA 1 +18%, underlying NPAT 2 +56%, dividend +66% Areas of strategic
Vita Group (VTG) Results Presentation First half FY14 Group highlights Sustained trend of strong profit, dividend growth Underlying EBITDA 1 +18%, underlying NPAT 2 +56%, dividend +66% Areas of strategic
30 June 2015 Full Year Results Presentation August 2015
 30 June 2015 Full Year Results Presentation August 2015 FY15 Results Significant restructuring and capital management to support profit recovery in FY16. Statutory EBIT loss of $33.2m Statutory NPAT loss
HALF YEAR RESULTS PRESENTATION
 ASX Announcement 16 February 2016 HALF YEAR RESULTS PRESENTATION Attached is the presentation regarding the financial results of The Star Entertainment Group Limited (The Star Entertainment Group) for
OVERVIEW. Operating cash flow $447.8 million, EBITDA conversion 92.8% Total revenue 1 $7,394 million, down 0.5%
 OVERVIEW Total revenue 1 $7,394 million, down 0.5% Earnings Before Interest and Tax (EBIT) $276.9 million, down 10.6%. Down 1.5% adjusting for $13 million Capital Metro bid costs and $15 million reduction
FY14. Vita Group (VTG) RESULTS PRESENTATION
 RESULTS PRESENTATION") FY14 Vita Group (VTG) RESULTS PRESENTATION GROUP HIGHLIGHTS Strong sustained performance in competitive markets Execution against strategic objectives Continued earnings growth from optimisation program
FY14 Vita Group (VTG) RESULTS PRESENTATION GROUP HIGHLIGHTS Strong sustained performance in competitive markets Execution against strategic objectives Continued earnings growth from optimisation program
Boom Logistics Limited ASX:BOL
 Brenden Mitchell Managing Director and Chief Executive Officer Tim Rogers Chief Financial Officer Tony Spassopoulos Chief Operating Officer Boom Logistics Limited ASX:BOL August 2018 Disclaimer This presentation
FY17 RESULTS. Tuesday 20 February 2018
 FY17 RESULTS Tuesday 20 February 2018 Agenda 2017 Highlights Results 2018 Observations Out-of-Home industry APN Outdoor Contract renewals Focus and objectives Trading update 2 2017 Highlights 3 2017 highlights
For personal use only
 Preliminary Final Report Appendix 4E Results for announcement to the market Pulse Health Limited (ACN 104 113 760) This Preliminary Final Report is provided to the Australian Securities Exchange (ASX)
FY18 RESULTS PRESENTATION
 FY18 RESULTS PRESENTATION KEY PERFORMANCE METRICS FOR FY18 OPERATIONAL FINANCIAL CAPITAL MANAGEMENT STRATEGIC GROWTH 2,257 lots under contract with a value of $616m $49.1m FY18 operating profit after tax
Investor presentation
 FY17 INVESTOR PRESENTATION 1 18 August 2017 Investor presentation FY17 Agenda FY17 INVESTOR PRESENTATION 1. Overview & strategic landscape Melos Sulicich CEO & Managing Director 2. Financial results David
2018 Full Year Results 20 November 2018
 2018 Full Year Results 20 November 2018 Disclaimer Certain information included in the following presentation is forward looking and involves risks, assumptions and uncertainties that could cause actual
SOUTHERN CROSS AUSTEREO H1 FY18 INVESTOR PRESENTATION
 SOUTHERN CROSS AUSTEREO H1 FY18 INVESTOR PRESENTATION 23 February 2018 1 Disclaimer Summary information The material in this presentation has been prepared by Southern Cross Media Group Limited ABN 91
INDEPTH RESEARCH NOTE REA Group Ltd Neutral
 1 INDEPTH RESEARCH NOTE REA Group Ltd Neutral Price: A$72.97 Price Target: A$74.80 ASX: REA 12 February 2018 REA s first half FY18 (1H18) result was underpinned by strong growth in the Australian business
Half year result. 26 August 2016
 2016 Half year result 26 August 2016 Alison Watkins Group Managing Director Martyn Roberts Group Chief Financial Officer Barry O Connell MD Australian Beverages Agenda Group Result Summary Shareholder
Bega Cheese Annual General Meeting
 Bega Cheese Annual General Meeting Barry Irvin Executive Chairman Aidan Coleman CEO Agenda 2016 Annual Report Executive Chairman s Report Chief Executive Officer s Report Questions Approval of Remuneration
HALF YEAR RESULTS 19 FEBRUARY 2016
 HALF YEAR RESULTS 19 FEBRUARY 2016 Overview Market conditions remain challenging - operating environment likely to remain subdued over the near term due to ongoing pressure on commodity prices Continued
ASG GROUP DELIVERS SOLID GROWTH ACROSS ALL KEY FINANCIAL INDICATORS
 ASG GROUP LIMITED ASX ANNOUNCEMENT: H1 RESULTS RELEASE DATE: 28 TH FEBRUARY 2012 ASG GROUP DELIVERS SOLID GROWTH ACROSS ALL KEY FINANCIAL INDICATORS Financial Highlights: Revenue of $76.04 million, an
Financial Results Full year ended 30 June Geoffrey N. Brunsdon, Chairman Rob Larry, Group Chief Financial Officer 23 August 2013
 Financial Results Full year ended 30 June 2013 Geoffrey N. Brunsdon, Chairman Rob Larry, Group Chief Financial Officer 23 August 2013 Disclaimer Cautionary Statements Regarding Forward-Looking Information
CEO Presentation AGM. David Buckingham Managing Director and Chief Executive Officer
 CEO Presentation AGM David Buckingham Managing Director and Chief Executive Officer 15 November 2018 Disclaimer Disclaimer This investor presentation (Presentation) has been prepared by Navitas Limited
Full Year Results Presentation 22 August 2011
 Full Year Results Presentation 22 August 2011 Summary $5.4m trading NPAT profit, a 32% increase on FY10 trading NPAT of $4.1m. $37.7m reported NPAT loss for FY11, including $39.1m one-off impairments and
SEQUENTIAL IMPROVEMENT IN 2010 FY 2017 RESULTS ANNOUNCEMENT. FY 2010 Results Presentation
 SEQUENTIAL IMPROVEMENT IN 2010 FY 2010 Results Presentation 4Q 2017 PERFORMANCE REVIEW 4Q 2017 Results Summary 3 (S$ m) 4Q 2017 Revenue 1,086.5 Profit before taxation 168.0 Income tax expense (25.0) Profit