Further Reflections on Alberta s Capital Spending and Its Finance: Comments on the Dodge Report to the Government of Alberta, October 2015
|
|
|
- Scott Johns
- 5 years ago
- Views:
Transcription
1 Further Reflections on Alberta s Capital Spending and Its Finance: Comments on the Dodge Report to the Government of Alberta, October 2015 by Melville McMillan Professor Emeritus Fellow of the Institute of Public Economics Department of Economics University of Alberta Edmonton December 2015 Acknowledgement: The inputs of Robert Ascah and Lennie Kaplan are greatly appreciated. Neither bear any responsibility for the analysis or opinions presented.
2 Contents Executive Summary Introduction 1 The Dodge Evidence of an Infrastructure Deficiency 2 Reflecting on Further Evidence 2 Further Analysis of the Per Capita and the Percentage of GDP Numbers 2 Is Alberta Different? 8 Some Econometric Explorations 11 Capital Financing: The Long-Run Implications of Debt Financing 12 Conclusion 16 Appendix: Charts from the Dodge Report 18
3 Executive Summary David Dodge, former Governor of the Bank of Canada, submitted a report to the Government of Alberta in October 2015 on provincial capital spending and finance. That report was incorporated into the October budget documents. There are many valuable insights and recommendations in the report. However, a major premise of the report is that Alberta is undersupplied with provincial government sector capital and, so, Dodge recommends that the province should increase its capital stock to the equivalent of 16 per cent of its GDP (a benchmark based on comparison of levels in the other five largest provinces Quebec, Ontario, Manitoba, Saskatchewan and British Columbia). To achieve that benchmark, Dodge s simulations suggest that the province could reasonably borrow to finance much of the additional capital spending required. This paper presents an investigation into whether the 16 per cent benchmark is appropriate and whether the implied debt is moderate. The main findings indicate reasons to be cautious of these specific recommendations. First, while Alberta s provincial capital is relatively low as a percentage of GDP in comparison to the five provinces, it is notably larger (about 21 per cent greater) on a per capita basis. Including municipal government capital magnifies the per capita difference to almost 40 per cent. Second, an examination of characteristics of the Alberta economy indicates that the per cent of GDP versus the per capita anomaly results largely from the exceptionally high level of GDP per person in Alberta relative to other provinces. This feature of the Alberta economy casts doubt on the reliability of inferences about the appropriate level of public capital from interprovincial comparison based on GDP. Levels of provincial capital are found to be determined by household income as much as by GDP. Third, simulations of a largely debt financed expansion of the provincial capital stock in Alberta are deemed by Dodge to result in moderate levels of debt compared to that in other provinces when taken as a percentage of GDP. However, when debt levels are viewed as a percentage of provincial government total revenue, that same level of debt is strikingly large (because government revenue is, relative to GDP, low in Alberta). The debt to GDP ratio appears moderate but, at a level twice the provincial government s annual revenues, it would be large (not moderate) relative to levels in other provinces and be a substantial burden to the Alberta government and to Albertans. These findings indicate that the 16 per cent benchmark recommendation and the potential for debt financing indicated in the Dodge report should be viewed with caution. Provincial capital stock is likely not underprovided (indeed it may be comparatively large), and the potential for debt finance is overstated.
4 Introduction David Dodge, former Governor of the Bank of Canada and now with Bennett Jones LLP, submitted a report to the Government of Alberta advising it on its plans for capital spending and its finance prior to the October 27 th 2015 budget. That report was appended to the Strategic Plan budget document. 1 The Budget and the subsequent pronouncements of the Alberta government indicate that the government has given considerable weight to Dodge s recommendations. Conditioned in large part by the impacts that the collapse of oil prices has imposed on the Alberta economy and the resulting fiscal crisis for the Alberta government, Dodge recommends an enhanced capital spending program to that would largely be debt financed. While the recommendations are directed towards the capital plan over the next four years, those are very much determined by the projections of capital needs and economic conditions to Central to Dodge s advice is his position that Alberta lacks sufficient infrastructure and that the provincial capital stock can be upgraded and sustained by a greater reliance on borrowing and debt. Given the uncertainty of oil prices and provincial resource revenues, Dodge is rightfully cautious about the extent to which the province should follow that path. However, given his lowto-mid oil price scenario (believed to best balance the risks), pursuing a level of provincial capital stock equal to 16 per cent of GDP would lead to net debt stabilizing at 25 per cent of GDP by There are reasons to encourage the Alberta government to reflect further on Dodge s recommendations and their longer term consequences. 2 First, is the argument that Alberta lacks adequate infrastructure -- because its provincial capital stock to GDP ratio is lower than that in other provinces -- appropriate? Second, some figures on per capita capital stock are inaccurate, and so misleading. The correct data undermines the concern that infrastructure has been underprovided in Alberta. Third, the ability to finance the implied level of provincial government debt is overestimated and the debt burden could be considerably more onerous than suggested. The following section of the paper provides a review of the Dodge analysis leading to his recommendations. In the next section the data is examined more fully and questions are raised about the appropriateness of relying upon interprovincial comparisons to GDP. An assessment of the long run debt implications of the (most probable) possible capital finance plan is presented in the third major section. The conclusion completes the paper The recommendations for the short term seem reasonable even if there are some doubts about some of the underlying premises. 1
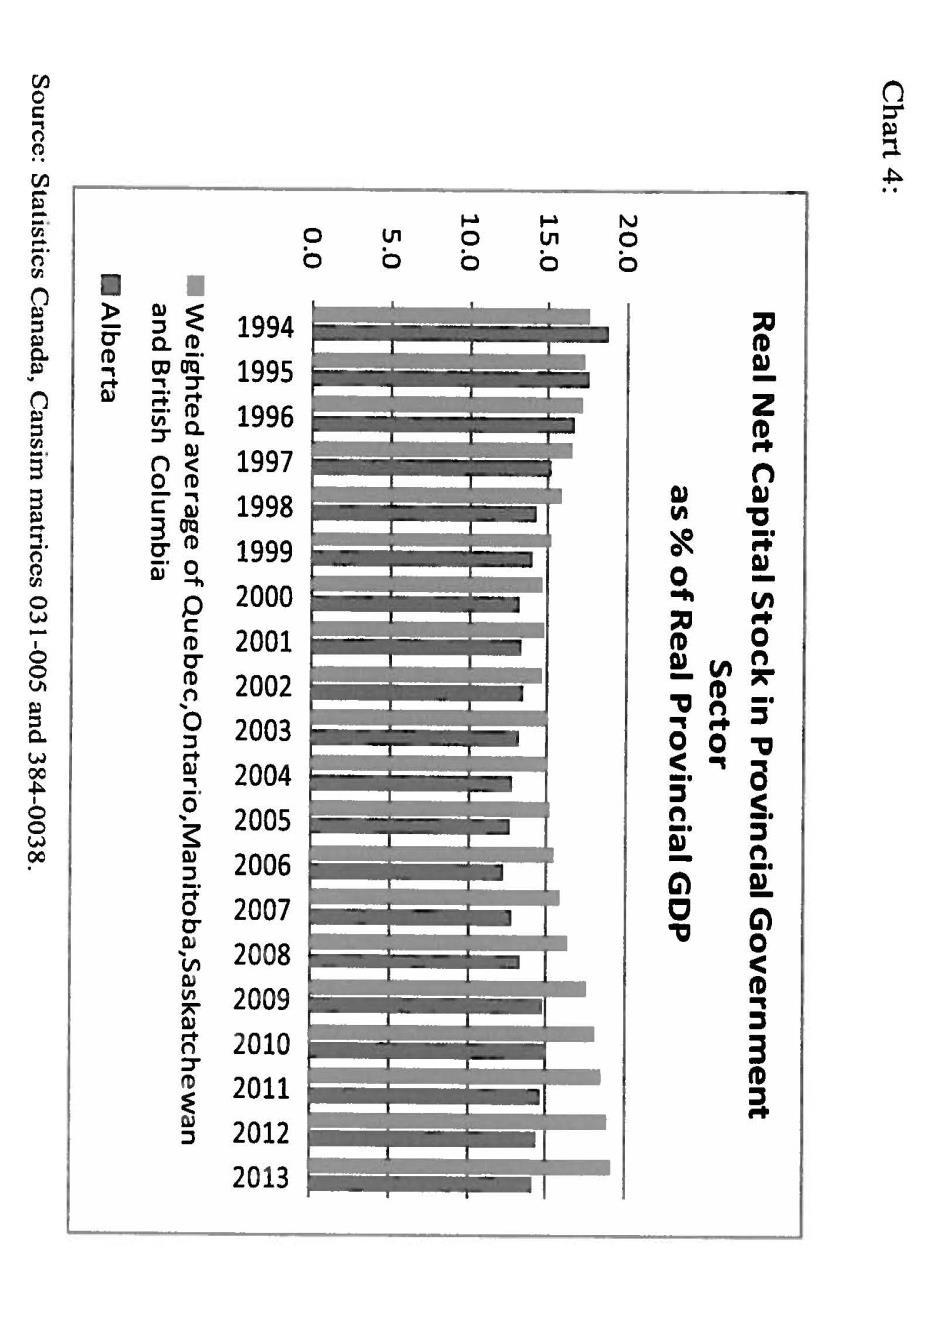
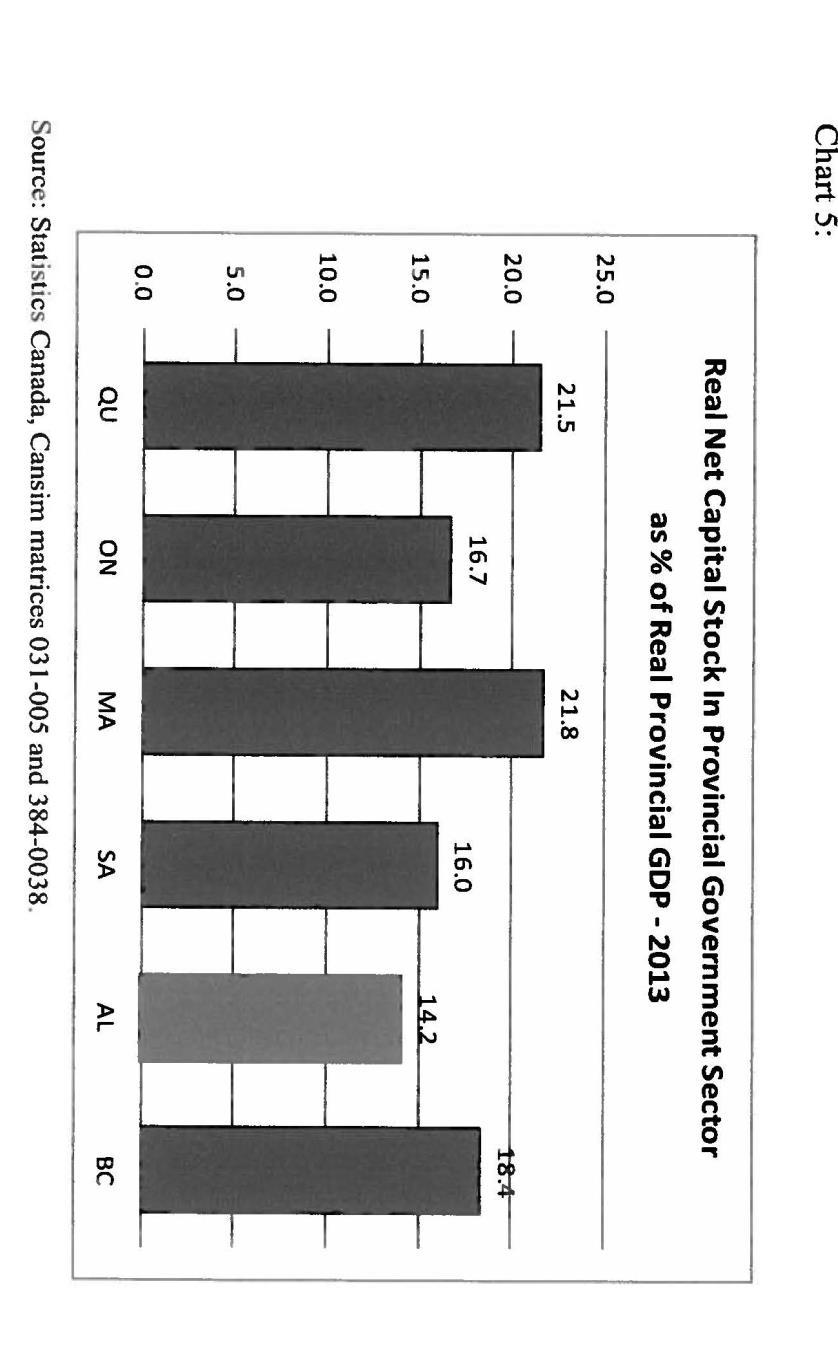
5 The Dodge Evidence of an Infrastructure Deficiency Dodge demonstrates that, relative to GDP, Alberta has a lower level of infrastructure investment and capital stock than in the other five largest provinces. In his Chart 2, Dodge shows that provincial investment as a percentage of provincial GDP has been lower in Alberta than the average of that in Quebec, Ontario, Manitoba, Saskatchewan and British Columbia. 3, 4 Over the 20 years he reports, the average investment was 1.48 per cent of GDP in Alberta while the weighted average in the other five provinces was 1.98 per cent. Chart 4 in the Dodge report examines real net capital stock as a percentage of GDP and demonstrates that the stock in Alberta is low compared to that in the other five provinces. From 1994 to 2013, Alberta averaged 14.3 per cent while the five province average was 15.8 per cent. Furthermore, the Alberta level has deteriorated from an above average position in 1994 and The percentages of real net provincial government sector capital stock in 2013 are reported in Dodge s Chart 5. Alberta s is the lowest at 14.2 per cent while the others range from 16.0 in Saskatchewan to 21.8 per cent in Manitoba. Largely from this analysis, Dodge concludes that public capital has not kept pace with economic activity in the province and he recommends that Alberta aim to realize the long-run five-province benchmark of 16 per cent provincial real capital stock to real GDP, perhaps by To do so will require an expanded level of provincial investment (relative to that proposed in the March budget) so as to reach and to sustain the larger stock of public capital. Reflecting on Further Evidence Three avenues are pursued in the effort to assess the Dodge recommendations. Initially, the per capita data and the percentage of GDP data are examined in more depth. Then, various economic characteristics of the provinces are reviewed to get a sense of whether Alberta is different from the other provinces. Finally, some simple econometric models were used to explore potential determinants of capital stock levels. Each undertaking is reported in turn. Further Analysis of the Per Capita and the Percentage of GDP Numbers One can look at the data on provincial investment and capital stock in other ways. Doing so raises questions as to the appropriateness of relying too heavily on the ratios to GDP. For example, the per person provincial government investment in Alberta has exceeded the (weighted average) of that in the other five provinces (Figure 1) in all but two years from 1990 to 3 Investment is non-residential investment in the provincial government sector. Investment and GDP are measured in real terms (chained 2007 dollars). The average is the weighted average. 4 Charts in the Dodge report that are referred to in this paper are appended. 2
6 Dollars Per Capita Over the 24 years reported here, per capita investment in Alberta averaged $1005 while the average of the five provinces is $783 per person. In addition, per capita investment has exceeded that in any other province in 18 of the 24 years. However, with Alberta s reduced investment in 2012 and 2013, Quebec s per capita investment was slightly larger and that in Manitoba and Saskatchewan were approaching the levels in Alberta. Thus, while Alberta s provincial government sector investment relative to GDP was comparatively low, its investment per person has been relatively large Figure 1. Real Non-Residential Investment in Provincial Government Sector Per Capita AB Source: CANSIM Tables and Prov Av Relatively high levels of per person capital stock are consistent with the comparatively high levels of per capita investment. Figure 2 shows that the per capita provincial capital stock in Alberta has consistently been larger than the five province average. However, the difference has narrowed. In 1990, it was almost twice as large but, by 2013, the difference had gradually declined to about 30 per cent larger. 5 As in the Dodge report, investment and capital are measured in real terms using 2007 dollars and a chained index. 3
7 Dollars Per Capita Figure 2. Provincial Government Net Real Capital Stock Per Capita AB Source: CANSIM Tables & Prov Av. The five province average masks considerable inter-province variation. The real net per capita capital stock of all six provinces in 2013 is reported in Figure 3. While the five province unweighted average is $8799 and the provincial amounts range from $7810 (Ontario) to $9712 (Manitoba), these are all less than the $10,707 level in Alberta. It is clear that, while there is considerable variation in the levels of per capita provincial net capital stock, Alberta still (and despite a diminishing relative level) has the highest level of provincial capital per person. In addition, if Alberta in 2013 had the 16 per cent of GDP level of capital that Dodge recommends, that would amount to $12,192 per capita a level 14 per cent larger than that which was in place and 39 per cent larger than the unweighted average in the five provinces. 6 6 Alberta s October budget increased planned capital spending to beyond the planned levels in the March budget but not fully to the extent recommended in the Dodge report. Dodge recommended a $6.3 billion enhancement but the October budget added $4.5 billion. Hence, Dodge s 16 per cent target is unlikely to be achieved; perhaps reaching 15.5 per cent instead. In addition, Dodge s proposal was backend loaded (larger expenditures in later years) while the budget plan is frontend loaded. 4
8 Figure 3. Provincial Government Sector Real Net Capital Per Capita, AB QU ON MB SK BC Figure 3 parallels Chart 3 in the Dodge report but differs in important ways from the depiction there. While the data are the same for Alberta, Quebec, Ontario and British Columbia, the per capita levels are much lower here for Manitoba and Saskatchewan -- $9712 versus $13,572 in the case of Manitoba and $9080 rather than $13,534 for Saskatchewan. The Dodge analysis mistakenly included municipal government net real capital stock in its Manitoba and Saskatchewan values and over reported the values for those two provinces. 7 The corrected data certainly undermines if not nullifies the Dodge hypothesis that there may be strong economies of scale to public capital (scale as to population). It also weakens the argument that Alberta is undercapitalized in having a low level of provincial government capital per person in comparison to the other provinces. The mistaken inclusion of municipal capital stock in the Dodge report does point to the potential value of also considering municipal government capital; infrastructure that is commonly supported by provincial government transfers. Figure 4 expands Figure 3 to report both municipal capital and provincial capital and indicate their total. There are a number of points to note. Municipal capital adds significantly to the sub-national government public sector capital stock within a province. On average, municipal capital represents approximately onethird of the combined provincial and municipal capital. The municipal share is somewhat smaller in Manitoba (about 28 per cent), somewhat larger in Ontario and British Columbia (37-38 per cent) and notably larger (at 42 per cent) in Alberta. Including municipal capital reduces the 7 This error did not occur in Chart 5 of, or elsewhere in, the Dodge report. 5
9 differences in capital stock per person among the five other provinces. The range is from $12,569 (Ontario) to $13,782 (British Columbia) for a difference of $1213 which is 14 per cent of the unweighted five province average. The difference across the five at the provincial level was $1902 or 22 per cent. It appears that there are some differences among provinces in the municipal-provincial responsibilities for public capital with the result that when taken together, the overall capital stock per person across the five provinces is relatively homogenous. Again, Alberta stands out as having the highest per capita provincial ($10,707), municipal ($7066) and combined ($18,473) capital stock of the six provinces. Indeed, incorporating municipal capital magnifies the extent of the per capita capital stock premium in Alberta. The total of $18,473 is 39 per cent larger than the five province average of $13,291 (compared to 23 per cent larger for the Alberta provincial government capital). As indicated in Figure 5, Alberta has consistently had a larger municipal plus provincial capital stock per person than the five provinces. The relative difference declined until 2007 but has since expanded. That recent growth can largely be attributed to growth in the municipal share in Alberta. There has been a quite steady growth in the municipal share of capital in Alberta; from 29 per cent in 1990 to 42 per cent in The municipal shares have also increased in British Columbia and Saskatchewan since 1990 but they have been relatively constant in Quebec, Ontario and Manitoba. Figure 4. Provincial and Municipal Net Real Capital Stock Per Capita, , ,997 12,569 13,572 13,534 13, AB QU ON MB SK BC Provincial Municipal 6
10 Dollars Per Capita Figure 5. Provincial and Municipal Net Real Capital Per Capita AB Source: CANSIM Tables and Prov Av Despite the addition of municipal capital, Alberta s provincial (plus municipal) capital stock as a percentage of GDP is still below that of the five province average (Figure 6.) However, since 2007, the relative differences between the two are smaller than those for provincial government capital (only) as a percentage of GDP. So, while the addition of the considerable municipal capital moderates Alberta s disparity relative to GDP, it does so only slightly. Thus the anomaly remains. Alberta has levels of public capital stock and levels of public investment that in per capita terms are well above those in the other five provinces but, relative to GDP, public capital stock and investment are comparatively low. 7
11 Percentage Figure 6. Provincial and Municipal (combined) Net Real Capital Stock as a Percentage of GDP AB 5 Prov Av Is Alberta Different? This lingering difference in indicators of the adequacy of Alberta s public capital raises the question as to what is the appropriate standard of comparison among provinces. Is it public capital stock relative to population or relative to GDP, or neither/both/something else? Closely related, is Alberta different? Table 1 provides various measures that, for our purposes, serve to characterize the six provinces. The values of those indicators are provided for 2013 and also their 1990 to 2013 averages. For ease of comparison, the provincial government sector real capital stock per person in 2013, previously provided in Figure 3, is provided in the first line of the table. The provincial capital stock as a percentage of GDP follows. These are the two measures that are the focus of the above discussion. As has been observed, the per capita amount for Alberta is relatively large while the percentage of GDP is relatively low (both for 2013 and the long-term average). Turing to the other indicators, GDP per person is and has been much higher in Alberta. Both in 2013 and from 1990 to 2013, GDP per capita has been about 60 per cent larger in Alberta than the five province average. Note too, however, that the GDP levels are most similar among Ontario, Manitoba and British Columbia with Quebec trailing somewhat. That in Saskatchewan (like Alberta, also a resource oriented economy), is noticeably above the levels in the other four provinces. The distribution of factor incomes also varies among the provinces. Approximately 50 per cent is paid as compensation to employees in Quebec, Ontario, Manitoba and British Columbia but that share is notably smaller at about 46 per cent in Alberta and even lower 8
12 (averaging about 40 per cent) in Saskatchewan. Corporate net operating surpluses as a percentage of GDP has an opposing pattern. It is lowest in Quebec, Ontario, Manitoba and British Columbia (averaging in the 10 to 13 per cent range since 1990) and is larger at about 20 per cent in Alberta and Saskatchewan (with a particularly strong showing at 28.2 per cent in Saskatchewan in 2013). Wide differences in the non-government capital stock among provinces is a reason for the differences in the distribution of factor incomes. Non-government non-residential capital stock per person is greatest in Alberta at $237,872 in 2013 and lowest in Quebec and Ontario at approximately $54,000 per capita. The levels in Manitoba and British Columbia are next largest at $67,893 and $76,491 respectively. That in Saskatchewan, at $148,289, sits well below Alberta but well above the other four provinces. Interprovincial differences in per person non-government capital stock do not necessarily translate into parallel differences in residents incomes. In 2013, and also since 1990, household per capita incomes were relatively similar across the five provinces other than Alberta. In 2013, incomes ranged from $37,657 to $44,288 but incomes and non-government capital stock ranked differently. Also, relative incomes shifted over time. At $54,088 per person in 2013, household income was substantially higher in Alberta almost one-third greater than the five province average. That was not always the case. Incomes in Alberta began to diverge from the pack at the turn of the century with a recovery in the energy sector. The 1990 to 2013 average for Alberta is only about 22 per cent above the five province average rather than 33 per cent larger in Note too that per capita household income in Saskatchewan in 2013 was the highest of the five provinces while its 1990 to 2013 average was the lowest. Incomes in Saskatchewan surged after Household incomes also differ as a percentage of GDP. Household income is typically in the 85 to 90 per cent range in Quebec, Ontario, Manitoba and British Columbia but at considerably lower levels (i.e., the low 70s in Alberta and Saskatchewan). In 2013, the percentage in Alberta was 65.5 and in Saskatchewan was it was Table 1 demonstrates that the Alberta economy is different in some rather important ways from those of the other five provinces and, particularly, Quebec, Ontario, Manitoba and British Columbia. Albertans work with large amounts of private sector capital, produce a high level of GDP per person and, particularly over the past 15 years, earn high incomes (despite incomes being a lower share of GDP). The Dodge report acknowledges this (page 16) but apparently believes that those differences should not modify the percentage of GDP that provincial government capital should be and recommends that Alberta meet the 16 per cent benchmark that is the weighted average of the five other provinces. Dodge notes, real economic activity per capita is far more intense in Alberta than in the other provinces and public capital has not kept pace with this activity to the same extent as in the other provinces over the past 20 years. One expects that public capital would increase in parallel with population but is it to be expected that 9
13 Provincial Govt Sector Capital Stock (2007$ chained) Provincial Govt Sector Capital Stock as % of GDP (both 2007$ chained) GDP Per Capita (2007$ chained) Compensation of Employees as % of GDP Corporate Net Operating Surplus as % of GDP Table 1. Provincial Characteristics 2013 Value AB QU ON MB SK BC ,201 40,353 46,570 45,049 55,981 47, Non-Govt, Non- Residential Capital Stock (2007$ chained) Household Income Per Capita (nominal $) Household Income as % of GDP (nominal $) Provincial Govt Sector Capital Stock (2007$ chained) Provincial Govt Sector Capital Stock as % of GDP (both 2007$ chained) GDP Per Capita (2007$ chained) Compensation of Employees as % of GDP Corporate Net Operating Surplus as % of GDP Non-Govt, Non- Residential Capital Stock (2007$ chained) Household Income Per Capita (nominal $) Household Income as % of GDP (nominal $) 237,872 53,809 54,658 67, ,289 76,491 54,088 37,687 41,678 37,657 44,288 42, Average AB QU ON MB SK BC ,500 35,714 42,399 37,586 46,224 40, ,624 51,064 54,663 60, ,030 66,289 35,141 27,533 31,654 26,848 27,498 30,
14 it should increase proportionately with output per capita? Do more productive workers need proportionately more public infrastructure? 8 Some Econometric Explorations In an effort to get a better understanding of the determinants of the levels of public capital, some simple econometric explorations were undertaken. The basic model seeks to explain provincial government capital stock per capita or as a percentage of GDP with population, population growth rate, real GDP per person and real household income per person as the potential explanatory variables. 9 Data covers 1990 to No details are provided but what appear to be robust results are summarized. First, Alberta is definitely distinct from the other five provinces. Also, Saskatchewan too seems distinct. Indeed, models estimated for Alberta and Saskatchewan combined and for the four other provinces together (Quebec, Ontario, Manitoba and British Columbia) perform well. These results suggest that the four (not five) province group is a more homogeneous group for comparison. Even so, the results also suggest that decisions on provincial capital stock have been different in Alberta than in the other (and especially the other four) provinces over the period examined. That implies, based on the decisions made over 24 years, that the levels per capita or as a percentage of GDP elsewhere may not be applicable to Alberta. A second interesting result relates to the role of GDP per person. Per capita GDP allows for the real economic activity per capita that the Dodge report emphasizes. Included here also is real household income per capita -- included to reflect differences in household income to GDP among the provinces and to reflect the possible impact of residents income on demand for (and possibly the cost of) provincial capital stock. Despite being correlated, both GDP and household income per person have (highly) significant coefficients. Particularly interesting is that the coefficient of GDP per capita is negative while that for household income per person is positive. This indicates that the level of provincial government capital stock per person increases as household income becomes larger but, after controlling for income and other factors, the level is reduced as GDP per person increases. These results suggest that GDP per person is itself not a good predictor of the levels of public capital stock. Determination of the levels is more complex and including both household income per person and GDP per person results in superior model performance (predictive power) and suggests that it is household income per person (not GDP 8 While it is true that the provincial capital stock as a percentage of GDP has declined relative to the five province average over the past 20 years (see Chart 4 in the Dodge report), that decline many not represent a serious deterioration in its productive contribution. Rather, the high percentages observed in the mid-1990s may represent the tailing off (due to deterioration of economic and fiscal conditions) of the surge in capital spending that followed the 1970s energy boom and that saw the provincial capital stock climb to almost 23 per cent of GDP in the mid-1980s. 9 It is expected that adding provincial government fiscal characteristics could be helpful but consistent data on those of interest are not available (since the demise of Statistics Canada s Financial Management Series) for the full period. 11
15 per capita) that is the main (positive) driver of the levels of provincial capital stock. This outcome persists whether the estimates are made across all six provinces, the other five provinces, or the four provinces excluding Alberta and Saskatchewan. 10 The examination of the data in Table 1 plus the econometric explorations offer some cautionary insights. Alberta is different and comparison of its provincial capital stock levels with other provinces based on GDP may not be all that informative. The determination of public capital stocks is more complex than simply the relationship to GDP. Hence, setting an objective of provincial capital stock equal to16 per cent of GDP because that is the average of the level in five other provinces is probably an imperfect and unreliable benchmark. 11 Capital Financing: The Long-Run Implications of Debt Financing The Dodge report recommends that the Alberta government increase the net capital stock of the provincial government sector to 16 per cent of GDP (a long term benchmark seen as characterizing the five other provinces) by Sustaining the 16 per cent level into the future requires an extended commitment to considerable capital expenditure. Based on working assumptions (page 29 of the Dodge report) and simulations provided by Alberta Treasury Board and Finance, Dodge projects the public finance implications of the expanded capital program under four oil price scenarios. For each oil price scenario and assuming (particularly) that the province s non-resource revenues remain a constant portion of GDP, the simulations project significant increases in the provincial debt in all four cases. Taking the low-to-mid oil price scenario (i.e., low to and mid from then to ) as the preferred option (i.e., probably the one that best balances the risks, page 24), Dodge projects that net debt would stabilize about to 25 percent of GDP by the mid-2020s. (page 30). The shift from a net financial asset to a net debt position and its leveling off at about 25 per cent of GDP is shown in Chart 11 of the Dodge report which is reproduced below. 10 Population and population change were included in the econometric specification but are of little interest to the theme of the discussion. Also, those results are not very informative. For completeness, however, mention is made here. Including population allows for possible economies of population size. The coefficient of population is typically significant but the sign depends upon the method of estimation. Population change was not expected to play much of a role in explaining capital stock and its coefficient is normally not statistically significant except in fixed effects estimation. 11 A provincial government s capital expenditures are the product of a capital plan encompassing a large number of individual projects being undertaken in an environment of an existing infrastructure. The merits of those projects should be individually assessed and pass a social benefit-cost standard to warrant inclusion in the plan. Thus, capital spending is, or should be, the product of a myriad of (presumably well made) micro decisions and not the result of pursuing some arbitrary macro benchmark. Dodge acknowledges the micro fundamentals but anticipates that the investments necessary to achieve the 16 per cent benchmark would meet such a social rate of return standard. 12
16 Chart 11 (of Dodge report) Dodge considers provincial net debt at 25 per cent of GDP moderate by provincial standards and points to the current levels in Quebec (51 per cent), Ontario (39 per cent) and British Columbia (16 per cent). 12 To complete the comparison, the levels of net debt to GDP are shown for all six provinces in Figure 7 along with the projected level for Alberta in By this standard, a net debt level of 25 per cent appears not unreasonable See page 19 and Chart 8 in the Dodge report. 13 In addition, being unique among provinces in having positive net financial assets, Alberta has (as Dodge points out, page 19) prudent room for net borrowing. 13
17 Percentage 60.0 Figure 7. Net Debt as a Percentage of GDP QU ON MB SK BC AB AB There is a problem with the Dodge proposal. While net debt of 25 per cent of GDP may appear moderate compared to other provinces, GDP is a questionable standard for comparison. Provincial governments differ considerably in their size relative to their economies. To demonstrate, Table 2 reports the total revenues of the six provinces relative to their GDPs for The percentages range from 12.1 per cent in Alberta to 26.1 per cent in Quebec. Alberta has the smallest provincial government relative to its economy with a level only 60 per cent of the average of the other five provinces. Despite these differences, total revenues per capita are quite similar. The average across the six provinces is $10,899 per person with a range from $8664 in Ontario to $11,761 in Quebec. 14 Alberta, at $10,986 ranks in the middle. Thus, it is argued that debt relative to provincial revenues is a valuable alternative measure, and in some cases a more appropriate indicator, of a province s capacity to bear debt. Table 2. Provincial Government Total Revenue as a Percentage of GDP and Per Capita, QU ON MB SK AB BC As % of GDP Per Capita 11,761 8,664 11,532 12,492 10,986 9,959 Source: Finance Canada, Fiscal Reference Tables, The range would be considerably smaller if revenues in Ontario covered its $10.9 billion deficit. If so, revenues would be $9482 per person (and much closer to that in British Columbia) and be 17.9 per cent of GDP. Ontario is the only one of the six provinces with such a (relatively) large difference between revenues and expenditures; that is, the only province for which such a calculation makes a material difference to these numbers. 14
18 Percentage Using provincial government revenues rather than GDP as the base provides quite a different perspective on the magnitude of provincial debt and a province s ability to finance that debt. Figure 8 shows the level of net debt as a percentage of total revenues for the six provinces. Quebec and Ontario stand out in that net debt is essentially 200 and 240 per cent respectively of provincial revenues. The magnitudes in Manitoba, Saskatchewan and British Columbia are notably lower and range between 40 per and 127 per cent. In , Alberta still had net financial assets (i.e., negative net debt). The Dodge report outlines a largely debt financed capital program leading it to debt stabilizing at 25 per cent of GDP about Were Alberta now to have net debt equal to 25 per cent of GDP, Alberta s net debt would amount to 200 per cent of provincial revenues. That would be a level of debt comparable to those in Quebec and Ontario, neither of which is in an enviable position and, as to be expected, whose bond ratings are below those of the other four provinces. Looked at in this context, a debt burden of 25 per cent of GDP seems less moderate and much less appealing than implied in the Dodge report. Figure 8. Net Debt as a Percentage of Provincial Revenues, (and Alberta if debt was 25 per cent of GDP) QU ON MB SK BC AB AB (25% of GDP) A capital finance program leading to net debt stabilizing at 25 per cent of GDP has other ramifications. Stabilization of the debt level at 25 per cent of GDP suggests a permanent level of debt. That implies a continuous debt financing burden. Debt servicing costs currently represent approximately 10 per cent of provincial revenues in Quebec and Ontario. A similar cost could be added to the Alberta budget if net debt approximated a quarter of GDP (and perhaps more if interest rates increase from the current low levels). That additional cost becomes a new burden 15
19 for Alberta residents. It must be met either from increased taxes and/or reduced services. If Albertans were to face those additional costs by , they should give serious consideration to avoiding the debt service costs by financing sooner a larger share of capital investments from revenues (either by reducing other expenditures and/or increasing taxes). 15 So, even if Alberta can readily borrow and could carry a considerable level of debt, a sustained long-term debt financed capital program should not be attractive. Conclusion The Dodge report provides many valuable insights and its recommendations for the near term, particularly regarding stabilization, are sound. Also, the attention to and warnings of the sensitivity of provincial revenues to oil prices and so fiscal plans, even in the short term, is a service. The concern in this analysis is the position that the provincial public sector capital stock is deficient compared to other large provinces and the resulting recommendation that Alberta should increase its capital stock to a level equivalent to 16 per cent of its GDP (a benchmark taken from the long term levels in five other provinces; Quebec, Ontario, Manitoba, Saskatchewan and British Columbia). This paper presents evidence casting doubt on the merits of that recommendation. A major piece of cautionary evidence is that the real per person capital in Alberta currently exceeds considerably that in each of the other five provinces (and by 21 per cent on average). Augmenting the stock to the 16 per cent of GDP level that Dodge recommends would, if in place in 2013, have resulted in the per capita level in Alberta being 39 per cent larger than the average in the other five provinces. These data come from correcting a misleading error in Chart 3 of the Dodge report. Including municipal government capital magnifies the per capita difference between Alberta and the others. 16 Provincial and municipal per capita capital stock amounted to $18,473 in Alberta while the five province average was $13, Debt finance of capital only delays and increases the cost of capital to the province. Had 10 per cent of revenues been needed to meet debt service costs in , that would have amounted to $4.5 billion dollars. $4.5 billion compares with capital plan expenditures of $6.2 billion that year, $6.8 billion per year average annual capital outlay planned by the NDP government over the next five years, and the $7.2 billion average over five years recommended in the Dodge report. That is, avoiding the interest expense of debt finance (at the 25 per cent of GDP level) would meet about two-thirds of annual capital outlays. Since prolonged reliance on debt finance of capital increases the cost, it seems better to avoid (as much as possible) debt and lower the cost. Debt is best reserved for the meeting deficits arising from those unexpected and short term emergencies such as the fiscal crisis imposed by the collapse of oil prices when contingency funds are not available or are inadequate. Debt is typically a costly approach for meeting long term expenditures including the regular annual outlays necessary to provide and maintain public infrastructure. For further discussion see section 3.1 of M. McMillan, Hard Math, Harder Choices, Parkland Institute, October 2015, 16 It also reveals that the sub-national government per capita capital stock is more homogeneous among the five provinces than the provincial only levels. 16
20 That Alberta has a high level of public capital stock per person but a low level relative to GDP poses the issue of which is the appropriate standard of comparison (or are both relevant, neither, or something else). An examination of various characteristics of the provincial economies suggests that the Alberta is different. In particular, Albertans work with large amounts of private sector capital, produce a high level of GDP per person and, particularly over the past 15 years, earn high incomes despite incomes being a lower share of GDP. The data indicates that four provinces (Quebec, Ontario, Manitoba and British Columbia) are quite similar. Alberta, and in some ways Saskatchewan, are unlike the other four. Those differences raise questions about the reliability of comparisons with GDP in other provinces for making inferences about Alberta. Some econometric explorations into the determinants of provincial capital stock per capita and as a percentage of GDP support the distinctiveness of the Alberta economy. In addition, household income is observed to have a major influence on the stock of public capital in all provinces. Determining the appropriate levels of public capital stock in our situation appears to be more complicated than simply appealing to GDP. Dodge projects the public finance implications for Alberta of implementing the 16 per cent of GDP benchmark based on a set of reasonable assumptions and four oil price scenarios. The implications are that the enhanced capital stock would be largely debt financed and result in the province assuming considerable levels of net debt. Following the low-to-mid price of oil scenario, debt would stabilize at 25 per cent of GDP. Dodge regards that level as moderate. However, when one recognizes the smaller size of provincial government relative to GDP in Alberta, that level of debt is twice the annual revenue of the province. That is not a moderate level and it compares to the levels in the high debt provinces of Quebec and Ontario. Carrying debt of that magnitude imposes a significant cost to the provincial budget, perhaps in the order of 10 per cent of revenues depending upon interest rates at the time. Viewed from this perspective - - that is, the financial resources of the provincial government rather than the size of the economy there is reason to believe that the potential debt burden is (effectively) understated in the Dodge report and, so, good reason to be less sanguine about the fiscal consequences. 17 This analysis argues that Albertans be cautious about following Dodge s recommendation that the provincial government pursue a provincial public sector capital stock equal to 16 per cent of GDP. In the case of Alberta, GDP appears to be a tenuous base up which to make interprovincial comparisons. Alberta already has a high level of public capital per capita although that stock is somewhat lower relative to GDP. Also, Albertans should be cautious about financing extensions of its capital stock by borrowing. While the amount of debt that could result appears moderate relative to GDP, that amount is large relative to provincial government revenues and the burden on the provincial budget (and so taxes and services) is significant. 17 Of course, the province need not rely so heavily on debt finance even if expanding capital expenditures. Alternative expenditures and revenue/tax choices could reduce the need for borrowing. Dodge mentions tolling. 17


21 Appendix: Charts from the Dodge Report 18
22 19
Regional Development Patterns in Canada
 Regional Development Patterns in Canada David Andolfatto Simon Fraser University and Ying Yan Simon Fraser University Version: July 2008 1. INTRODUCTION We provide annual data over the sample period 1981-2007
SOURCES PUBLIC POLICY. The Budget Performance Index 2000: Comparing the Recent Fiscal Conduct of Canadian Governments. Contents
 PUBLIC POLICY SOURCES Number 39 The Budget Performance Index 2000: Comparing the Recent Fiscal Conduct of Canadian Governments by Joel Emes The Fraser Institute Contents Introduction... 3 The Budget Performance
Comparing Ontario s Fiscal Position with Other Provinces
 Comparing Ontario s Fiscal Position with Other Provinces Key Points In 2017, the Ontario provincial government received $10,415 in total revenue per person 1, the lowest in the country. Despite the lowest
DO MUNICIPAL GOVERNMENTS NEED MORE TAX POWERS? A BACKGROUND PAPER ON MUNICIPAL FINANCE IN ALBERTA
 Volume 7 Issue 33 November 2014 DO MUNICIPAL GOVERNMENTS NEED MORE TAX POWERS? A BACKGROUND PAPER ON MUNICIPAL FINANCE IN ALBERTA Melville McMillan, Professor Emeritus, Department of Economics, University
Regulatory Announcement RNS Number: RNS to insert number here Québec 27 November, 2017
 ISSN 1718-836 Regulatory Announcement RNS Number: RNS to insert number here Québec 27 November, 2017 Re: Québec Excerpts from The Quebec Economic Plan November 2017 Update, Québec Public Accounts 2016-2017
THE 2018 MANITOBA PROSPERITY REPORT. Are We There Yet? MANITOBA EMPLOYERS COUNCIL
 THE 2018 MANITOBA PROSPERITY REPORT Are We There Yet? MANITOBA EMPLOYERS COUNCIL Established in 1980, the Manitoba Employers Council (MEC) is the largest confederation of employer associations in Manitoba,
CANADIAN HOUSING FORECAST. Opposing forces to keep Canada s housing market afloat in 2015 but downside risks mount.
 CANADIAN HOUSING FORECAST January 15, 2015 Opposing forces to keep Canada s housing market afloat in 2015 but downside risks mount Home resales: Canada Thousands of units 550 500 450 400 350 300 250 200
Inter-Provincial Exports
 ECONOMIC COMMENTARY Inter-Provincial Exports Highlights: Although the Alberta economy is heavily dependent on international exports Alberta s exports of goods and services to the other provinces and territories
Property Taxes in Saskatchewan
 Property in Saskatchewan Report # 1: - A Historical Overview, 1985-2000 - News Release Prepared by: Richard Truscott Saskatchewan Director, Canadian Taxpayers Federation November 6, 2001 TABLE OF CONTENTS:
June Decentralization, Provincial Tax Autonomy and Equalization in Canada
 June 20081 Decentralization, Provincial Tax Autonomy and Equalization in Canada Overview What are the interrelationships/connections between the high degree of tax decentralization and provincial tax autonomy
Post-Secondary Education, Training and Labour Prepared May New Brunswick Minimum Wage Report
 Post-Secondary Education, Training and Labour Prepared May 2018 2018 New Brunswick Minimum Wage Report Contents Section 1 Minimum Wage Rates in New Brunswick... 2 1.1 Recent History of Minimum Wage in
LEADING THE WAY OR MISSING THE MARK? THE KLEIN GOVERNMENT S FISCAL PLAN
 NUMBER 37 FEBRUARY 1996 LEADING THE WAY OR MISSING THE MARK? THE KLEIN GOVERNMENT S FISCAL PLAN by Melville L. McMillan Professor, Department of Economics University of Alberta INTRODUCTION In 1993, Premier
Centre for Urban Economics and Real Estate. Discussion Paper
 Centre for Urban Economics and Real Estate Discussion Paper 2013 01 Politics and Performance: British Columbia s Economic and Fiscal Experience under the NDP and BC Liberals 1991-2013 Tsur Somerville*
COMPARATIVE ANALYSIS SUPERINTENDENT SALARIES
 COMPARATIVE ANALYSIS SUPERINTENDENT SALARIES PREPARED FOR THE ALBERTA SCHOOL BOARDS ASSOCIATION February 6, 2018. VANCOUVER EDMONTON CALGARY TORONTO 10609 124 Street, Edmonton, AB T5N 1S5 Tel: 780.428.1501
Fiscal Sustainability Report 2017
 Fiscal Sustainability Report 217 Ottawa, Canada 5 October 217 www.pbo-dpb.gc.ca The Parliamentary Budget Officer (PBO) supports Parliament by providing analysis, including analysis of macro-economic and
Post-Secondary Education, Training and Labour August New Brunswick Minimum Wage Factsheet 2017
 Post-Secondary Education, Training and Labour August 2017 New Brunswick Minimum Wage Factsheet 2017 Contents PART 1 - Minimum Wage Rates in New Brunswick... 3 1.1 Recent History of Minimum Wage in New
Past, Present, Future. Health Care Costs in Ontario
 Past, Present, Future Health Care Costs in Ontario Spring 2017 About this Document The Institute of Fiscal Studies and Democracy (IFSD) is a Canadian think-tank sitting at the nexus of public finance and
2001 COOPERATIVE CREDIT ASSOCIATIONS - (in thousands of dollars) TABLE 1 - ASSETS
 TABLE 1 - ASSETS") TABLE 1 - ASSETS British Columbia Ontario Ltd. Nova Scotia Alberta Canada Cash resources 0 28,905 5 19,473 2,622 Deposits with regulated financial institutions.. 532,821 32,743 160,372 8,802 0 Securities
TABLE 1 - ASSETS British Columbia Ontario Ltd. Nova Scotia Alberta Canada Cash resources 0 28,905 5 19,473 2,622 Deposits with regulated financial institutions.. 532,821 32,743 160,372 8,802 0 Securities
The Flypaper Effect. Does equalization really contribute to better public services, or does it just stick to politicians and civil servants?
 AIMS Special Equalization Series Commentary Number 2 June 2006 The Flypaper Effect Does equalization really contribute to better public services, or does it just stick to politicians and civil servants?
Alberta s Imports from the other Provinces and Territories
 ECONOMIC COMMENTARY Alberta s Imports from the other Provinces and Territories Highlights: Although Alberta is known to be a major exporter of goods and services to international and Canadian markets,
Contents. Hard Math, Harder Choices: Alberta s Budget Reality
 Hard Math, Harder Choices: Alberta s Budget Reality All Parkland Institute reports are available free of charge at parklandinstitute.ca. Printed copies can be ordered for $10. Your financial support helps
LETTER. economic. Slowdown in international trade: has interprovincial trade made up for it? DECEMBER bdc.ca
 economic LETTER DECEMBER Slowdown in international trade: has interprovincial trade made up for it? Canada has always been a country open to the world, but it has become increasingly so over the years.
Federal Financial Support to Provinces and Territories: A Long-term Scenario Analysis
 Federal Financial Support to Provinces and Territories: A Long-term Scenario Analysis Ottawa, Canada March 8 www.pbo-dpb.gc.ca The Parliamentary Budget Officer (PBO) supports Parliament by providing economic
Post-Secondary Education, Training and Labour Prepared November New Brunswick Minimum Wage Report
 Post-Secondary Education, Training and Labour Prepared November 2018 2018 New Brunswick Minimum Wage Report Contents Section 1 Minimum Wage Rates in New Brunswick... 2 1.1 Recent History of Minimum Wage
OBSERVATION. TD Economics PROVINCIAL BUDGETS OVERVIEW OVERALL SHORTFALL GRINDING LOWER BUT A MIXED SHOWING REGIONALLY
 OBSERVATION TD Economics PROVINCIAL BUDGETS OVERVIEW OVERALL SHORTFALL GRINDING LOWER BUT A MIXED SHOWING REGIONALLY Highlights At an estimated $22.1 billion (1.3% of GDP) in fiscal 2011-12, Canada s combined
Alberta s Labour Productivity Declined in 2016
 ECONOMIC COMMENTARY Alberta s Labour Productivity Declined in 2016 Highlights: The 2015/2016 recession and the Fort Mc Murray forest fires caused Alberta s labour productivity to decline again in 2016
FEDERAL/PROVINCIAL/TERRITORIAL FISCAL RELATIONS IN TRANSITION
 Canada's Western Premiers' Conference 2003 FEDERAL/PROVINCIAL/TERRITORIAL FISCAL RELATIONS IN TRANSITION A Report to Canada's Western Premiers from the Finance Ministers of British Columbia, Alberta, Saskatchewan,
The Impact of Redistribution on Income Inequality in Canada and the Provinces,
 September 2012 151 Slater Street, Suite 710 Ottawa, Ontario K1P 5H3 613-233-8891, Fax 613-233-8250 csls@csls.ca Centre for the Study of Living Standards The Impact of Redistribution on Inequality in Canada
2. Full-time staffing intentions, next 3 months 3. General state of business health. 20 Bad 5 10 Down
 Newfoundland & Labrador April Newfoundland & Labrador's small businesses are seeing a weaker outlook in April. The Business Barometer lost another 2 points to reach.8. Full-time short-term staffing intentions
Discussion of The initial impact of the crisis on emerging market countries Linda L. Tesar University of Michigan
 Discussion of The initial impact of the crisis on emerging market countries Linda L. Tesar University of Michigan The US recession that began in late 2007 had significant spillover effects to the rest
Appendix 1-2. Conference Board of Canada Report (October 2015)
") CA PDF Page 1 of 64 Energy East Pipeline Ltd. TransCanada PipeLines Limited Consolidated Application Volume 1: Energy East Project and Asset Transfer Applications Appendix 1-2 Conference Board of Canada
CA PDF Page 1 of 64 Energy East Pipeline Ltd. TransCanada PipeLines Limited Consolidated Application Volume 1: Energy East Project and Asset Transfer Applications Appendix 1-2 Conference Board of Canada
CREA Updates Resale Housing Forecast Ottawa, ON, September 15, 2016
 CREA Updates Resale Housing Ottawa, ON, September 15, 2016 The Canadian Real Estate Association (CREA) has updated its forecast for home sales activity via the Multiple Listing Service (MLS ) Systems of
The response of tax bases to the business cycle: the case of Alberta. Ergete Ferede
 The response of tax bases to the business cycle: the case of Alberta Ergete Ferede Grant MacEwan University, Edmonton, and Fellow, Institute of Public Economics February 11, 2013 Abstract One major concern
Up and Away: The Growth of Municipal Spending in Metro Vancouver
 Up and Away: The Growth of Municipal Spending in Metro Vancouver As governments around the country struggle to address deficits and manage growing debt loads in the face of often difficult economic circumstances,
The corporate capital tax Canada s most damaging tax
 The corporate capital tax Canada s most damaging tax Jason Clemens, Joel Emes, and Rodger Scott Introduction The corporate capital tax is a business tax little known outside the circles of academia, tax-planning,
State. of the Economy CANADIAN CENTRE FOR POLICY ALTERNATIVES. By David Robinson. Volume 1 No. 2 Spring What s Inside:
 State Volume 1 No. 2 Spring 2001 of the Economy By David Robinson CANADIAN CENTRE FOR POLICY ALTERNATIVES What s Inside: The U.S. slowdown spills into Canada The Outlook for Canada Government revenue losses
CREA Updates Resale Housing Forecast Ottawa, ON, December 15, 2014
 CREA Updates Resale Housing Forecast Ottawa, ON, December 15, 2014 The Canadian Real Estate Association (CREA) has updated its forecast for home sales activity via the Multiple Listing Service (MLS ) Systems
Canada Social Report. Welfare in Canada, 2013
 Canada Social Report Welfare in Canada, 2013 Anne Tweddle, Ken Battle and Sherri Torjman November 2014 Copyright 2014 by The Caledon Institute of Social Policy ISBN 1-55382-630-2 Published by: Caledon
Poverty and the Welfare State II
 Poverty and the Welfare State II TERENCE J. WALES Most of the income security programmes outlined in the paper by my colleague R. Swidinsky are under federal control. The only one under provincial control
Fiscal Consequences of Higher Spending on K-12 Public Schools in Canada
 Research Bulletin FEBRUARY 2017 Fiscal Consequences of Higher Spending on K-12 Public Schools in Canada by Hugh MacIntyre and Joel Emes Summary Spending decisions by governments have consequences beyond
Senior Managers Construction, Transportation, Production and Utilities (NOC 0016)
") Occupational Snapshot 2016-2025 Senior Managers Construction, Transportation, Production and Utilities (NOC 0016) The Asia Pacific Gateway Corridor (APGC) Senior Managers Construction, Transportation,
Occupational Snapshot 2016-2025 Senior Managers Construction, Transportation, Production and Utilities (NOC 0016) The Asia Pacific Gateway Corridor (APGC) Senior Managers Construction, Transportation,
Appendix 4.2 Yukon Macroeconomic Model
 Appendix 4.2 Yukon Macroeconomic Model 2016 2035 14 July 2016 Revised: 16 March 2017 Executive Summary The Yukon Macroeconomic Model (MEM) is a tool for generating future economic and demographic indicators
Canada-U.S. ICT Investment in 2009: The ICT Investment per Worker Gap Widens
 November 2010 1 111 Sparks Street, Suite 500 Ottawa, Ontario K1P 5B5 613-233-8891, Fax 613-233-8250 csls@csls.ca CENTRE FOR THE STUDY OF LIVING STANDARDS Canada-U.S. ICT Investment in 2009: The ICT Investment
Province of Alberta Investor Meetings Asia October Stephen J. Thompson, CFA Executive Director, Capital Markets Treasury Board and Finance
 Province of Alberta Investor Meetings Asia October 2018 Stephen J. Thompson, CFA Executive Director, Capital Markets Treasury Board and Finance Alberta, Canada Canada 10th largest economy and 9th least
Fiscal Coordination in Canada
 Nipun Vats Federal-Provincial Relations Division, FInance Canada Presentation to OECD-MENA Senior Budget Officials Nov 1, 2010 This presentation does not necessarily reflect the views of the Department
EDUCATION SPENDING in Public Schools in Canada
 EDUCATION SPENDING in Public Schools in Canada 2019 Edition Angela MacLeod and Joel Emes Contents Executive summary / iii Introduction / 1 Education spending and public student enrolment / 2 Understanding
Measuring Nova Scotia s Results in Health Research
 Collins Management Consulting & Research Ltd. Measuring Nova Scotia s Results in Health Research 2009 Update Report Health Research 2009 Update Report Prepared on behalf of the Nova Scotia Health Research
Ontario s Fiscal Competitiveness in 2004
 Ontario s Fiscal Competitiveness in 2004 By Duanjie Chen and Jack M. Mintz International Tax Program Institute for International Business J. L. Rotman School of Management University of Toronto November
Economic Spotlight. ALBERTA FINANCE Office of Budget and Management March 23, 2006 ALBERTA S ECONOMIC PERFORMANCE:
 Economic Spotlight ALBERTA FINANCE Office of Budget and Management March 23, 2006 ALBERTA S ECONOMIC PERFORMANCE: 1994-2004 A review of Alberta s record on growth, innovation & diversification INTRODUCTION
SUPPLEMENT TO THE GOVERNMENT S BUDGETARY POLICY ACTION. Federal Transfer Payment Update
 SUPPLEMENT TO THE GOVERNMENT S BUDGETARY POLICY 2002-2003 ACTION Federal Transfer Payment Update Federal Transfer Payment Update ISBN 2-550-38985-9 Legal deposit Bibliothèque nationale du Québec, 2002
Civil Engineering Technologists and Technicians (NOC 2231)
") Occupational Snapshot 2016-2025 Civil Engineering Technologists and Technicians (NOC 2231) The Asia Pacific Gateway Corridor (APGC) Civil Engineering Technologists and Technicians provide technical support
Occupational Snapshot 2016-2025 Civil Engineering Technologists and Technicians (NOC 2231) The Asia Pacific Gateway Corridor (APGC) Civil Engineering Technologists and Technicians provide technical support
Province of Manitoba. Economic and Fiscal Update
 Province of Manitoba Economic and Fiscal Update Manitoba Finance: July 2017 1 Manitoba s Economy One of ten Canadian provinces (fifth-largest in population) Centrally located in North America with a comprehensive
Cross Canada Check-up
 Cross Canada Check-up Provincial/territorial findings from CANADA S NEIGHBOURHOOD FINANCIAL HEALTH INDEX Canadian Council on Social Development Conseil canadien de développement social 1 Introduction 3.4
Cross Canada Check-up
 Cross Canada Check-up Provincial/territorial findings from CANADA S NEIGHBOURHOOD FINANCIAL HEALTH INDEX Canadian Council on Social Development Conseil canadien de développement social 1 Introduction 3.4
BC JOBS PLAN ECONOMY BACKGROUNDER. Current statistics show that the BC Jobs Plan is working: The economy is growing and creating jobs.
 We know that uncertainty continues to remain in the global economy and we expect to see some monthly fluctuations in jobs numbers. That is why we will continue to create an environment that is welcoming
ECONOMIC PROSPERITY. Ontario Prosperity Is Best of Second Best Good Enough? STUDIES IN. Number 1 / April 2003
 STUDIES IN ECONOMIC PROSPERITY Number 1 / April 2003 Ontario Prosperity Is Best of Second Best Good Enough? Jason Clemens, Amela Karabegović, and Niels Veldhuis Contents Executive summary.......................................................
Asset Valuation and The Post-Tax Rate of Return Approach to Regulatory Pricing Models. Kevin Davis Colonial Professor of Finance
 Draft #2 December 30, 2009 Asset Valuation and The Post-Tax Rate of Return Approach to Regulatory Pricing Models. Kevin Davis Colonial Professor of Finance Centre of Financial Studies The University of
Some provinces now face the downside of tight labour markets
 PROVINCIAL OUTLOOK September 12, 218 Some provinces now face the downside of tight labour markets When it comes to the labour market, things haven t been any better for a generation in Canada. This is
POLICY PERSPECTIVES BETTER, BUT STILL RISING STEADILY: AN UPDATE ON MUNICIPAL SPENDING IN METRO VANCOUVER HIGHLIGHTS
 BETTER, BUT STILL RISING STEADILY: AN UPDATE ON MUNICIPAL SPENDING IN METRO VANCOUVER HIGHLIGHTS Collectively, the 21 municipalities that comprise Metro Vancouver allocated $3.74 billion to operating or
April 2016 Dale Beugin Richard Lipsey Christopher Ragan France St-Hilaire Vincent Thivierge
 PROVINCIAL CARBON PRICING AND HOUSEHOLD FAIRNESS April 2016 Dale Beugin Richard Lipsey Christopher Ragan France St-Hilaire Vincent Thivierge ACKNOWLEDGMENTS We thank Jennifer Jones, Shawna Brown, and the
Subject: Profit and Rate Adequacy Review Private Passenger Automobiles
 Paula Elliott Principal Oliver Wyman 20 Bremner Boulevard Suite 800 Toronto, ON M5J 0A8 Canada Tel: +1 416 868 2000 Fax: 416 868 7002 paula.elliott@oliverwyman.com www.oliverwyman.com Cheryl Blundon, Board
Financial Statement Discussion and Analysis Report
 PROVINCE OF BRITISH COLUMBIA 11 Highlights The highlights section provides a summary of the key events affecting the financial statements based on information taken from the Summary Financial Statements
Economic Spotlight Working Smarter: Productivity in Alberta
 Economic Spotlight Working Smarter: Productivity in Alberta Why Productivity Matters Productivity isn t everything, but in the long run it is almost everything. A country s ability to improve its standard
REPORT OF THE COUNCIL OF THE FEDERATION WORKING GROUP ON FISCAL ARRANGEMENTS ASSESSMENT OF THE FISCAL IMPACT OF THE CURRENT FEDERAL FISCAL PROPOSALS
 REPORT OF THE COUNCIL OF THE FEDERATION WORKING GROUP ON FISCAL ARRANGEMENTS ASSESSMENT OF THE FISCAL IMPACT OF THE CURRENT FEDERAL FISCAL PROPOSALS MAIN REPORT JULY, 2012 Table of Contents: Summary of
Business Outlook Survey
 Business Outlook Survey Results of the Autumn 15 Survey Vol. 12.3 9 October 15 The autumn Business Outlook Survey shows that firms expectations continue to diverge as they gradually adjust to an environment
When is it business? So you re now a business owner what s the first step?
 STARTING A BUSINESS Starting a business can feel like entering a regulatory and tax jungle without a guide. There s no doubt that Canadian business and tax laws can be complex, and the administrative burden
DEPARTMENT OF ECONOMICS THE UNIVERSITY OF NEW BRUNSWICK FREDERICTON, CANADA
 CONVERGENCE IN A SMALL OPEN ECONOMY by Giuseppe Ruggeri and Fan Yang Working Paper Series 2001-09 DEPARTMENT OF ECONOMICS THE UNIVERSITY OF NEW BRUNSWICK FREDERICTON, CANADA CONVERGENCE IN A SMALL OPEN
Economic Contribution of Business Events in Canadian Cities. Canadian Economic Impact Study 3.0 (CEIS 3.0), 2012 Base Year
, 2012 Base Year") Economic Contribution of Business Events in Canadian Cities Canadian Economic Impact Study 3.0 (CEIS 3.0), 2012 Base Year Economic Contribution of Business Events in Canadian Cities Canadian Economic Impact
Economic Contribution of Business Events in Canadian Cities Canadian Economic Impact Study 3.0 (CEIS 3.0), 2012 Base Year Economic Contribution of Business Events in Canadian Cities Canadian Economic Impact
To Pay or Not to Pay: Should the Federal Government Pay Down its Debt?
 To Pay or Not to Pay: Should the Federal Government Pay Down its Debt? by Michael Mendelson ISBN 1-895796-96-2 January 1998 2 Caledon Institute of Social Policy introduction Canadian governments have spent
Mackenzie's Canadian Federal / Provincial Marginal Tax Rates
 Mackenzie's Federal / Provincial Marginal Tax Rates Current as of: July 1, 2012 Quick Links by Province AB NS QC BC NT SK MB NU YT NB ON NL PE How To Use These Tables: Marginal Tax Rates calculate the
A Balanced but Challenging Provincial Budget
 A Balanced but Challenging Provincial Budget I n his inaugural budget, BC Finance Minister Mike de Jong delivered on the government s long-standing promise to balance the operating budget by fiscal 2013-14.
Highlights. For the purpose of this profile, the population is defined as women 15+ years.
 A L B E R T A L A B O U R F O R C E P R O F I L ES Women 2014 Highlights For the purpose of this profile, the population is defined as women 15+. Working Age Population of Women in Alberta The number of
Competitive Alternatives
 Competitive Alternatives Focus on Tax 2009 Update for Ontario Ministry of Finance November 2009 TAX In association with: Competitive Alternatives: Focus on Tax 2009 Update for Ontario Ministry of Finance
Province of Alberta. June, Stephen J Thompson Executive Director Capital Markets, Treasury Board and Finance. and
 Province of Alberta US Investor Meetings June, 2017 Stephen J Thompson Executive Director Capital Markets, Treasury Board and Finance and Catherine Rothrock Chief Economist & Executive Director, Treasury
TD Economics Special Report
 TD Economics Special Report www.td.com/economics WHEN THE COMMODITY BOOM GOES BUST The dramatic rise in commodity prices that took place between 22 and mid-28 had a profound effect on the Canadian economy.
Physician Services Analysis
 Physician Services Analysis The following slides were prepared by KPMG on behalf of Alberta Health. All inter-provincial comparisons are based on data published by the Canadian Institute for Health Information
BRIEF. Saskatchewan Government and General Employees Union
 Saskatchewan Government and General Employees Union BRIEF Saskatchewan Government and General Employees Union Stakeholder Submission on the Future of Liquor Retailing in Saskatchewan Introduction The Saskatchewan
Thinking Through the Economic Consequences of Higher Taxes
 Thinking Through the Economic Consequences of Higher Taxes After 15 years of significant if somewhat intermittent tax cuts, a number of provincial s across Canada seem to have shifted to a tax-raising
Comparing Alberta s Economic and Fiscal Performance with Other North American Energy Jurisdictions
 Comparing Alberta s Economic and Fiscal Performance with Other North American Energy Jurisdictions Livio Di Matteo, Fraser Institute Student Seminar, Calgary, Alberta, January 17, 2015 Economic Performance
Auditor General. of British Columbia. Monitoring the Government s Finances. Province of British Columbia
 2 0 0 1 / 2 0 0 2 : R e p o r t 4 O F F I C E O F T H E Auditor General of British Columbia Monitoring the Government s Finances Province of British Columbia National Library of Canada Cataloguing in Publication
Economic Spotlight June 20, 2009
 Economic Spotlight June 2, 29 Summary: Consumer Bankruptcy Deteriorating economic conditions, combined with rising unemployment and declining asset values, have caused a significant increase in consumer
LETTER. economic. Is Canada less dependent on the United States than it used to be? DECEMBER 2011 JANUARY bdc.ca
 economic LETTER DECEMBER JANUARY 212 Is less dependent on the United States than it used to be? weathered the last recession better than the United States. The decline in real GDP in was less pronounced
It s Bigger Than You Think: Non-Resource Manufacturing in BC
 Volume 22, Issue 3, June 2015 It s Bigger Than You Think: Non-Resource Manufacturing in BC Highlights Despite making sizable contributions to the province s economy and export base, non-resource manufacturing
Special Report. February 9,
 HIGHLIGHTS The focus nationally on household debt has raised questions about which regions of the country face the most significant challenge. As such, has constructed an index of financial vulnerability,
Financial Statement Discussion and Analysis Report
 PROVINCE OF BRITISH COLUMBIA 11 Highlights The highlights section provides a summary of the key events affecting the financial statements based on information taken from the Summary Financial Statements
Is There a Roemer s Law for Physicians? Physician Numbers As a Driver of Provincial Government Health Spending
 Is There a Roemer s Law for Physicians? Physician Numbers As a Driver of Provincial Government Health Spending Livio Di Matteo Lakehead University A paper prepared for the Rimini Conference in Economics
PROVINCIAL TAX RATE ADJUSTMENTS IN CANADA
 Volume 5 Issue 5 November 2013 SPP Communiqués are brief articles that deal with a singular public policy issue and are intended to provide the reader with a focused, concise critical analysis of a specific
Saving, financing and investment in the euro area
 Saving, financing and investment in the euro area Saving, financing and (real and financial) investment in the euro area from 1995 to 21 are analysed in this article in the framework of annual financial
Province of Alberta CIBC Government Finance Conference Vancouver June 11, 2018
 Province of Alberta CIBC Government Finance Conference Vancouver June 11, 2018 Stephen J Thompson Executive Director Capital Markets, Treasury Board and Finance and Catherine Rothrock Chief Economist &
Regional Intensity Index Average number of items exchanged per person by Region
 The Kijiji 2018 Second-Hand Economy Index Report surveyed Canadians across the country about their involvement in the second-hand economy; including second-hand purchases, sales, trades, donations, and
Projections Point to Balanced Labour Market Conditions in BC
 Volume 5, Issue 6, December 2015 Projections Point to Balanced Labour Market Conditions in BC Highlights The new British Columbia 2014-2024 Labour Market Outlook report projects a cumulative 935,000 job
BRITISH COLUMBIA Proposed major projects drive construction activity
 CONSTRUCTION & MAINTENANCE LOOKING FORWARD BRITISH COLUMBIA Proposed major projects drive construction activity HIGHLIGHTS 2017 2026 DISTRIBUTION OF CONSTRUCTION EMPLOYMENT IN 2017, BRITISH COLUMBIA British
Gauging Current Conditions:
 Gauging Current Conditions: The Economic Outlook and Its Impact on Workers Compensation Vol. 2 2005 The gauges below indicate the economic outlook for the current year and for 2006 for factors that typically
Treasury Forecasts of Company Tax Revenue: Back of the Envelope or Back to the Drawing Board?
 Treasury Forecasts of Company Tax Revenue: Back of the Envelope or Back to the Drawing Board? Sinclair Davidson 1 The last decade has seen Treasury make large forecast errors when forecasting company tax
OCTOBER 2016 UPDATE HIGHLIGHTS THE QUÉBEC ECONOMIC PLAN
 OCTOBER 2016 UPDATE HIGHLIGHTS THE QUÉBEC ECONOMIC PLAN october 2016 update highlights The québec EconomiC plan HIGHLIGHTS Highlights... 3 2015-2016: A $2.2 billion surplus recorded... 4 A balanced budget
Budget Paper D An UPDAte on FiscAl transfer ArrAngements
 Budget Paper D An Update on Fiscal Transfer Arrangements An Update on Fiscal Transfer Arrangements Contents the importance of transfers... 1 Recent Changes to Major Transfer Programs... 5 Looking Forward...
The Peterborough Census Metropolitan Area (CMA) spans the city of Peterborough and six other jurisdictions. The area is
 spans the city of Peterborough and six other jurisdictions. The area is") PETERBOROUGH CENSUS METROPOLITAN AREA Presented by the Credit Unions of Ontario and the Ontario Chamber of Commerce 1 Peterborough s housing market saw a banner year in 2015. The Peterborough Census Metropolitan
PETERBOROUGH CENSUS METROPOLITAN AREA Presented by the Credit Unions of Ontario and the Ontario Chamber of Commerce 1 Peterborough s housing market saw a banner year in 2015. The Peterborough Census Metropolitan
Quarterly Currency Outlook
 Mature Economies Quarterly Currency Outlook MarketQuant Research Writing completed on July 12, 2017 Content 1. Key elements of background for mature market currencies... 4 2. Detailed Currency Outlook...
Consumer Price Index report
 MBS Reports C o n s u m e r P r i c e I n d e x R e p o r t, J u l y 2 0 1 8 1 Consumer Price Index report J u l y 2 0 1 8 Highlights The Manitoba all-items Consumer Price Index (CPI) increased 3.3% on
Alberta Labour Force Profiles
 Alberta Labour Force Profiles 2011 Highlights For the purpose of this profile, youth are defined as persons aged 15 to 24 years. 1. Alberta Population Statistics Among the provinces, Alberta had the third