Nord Pool ASA Annual report 2005
|
|
|
- Andra Webb
- 5 years ago
- Views:
Transcription


1 Nord Pool ASA Annual report 2005 B U I L D I N G A S E C U R E M A R K E T


2


3 Contents Nord Pool in brief 4 Aggressive product range 6 A brief history 8 Key events Key figures 9 CEO s report 10 Energetic cross-border interaction 12 Robust, powerful and smoothly-functioning 14 Full openness 16 Continuous market surveillance 17 How power prices are set 18 First to trade EUAs 20 Directors report 22 Annual accounts 29 Profit and loss account 29 Balance sheet 30 Cash flow analysis 32 Accounting principles 33 Notes 35 Auditor s report 45 Glossary
4 Nord Pool in brief NORD POOL PROVIDES THE BASIS FOR ENSURING THAT THE NORDIC ELECTRICITY MARKET FUNCTIONS AS INTENDED. OPENNESS AND TRANSPARENCY FOR MARKET PARTICIPANTS ARE CRUCIAL FOR THE APPROPRIATE USE OF RESOURCES. PLAYERS IN THE POWER MARKET CAN BUY AND SELL ELECTRICITY AND ASSOCIATED FINANCIAL INSTRUMENTS IN THE CONFIDENT KNOWLEDGE THAT SUCH TRADING IS CONDUCTED ON EQUAL TERMS AND THAT ALL PARTICIPANTS HAVE ACCESS TO THE SAME INFORMATION. NORD POOL S STRUCTURE, SOLUTIONS AND SURVEILLANCE ENSURE A SMOOTHLY-FUNCTIONING MARKET. THE EXCHANGE ACCORDINGLY HAS A HIGH REPUTATION AMONG MOST PARTICIPANTS IN THE NORDIC ELECTRICITY MARKET. The core business of the Nord Pool group is trading and clearing of physicaldelivery and financially-settled power contracts in the Nordic region. Contracts worth a total of EUR 55.2 billion (NOK billion) were traded over Nord Pool during This makes it the world s largest power exchange and the leader in its field. Apart from physical-delivery and financially-settled power contracts, electricity certificates and European Union allowances (EUAs) for carbon dioxide emission are traded and cleared at Nord Pool. Trading and clearing EUAs was established as a new business area for the exchange in Nord Pool has clear ambitions to continue developing this product and to remain one of the world s leading exchanges in a new and highly challenging market. The Nord Pool group comprises the Nord Pool ASA group, its wholly-owned subsidiaries and associated companies. In addition to the parent company, the Nord Pool ASA group includes the wholly-owned Nord Pool Clearing ASA and Nord Pool Consulting AS subsidiaries. The Nord Pool group also embraces the Nord Pool Spot group, which includes parent company Nord Pool Spot AS and its wholly-owned subsidiary Nord Pool Finland Oy. Nord Pool ASA owns 20 per cent of Nord Pool Spot AS. In addition, Nord Pool has equity interests in Germany s European Energy Exchange AG (EEX) and an operating agreement for information technology systems with the French Powernext power exchange. Nord Pool ASA is owned by Statnett SF and Svenska Kraftnät, the transmission system operators in Norway and Sweden respectively. The Nord Pool group has 99 employees and is located in Oslo, Fredericia, Stockholm, Helsinki, Berlin and Amsterdam
 Elspot + Elbas Financial market Clearing Share of turnover by country 2005 Physical market (176 TWh) Financial market (786 TWh) Clearing(1 316 TWh) 3500 3000 2500")
5 Vision Nord Pool the world s leading power exchange. Market development (TWh) Elspot + Elbas Financial market Clearing Share of turnover by country 2005 Physical market (176 TWh) Financial market (786 TWh) Clearing(1 316 TWh) Norway 28.8% Sweden 35.9% Finland 20.4% Denmark 14.6% Others 0.3% Norway 50.5% Sweden 19.1% Finland 5.3% Denmark 6.7% Others 18.5% Norway 40.3% Sweden 19.2% Finland 5.6% Denmark 5.1% Others 29.9% Nord Pool ASA Nord Pool Spot AS Nord Pool Clearing ASA Nord Pool Consulting AS Nord Pool Finland Oy Nord Pool ASA: exchange for trading standardised financial power derivatives, electricity certificates and European Union allowances (EUAs) for carbon dioxide emissions. Nord Pool Clearing ASA: clearinghouse with its own licence for clearing and settlement of financial power derivatives in the Nordic market and EUAs in the European market. Separate company wholly-owned by Nord Pool ASA. Nord Pool Consulting AS: consultancy company with the focus on advising about the operation, development and creation of international deregulated power markets. Separate company wholly-owned by Nord Pool ASA

6 Aggressive product range NORD POOL WANTS TO BE CUSTOMER-FRIENDLY AND FORWARD- LOOKING, AND IS THEREFORE INVOLVED IN A CONTINUOUS PROCESS WITH CUSTOMERS AND THE AUTHORITIES CONCERNING THE CHOICE OF PRODUCTS AND CONTRACTS WHICH CAN BE OFFERED FOR SALE THROUGH THE POWER EXCHANGE. The products available on Nord Pool are usually divided into three principal categories: the physical market, the financial market and clearing. New products are constantly being developed within these segments in order to meet customer needs and the demands posed by the power market. Physical market An auction is held on every single day of the year through Nord Pool Spot. This sets a price based on supply and demand in the Nordic physical delivery market for all 24 hours of the coming day. This determines the Elspot price, the basis for calculating a system price which serves as the reference price for the financial market. Apart from electricity generators and heavy industry, participants in Nord Pool s spot market include distributors, electricity retailers and brokers, and investors. All these players must be physically connected to the central Nordic transmission grid and have balancing agreements with system operators in the area where the trade is to be made. In addition to the Elspot market, Nord Pool Spot operates the Elbas physical delivery power adjustment market for Sweden, Finland and eastern Denmark, where one-hour contracts are traded around the clock. These contracts are listed after the Elspot market has closed. Financial market Nord Pool provides a marketplace for trading in standardised forward and option contracts. These contracts are traded either because participants wish to hedge their physical generating commitments or consumption requirements at a given price, or because they want to speculate in the electricity market. To maintain good liquidity and thereby a satisfactory level of trading, both speculators and players primarily seeking to hedge their physical consumption or deliveries are important for Nord Pool and the market

 is also the reference price for the financial market.")
7 Clearing of OTC contracts share of turnover by country in per cent Norway Sweden Finland Denmark Others Contracts in the financial market have a trading horizon of up to four years, with different contract series for days, weeks, months, quarters and years. The physical and financial power markets are closely related to each other, and mutually dependent on functioning if the overall power market is to operate satisfactorily. The system price (Elspot price without bottlenecks) is also the reference price for the financial market. In addition to the financial market for trading power contracts, Nord Pool established a financial market in 2005 for trading European Union allowances (EUAs) for carbon dioxide emissions. Clearing Clearing a trade through Nord Pool means that Nord Pool Clearing enters into the contract as a contractual counterparty and guarantees settlement. The clearinghouse can do this because it sets requirements for collateral from Nord Pool members to meet future settlements. That reduces the financial risk for those trading on the exchange. Nord Pool Clearing also offers clearing of nonexchange-traded (over-the-counter) standardised financial power contracts Clearing of OTC market contracts (Figures in GWh per month) Financial market turnover (Figures in GWh per month)
8 A brief history 1991 The Norwegian Storting (parliament) resolves to deregulate the market for power trading Statnett Marked AS (now Nord Pool ASA) is established Trading in futures contracts is introduced on the financial market. Nordic energy ministers agree to expand Nordic cooperation on electricity supplies Nord Pool ASA is established as a Swedish-Norwegian power exchange Finland is integrated in the Nordic power market. Nord Pool opens an office at Odense in Denmark. Nord Pool Consulting AS is established Elbas is launched as a separate market for power balance adjustment in Finland and Sweden. Nord Pool also begins to release daily data on OTC market trades. Trading begins in Elspot s Denmark West (Jutland/Funen) area The Nordic power market is fully integrated when Denmark East becomes a Nordic power exchange price area. Nord Pool helps to establish Germany s first power exchange, the Leipzig Power Exchange (LPX), and takes a 35 per cent holding Nord Pool is licensed as a regulated exchange and as a clearinghouse. The business is divided between two companies. Its spot market activities are organised in a separate company, Nord Pool Spot AS First downturn in trading and clearing of financial power contracts as a consequence of uncertainties relating to low supplies of power with associated high prices Change for the better in the market, with an overall increase of eight per cent in financial market turnover compared with the year before. Key events 2005 Positive market trends The accumulated volume traded in Nord Pool s financial market increased by 33 per cent over the year, from 590 TWh in 2004 to 786 TWh. Nord Pool s share of this market also grew from 33.8 per cent in 2004 to 38.2 per cent. Trading in EUAs On 11 February, Nord Pool became the first exchange in the world to start trading in European Union allowances (EUAs) for carbon dioxide emissions. From that date until 31 December, million tonnes of carbon dioxide were traded and cleared over Nord Pool (13.2 million tonnes on the exchange and 14.7 million tonnes in the OTC market). Sixty-four participants from 11 countries had joined the EUA exchange at 31 December. Interesting consultancy assignments Nord Pool Consulting continued its role as policy consultant or development adviser in other countries and continents. Nord Pool Consulting worked during 2005 in such countries as Turkey, Romania and elsewhere in South-eastern Europe, Ireland, Iceland, India and southern Africa. Continued focus on market surveillance Nord Pool has now established a disciplinary committee. Its job will be to consider cases where Nord Pool s market surveillance committee suspects that the rules have been broken, and to recommend possible sanctions to the board of Nord Pool. A final decision on sanctions will continue to rest with the board. The disciplinary committee will serve as an advisory body for Nord Pool s board. Nord Pool has adopted stricter rules and raised the level of fines for breaching them. The maximum penalty has been increased from NOK 1 million to NOK 10 million, and Nord Pool has implemented new EU regulations in its rules which include the market abuse directive
 Value (NOK bn) 176 43.5 167 39.1 5.4% 11.")
 Value (NOK bn) 786 189.5 1 316 209.0 2 102 399 590 148.5 1 207 201.6 1 797 350 33.2% 27.6% 9.0% 3.5% 17.0% 14.0% Number of participants Total number of participants at 31 Dec 330 323 2.")
9 Key figures Activity by Nord Pool Spot AS Percent change Physical market Volume (TWh) Value (NOK bn) % 11.3% Activity by the Nord Pool ASA group Financial market Clearing of bilateral market trades Total value of traded and cleared volumes Volume (TWh) Value (NOK bn) Volume (TWh) Value (NOK bn) Volume (TWh) Value (NOK bn) % 27.6% 9.0% 3.5% 17.0% 14.0% Number of participants Total number of participants at 31 Dec % Average system price Average system price for the year NOK/MWh (2.9%) Highest system price NOK/MWh % Lowest system price NOK/MWh % Nord Pool Consulting Bilde Jordklode/ Consulting Nord Pool Consulting is wholly-owned by Nord Pool ASA. Advising on the operation and establishment of power markets internationally is its main business. With seven employees, the company concluded several major contracts in 2005 which gives it a good financial position and a long-term portfolio of assignments. It is currently working on assignments in such nations as Turkey, Romania, Hungary, Ireland, India and southern Africa
10 CEO s report Energetic further development BOOM FOR ELECTRICITY TRADING WAS THE HEADLINE WHEN SWEDISH BUSINESS DAILY DAGENS INDUSTRI COVERED OUR VOLUMES AND FINANCIAL RESULTS IN THAT WAS AN APPROPRIATE DESCRIPTION, BECAUSE WE EXPERIENCED A SUBSTANTIAL INCREASE IN TRADING VOLUMES AND IMPROVED PROFITS COMPARED WITH THE YEAR BEFORE. AS THE COMPANY S CHIEF EXECUTIVE, I AM SATISFIED WITH THIS PROGRESS. AT THE SAME TIME, IT MUST BE EMPHASISED THAT WE FACE TOUGHER COMPETITION. THAT MEANS HARD WORK FOR THE WHOLE GROUP IF WE ARE GOING TO MAINTAIN THE POSITIVE TREND WE ENJOYED IN SO WE CANNOT ALLOW OURSELVES TO RELAXED INTO A SATISFIED ATTITUDE AND THINK THAT PROGRESS WILL COME OF ITSELF IN In an ever more demanding market, we must adapt to the challenges we meet. We have accordingly strengthened our sales force in 2006 in order to gear up even further for the struggle over new customers and increased volumes. We are a business in constant change and development. Activities in 2005 served as a good example of this. All trades on Nord Pool were converted to euros and a number of new products listed. Establishing a market to trade European Union allowances (EUAs) for carbon dioxide emissions illustrates our adaptability and the ability of our staff to make a commitment to Nord Pool. On 11 February 2005, we became the first exchange in the world to begin trading in EUAs. A number of others followed suit in the course of the year. We believe that only a limited number of exchanges will survive in this market. Our clear aim is to be one of them, and we established ourselves during 2005 as the second largest exchange in this segment. We nevertheless see a further potential, and will be making a determined commitment to strengthening our position and increasing liquidity in the EUA market. Like food and water, power supplies are essential for our society and its way of life. So it is good and appropriate that the electricity market and our role are the subject of discussion among politicians, the general public and in the media. This market can be difficult to understand. We see it as our job to help ensure that the debate on the power market is based on facts and knowledge rather than assumptions and imprecise information. A constructive discussion leading to good decisions must build on facts and on assessments rooted in these facts. We work for a smoothly functioning Nordic power market. So it is natural for us to comment on the market and the challenges it faces. As I see it, the Nordic electricity market currently functions in line with intentions. At the same time, I would emphasise that the market faces challenges and requires a long-term approach to the decisionmaking process. We have accordingly strengthened our sales force in 2006 in order to gear up even further for the struggle over new customers and increased volumes. To ensure balance in the power market, it is important that politicians in the Nordic region take decisions which secure new generating capacity and contribute to investment which can reduce bottlenecks in the Nordic transmission system. These are two important factors in ensuring that we


11 can continue to meet the demand for electricity in the best possible way through a smoothly-functioning power market. A market of this kind requires that increased demand can be met with supply-side growth. If supplies fail to rise, growing demand must be balanced through the price mechanism. With limited opportunities to replace electricity consumption with other energy sources in the short term, this could mean very substantial price fluctuations which are not fortunate in either social or market terms. A commodity exchange is subject to the fundamental conditions prevailing in its market. Availability of generating capacity, bottlenecks and a sufficient number of participants on both supply and demand sides are examples of such conditions. These important factors are not determined by the power exchange, but by others. However, we in Nord Pool will do what we can within the confines of the instruments at our disposal to ensure that the market functions as well as possible. One of our most important tasks is to ensure confidence in and within the market. We do this in part by facilitating a marketplace which ensures openness, transparency and equal information available to everyone trading on Nord Pool. Another instrument is our market surveillance department. This function is intended to ensure that possible breaches of Nord Pool s trading rules are exposed. We have established a special disciplinary committee and increased the maximum fine for breaches of the rules from NOK 1 million to NOK 10 million. This committee will be empowered to make recommendations to our board, and will help to ensure a more secure and appropriate consideration of possible rule violations. We give weight to a good dialogue with our customers. In 2005, a customer satisfaction survey showed that they are generally satisfied. They nevertheless want stronger cooperation and faster feedback. We are grateful for the suggestions made, and have got to grips with them in order to improve even further in these areas. We believe that 2006 will be another good and exciting year for us, when our customers will once again receive confirmation of the value of trading on the world s leading power exchange. Torger Lien President and CEO

12 Energetic cross-border interaction Better resource utilisation More environment-friendly Greater delivery uncertainty T he best possible resource utilisation at the right price is the basis for the Nordic power market. Since demand for electricity varies over the day and the year, flexibility in power generation is also a requirement. Electricity supplies in the Nordic power system derive from a variety of sources, with hydro, wind, nuclear and coal as the most important. Their generating flexibility varies, and they interact harmoniously in the Nordic market. Hydropower is characterised by its ease of regulation, and is generated at the same moment it is consumed. Storing the water in reservoirs means that it interacts perfectly with wind power, for example, which only generates electricity when a wind is blowing. In other words, hydropower output can be reduced when the wind blows and resumed during calm periods. The best resource utilisation is achieved when different types of generation are combined in a single market. Coal-fired electricity and nuclear power in particular represent energy sources which cannot be regulated to the same extent to match variations in consumption during the day. So hydropower also combines well with these generation sources, since it can be increased to meet daily demand peaks. Coal-fired and nuclear generation can thereby be kept at a lower level than would otherwise have been the case. This is environment-friendly. Secure power supplies Almost all electricity in Norway is generated from hydropower stations, while this energy source accounts for about 50 per cent of Swedish output. Variations in precipitation from year to year mean that the Nordic region s hydropower output can fluctuate substantially over time. Since generating output changes on an annual basis, and because different energy sources have varying properties, the Nordic region is considerably better placed in terms of security of supply than would have been the case had no transmission links existed between these countries. Lower prices Exchanging electricity across national boundaries also yields lower average prices for power than would have been the case if each country was self-reliant. A broad region, with Nord Pool as the energy exchange, ensures an accessible, open and transparent market which contributes to more efficient resource utilisation. Exchanging electricity across national boundaries also yields lower average prices for power than would have been the case if each country was self-reliant

 600 500 400 300 200 100 0 1996 1997 1998")

13 Turnover Elspot (Figures in GWh per month) System price (Figures in NOK/MWh per month) Turnover Elbas (Figures in GWh per month)

14 Robust, powerful and smoothly functioning Internationally recognised Well-proven price mechanism Potential for improvements The Nordic power market has justifiably been called the world s most functional. Nord Pool believes that it works as intended. Challenges are nevertheless faced which must be overcome if it is also to remain the world s best functioning market in the long term. Further concentration raises concerns Five players currently account for about half the turnover on the Nordic power market. They compete with each other across national boundaries, which provides satisfactory competitive conditions. Competition would not have been adequate were each of these participants to operate in its own market. At the same time, Nord Pool believes that caution needs to be exercised in allowing the five biggest players to expand further to avoid circumstances in which it might appear that certain participants control the power market. Competition would not have been adequate were each of these participants to operate in its own market


15 Hampered by bottlenecks Low capacity at certain hubs in the Nordic electricity transmission system leads to power supply variations between different areas. Capacity constraints can be challenging for the power market, but a bottleneckfree grid would demand investment on a scale which would be unprofitable in socio-economic terms. At the same time, it is important that transmission constraints in the grid are not so large that they threaten a smoothly-functioning power market. Bottlenecks have created several sub-markets which lack the benefits available to a large market. The price of electricity in one sub-market deviates from that charged in other sub-markets because power supplies are restricted. Developments in recent years have tended towards the imposition of large capacity constraints on a number of days of the year and in a number of hours per day. Allowing this development to continue would be unfortunate. Reversing the trend means that the investment required to reduce bottlenecks in the grid must be made. Nord Pool is accordingly pleased to note that the Nordic transmission system operators have resolved to increase capacity in five priority sections. The price of electricity in one sub-market deviates from that charged in other sub-markets because power supplies are restricted
16 Uniform conditions Transparent market Continuous market surveillance Full openness The power market only functions as intended when participants have confidence in it. That also applies to their relationship with Nord Pool. Trust and integrity are fundamental to the operation of the power exchange. It is accordingly extremely important that all trading of physical power or power derivatives over the exchange is based on predictable rules which ensure openness, transparency and integrity, both at Nord Pool and among Nord Pool s customers. Nord Pool Spot, which is responsible for organising the physical market, is regulated by the Norwegian Water Resources and Energy Directorate (NVE), while the organisation of trading in financial derivatives through Nord Pool and the settlement of such contracts at Nord Pool Clearing are regulated by the Financial Supervisory Authority of Norway. Nord Pool also gives weight to maintaining a good dialogue with the regulators in the other Nordic countries. In addition to extensive statutory regulation, all members of Nord Pool are required to sign a contract which specifies rules of conduct for market participants on the power exchange. These include the requirements and duties resting on participants for reporting information of significance to the market, and what constitutes market violations. Nord Pool is concerned to ensure that these rules are stringent. At the same time, keeping them simple is important for players to be persuaded to use the power exchange. Trust and integrity are fundamental to Nord Pool s operation


17 Continous market surveillance Nord Pool has a separate department which is responsible for surveillance of the exchange s physical and financial markets. This market surveillance team has the authority to investigate all trades concluded over Nord Pool to ensure that prevailing rules have been observed. Should illegal behaviour be detected, Nord Pool can impose fines of up to NOK 10 million. If breaches of the Norwegian Securities Trading Act are suspected, the case must be sent to the Financial Supervisory Authority, which will investigate it in parallel with Nord Pool. The authority can pass the case on to the police for further investigation should it find that criminal acts may have been committed. All trades over the power exchange must follow legal procedures. Openness, price transparency and equal treatment of all participants are crucial if Nord Pool is to retain the trust of market players over time
18 How power prices are set Equal terms for everyone The weather influences market forces Reflects expectations Restrictions in transmission capacity The market price in Nord Pool is determined in a way which ensures that generation and consumption of electricity are balanced for every hour of the coming day. In the short term, the price of power depends on factors such as temperature fluctuations, capacity restrictions, reservoir levels, bottlenecks, the cost of other energy sources like coal, gas and oil, and prices in continental Europe. European Union allowances (EUAs) for carbon dioxide emissions also affect the price because they impose an extra cost on part of the electricity generated in the Nordic region. Price formation in the market is determined by the relationship between generation and desired consumption, and by transmission capacity to and between the various regions. Demand for power has increased in recent years without a corresponding construction of new generating capacity. This could also impose a further need for additional transmission links. In addition to its physical market, Nord Pool operates a large financial market. Participants in the latter can trade power derivatives with terms of up to four years. Players participate in this market because they want either to hedge against future movements in the spot price or to speculate in an attempt to secure a price gain. The system price in the financial market is the reference price. It is a calculated spot market price based on the assumption that no transmission constraints exist. It is extremely important that the reference price reflects the underlying physical conditions and is regarded as accurate by market participants so that the necessary confidence can be achieved. The price is announced daily within a fixed time interval. The best indication that the market and its participants have this confidence in Nord Pool and the company s role is that some NOK 400 billion is invested annually in financial instruments based on the reference price. This also helps make Nord Pool the world s leading power exchange, and its largest. Price formation in the market is determined in the rather longer term by the relationship between generation and desired consumption and by transmission capacity in the various regions


19 System price 2005 (Figures NOK/MWh per week) Jan Feb Mar Apr May Jun Jul Aug Sep Oct Nov Dec
 FOR CARBON DIOXIDE.")
20 First to trade EUAs Help to reduce carbon emissions Products cover the whole Kyoto period Tough competition Clearing offered NORD POOL WAS THE FIRST EXCHANGE IN THE WORLD TO OPEN TRADING IN EUROPEAN UNION EMISSION ALLOWANCES (EUAS) FOR CARBON DIOXIDE. The marketplace was established immediately after the EU introduced the world s first system for trading such allowances. Nord Pool also offers clearing of EUA trades. Trading EUAs allows an enterprise or country to buy the right to release carbon dioxide. The regime is intended to help reduce overall global emissions of this greenhouse gas. Other exchanges followed A number of other exchanges also initiated EUA trading during the year, and competition over this market is stiff. Nord Pool is constantly working to develop its products while ensuring competitive fees. From the opening of the market on 11 February until 31 December, a total of 27.9 million tonnes of carbon dioxide were traded and cleared over Nord Pool. Three alternative forward contracts were available when the market opened. Trading forward means that a price and a volume are agreed on the trading day for delivery at a future date. Nord Pool also introduced a spot contract in November. It currently offers products covering the whole Kyoto period from 2008 to Being able to offer contracts which allow participants to hedge themselves throughout the Kyoto period and ensure a predictable investment horizon is important for the power exchange. Nord Pool is making a global commitment to the emission allowance market. Contributing to efficient trading Trading on Nord Pool provides transparency about the identity of participants and the prices are achieved. With an open and transparent exchange, where trades are conducted within an established regulatory framework, Nord Pool contributes to an efficient and well-functioning market for trading EUAs

21 EUA trading boosts power prices Prices have risen substantially since trading in EUAs began. They were close to EUR 30 per tonne carbon dioxide in June, but lay around EUR towards the end of the year. In line with intentions, electricity prices are higher than they would have been without the introduction of the EUA regime. This partly reflects the additional cost imposed on thermal power generation by the need to buy allowances. The issue of what effect these increased costs have on electricity prices and how much the latter rise as a result of emission trading depends on a number of conditions, and is thereby the subject of debate. The price of an EUA accordingly dominates the discussion. This has varied substantially over the year, reflecting political decisions particularly in relation to the allocation of allowances. Hydropower supplies, prices for oil, coal and gas, and temperatures are also among the factors which influence EUA prices. Aggressive commitment for 2006 Providing a marketplace for trading EUAs is a natural activity for Nord Pool. One of several important factors in this context is the substantial proportion of electricity utilities among its customers. A large number of these participants also operate in the market for carbon dioxide emission allowances. Nord Pool is making a global commitment to the emission allowance market. The goal is a substantial increase in volumes and members. In light of the Kyoto protocol, the exchange will also investigate opportunities for establishing new products in the time to come
22 Directors report 2005 Big increase in volume and good results THE VOLUME TRADED IN NORD POOL S FINANCIAL MARKET INCREASED BY 33 PER CENT OVER THE YEAR, FROM 590 TWH IN 2004 TO 786 TWH IN NORD POOL S SHARE OF THE FINANCIAL MARKET ALSO GREW STRONGLY, FROM 33.8 PER CENT TO 38.2 PER CENT. AN INCREASE OF ROUGHLY 25 PER CENT IN TRANSACTIONS CONTRIBUTED TO THIS PROGRESS. THE EXCHANGE HAD 330 MEMBERS AT 31 DECEMBER. THE OVERALL VOLUME CLEARED BY NORD POOL CLEARING ASA CAME TO TWH, COMPARED WITH TWH IN CLEARING OF CONTRACTS TRADED IN THE BILATERAL (OTC) MARKET AMOUNTED TO TWH AS AGAINST TWH THE YEAR BEFORE. THESE DEVELOPMENTS HELPED TO INCREASE OPERATING PROFIT FOR THE GROUP FROM NOK 47.7 MILLION IN 2004 TO NOK 54.9 MILLION. The Nord Pool board is very satisfied with developments in the financial market. After the strong growth in 2005, volume there has reached a satisfactory level. A particularly positive contribution to the rise in traded and cleared volumes over Nord Pool was recorded in the first and last months of the year. Reasons for the volume growth are complex. Normalisation of reservoir levels during the winter of probably contributed to increased trading. The introduction of the market in European Union allowances (EUAs) for carbon emissions and growing awareness of the link between prices for EUAs and power prices have also boosted activity. Shorter contracts showed a particular increase in volume, but contracts for up to a year also experienced growth. The reference price for the financial market is provided by the system price (an average value calculated for a spot market without bottlenecks). In 2005, the average system price was EUR 29.22/MWh (NOK /MWh) compared with EUR 28.92/MWh (NOK /MWh). European Union allowances Nord Pool became the first exchange in the world to begin trading EUAs on 11 February From that date until 31 December, a total of million tonnes of carbon dioxide were traded and cleared over Nord Pool (13.2 million tonnes over the exchange and 14.7 million in the OTC market). The market had 64 participants from 11 countries at 31 December. Where EUA volumes are concerned, the board is satisfied that Nord Pool appears to have established itself in this market. However, competition is very stiff and the board takes the view that purposeful efforts must be made in the time ahead to increase volumes and liquidity in the EUA market. The board sees clear advantages for exchange and customers alike in the fact that Nord Pool offers financial products in both power and EUA markets. Not only are a number of Nord Pool s customers active in both markets, but a clear link also exists between prices in the power and EUA sectors. The Nord Pool ASA group comprises parent company Nord Pool ASA and the wholly-owned subsidiaries Nord Pool Clearing ASA and Nord Pool Consulting AS. Nord Pool ASA also owns 20 per cent of Nord Pool Spot AS and 17.4 per cent of European Energy Exchange (EEX). The group s head office is located at Lysaker outside Oslo. Operations are also conducted in Stockholm, Helsinki and Fredericia. In addition, an office is being established in Amsterdam. Nord Pool has in many cases contributed policy input on power market development in other countries. This position

23 was further strengthened during 2005, which the board finds very satisfactory. Where Nord Pool s future strategy is concerned, the board assumes that the group will continue to focus primarily on the further development of the Nordic electricity market. New business opportunities will be assessed within this framework and in line with Nord Pool s object of building a secure market. Utilising existing expertise in the group has given participants access to a regulated marketplace for trading European Union allowances (EUAs) for carbon emissions. This market has clear parallels with the power market. Nord Pool will give great weight to a dialogue with customers in the further development of the business and the products offered. SAPRI Nord Pool s system for spot market trading Nord Pool Spot utilises SAPRI as its system for spot market trading. Both EEX and Powernext have been licensed to use SAPRI, but the EEX licence expired during the year. A multinational exchange the Southern African Power Pool is being established for southern Africa with its base in Zimbabwe. Together with Nord Pool Consulting, Nord Pool will be delivering the necessary expertise and software including SAPRI to the new exchange. Nord Pool s monitoring bodies On the basis of their status as a regulated exchange and a clearinghouse respectively, Nord Pool and Nord Pool Clearing are subject to legislation which requires them to maintain partly overlapping and extensive controls through various types of monitoring body. Although Nord Pool is a Nordic exchange, its head office is located in Norway. This means that Nord Pool is subject to Norwegian jurisdiction, including supervision and regulation by the Financial Supervisory Authority of Norway. Both companies have a control committee, and an agreement to provide an internal audit function has been concluded with PricewaterhouseCoopers in order to satisfy the internal control regulations. In addition, a risk committee has been created to ensure that internal controls are implemented. Where relations with the market are concerned, Nord Pool s own market surveillance department has an important role to play by helping to ensure that all trading takes place within the framework specified by the prevailing regulations. Accounts for 2005 The Nord Pool ASA group s operating income totalled NOK million, up from NOK million the year before. Operating profit was NOK 54.9 million compared with NOK 47.7 million in Operating revenues for Nord Pool ASA in 2005 came to NOK million, compared with NOK million the year before. Operating profit declined somewhat from NOK 10.7 million in 2004 to NOK 8.5 million. This primarily reflects higher system expenses and costs associated with the creation of the EUA market. The board is satisfied with the results achieved in 2005, but will maintain a focus on costs to ensure that the group remains strongly placed in competition with other energy markets. It will accordingly take a very cautious approach to permitting permanent increases in the level of costs before a corresponding level of revenues has been achieved. Within certain areas, an assessment of that kind must be made in a long-term and strategic perspective. One example is the launch of the EUA market in The board will continue Nord Pool s commitment to this market during Liquidity for the group is satisfactory, and working capital at 31 December totalled NOK million compared with NOK million a year earlier. The balance sheet at the same date was NOK 716 million compared with NOK million a year earlier. Following the payment of a dividend of NOK 22 million, equity for the Nord Pool ASA group at 31 December amounted to NOK 514 million as against NOK million the year before. Leading power exchange At 31 December, the wholly-owned Nord Pool Clearing subsidiary had an open balance of NOK 54.9 billion. This represents the gross cleared positions of clearing members. Collateral requirements for members vary in line with market conditions. They amounted to NOK 13.5 billion at 31 December 2005, when total collateral posted amounted
24 NOK 24.4 billion. Both collateral requirements and postings increased from 2004, partly because of the introduction of the EUA market. The board is aware that the latter, with a number of new participants from geographically more distant areas, presents new challenges in monitoring the company s progress. The board considers collateral requirements and postings to be adequate. It also deems the group s equity to be adequate in relation to the collateral posted by members during the year. Nord Pool s policy on financial risk management lies within the framework specified by the regulations in chapter 6 of the Norwegian Securities Trading Act concerning a clearinghouse. In accordance with section 3-3a of the Norwegian Accounting Act, the board confirms that the going concern assumption is realistic. The group s financial position is satisfactory. No events of significance for the 2005 annual accounts had occurred up to the date they were presented. Organisation and working environment The Nord Pool ASA group had 72 employees at 31 December, including 66 in Norway and six in Sweden (46 in Nord Pool ASA, 19 in Nord Pool Clearing ASA and seven in Nord Pool Consulting AS). One employee was on leave of absence at 31 December. The group workforce increased by one person, while the number of employees in Nord Pool ASA declined by two people. At 31 December, the Nord Pool Spot AS affiliate had 21 employees 14 in Norway, four in Sweden and three in Denmark, plus a further six in its wholly-owned Nord Pool Finland Oy (formerly EL-EX Oy) subsidiary. Sickness absence in Nord Pool ASA group came to 3.52 per cent corresponding to 585 working days compared with 1.80 per cent the year before. For the group, sickness absence was 3.68 per cent 389 working days as against 2.00 per cent the year before. This increase primarily reflects a larger number of employees on long-term sick leave. A working environment survey was conducted for the Nord Pool ASA group in May Its results were satisfactory. Work on improving the working environment is continuing in all parts of the group, and forms part of management training in Nord Pool. No lost-time accidents or personal injuries were suffered in Sixteen of the 46 Nord Pool ASA employees were women and 30 were men, or 34.8 per cent and 65.2 per cent respectively. The Nord Pool board of directors comprises two women and six men, while the corporate management team consists of two women and six men. Women occupy 10 per cent of other senior and middle management posts. Nord Pool is very concerned to recruit more female managers at all levels in the organisation, and has initiated a process to achieve that. The group recruited two women to the corporate management in The genders are well balanced in most Nord Pool departments, with a preponderance of males in the financial market and information technology. One element in Nord Pool s human resources policy is equal pay for equal work, which means that women and men in equivalent jobs receive the same pay providing they possess comparable expertise and experience. Pay figures for 2005 (excluding top management) show that annual pay for male employees was 31 per cent higher on average than for the company s female staff. This big difference primarily reflects the fact that more women occupy posts which do not require higher education. There is also a preponderance of male middle managers. The company wants to encourage employees of both genders to establish solutions which make it easier to combine work and family life. One person was on leave of absence at 31 December, when the company also had six part-time employees. All of these were women. Nord Pool s operations have no noticeable impact on the natural environment. No part of its business is regulated by environmental permits or enforcement notices. Allocation of net profit The board wants a predictable dividend policy. Dividend will

25 be pitched at a level which helps to secure the company s financial freedom of action, so that it can reach its targets as planned. It is proposed to allocate the net profit for Nord Pool ASA to the payment of a dividend of NOK 22 million. Following this payout, the equity will be NOK million, with distributable equity totalling NOK million. Outlook By supporting a strengthening of the administration on the sales side, the board has signalled an expectation of increased volumes and membership in Nord Pool during That applies to both financial and EUA markets. The EU has introduced an extensive set of directives and regulations covering the financial market in recent years. Part of these regulations will also be significant for Nord Pool as a company and the electricity market in general as they are adopted into law in the various Nordic countries. The market abuse directive was implemented in Norway with effect from 1 September 2005, for instance. The new regulations will not mean any major changes where Nord Pool is concerned, since it lies well ahead of corresponding commodity exchanges in developing rules and surveillance systems which help to ensure equitable
26 and secure trading for market participants. Nord Pool nevertheless takes a positive view of the fact that the EU has developed a set of common rules which will apply to all exchanges and regulated marketplaces in the European Economic Area. Harmonising the regulatory framework will clearly benefit the European market. Nord Pool will again devote the necessary resources to market surveillance in 2006, not only to expose possible abuse but also to prevent illegal or unacceptable behaviour. In order to strengthen this work even further, Nord Pool will establish a disciplinary committee in This body will consider possible violations and have the right to recommend possible sanctions to the Nord Pool board. The creation of this committee stems from one case in particular where the board saw a need to ensure additional sanctions for Nord Pool. Active work by the market surveillance department is important for maintaining confidence in the exchange and the market, and these efforts will be given higher priority in the future. The board expects an overall profit for the group in 2006 which is at least on a par with the 2005 figure. Lysaker, 17 February 2006 Odd Håkon Hoelsæter Chair Jan Olof Magnusson Deputy chair Peter Thelin Elisabeth Westberg Eva Granly Fredriksen Bjarne Aamodt Knut Rabbe Robert Lillefloth Torger Lien President and CEO


27 Odd Håkon Hoelsæter Chair Elisabeth Westberg Jan Magnusson Deputy chair Bjarne Aamodt Eva Granly Fredriksen Knut Rabbe Peter Thelin Robert Lillefloth Torger Lien President and CEO

28
29 Profit and loss account Nord Pool ASA Nord Pool group Amounts in NOK Note Fee revenues Service agreements 3, Other operating income Total operating income Trading and clearing fees Depreciation 11, Payroll expenses 5, Other operating expenses 6, Total operating expenses Operating profit Income from associated companies Net financial items 9,10 (697) Profit before taxes Taxes Net profit Allocations: Dividend
30 Balance sheet Assets Nord Pool ASA Amounts in NOK Note Nord Pool group Assets Fixed assets Intangibles Computerised trading systems Deferred tax benefit Total intangibles Tangible fixed assets Financial fixed assets Investment in subsidiaries Investment in associated companies Investment in other companies Loans to group Total financial fixed assets Total fixed assets Current assets Accounts receivable Accounts receivable, group Group receivables Other receivables Total receivables Cash and bank deposits Total current assets Total assets
31 Balance sheet Equity and liabilities Nord Pool ASA Amounts in NOK 1000 Note Nord Pool group Equity and liabilities Equity Paid-in equity Share capital ( shares at NOK each) 15, Share premium reserve Total paid-in equity Earned equity Other equity Total earned equity Total equity Liabilities Provisions Pension obligations Total provisions Other long-term liabilities Subordinated loan Total long-term liabilities Current liabilities Accounts payable Tax payable Fees payable to public authorities Dividend Other current liabilities Total current liabilities Total liabilities Total equity and liabilities Lysaker, 17 February 2006 Odd Håkon Hoelsæter Jan Olof Magnusson Peter Thelin Elisabeth Westberg Chair Deputy chair Eva Granly Fredriksen Bjarne Aamodt Knut Rabbe Robert Lillefloth Torger Lien President and CEO
32 Cash flow analysis Nord Pool ASA Amounts in NOK 1000 Nord Pool group Cash flow from operating activities Profit for the year after taxes (69) (260) Loss/(gain) on sale of tangible fixed assets (260) (69) Ordinary depreciation (1 308) Change in accounts receivable 127 (4 001) (439) (246) Change in accounts payable (8 327) Change in pension liabilities Change in investment or financing activities (4 291) (11 422) Change in other accrual items Net cash flow from operating activities Cash flow from investment activities Proceeds from sale of tangible fixed assets (5 544) (6 751) Payment for purchases of tangible and intangible fixed assets (6 850) (17 682) (2 776) - Payment for shares in Nord Pool Consulting - - (7 946) (6 386) Net cash flow from investment activities (6 485) (17 308) Cash flow from financial activities (14 000) (20 000) Dividend payments (20 000) (14 000) (14 000) (20 000) Net cash flow from financial activities (20 000) (14 000) (4 378) (2 370) Net change in cash and bank deposits Cash and bank deposits at 1 January Cash and bank deposits at 31 December
33 Accounting principles The annual accounts have been prepared in accordance with the Norwegian Accounting Act of 1998 and Norwegian generally accepted accounting principles. Corporate structure Nord Pool is the marketplace for trading financially settled power contracts in the Nordic countries, and for the international commitment relating to physical delivery and financially settled power contracts. Nord Pool is owned by Statnett SF and Affärsverket svenska kraftnät. Nord Pool Clearing is the clearinghouse for the Nordic financial power market, and wholly owned by Nord Pool ASA. Nord Pool Spot is the marketplace for organised trade in physical delivery power contracts in the Nordic countries. It is owned 20 per cent by Nord Pool and 80 per cent by the four Nordic transmission system operators. Nord Pool Clearing and Nord Pool Spot currently purchase most of their administrative services from Nord Pool. Consolidation principles The group s consolidated accounts comprise the accounts of parent company Nord Pool and the Nord Pool Clearing and Nord Pool Consulting subsidiaries. The group accounts are prepared as if the group were a single financial entity. Transactions between companies in the group are eliminated, and the group accounts are prepared in accordance with uniform principles since the subsidiaries apply the same accounting principles as the parent company. Nord Pool Clearing and Nord Pool Consulting are recorded in the group accounts on the basis of the parent company s acquisition cost. The acquisition cost is allocated to identifiable assets and liabilities in the subsidiary. Associated companies are valued in accordance with the equity method in the group accounts. The group s share of profit in an associated company is its proportionate share of net profit in the associated company, less any internal gains and depreciation of surplus value because the cost of the shares exceeds the acquired share of booked equity. The share of profit in associated companies is shown in the profit and loss account under Income from associated companies. When consolidating branch office accounts in foreign currencies, exchange rates prevailing at the close of the accounting year are applied. Subsidiaries/associated companies Subsidiaries are valued in accordance with the cost method in the parent company accounts. Investments are valued at the acquisition cost of the shares unless a write-down has been necessary. Investments are written down to market value if the decline in value is not deemed to be temporary and when considered necessary in accordance with generally accepted accounting principles. Write-downs are reversed if the conditions for the write-down are no longer present. Associated companies are valued in accordance with the cost method in the Nord Pool group accounts. Income Power contracts with a time horizon of up to four years are traded in the financial market. These comprise financially settled futures, forward and option contracts. The contract value of financial market power trading is not recorded in the accounts. Fees The Nord Pool group s income base comprises: set-up fees annual fees trading fees clearing fees Set-up (entrance) fees are recorded to income in full at the time a participant is admitted to trading and/or clearing. Trading and clearing fees in the financial market are recorded to income at the time the trade is formally entered into. Clearing fees for contracts traded on the OTC market are recorded to income at the time such contracts are registered for clearing. Classification and valuation of balance sheet items Current assets and liabilities include items which fall due within one year of their acquisition date, and items associated with the business cycle. Other items are classified as fixed assets or long-term liabilities. Current assets are valued at the lower of acquisition cost or market value. Current liabilities are recorded in the balance sheet at face value at the time of the transaction. Fixed assets are recorded at acquisition cost. Upon a change in value not deemed to be temporary, the affected fixed asset is written down. Long-term liabilities are recorded in the balance sheet at their face value on the date they are assumed. Receivables Accounts receivable and other receivables are recorded in the balance sheet at face value after provision for expected bad debts. Intangible assets Intangible assets are recorded in the balance sheet to the extent that financial benefits associated with the intangible asset in question can be identified. If such benefits cannot be identified, the expenses are recorded as costs on a current basis. In-house development In-house development of proprietary software systems is capitalised at its calculated cost. Foreign currency Accounts receivable and payable in foreign currency are valued at the year-end exchange rate. Translation of assets and liabilities for the branch offices in Sweden is also done at the year-end exchange rate. Tangible fixed assets Tangible fixed assets are recorded in the balance sheet and depreciated over the expected useful life of the assets. Direct maintenance costs related to tangible assets are currently recorded as operating expenses, whereas upgrades and improvements are added to the cost bases of the operating assets and depreciated at the same rate as the assets to which they refer. Pensions The Nord Pool group has pension plans which provide employees with the right to defined future pension benefits (defined benefit plans). Benefits are based on the number of years of employment and pay at retirement age. Accrued pension rights are primarily secured through pension plans in Statnett SF s pension fund. In addition, the Nord Pool group has early retirement plans (AFPs) financed from operations. Premiums paid to the pension funds are based on actuarial calculations. Pension assets are primarily invested in securities. Pension liabilities are calculated in accordance with the Norwegian provisional accounting standard (NRS) for pension costs. The company has a contribution-based pension plan for employees in Sweden. The current year s pension cost corresponds to the current year s premium payment. Pension obligations are valued at the present value of future pension obligations earned at the balance sheet date, which are to be paid
34 through the company s own pension fund or financed from operations. Net pension liabilities are recorded in the balance sheet after correcting for the effect of changes in estimates and pension plans on deferred profit, as well as for variances between actual and projected yield on pension assets not yet recorded in the profit and loss account. Net pension obligations are presented as a provision. Over-funded plans where the assets cannot be transferred to under-funded plans are shown as pension assets (financial fixed assets). The group applies the corridor principle for reporting changes in pension liabilities. Changes in liabilities and pension assets arising from changes to and variances in assumptions applied to calculations (changes in estimates) are distributed over the remaining expected average earnings period if the variances at 1 January exceed 10 per cent of whichever is the greater of gross pension liabilities or pension assets. Net pension costs for the year are included as a salary expense in the profit and loss account. Premiums paid are treated as investments in pension funds. taxes are reversed or could be reversed in the same period, the differences have been eliminated. Net deferred tax benefits are recorded in the balance sheet to the extent that it is likely they will be used. At 31 December 2005, the company had net negative temporary differences between accounting and tax values. The associated deferred tax benefit is recorded in the balance sheet as an asset. The tax treaty between Norway and Sweden is based on the credit method of taxing business activities which are taxable in both Norway and Sweden. Thus, taxable profits are fully taxed in Norway in accordance with Norwegian taxation rules, and taxes paid in Sweden are applied as a credit against taxes payable in Norway. Cash flow The cash flow analysis has been prepared using the indirect method. Net cash flow from operating activities is obtained by entering the net profit for the year and the other operating items shown. Cash flows from investment and financial activities are presented gross. Taxes Tax expenses in the profit and loss account comprise taxes payable for the period and the change in deferred tax. Deferred tax is calculated as 28 per cent of the temporary differences between accounting and tax values, as well as the tax loss carried forward at the end of the accounting year. If the temporary differences which increase or decrease
35 Notes to the accounts Note 1 Posting collateral Posting collateral When entering into member agreements for clearing financial power contracts, members accept the prevailing standard terms for clearing. These include such matters as posting collateral for power contracts traded via Nord Pool and/or cleared by Nord Pool Clearing. Nord Pool Clearing requires the posting of both a minimum collateral and a daily collateral amount based on each member s positions. The daily collateral requirement is calculated as the sum of a portfolio s unrealised losses and maximum expected losses based on a simulation in a risk-based portfolio system. Collateral is posted as a cash deposit and a possible bank guarantee, or in another form approved by Nord Pool Clearing in accordance with the applicable standard terms. Additional extraordinary security may be required at one hour s notice if special conditions make this necessary. Nord Pool Clearing had an open balance (future contractual obligations) of NOK 54.9 billion at 31 December Collateral required from members at the same date was NOK 13.5 billion. Total collateral posted at 31 December 2005 amounted to NOK 24.4 billion, and all members had posted satisfactory collateral as specified by the standard terms. Note 2 Business areas Nord Pool ASA Financial market NP Clearing NP Consulting Other activities 1 Total Nord Pool ASA Amounts in NOK mill Operating income Operating expenses Operating profit (0.2) Value of power contracts Value of EUA contracts Turnover power in TWh Turnover EUAs in tonnes Nord Pool group Financial market NP Clearing NP Consulting Other activities 1 Total NP Group Amounts in NOK mill Operating income Operating expenses Operating profit (0.2) Value of power contracts Value of EUA contracts Turnover power in TWh Exchange-traded power in TWh OTC power i TWh Volume traded CO 2 in tonnes Volume cleared CO 2 in tonnes OTC CO 2 in tonnes Other activities comprise administrative services performed for Nord Pool Spot AS and Nord Pool Clearing ASA, as well as international activities, the sale of market data and courses
36 Note 3 Service agreements Nord Pool ASA Amounts in NOK Services rendered to Nord Pool Spot AS Services rendered to group companies Sum Nord Pool group Amounts in NOK Services rendered to Nord Pool Spot AS Total Note 4 Other operating income Nord Pool ASA Amounts in NOK Re-invoicing of telecom services Services to EEX AG and Powernext France Subscription income Distribution of price information - (516) Consultancy income Miscellaneous other operating income Total Nord Pool group Amounts in NOK Re-invoicing of telecom services Services to EEX AG and Powernext France Subscription income Distribution of price information - (516) Consultancy income Miscellaneous other operating income Total Note 5 Payroll expenses, employees, remuneration, loans to employees, etc Payroll expenses Nord Pool ASA Nord Pool group Amounts in NOK Salaries Capitalised in-house development (1 032) Social security contributions Pension costs Other benefits Total Nord Pool ASA had an average of 46 employees and three contract staff in 2005, while the corresponding figures for the group were 71 and three. In 2004, Nord Pool ASA had an average of 50 employees and the group averaged 71 personnel
37 Nord Pool ASA Amounts in NOK Remuneration of key personnel President and CEO 2 Directors 1 Salary Other remuneration Remuneration is paid only to external directors, and not to directors employed by Statnett SF, Affärsverket svenska kraftnät or the Nord Pool group. 2 Nord Pool s chief executive is covered by Nord Pool s group pension plan, but has no rights beyond those associated with that plan. The chief executive is entitled to one year s salary should the board of directors requests his resignation. 3 The chief executive s annual salary was NOK at 31 December No loans have been granted nor security posted on behalf of the chief executive, the chair of the board or other closely related parties. No individual loan or collateral posting represents more than five per cent of the Nord Pool group s equity. Employee bonus plan The group has a bonus plan for its employees based on meeting various performance criteria, including volumes, profit and goals for departments and individual employees. The maximum bonus is 15 per cent of an employee s annual salary. An average bonus of 10 per cent was attained in Auditors Fees paid to the external auditor for regular auditing services in 2005, excluding VAT, amounted to NOK for Nord Pool ASA and NOK for the group. Fees paid by the group for other attestation and auditing services amounted to NOK excluding VAT. Fees for consulting services amounted to NOK excluding VAT. Note 6 Other operating expenses Nord Pool ASA Nord Pool group Amounts in NOK Outsourced services Software development Miscellaneous administrative expenses Total Note 7 Leases for office premises The group has a lease for rented office space in the Granfos Industrial Park at Lysaker outside Oslo. This lease expires on 1 July The annual rent for 2005 was NOK 4.3 million, compared with NOK 4.3 million in This amount is adjusted annually in accordance with the consumer price index. Rent for 2005 also includes the lease for Nord Pool Consulting AS
38 Note 8 Subsidiaries, associated companies and other investments Subsidiaries: Acquisition date Disposal date Headquarters Ownership Share of voting rights Nord Pool Clearing ASA 10 Dec 1998 Oslo 100.0% 100.0% Nord Pool Consulting AS 1 Jan 2004 Oslo 100.0% 100.0% Associated companies: Nord Pool Spot AS 1 Jan 2002 Oslo 20.0% 20.0% Investments in other companies: European Energy Exchange AG 3 Jun 1999 Leipzig 17.4% 17.4% Nordic Electricity Clearing House AS (NECH) was established on 10 December The company had no operations until clearing activities were spun off from Nord Pool ASA, which took effect for accounting purposes at 1 January NECH changed its name to Nord Pool Clearing ASA on 6 January Nord Pool Clearing had a net profit of NOK 30.4 million for 2005, compared with NOK 20.6 million in The company s equity amounted to NOK million at 31 December Equity in Nord Pool Consulting AS amounted to NOK 6.1 million at 31 December Net profit for 2005 was NOK 1.3 million, compared with NOK 0.8 million in Investments in the associated Nord Pool Spot AS company are recorded in the parent company accounts using the cost method and in the consolidated accounts using the equity method. Nord Pool s spot market activities were demerged to Nord Pool Spot AS with accounting effect at 1 January At 31 December 2005, Nord Pool Spot s equity amounted to NOK million. Net profit for the company in 2005 was NOK 23.7 million, compared with NOK 28.1 million in LPX Leipzig Power Exchange GmbH was originally established as a power exchange, with a physical delivery spot market which became operational in June It merged in 2002 with European Energy Exchange AG. The company s equity at 31 December 2005 was NOK 235 million (EUR 29.4 million). The net profit for 2005 came to NOK 31.6 million (EUR million), compared with a loss of NOK 24.7 million (EUR million) in Services performed by Nord Pool for European Energy Exchange AG EEX purchases IT services from Nord Pool, including leased telecommunication lines. Charges for these services amounted to NOK 0.4 million in 2005, compared with NOK 0.8 million in Nord Pool also receives licence fees, which amounted to NOK 1.6 million in 2005 compared with NOK 13.9 million in The agreement with EEX expired at 15 June Nord Pool ASA Investments valued in accordance with the cost method Company Total share capital Shares owned Par value per share Total par value Acquisition cost Book value Nord Pool Spot AS European Energy Exchange AG Nord Pool group Investments valued in accordance with the equity method Nord Pool Spot Group Amounts in NOK Calculated share of net profit Share of net profit Share of net profit Book value at 31 Dec 2005 is calculated as follows: Opening balance 1 Jan Share of net profit Dividend received (5 845) Closing balance 31 Dec
39 Note 9 Net financial items Amounts in NOK Nord Pool ASA Nord Pool group Financial income Dividend from associated company Interest income from group companies Other interest income Gain on foreign currency Total financial income Financial expenses Interest expenses, subordinated loan (8 750) (8 619) (8 750) (8 618) Other interest expenses (147) (7) (286) (72) Loss on foreign currency (767) (55) (3 305) (608) Total financial expenses (9 664) (8 681) (12 341) (9 298) Net financial items (697) 412 Note 10 Intragroup profit and loss items Nord Pool Nord Pool Nord Pool Nord Pool Nord Pool ASA Clearing ASA Clearing ASA Consulting AS Consulting AS Amounts in NOK Operating income Net financial items Total Note 11 Computerised trading systems Nord Pool ASA Nord Pool group Amounts in NOK Intangible fixed assets Intangible fixed assets Acquisition cost at 1 Jan Additions Disposals - (200) Acquisition cost at 1 Dec Accumulated depreciation at 31 Dec 2005 (5 439) (12 840) Book value at 31 Dec Depreciation for the year Both parent company and group apply straight-line depreciation to all intangible fixed assets. The expected useful life of intangible fixed assets is five years
40 Note 12 Tangible fixed assets Nord Pool ASA Amounts in NOK Vehicles Machinery and equipment Total Tangible fixed assets Acquisition cost at 1 Jan Additions Disposals (799) - (799) Acquisition cost at 1 Dec Accumulated depreciation at 31 Dec 2005 (332) (62 207) (62 539) Book value at 31 Dec Depreciation for the year Nord Pool group Amounts in NOK Vehicles Machinery and equipment Total Tangible fixed assets Acquisition cost at 1 Jan Translation differences (17) (8) (25) Additions Disposals (799) - (799) Acquisition cost at 1 Dec Accumulated depreciation at 31 Dec 2005 (602) (64 542) (65 144) Book value at 31 Dec Depreciation for the year Both parent company and group apply straight-line depreciation to all tangible fixed assets. Expected useful life of assets: IT and office equipment 3-10 years Vehicles 5 years Note 13 Accounts receivable No losses on accounts receivable were recorded in 2005 or Accounts receivable were booked at face value at 31 December Note 14 Bank deposits Amounts in NOK Nord Pool ASA Nord Pool group Restricted tax withholdings
41 Note 15 Share capital and shareholder information Nord Pool ASA The share capital comprises Number of shares Par value Book value A shares Total Nord Pool had two shareholders at 31 December The company has only one share class and all shares carry the same rights. Shareholders at 31 Dec 2005 Number of shares Ownership Share of voting rights Statnett SF % 50.0% Affärsverket svenska kraftnät % 50.0% Total number of shares % 100.0% Note 16 Equity Nord Pool ASA Amounts in NOK Share capital Share premium reserve Other equity Total equity Equity at 1 Jan Net profit Dividend (22 000) (22 000) Equity at 31 Dec Nord Pool group Amounts in NOK Share capital Share premium reserve Other equity Total equity Equity at 1 Jan Translation differences (1) (1) Net profit Dividend (22 000) (22 000) Equity at 31 Dec Note 17 Closely-related parties owners Nord Pool s shares are owned by Affärsverket svenska kraftnät and Statnett SF. Nord Pool performs no tasks or services for Affärsverket svenska kraftnät. All transactions with Statnett SF are conducted at market value. Services and tasks performed by Nord Pool for Statnett SF a) Balance settlement and regulating power market Nord Pool provides maintenance and contingency services for Statnett SF s IT systems relating to balance settlement and the regulating power market. Total income for 2005 amounted to NOK 0.4 million, compared with NOK 0.8 million in The contracts for these services were renegotiated in 1999 and remain in force until terminated by either party. Services and tasks performed by Statnett SF for Nord Pool a) Administrative services Statnett SF performs tasks for Nord Pool related to realestate leases and IT services associated with back-up solutions for the marketplace as specified in contracts between the two parties. Nord Pool also has a joint insurance policy with Statnett SF. Costs for these services totalled NOK 1.3 million in 2005, unchanged from The contracts run for one year at a time. b) Pension plan The Nord Pool group is a member of the Statnett SF Pension Fund, with associated pension obligations. The Statnett SF Pension Fund also administers the pension fund. See the section on pension costs and pension liabilities under accounting principles
42 Note 18 Pensions The Nord Pool ASA group has pension plans for employees in Norway which cover a total of 64 people. The corresponding figure for the parent company is 44. These plans entitle beneficiaries to defined future benefits, which depend primarily on the length of employment, pay at retirement and level of the Norwegian state pension. Pension expenses for the period comprise Amounts in NOK Nord Pool ASA Present value of current year s pension earnings Interest cost for pension liabilities Yield on pension assets (919) (942) Change in estimates and variances Payroll tax Net pension expenses for defined benefit plan Nord Pool group Present value of current year s pension earnings Interest cost for pension liabilities Yield on pension assets (1 351) (1 285) Change in estimates and variances Payroll tax Net pension expenses for defined benefit plan Nord Pool ASA Funded Unfunded Funded Unfunded Calculated pension liabilities at 31 Dec Estimated pension assets at 31 Dec 05 (20 343) - (18 022) - Effect of changes in estimates and variances not recorded in profit and loss account (7 362) 145 (6 743) 33 Payroll tax Net pension liabilities Nord Pool group Funded Unfunded Funded Unfunded Calculated pension liabilities at 31 Dec Estimated pension assets at 31 Dec 05 (29 954) - (24 803) - Effect of changes in estimates and variances not recorded in profit and loss account (9 633) 342 (7 468) 84 Payroll tax Net pension liabilities Technical assumptions Discount rate 4.5% 5.0% Expected growth in pay 3.0% 3.0% Expected growth in National Insurance base amount 3.0% 3.0% Expected growth in pensions 3.0% 3.0% Expected yield on assets 5.0% 6.0% Average payroll tax rate 14.1% 14.1% Allocations to pension liabilities are based on estimated pension liabilities at 31 December The actuarial assumptions are based on common assumptions made in the insurance business for demographic factors. The Swedish branches have a contribution-based pension plan for employees in Sweden. This plan covers four employees. The annual pension cost for employees in Sweden was NOK 0.2 million in
43 Note 19 Subordinated loan capital The subordinated loan has been provided by the company s two owners, each contributing NOK 50 million. The loan s priority is junior to all other debt. The borrower is entitled, under specified conditions, to extend the loan s maturity by five years. After five years, the borrower is entitled to redeem the loan in whole or in part, subject to advance approval by the Financial Services Authority of Norway. Loan Amount of loan Interest rate Maturity Date issued Maturity date Subordinated loan NOK % 10 years Note 20 Other current liabilities Amounts in NOK Nord Pool ASA Other operating expenses, accrued Accrued trading fees Holiday pay Accrued interest costs for subordinated loan from owners Total Nord Pool group Other operating expenses, accrued Accrued trading fees Holiday pay Accrued interest costs for subordinated loan from owners Total Note 21 Taxes Nord Pool ASA Nord Pool group Amounts in NOK Tax cost for the year comprises Taxes payable Change in deferred tax (401) (1 322) (453) (1 126) Reversal tax effect of group gain - - (2 561) - Over/under provision for tax in previous year (1 031) Total tax costs Calculated tax base for the year Profit before tax Permanent differences Change in temporary differences Group items (8 463) Tax base for the year Presentation of temporary differences Fixed assets (8 726) (9 973) (8 955) (10 009) Allocations in accordance with generally-accepted accounting principles - - (400) (1 125) Pensions (7 891) (5 213) (11 912) (8 515) Total (16 617) (15 186) (21 267) (19 649) Calculated deferred tax benefit on temp differences (4 653) (4 252) (5 955) (5 502) Group elimination of deferred tax benefit Total deferred tax benefit (4 653) (4 252) (5 955) (2 941)
44 Explanation of why current year s tax cost does not constitute 28 per cent of pre-tax profit Nord Pool ASA Profit before tax % tax on pre-tax profit Under provision for tax in previous years Permanent differences (28%) Calculated tax cost Nominal tax rate ² 30.5% 30.1% Since the tax treaty between Norway and Sweden is based on the credit method, taxes paid in Sweden will be refunded through taxes payable in Norway. Tax cost for the year is calculated in accordance with Norwegian taxation rules. 1 Including non-deductible expenses, such as entertainment. 2 Tax cost as a percentage of pre-tax profit


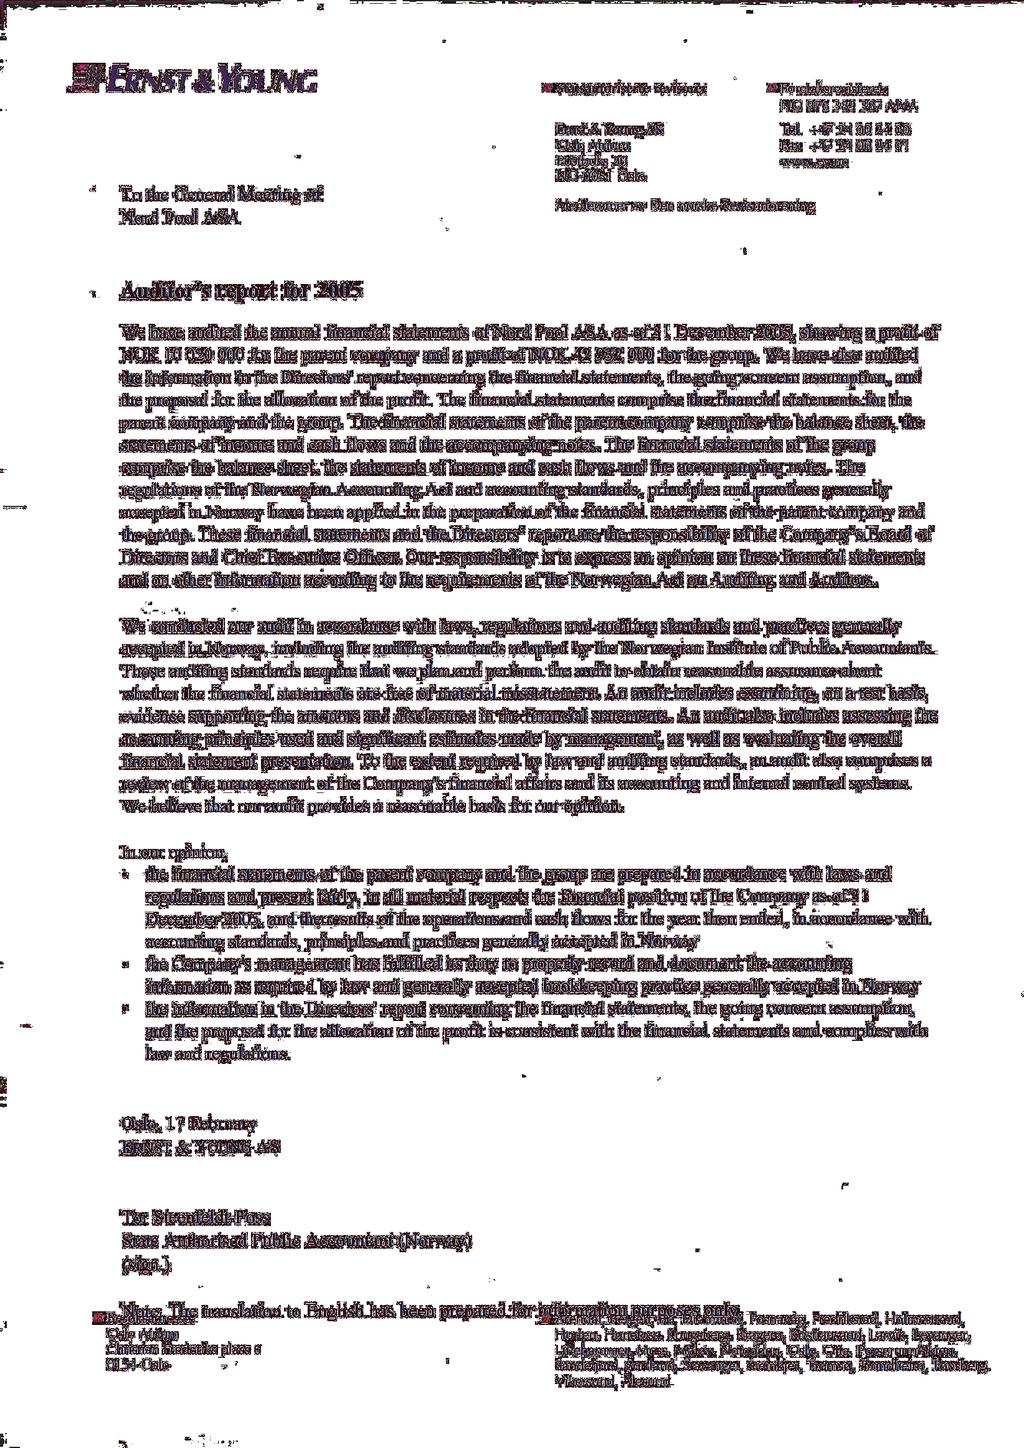
45 Auditor s report

46
47 Glossary Clearing Desk Application (CDA) Nord Pool Clearing s electronic system for communicating with clearing members and brokers on clearing. Clearing In clearing, Nord Pool Clearing enters into financially settled power contracts and assumes counterparty responsibilities vis-à-vis buyers and sellers. Clearing client A legal entity which has been approved by Nord Pool Clearing for having its trades cleared by Nord Pool Clearing when represented by a client representative. Clearing member A legal entity which has been approved by Nord Pool Clearing for having its trades cleared by Nord Pool Clearing. Client representative Exchange/clearing member who represents clearing clients in exchange trading at Nord Pool and/or in clearing with Nord Pool Clearing. Contracts for Difference (CfD) A financial market contract used to hedge any price differential between a specific area price and the Elspot system price. Counterparty responsibility See Clearing. Elbas Nord Pool Spot s physical delivery balance adjustment market for Sweden, Finland and eastern Denmark. Trading can be conducted up to one hour before delivery, using Elbas continuous trading system. Elspot Nord Pool Spot s auction-based Nordic spot market, where power contracts of one-hour duration for next day physical delivery are traded. Elspot area (price area) The areas into which the Nordic power exchange region is divided for the purpose of managing any capacity limitations (bottlenecks) in the transmission grid. Bottlenecks can result in price differences between Elspot areas. European Union allowances (EUAs) Trading in EUAs is a consequence of the Kyoto protocol, and aims to help cut overall carbon dioxide emissions. EUAs can be bought and sold in Nord Pool s financial market. The products offered are forward and spot contracts with physical delivery. Exchange member Legal entity which has signed an exchange member agreement with Nord Pool to conduct its own trade and/or to trade on behalf of customers. All exchange members are required to be clearing members of Nord Pool Clearing. Financial market Nord Pool s exchange for trading financially settled power contracts (commodity derivatives with electricity as the underlying product), which comprises trading in futures and forward contracts, Europeanexercise power options and contracts for difference (CfD). EUA s are also tradet on the financial market. Forward contract A financial market contract in which daily changes in value during the trading period accumulate as unrealised gains or losses. During the delivery period, accumulated gains or losses are realised in equal proportions each day. Futures contract A financial market contract with daily settlement of mark-to-market valuation changes during both trading and delivery periods. Initial margin call Nord Pool Clearing s requirement for collateral which must be posted by a clearing member or clearing client before any clearing can commence. Market-maker An exchange member who has signed an agreement with Nord Pool to post binding bid and offer prices for specified quoted products. PowerClick Nord Pool s electronic trading system for the financial market. Regulating power market (balancing market) A market system for maintaining the operational balance between consumption and generation of electricity in the overall power system. Participants post prices to reduce or increase power generation or consumption. SAPRI Trading system used by Nord Pool Spot for auction trading of physical delivery power contracts. System price (Elspot system price) The price of spot power contracts, calculated using the aggregate of buy and sell orders placed for next-day delivery in Norway, Sweden and Finland. This price is calculated as if no transmission grid capacity limitations (bottlenecks) exist between the three countries. The system price is used as the underlying reference price for trading in Nord Pool s financial market. Transmission system operator (TSO) The grid company responsible for monitoring and maintaining power delivery quality, the physical balance between production and consumption in its geographic area of responsibility, and power exchanges with neighbouring areas. Units of measurement V = volt (potential energy of electric current) kv = kilovolt (1 000 volts) A = ampere (current) W = watt (power) kw = kilowatt (1 000 watts) kwh = kilowatt-hour (energy) MW = megawatt (1 000 kw) MWh = megawatt-hour (1 000 kwh) GW = gigawatt (1 million kw) GWh = gigawatt-hour (1 million kwh) TW = terawatt (1 billion kw) TWh = terawatt-hour (1 billion kwh)


48 Design and consultancy: GCI Monsen AS. Photos: GV-press and Trond Isaksen Norway Nord Pool ASA Vollsveien 19 P O Box 373 NO 1326 Lysaker Tel Fax Sweden Nord Pool Sweden Gustavslundsvägen 141 B SE Bromma Tel Fax Denmark Nord Pool Denmark Vesterballevej 5 DK-7000 Fredericia Tel Fax Finland Nord Pool Finland Oy Ruoholahdenkatu 8 FI Helsinki Tel Fax The Netherlands Nord Pool Netherlands Evert van de Beekstraat 310 NL-1118 CX Schiphol Airport Tel Fax
NORD POOL ASA ANNUAL REPORT 2004
 NORD POOL ASA ANNUAL REPORT 2004 Contents This is Nord Pool... 4 Nord Pool s business areas... 5 A brief history... 6 Key events 2004... 6 Key figures 1996 2004... 7 CEO s report... 8 Internal control...
The Nordic Market Model 10 Years of Experience
 The Nordic Market Model 10 Years of Experience 7 th International Workshop on Electric Power Control Centers Ortisei, Italy May 25-28, 2003 Presentation by Ole Gjerde Senior Adviser, Statnett SF 1 Contents
Nord Pool the Nordic power exchange GROUP MARKET REPORT
 Nord Pool the Nordic power exchange GROUP MARKET REPORT Highlights physical markets: POWER: Volume Elbas 114.5 GWh in and YTD 345.7 GWh Volume Elspot 28.3 TWh in and 85.5 TWh YTD The exchange's market
Nord Pool the Nordic power exchange GROUP MARKET REPORT
 August 28 Nord Pool the Nordic power exchange GROUP MARKET REPORT Highlights physical markets: POWER: Volume Elspot 2.7 TWh in August and 196.2 TWh YTD Volume Elbas 15.3 GWh in August and YTD 1 69.6 GWh
Nord Pool the Nordic power exchange GROUP MARKET REPORT. TWh
 Augus t 27 Nord Pool the Nordic power exchange GROUP MARKET REPORT Physical market Nord Pool Spot AS Turnover in the physical market in August was 21. TWh (1 TWh = 1 billion KWh). This was an increase
Nord Pool the Nordic power exchange GROUP MARKET REPORT. TWh
 November Nord Pool the Nordic power exchange GROUP MARKET REPORT Physical market Nord Pool Spot AS Turnover in the physical market in November was 26.7 (1 TWh = 1 billion KWh). This was an increase of
Nord Pool the Nordic power exchange GROUP MARKET REPORT
 Nord Pool the Nordic power exchange GROUP MARKET REPORT Highlights physical markets : POWER: Nord Pool Spot market share of Nordic consumption was 74.3 per cent in. Volumes traded were 18.5 TWh in compared
NORD POOL ASA ANNUAL REPORT Norway Nord Pool ASA Vollsveien 19 P.O. Box 373 NO 1326 Lysaker Tel Fax
 NORD POOL ASA ANNUAL REPORT 2003 NORD POOL ASA ANNUAL REPORT 2003 Norway Nord Pool ASA Vollsveien 19 P.O. Box 373 NO 1326 Lysaker Tel. +47 67 52 80 00 Fax +47 67 52 80 01 Sweden Nord Pool Sweden Barnhusgatan
Nord Pool the Nordic power exchange GROUP MARKET REPORT
 April 28 Nord Pool the Nordic power exchange GROUP MARKET REPORT Highlights physical markets: POWER: Volume Elspot 25 TWh in April and 11.5 TWh YTD. Volume Elbas 96.5 GWh in April and YTD 442.2 GWh. The
February 2008 TWh Spot turnover monthly EUR/MWh Average system price/month
 February Nord Pool the Nordic power exchange GROUP MARKET REPORT Physical market Nord Pool Spot AS Turnover in the physical market in February was 27.6 TWh (1 TWh = 1 billion KWh). This was a decrease
Nord Pool the Nordic power exchange GROUP MARKET REPORT
 May 28 Nord Pool the Nordic power exchange GROUP MARKET REPORT Highlights physical markets: POWER: Volume Elspot 23.4 TWh in May and 133.9 TWh YTD. Volume Elbas 161.4 GWh in May and YTD 63.6 GWh. The exchange's
How to avoid market manipulation lessons learnt in Norway. 10th Baltic Electricity Market Mini-Forum June 4, 2010 Anne Dønnem, NVE
 How to avoid market manipulation lessons learnt in Norway 10th Baltic Electricity Market Mini-Forum June 4, 2010 Anne Dønnem, NVE Overview Nord Pool Spot History and organisation The role of the power
GROUP MARKET REPORT. CARBON: Volume EUAs and CERs 9.3 million tonnes in October and million tonnes YTD
 October 28 GROUP MARKET REPORT Highlights physical markets: POWER: Volume Elspot 24.5 in October and 242.8 TWh YTD Volume Elbas 224.1 GWh in October and 1 44.7 GWh YTD The exchange's market share in October
MARKET REPORT. December 2010
 December 21 MARKET REPORT Highlights physical markets December 21: POWER: Nord Pool Spot market share of Nordic consumption was 73.4 per cent in December. The total Nordic preliminary consumption for December
MARKET REPORT. August 2011
 ust MARKET REPORT Highlights physical markets ust : POWER: Nord Pool Spot market share of Nordic consumption was 72.6 per cent in ust. The total Nordic preliminary consumption for ust was 26.8 TWh compared
20 years operation of the Nordic electricity market
 ENERGY 20 years operation of the Nordic electricity market ADB Regional Energy Trade Workshop September 8-9, 2014 Manila Dr. Per Christer Lund 1 SAFER, SMARTER, GREENER Electricity market world wide 2
Nordic Market Report
 Nordic Market Report Status as of May 8 th, 17 1. SUMMARY The average spot price in April was 29.2 /MWh, down 1.2 /MWh from March and up 7.1 /MWh year-onyear. The average price in April in the period 1993
MARKET REPORT. March 2012
 ch 212 MARKET REPORT Highlights physical ch 212: POWER: Nord Pool Spot market share of Nordic consumption was 72.1% in ch. The total Nordic preliminary consumption for ch was 34.8 TWh compared to 38.3
MARKET REPORT. April Highlights physical April 2012:
 il 212 Highlights physical il 212: MARKET REPORT POWER: Nord Pool Spot market share of Nordic consumption was 72.7% in il. The total Nordic preliminary consumption for il was 31.6 TWh compared to 34.8
MARKET REPORT. January 2012
 uary 212 MARKET REPORT Highlights physical uary 212: POWER: Nord Pool Spot market share of Nordic consumption was 72.9% in uary. The total Nordic preliminary consumption for uary was 39.8 TWh compared
Statkraft Investor Update. March 2014
 Statkraft Investor Update March 2014 Disclaimer This presentation has been prepared by, and the information contained herein (unless otherwise indicated) has been provided by Statkraft AS (the "Company").
Energi Quarterly report Q3 2016
 Energi Quarterly report 2 E-CO Energi // The Board of Directors report CONSOLIDATED QUARTERLY REPORT 1 JANUARY 30 SEPTEMBER (Comparable figures for in parentheses) KEY FIGURES Year Results Operating revenue
Report on Proposed principles for Common Balance Management
 Report on Proposed principles for Common Balance Management 2007-11-16 1 Contents 1. INTRODUCTION AND BACKGROUND...3 2. COMMON COST ALLOCATION...3 3. FEE STRUCTURE... 4 4. NEW MODEL FOR ENCOMPASSING TWO
FINANCIAL RESULTS Q4 2010
 FINANCIAL RESULTS Q4 2010 CEO CHRISTIAN RYNNING-TØNNESEN CFO STEIN DALE 17 FEBRUARY 2011 HIGHLIGHTS Q4 2010 Strong financial results driven by unusual cold and dry Nordic weather Underlying 1 pre-tax
Asset Optimisation and Trading
 Asset Optimisation and Trading Harald von Heyden Head of Business Division Asset Optimisation and Trading Stockholm, 21 September 211 Today s focus Organisation and key figures AOT comprises four business
Statkraft Investor Update. European Energy & Utilities Credit Conference 2013
 Statkraft Investor Update European Energy & Utilities Credit Conference 2013 Disclaimer This presentation has been prepared by, and the information contained herein (unless otherwise indicated) has been
Regional Spot Markets and Inter-Regional Market Coupling
 APEx conference in Boston 11-13 October 2009 Session 1 part 2: European Market Situations Regional Spot Markets and Inter-Regional Market Coupling 1. Intro to Nord Pool Spot and the Nordic PX & Market
BASREC WS, St. Petersburg, February 28 th, 2014 NORD POOL SPOT LEADING THE POWER MARKETS INTEGRATION
 BASREC WS, St. Petersburg, February 28 th, 2014 NORD POOL SPOT LEADING THE POWER MARKETS INTEGRATION North Western Europe (NWE) FINLAND North Western Europe (NWE) NORWAY SWEDEN ESTONIA LATVIA RUSSIA DENMARK
Information about Nordic Imbalance Settlement to prospective Settlement Banks. 30 November 2016
 Information about Nordic Imbalance Settlement to prospective Settlement Banks 30 November 2016 Purpose of this package Introduce the new Nordic Imbalance Settlement operation Present the banking services
Q U A R T E R L Y R E P O R T 2018 FIRST QUARTER
 Q U A R T E R L Y R E P O R T 2018 FIRST QUARTER Contents Highlights 3 Group summary 5 Business areas 6 Other matters 7 Outlook 7 Financial statements 8 Notes to the financial statements 13 Definitions
SIX-MONTH INTERIM REPORT 2004
 SIX-MONTH INTERIM REPORT 24 JANUARY-JUNE Net sales decreased by 2.4 per cent to SEK 57,71 million (58,498) Operating profit increased by 17.7 per cent to SEK 11,593 million (9,848) Net profit after tax
C2-102 COMMON NORDIC BALANCE MANAGEMENT. K.LINDSTRÖM FINGRID (Finland)
") 21, rue d'artois, F-75008 Paris http://www.cigre.org C2-102 Session 2004 CIGRÉ COMMON NORDIC BALANCE MANAGEMENT O.GJERDE* STATNETT (Norway) F.WIBROE ELTRA (Denmark) J-E. FISCHER ELKRAFT (Denmark) K.LINDSTRÖM
21, rue d'artois, F-75008 Paris http://www.cigre.org C2-102 Session 2004 CIGRÉ COMMON NORDIC BALANCE MANAGEMENT O.GJERDE* STATNETT (Norway) F.WIBROE ELTRA (Denmark) J-E. FISCHER ELKRAFT (Denmark) K.LINDSTRÖM
q3 QUARTERLY REPORT 09 E-CO ENERGI
 P.O. Box 255 Sentrum 0103 Oslo Phone 24 11 69 00 Fax 24 11 69 01 www.e-co.no q3 QUARTERLY REPORT 09 E-CO ENERGI QUARTERLY REPORT FOR THE GROUP 1 JANUARY 2009-30 SEPTEMBER 2009 (2008 figures in parentheses)
Report on regulation and the electricity market. Norway
 Report on regulation and the electricity market Norway Norwegian Water Resources and Energy Directorate (NVE) 30 th of June 2008 1 1 Foreword The Norwegian electricity market was formally opened up for
FINANCIAL RESULTS Q CEO Christian Rynning-Tønnesen CFO Irene Egset 25 October 2018
 FINANCIAL RESULTS Q3 2018 CEO Christian Rynning-Tønnesen CFO Irene Egset 25 October 2018 Health, safety and environment TRI-rate 1 7 6 5 4 3 2 1 0 2016 2017 2018 Health and safety - Two serious injuries
PRICING ASPECTS OF FORWARD LOCATIONAL PRICE DIFFERENTIAL PRODUCTS
 PRICING ASPECTS OF FORWARD LOCATIONAL PRICE DIFFERENTIAL PRODUCTS Tarjei Kristiansen Norwegian University of Science and Technology and Norsk Hydro ASA Oslo, Norway Tarjei.Kristiansen@elkraft.ntnu.no Abstract
Statkraft Investor Update Q3 2018
 Statkraft Investor Update Q3 2018 Disclaimer This presentation has been prepared by, and the information contained herein (unless otherwise indicated) has been provided by Statkraft AS (the "Company").
SIX-MONTH INTERIM REPORT 2003
 SIX-MONTH INTERIM REPORT 2003 JANUARY-JUNE Operating profit during the first half of the year increased by 36 per cent to SEK 9,988 million (SEK 7,345 m) * Net profit during the first half of the year
Work Programme 2007 Report 1/2007
 Work Programme 2007 Report 1/2007 WORK PROGRAMME 2007 NORDIC ENERGY REGULATORS (NordREG) Nordic Energy Regulators 2007 Report 1/2007 NordREG c/o The Energy Markets Inspectorate P.O. Box 310 SE- 631 04
FINANCIAL RESULTS Q CFO Irene Egset 4 th May 2017
 FINANCIAL RESULTS Q1 2017 CFO Irene Egset 4 th May 2017 Health, safety and environment TRI-rate 1 10 8 6 4 2 0 2014 2015 2016 2017 Health and safety - Quarterly injuries rate is down in Q1 - Continuously
Fortum Corporation Interim Report January-June 2008
 Fortum Corporation Interim Report January-June 2008 Fortum Corporation Interim Report January-June 2008 17 July 2008 at 9:00 Solid first half-year results Strong performance in Power Generation Comparable
8 th Annual APEx Conference October 2003 Cartagena de Indias, Colombia
 8 th Annual APEx Conference 14-15 October 20 Cartagena de Indias, Colombia European Energy Exchange its development in Germany and Continental Europe Oliver Maibaum Head of Trading 1 Agenda EEX in Germany
Vattenfall Q3 and 9M 2012 results
 Vattenfall Q3 and 9M 2012 results Øystein Løseth, CEO and Ingrid Bonde, CFO Conference Call, 30 October 2012 Q3 Highlights (1) Underlying operating profit SEK 1.3 bn below last year - 12% higher production
QUARTERLY REPORT
 QUARTERLY REPORT 03-2018 QUARTERLY REPORT 3 RD QUARTER 2018 1 Q3 2018 HIGHLIGHTS In the first nine months of the year, Agder Energi made an underlying¹ operating profit based on IFRS of NOK 1,701 million
16 th edition of this popular report
 European European Power Power Trading Trading 2017 2017 16 th edition of this popular report This document includes a report summary, a table of contents, report format and price information, and an order
NordREG Activities 2008
 NordREG Activities 2008 NordREG Activities 2008 NordREG c/o Norwegian Water Resources and Energy Directorate P.O. Box 5091, Majorstua N-0301 Oslo Norway Telephone: +47 22 95 95 95 Telefax: +47 22 95 90
QUARTERLY REPORT
 QUARTERLY REPORT 04-2018 QUARTERLY REPORT 4TH QUARTER 2018 1 Q4 2018 HIGHLIGHTS In 2018, Agder Energi made an underlying 1 operating profit based on IFRS of NOK 2,298 million (2017: NOK 1,889 million),
Release of EU Allowances in Germany
 Release of EU Allowances in Germany Annual report 2009 Annual report 2009 Between 1 January 2009 and 13 November 2009 KfW sold a total of 40 million EU allowances with an overall value of EUR 528,487,784.40.
- a leading energy company in the Nordic area. Investor Meetings
 - a leading energy company in the Nordic area Investor Meetings November 2004 Fortum's strategy Fortum focuses on the Nordic energy market as a platform for long-term profitable growth Create the leading
Q1 Q Q3 Q EUR million Jan-Mar 2018 Jan-Mar 2017 Change, % EUR million Jan-Dec 2017
 Stockholm, Sweden, 4 May Eltel Group Interim report January March January March Group net sales decreased 10.5% to EUR 266.6 million (297.8), mainly as a result of divestments and on-going discontinuation
SIX-MONTH INTERIM REPORT 2002 January June
 January June A dynamic and competitive Vattenfall is a guarantee for maintaining competition on the northern European power market. Lars G Josefsson President and Chief Executive Officer Comments by the
Report on regulation and the electricity market. Norway
 Report on regulation and the electricity market Norway Norwegian Water Resources and Energy Directorate (NVE) 30 th of June 2009 1 Table of contents 1 Foreword 3 2 Main developments in the electricity
Statkraft AS Interim Report Q1/2018
 Statkraft AS Interim Report Q1/2018 Q1 Key figures NOK million 2018 2017 Change 2017 From income statement Gross operating revenues and other income 15 099 14 009 1 089 52 883 Net operating revenues and
NBIM Quarterly Performance Report Second quarter 2007
 NBIM Quarterly Performance Report Second quarter 2007 Government Pension Fund Global Norges Bank s foreign exchange reserves Investment portfolio Buffer portfolio Government Petroleum Insurance Fund Norges
ICIS Energy Forum. Power and Carbon Markets. 1
 ICIS Energy Forum Power and Carbon Markets www.icis.com 1 Germany-Austria bidding zone split market impact? Irina Peltegova Editor EDEM +44 207 911 1975 irina.peltegova@icis.com Germany-Austria bidding
Definitions. Trading Appendix 1. Nord Pool AS. Obsolete
 Definitions Trading Appendix 1 Nord Pool AS DEFINITIONS This document sets out the definitions of capitalized terms in the Trading Rules and the Clearing Rules (as defined below): Acceptance Ratio Account
Statkraft AS Interim Report Q3/2018
 Statkraft AS Interim Report Q3/2018 Q3 Key figures Third quarter Year to date Year NOK million 2018 2017 Change 2018 2017 Change 2017 From income statement Gross operating revenues and other income 14
Stock exchange release 1 (17) FINGRID OYJ EET FINGRID GROUP S INTERIM REPORT 1 JANUARY - 31 MARCH 2016
 FINGRID OYJ EET FINGRID GROUP S INTERIM REPORT 1 JANUARY - 31 MARCH 2016") Stock exchange release 1 (17) FINGRID GROUP S INTERIM REPORT 1 JANUARY - 31 MARCH 2016 Fingrid s consolidated financial statements have been drawn up in accordance with the International Financial Reporting
Stock exchange release 1 (17) FINGRID GROUP S INTERIM REPORT 1 JANUARY - 31 MARCH 2016 Fingrid s consolidated financial statements have been drawn up in accordance with the International Financial Reporting
Fourth quarter 2016 Presentation to analysts and preliminary results 2016
 Fourth quarter 2016 Presentation to analysts and preliminary results 2016 Finn Bjørn Ruyter Oslo, 9 February 2017 Agenda 1 Summary of the year 2016 2 Fourth quarter 2016 results 3 Theme: Strategy 4 Appendix
FINANCIAL RESULTS Q CEO Christian Rynning-Tønnesen CFO Irene Egset 26 April 2018
 FINANCIAL RESULTS Q1 2018 CEO Christian Rynning-Tønnesen CFO Irene Egset 26 April 2018 Health, safety and environment TRI-rate 1 10 8 6 4 2 0 2016 2017 2018 Health and safety - No serious injuries in Q1
The Way Forward Mikael Lilius President and CEO Capital Markets Day
 The Way Forward Mikael Lilius President and CEO Capital Markets Day June 17, 2004 Fortum's strategy Fortum focuses on the Nordic energy market as a platform for long-term profitable growth Create the leading
Available online at ScienceDirect. Energy Procedia 58 (2014 ) Renewable Energy Research Conference, RERC 2014
 Renewable Energy Research Conference, RERC 2014") Available online at www.sciencedirect.com ScienceDirect Energy Procedia 58 (2014 ) 58 64 Renewable Energy Research Conference, RERC 2014 An econometric analysis of the regulation power market at the Nordic
Available online at www.sciencedirect.com ScienceDirect Energy Procedia 58 (2014 ) 58 64 Renewable Energy Research Conference, RERC 2014 An econometric analysis of the regulation power market at the Nordic
Interim Report Q1/2017 Statkraft AS
 Interim Report Q1/2017 Statkraft AS 1 Key figures NOK million 2017 2016 Change 2016 From income statement Share of profit/loss in equity accounted investments 326 376-50 474 Gross operating revenues, underlying
Participants: Place/date: Lysaker, 2 September 2010 Jonas Melin for Torbjørn Haugen, Markedskraft
 Minutes THE FINANCIAL MARKET PRODUCT GROUP Participants: Place/date: Lysaker, 2 September 2010 Jonas Melin for Torbjørn Haugen, Markedskraft Referent: Frank Lien Håkon Røhne, EGL Nordic Morten Erik Pettersen,
Annual Report Statnett will rank among Europe s leading and most efficient transmission system operators
 Annual Report 2000 Statnett will rank among Europe s leading and most efficient transmission system operators ELECTRICITY CANNOT BE STORED AND MUST BE USED THE MOMENT IT IS GENERATED. A transmission system
QUARTERLY REPORT
 QUARTERLY REPORT 01-2018 QUARTERLY REPORT 1 ST QUARTER 2018 1 Q1 2018 HIGHLIGHTS Agder Energi s first quarter net income under IFRS was NOK 71 million (controlling interest s share), compared with NOK
Fortum Corporation Interim Report January June July 2009
 Fortum Corporation Interim Report January June 17 July Fortum Corporation Interim Report January June 17 July at 9:00 Solid first-half year results Comparable operating profit EUR 1,002 (984) million,
MEDIA RELEASE. ASX Welcomes Government Commitment to Emissions Trading Scheme
 MEDIA RELEASE 4 June 2007 ASX Welcomes Government Commitment to Emissions Trading Scheme The Australian Securities Exchange (ASX) welcomes the Federal Government s commitment to introduce an Emissions
Arise Windpower AB. Company presentation February 2013
 Arise Windpower AB Company presentation February 2013 Cautionary statement This document does not constitute or form part of any offer or invitation to sell or issue, or any solicitation of any offer to
SUMMARY ANNUAL REPORT Handelsbanken Liv HANDELSBANKEN LIV 1
 SUMMARY ANNUAL REPORT 1999 Handelsbanken Liv HANDELSBANKEN LIV 1 A word from the Managing Director We have now entered the third millennium, and everyone is talking about the new economy. Expectations
Hedging prices and spot prices 1
 Introduction In Appendix 1, you ll find slides giving examples of how the Closing Prices for financial contracts can change during the contracts trading period. In appendix 2, you ll find a list of the
Fortum intends to become a major shareholder in Uniper
 A powerful combination to drive European energy transition Fortum intends to become a major shareholder in Uniper 27 September 2017 Disclaimer This presentation is neither an offer to purchase, underwrite,
Notes Statkraft AS Group
 STATKRAFT AS GROUP FINANCIAL STATEMENTS Notes Statkraft AS Group Index of notes to the consolidated financial statements General Note 1 Note 2 Note 3 Note 4 Note 5 General information and summary of significant
Fortum's energy market review Keilaniemi 27 May 2009
 Fortum's energy market review Keilaniemi 27 May 9 Lotta Forssell Vice President, Communication Fortum Portfolio Management and Trading Timo Liiri Customer Manager Fortum Markets 27/5/9 1 Background of
SUMMARY (Danish Economy Autumn 1997)
") SUMMARY (Danish Economy Autumn 1997) Chapter I: The International Outlook Economic growth is expected to be around 2½ per cent per year in the OECD in 1997-99. Initially, there are large differences between
SUMMARY (Danish Economy Autumn 1997) Chapter I: The International Outlook Economic growth is expected to be around 2½ per cent per year in the OECD in 1997-99. Initially, there are large differences between
Nord Pool Spot s Market Surveillance focuses on insider trading and market manipulation according to REMIT Article 15
 Quarterly report for Market Surveillance 1 October to 31 December This report gives an update on matters regarding surveillance, regulations and incidents Market Surveillance (MS) has worked on as well
Highlights of the year
 Annual Report 2013 Highlights of the year Operating profit increased by SEK 210 million to SEK 8,096 million (7,886). Net interest income was SEK 9,431 million (8,052). Lending to the public increased
Vattenfall Q results
 Vattenfall Q1 2012 results Øystein Løseth, CEO and Peter Smink, acting CFO Press Conference, 3 May 2012 Successful first quarter continued consolidation Vattenfall continues to deliver on its strategy:
Deregulation of electricity markets The Norwegian experience By Torstein Bye and Einar Hope 1
 1 Deregulation of electricity markets The Norwegian experience By Torstein Bye and Einar Hope 1 Abstract In this paper, we describe the approach to, and experience of, the deregulation and liberalisation
Fortum in Russia. Tapio Kuula. Senior Vice President Fortum Corporation. Capital Markets Day
 Fortum in Russia Tapio Kuula Senior Vice President Fortum Corporation Capital Markets Day Stockholm, 4 June 2007 Disclaimer This presentation does not constitute an invitation to underwrite, subscribe
Interim Report 2 nd quarter 2007 Nordea Bank Norge Group
 Interim Report 2 nd quarter 2007 Nordea Bank Norge Group Nordea Bank Norge is part of the Nordea Group. Nordea s vision is to be perceived as the leading Nordic bank, acknowledged for its people, creating
Q U A R T E R L Y R E P O R T 2017 FOURTH QUARTER
 Q U A R T E R L Y R E P O R T 2017 FOURTH QUARTER Contents Highlights 3 Group summary 5 Business areas 6 Other matters 7 Outlook 8 Financial statements 9 Notes to the financial statements 14 Definitions
Work Programme Nordic Energy Regulators (NordREG)
") Work Programme 2009 Nordic Energy Regulators (NordREG) Work Programme 2009 Nordic Energy Regulators (NordREG) Nordic Energy Regulators 2009 Report 1/2009 NordREG c/o Norwegian Water Resources and Energy
Work Programme 2009 Nordic Energy Regulators (NordREG) Work Programme 2009 Nordic Energy Regulators (NordREG) Nordic Energy Regulators 2009 Report 1/2009 NordREG c/o Norwegian Water Resources and Energy
Vattenfall Capital Markets Day 2009
 Vattenfall Capital Markets Day 2009 Presentation by: Stephen Asplin Head of Business Unit Trading Amsterdam, 23 September 2009 Contents Overview Business Unit Trading Business Unit Trading s role within
Q2/08 STATKRAFT SF INTERIM REPORT
 Q2/08 STATKRAFT SF INTERIM REPORT Key figures Unit Q2 Year to date The year 2008 2007 2008 2007 2007 Gross operating revenues NOK mill. 4,857 2,981 12,109 8,014 17,950 Net operating revenues NOK mill.
Auctioning German Auctioning of Emission Allowances Periodical Report: Annual Report 2015
 Auctioning German Auctioning of Emission Allowances Impressum Publisher German Emissions Trading Authority (DEHSt) at the German Environment Agency Bismarckplatz 1 D-14193 Berlin Phone: +49 (0) 30 89 03-50
Interim report January-September Fortum Corporation 22 October 2015
 Interim report January-September 2015 Fortum Corporation 22 October 2015 Disclaimer This presentation does not constitute an invitation to underwrite, subscribe for, or otherwise acquire or dispose of
JANUARY-MARCH THREE-MONTH INTERIM REPORT 2003
 THREE-MONTH INTERIM REPORT 2003 JANUARY-MARCH Vattenfall stands for openness, accountability and effectiveness. A strong Vattenfall is a quarantee of a well-functioning competition on both the Nordic and
Electricity market in the. Simon-Erik Ollus Baltic Energy Forum, Vilnius 20 November 2014
 Electricity market in the Baltic Sea area today Simon-Erik Ollus Baltic Energy Forum, Vilnius 20 November 2014 Disclaimer This presentation does not constitute an invitation to underwrite, subscribe for,
Gaspoint Nordic A/S. Nordic Gas Exchange. Introduction to the. Updated 1 st quarter 2015
 Gaspoint Nordic A/S Introduction to the Nordic Gas Exchange Updated 1 st quarter 2015 Introducing Gaspoint Nordic Company Background Established in 2008, first trade March 4th Strong ownership - With effect
Stock exchange release 1 (18) FINGRID OYJ EET FINGRID GROUP S INTERIM REPORT 1 JANUARY - 30 SEPTEMBER 2016
 FINGRID OYJ EET FINGRID GROUP S INTERIM REPORT 1 JANUARY - 30 SEPTEMBER 2016") Stock exchange release 1 (18) FINGRID GROUP S INTERIM REPORT 1 JANUARY - 30 SEPTEMBER 2016 Fingrid s consolidated financial statements have been drawn up in accordance with the International Financial
Stock exchange release 1 (18) FINGRID GROUP S INTERIM REPORT 1 JANUARY - 30 SEPTEMBER 2016 Fingrid s consolidated financial statements have been drawn up in accordance with the International Financial
Risk management. See the section Capitalisation and profit distribution in the annual report
 Risk management 2009 Risk management The most important risk types Underwriting risk The risk related to entering into insurance contracts. The risk that claims at the end of an insurance contract deviate
Highlights of Stadshypotek s Annual Report. January December 2017
 Highlights of Stadshypotek s Annual Report January December Highlights of Stadshypotek s Annual Report January December Income totalled SEK 13,373m (12,415). Expenses before loan losses increased by SEK
Interim Report Q4/2015 Statkraft AS
 Q4 Interim Report Q4/2015 Statkraft AS Key figures NOK million 2015 2014 Change 2015 2014 Change From income statement 1) Gross operating revenues, underlying 15 101 13 754 1 346 50 578 48 348 2 230 Net
A leading energy company in the Nordic area
 A leading energy company in the Nordic area Investor Meetings February, 2005 Fortum's strategy Fortum focuses on the Nordic energy market as a platform for long-term profitable growth Create the leading
Highlights of annual report
 20 08 Highlights of annual report Lending increased by SEK 91bn (44) to SEK 615bn, of which SEK 44bn was attributable to the branch in Norway which was added during the third quarter. Operating profits
COMMISSION DELEGATED REGULATION (EU) /... of XXX
 /... of XXX") EUROPEAN COMMISSION Brussels, XXX [ ](2016) XXX draft COMMISSION DELEGATED REGULATION (EU) /... of XXX supplementing Directive 2014/65/EU of the European Parliament and of the Council with regard to regulatory
EUROPEAN COMMISSION Brussels, XXX [ ](2016) XXX draft COMMISSION DELEGATED REGULATION (EU) /... of XXX supplementing Directive 2014/65/EU of the European Parliament and of the Council with regard to regulatory
Anders Plejdrup Houmøller 10 May Wholesale market models and the role of exchanges and traders. Prepared by Anders Plejdrup Houmøller
 Wholesale market models and the role of exchanges and traders Prepared by Anders Plejdrup Houmøller www. erranet.org Agenda The trading system. The spot market. Transparency. Surveillance of the market.
(Text with EEA relevance)
") 31.3.2017 L 87/479 COMMISSION DELEGATED REGULATION (EU) 2017/591 of 1 December 2016 supplementing Directive 2014/65/EU of the European Parliament and of the Council with regard to regulatory technical
31.3.2017 L 87/479 COMMISSION DELEGATED REGULATION (EU) 2017/591 of 1 December 2016 supplementing Directive 2014/65/EU of the European Parliament and of the Council with regard to regulatory technical
FINANCIAL RESULTS Q CEO Christian Rynning-Tønnesen CFO Irene Egset 26 October 2017
 FINANCIAL RESULTS Q3 2017 CEO Christian Rynning-Tønnesen CFO Irene Egset 26 October 2017 Health, safety and environment TRI-rate 1 10 8 6 4 2 0 2014 2015 2016 2017 Health and safety - One serious incident