Image analysis of malign melanoma: Waveles and svd
|
|
|
- Roy Simpson
- 5 years ago
- Views:
Transcription
1 Image analysis of malign melanoma: Waveles and svd Dan Dolonius University of Gothenburg April 28, 2015 Dan Dolonius (Applied Mathematics) Image analysis of malign melanoma April 28, / 45
2 Overview 1 Melanoma Types of melanoma Classification 2 Wavelets 3 Singular Value Decomposition 4 Features Morphological operators 5 Results 6 Second Section Dan Dolonius (Applied Mathematics) Image analysis of malign melanoma April 28, / 45

3 Melanoma A type of skin cancer. Correlation to sun bathing (UV-rays). Important to spot early. Not easy to identify. Dan Dolonius (Applied Mathematics) Image analysis of malign melanoma April 28, / 45
4 Types of melanoma Benign. Not dangerous. A.k.a. Mole. Malign. Lethal. Grows. Irregular. Colorful. Looks quite different from benign. Dysplastic. As benign not dangerous. Looks similar to malign. Makes classification problematic. Dan Dolonius (Applied Mathematics) Image analysis of malign melanoma April 28, / 45


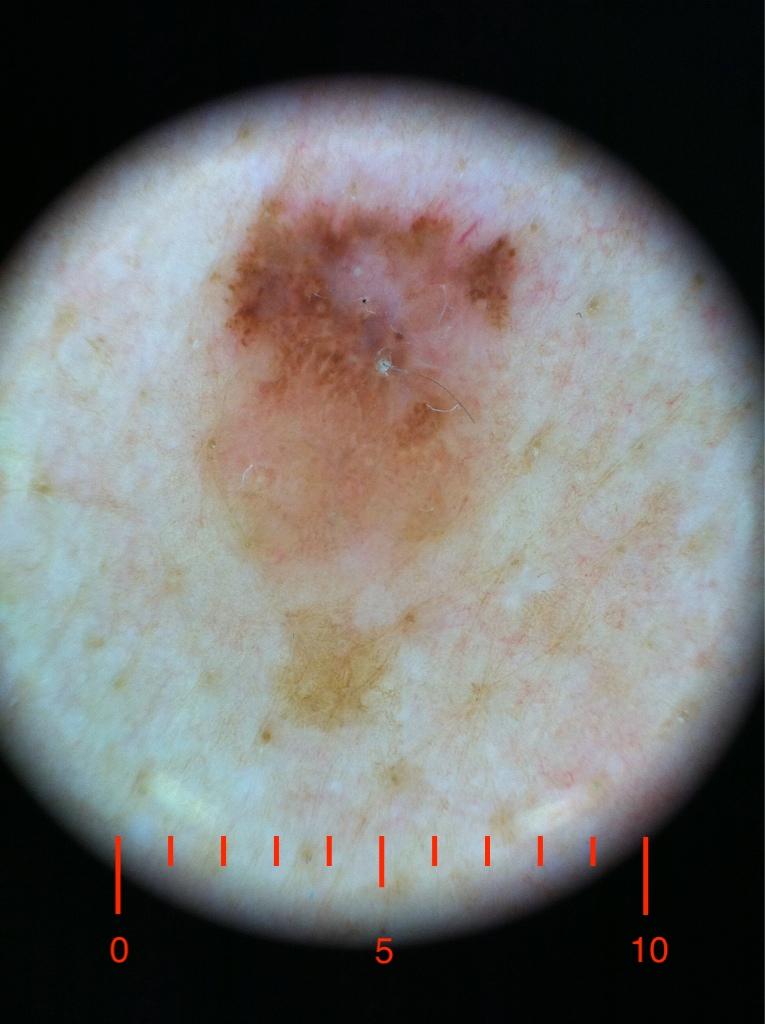

5 Types of melanoma Benign Dan Dolonius (Applied Mathematics) Malign Image analysis of malign melanoma Dysplastic April 28, / 45
6 ABCDE ABCDE-Rule Assymetry. Border. Color. Diameter. Evolution. Dan Dolonius (Applied Mathematics) Image analysis of malign melanoma April 28, / 45
7 Classification Dysplastic and malign share similar features. Need lots of experience to be able to classify. Also use tools to aid. Dermatoscope. The other thing. Our approach: Computer aided image analysis. Dan Dolonius (Applied Mathematics) Image analysis of malign melanoma April 28, / 45
8 Wavlets Similar to fourier transform. Difference between consecutive resolutions. Using different up/down-sampling filters. Basically what we call wavelets. Can be viewed as localized fourier transforms. Scaling function and wavelet. Scaling: Low pass filter. (Approximation) Wavelet: High pass filter (Detail) Dan Dolonius (Applied Mathematics) Image analysis of malign melanoma April 28, / 45
9 Some examples Haar / Db1 Db2 Db4 Dan Dolonius (Applied Mathematics) Image analysis of malign melanoma April 28, / 45
10 Deccomposition for 2D arrays (images) H x H y S j+1 G x H y S j+1 S j+1 H x S j+1 G x S j+1 H x G y S j+1 G x G y S j+1 Figure: 2D Wavelet decomposition. Dan Dolonius (Applied Mathematics) Image analysis of malign melanoma April 28, / 45
11 Deccomposition for 2D arrays (images) S j 1 W H j 1 S j 2 W V j 2 W H j 2 W D j 2 W H j 1 S j W V j 1 W D j 1 W V j 1 W D j 1 Figure: Two steps of decomposition matrix. Dan Dolonius (Applied Mathematics) Image analysis of malign melanoma April 28, / 45
 Image analysis of malign melanoma April 28, 2015 12 / 45")
12 Edge detection Original Reconstruct using only details Horizontal details Vertical details Diagonal details Dan Dolonius (Applied Mathematics) Image analysis of malign melanoma April 28, / 45
13 SVD Remember eigenvalues and vectors. Au = λu 1 u Eigenvector. λ Eigenvalue. Eigen Decomposition. A = UΛU T A Symmetric. Λ Diagonal. Eigenvalues. U Orthogonal. Eigenvectors. Singular Value Decomposition A = UΣV T A not necessarily symmetric. Σ Quasidiagonal. Singularvalues. Similar to eigenvalues. U Orthgonal. V Orthgonal. 1 Typo in paper! Dan Dolonius (Applied Mathematics) Image analysis of malign melanoma April 28, / 45
14 Advantages of SVD Don t need to calculate all the values. Need only calculate the n largest. Economy or compact-svd Different methods for desired importance. Speed. Accuracy. Orthogonality. Number of values. Dan Dolonius (Applied Mathematics) Image analysis of malign melanoma April 28, / 45
15 Principal Component Analysis Project data along orthogonal axes of highest variance. In Decreasing order. Good for making the dataset more compact. Use combination of variables with high variance as parameters instead. Can discard the directions that does not vary a lot. Can be used to aid cluster identification. Clusters may cause high variance along a line. Don t need to find a line since it will end up in along an axis after projection. Basically we do fit lines when doing the PCA. Other uses as well as will be shown later. Dan Dolonius (Applied Mathematics) Image analysis of malign melanoma April 28, / 45
16 PCA + SVD = True PCA by brute force is painfully slow. Can use Eigen decomposition. Given covariance matrix C = XX T 2. X is data with zero mean. C = TDT T Can be shown that the principal components are in Y when Y = TX. Still have to compute XX T. Even better, use SVD! Can be shown that: X = UΣV T Y = U T X 2 abusing notation Dan Dolonius (Applied Mathematics) Image analysis of malign melanoma April 28, / 45
17 Rotation Before Afer Dan Dolonius (Applied Mathematics) Image analysis of malign melanoma April 28, / 45
18 Preprocessing Will no go in to much detail. Noise removal. Used median filter. Lots of other options. Could have used wavelets. Masking out the lesion. Converted to LAB-color space. Used L channel for thresholding (Lightness). Lesions darker than skin. Other options as well. E.g R G B, common in computer graphics. Remove hairs. Clear border. Crop and rotate image. Optimize the lesion to fill image. Can also use this to compare fill rate of each quadrant (Irregularity). Dan Dolonius (Applied Mathematics) Image analysis of malign melanoma April 28, / 45

")

19 Morphological operators Dilation Erosion Opening Closing Dan Dolonius (Applied Mathematics) Image analysis of malign melanoma April 28, / 45
 Image analysis of malign melanoma April 28, 2015")
20 Remove hairs Original Opening Difference Threshold Morphological Final Dan Dolonius (Applied Mathematics) Image analysis of malign melanoma April 28, / 45


21 Closeup Just opening Replcaing only masked areas Dan Dolonius (Applied Mathematics) Image analysis of malign melanoma April 28, / 45
 Image analysis of malign melanoma")
22 Segmentation Segmentation to aid e.g. thresholding. Dan Dolonius (Applied Mathematics) Image analysis of malign melanoma April 28, / 45
23 Skewness and kurtosis Healthy tissue can be expected to have a normal distribution. That is, no exceptional skewness or kurtosis. Check this for wavelet coefficients for each row and col. Skewness Kurtosis Dan Dolonius (Applied Mathematics) Image analysis of malign melanoma April 28, / 45
24 Malign Benign Figure: Test data in LAB-color space. Dan Dolonius (Applied Mathematics) Image analysis of malign melanoma April 28, / 45

 Image")
25 Skewness and kurtosis of wavelet coefficients Skewness Kurtosis DB4 Malign1 Malign2 Benign1 Benign2 Skewness absolute mean Skewness variance Kurtosis mean Kurtosis variance Table: Mean and variance of skewness and kurtosis from spectrum Dan Dolonius (Applied Mathematics) Image analysis of malign melanoma April 28, / 45
26 Skewness Kurtosis DB4 Malign1 Malign2 Benign1 Benign2 Skewness absolute mean Skewness variance # of values above threshold Kurtosis mean Kurtosis variance # of values above threshold Table: Mean, variance and number of values above threshold for skewness and kurtosis from spectrum. Dan Dolonius (Applied Mathematics) Image analysis of malign melanoma April 28, / 45

27 Normal noise Skewness Kurtosis Normal Skewness absolute mean Skewness variance Kurtosis mean Kurtosis variance Table: Skewness and kurtosis values for the control image. Dan Dolonius (Applied Mathematics) Image analysis of malign melanoma April 28, / 45
28 Other parameters Irregularity Solidity Convexity Ir := N2 4πA So := A C A Co := C N N N: Perimeter (Number of pixels along border). A: Area (Total number of pixels). C A : Area of convex hull. C N : Area of perimeter for convex hull. Dan Dolonius (Applied Mathematics) Image analysis of malign melanoma April 28, / 45
29 PCA for neighbours Usually when using SVD with images we treat the whole image as a matrix. Try instead using a (3 3) neighborhood for each pixel instead. We get 27 bases (each pixel has 3 values, rgb). By re-projecting the image on each of these bases we can identify different details. Unfortunately didn t have time to investigate this much. Ended up using simple mean, variance, skewness and kurtosis for each image. Dan Dolonius (Applied Mathematics) Image analysis of malign melanoma April 28, / 45
 Image analysis of")
30 Figure: Test image. Dan Dolonius (Applied Mathematics) Image analysis of malign melanoma April 28, / 45


")

31 Examples Figure: The different bases. Dan Dolonius (Applied Mathematics) Image analysis of malign melanoma April 28, / 45


32 Figure: Reprojected images. Dan Dolonius (Applied Mathematics) Image analysis of malign melanoma April 28, / 45
33 Results Used linear regression. Forward and backward selection. When fitting, alternate between adding and removing parameters. 1 Use all the data to figure out what parameters to include. 2 Take e.g. 70% as training data and 30% as test. 3 Fit the training data to the model acquired in step one using simple regression. 4 Evaluate the test data and save results. 5 Go to step 2. Stop after n steps or until convergence of e.g. the mean squared error of the model or the misclassification rate. Dan Dolonius (Applied Mathematics) Image analysis of malign melanoma April 28, / 45
34 Sensitivity Percentage of correctly identified malign lesions Specificity Percentage of correctly identified benign lesions Can tweak classification threshold to favor one over the other. Dan Dolonius (Applied Mathematics) Image analysis of malign melanoma April 28, / 45
35 Final remarks and results By tweaking the input data (Procedure steps, transforming parameters) managed to fairly easily get aroun 80% in specificity and sensitivity. Some best results up to 93%. Don t trust model too much! Many parameters per data-points (10:100). Not homogeneous data. Had to manipulate. Malign images had higher resolution. Had to downscale. Usually some polynomial is used to avoid aliasing. Could possibly affect wavelets (Some have close relations to polynomials, vanishing moments ). However consistent results show that there is information which is worth investigating. Dan Dolonius (Applied Mathematics) Image analysis of malign melanoma April 28, / 45
36 I have spoken! Dan Dolonius (Applied Mathematics) Image analysis of malign melanoma April 28, / 45
Market Risk Analysis Volume I
 Market Risk Analysis Volume I Quantitative Methods in Finance Carol Alexander John Wiley & Sons, Ltd List of Figures List of Tables List of Examples Foreword Preface to Volume I xiii xvi xvii xix xxiii
9.1 Principal Component Analysis for Portfolios
 Chapter 9 Alpha Trading By the name of the strategies, an alpha trading strategy is to select and trade portfolios so the alpha is maximized. Two important mathematical objects are factor analysis and
A Non-Normal Principal Components Model for Security Returns
 A Non-Normal Principal Components Model for Security Returns Sander Gerber Babak Javid Harry Markowitz Paul Sargen David Starer February 21, 219 Abstract We introduce a principal components model for securities
Identifying Useful Variables for Vehicle Braking Using the Adjoint Matrix Approach to the Mahalanobis-Taguchi System
 Journal of Industrial and Systems Engineering Vol. 1, No. 4, pp 281-292 Winter 2008 Identifying Useful Variables for Vehicle Braking Using the Adjoint Matrix Approach to the Mahalanobis-Taguchi System
Visualizing 360 Data Points in a Single Display. Stephen Few
 Visualizing 360 Data Points in a Single Display Stephen Few This paper explores ways to visualize a dataset that Jorge Camoes posted on the Perceptual Edge Discussion Forum. Jorge s initial visualization
Testing the significance of the RV coefficient
 1 / 19 Testing the significance of the RV coefficient Application to napping data Julie Josse, François Husson and Jérôme Pagès Applied Mathematics Department Agrocampus Rennes, IRMAR CNRS UMR 6625 Agrostat
An advanced method for preserving skewness in single-variate, multivariate, and disaggregation models in stochastic hydrology
 XXIV General Assembly of European Geophysical Society The Hague, 9-3 April 999 HSA9.0 Open session on statistical methods in hydrology An advanced method for preserving skewness in single-variate, multivariate,
A ROBUST IMAGE SHARPNESS METRIC BASED ON KURTOSIS MEASUREMENT OF WAVELET COEFFICIENTS
 A ROBUST IMAGE SHARPNESS METRIC BASED ON KURTOSIS MEASUREMENT OF WAVELET COEFFICIENTS R. Ferzli, Lina J. Karam Department of Electrical Engineering Arizona State University Tempe, AZ 85287-5706 J. Caviedes
ROM Simulation with Exact Means, Covariances, and Multivariate Skewness
 ROM Simulation with Exact Means, Covariances, and Multivariate Skewness Michael Hanke 1 Spiridon Penev 2 Wolfgang Schief 2 Alex Weissensteiner 3 1 Institute for Finance, University of Liechtenstein 2 School
IOP 201-Q (Industrial Psychological Research) Tutorial 5
 Tutorial 5") IOP 201-Q (Industrial Psychological Research) Tutorial 5 TRUE/FALSE [1 point each] Indicate whether the sentence or statement is true or false. 1. To establish a cause-and-effect relation between two variables,
IOP 201-Q (Industrial Psychological Research) Tutorial 5 TRUE/FALSE [1 point each] Indicate whether the sentence or statement is true or false. 1. To establish a cause-and-effect relation between two variables,
Lecture 3: Factor models in modern portfolio choice
 Lecture 3: Factor models in modern portfolio choice Prof. Massimo Guidolin Portfolio Management Spring 2016 Overview The inputs of portfolio problems Using the single index model Multi-index models Portfolio
Chapter 6 Simple Correlation and
 Contents Chapter 1 Introduction to Statistics Meaning of Statistics... 1 Definition of Statistics... 2 Importance and Scope of Statistics... 2 Application of Statistics... 3 Characteristics of Statistics...
Wavelet Based Microcalcification Detection On Mammographic Images
 IJCSNS International Journal of Computer Science and Network Security, VOL.9 No.7, July 2009 213 Wavelet Based Microcalcification Detection On Mammographic Images K.Prabhu Shetty, Dr. V. R. Udupi and Mr.
Chapter 3. Numerical Descriptive Measures. Copyright 2016 Pearson Education, Ltd. Chapter 3, Slide 1
 Chapter 3 Numerical Descriptive Measures Copyright 2016 Pearson Education, Ltd. Chapter 3, Slide 1 Objectives In this chapter, you learn to: Describe the properties of central tendency, variation, and
Forecasting: an introduction. There are a variety of ad hoc methods as well as a variety of statistically derived methods.
 Forecasting: an introduction Given data X 0,..., X T 1. Goal: guess, or forecast, X T or X T+r. There are a variety of ad hoc methods as well as a variety of statistically derived methods. Illustration
Appendix A (Pornprasertmanit & Little, in press) Mathematical Proof
 Mathematical Proof") Appendix A (Pornprasertmanit & Little, in press) Mathematical Proof Definition We begin by defining notations that are needed for later sections. First, we define moment as the mean of a random variable
Appendix A (Pornprasertmanit & Little, in press) Mathematical Proof Definition We begin by defining notations that are needed for later sections. First, we define moment as the mean of a random variable
Non linearity issues in PD modelling. Amrita Juhi Lucas Klinkers
 Non linearity issues in PD modelling Amrita Juhi Lucas Klinkers May 2017 Content Introduction Identifying non-linearity Causes of non-linearity Performance 2 Content Introduction Identifying non-linearity
Correlation Structures Corresponding to Forward Rates
 Chapter 6 Correlation Structures Corresponding to Forward Rates Ilona Kletskin 1, Seung Youn Lee 2, Hua Li 3, Mingfei Li 4, Rongsong Liu 5, Carlos Tolmasky 6, Yujun Wu 7 Report prepared by Seung Youn Lee
A STATISTICAL MODEL OF ORGANIZATIONAL PERFORMANCE USING FACTOR ANALYSIS - A CASE OF A BANK IN GHANA. P. O. Box 256. Takoradi, Western Region, Ghana
 Vol.3,No.1, pp.38-46, January 015 A STATISTICAL MODEL OF ORGANIZATIONAL PERFORMANCE USING FACTOR ANALYSIS - A CASE OF A BANK IN GHANA Emmanuel M. Baah 1*, Joseph K. A. Johnson, Frank B. K. Twenefour 3
RISKMETRICS. Dr Philip Symes
 1 RISKMETRICS Dr Philip Symes 1. Introduction 2 RiskMetrics is JP Morgan's risk management methodology. It was released in 1994 This was to standardise risk analysis in the industry. Scenarios are generated
IDENTIFYING BROAD AND NARROW FINANCIAL RISK FACTORS VIA CONVEX OPTIMIZATION: PART I
 1 IDENTIFYING BROAD AND NARROW FINANCIAL RISK FACTORS VIA CONVEX OPTIMIZATION: PART I Lisa Goldberg lrg@berkeley.edu MMDS Workshop. June 22, 2016. joint with Alex Shkolnik and Jeff Bohn. Identifying Broad
Attilio Meucci. Managing Diversification
 Attilio Meucci Managing Diversification A. MEUCCI - Managing Diversification COMMON MEASURES OF DIVERSIFICATION DIVERSIFICATION DISTRIBUTION MEAN-DIVERSIFICATION FRONTIER CONDITIONAL ANALYSIS REFERENCES
Market Risk Analysis Volume II. Practical Financial Econometrics
 Market Risk Analysis Volume II Practical Financial Econometrics Carol Alexander John Wiley & Sons, Ltd List of Figures List of Tables List of Examples Foreword Preface to Volume II xiii xvii xx xxii xxvi
Improving Stock Price Prediction with SVM by Simple Transformation: The Sample of Stock Exchange of Thailand (SET)
") Thai Journal of Mathematics Volume 14 (2016) Number 3 : 553 563 http://thaijmath.in.cmu.ac.th ISSN 1686-0209 Improving Stock Price Prediction with SVM by Simple Transformation: The Sample of Stock Exchange
Thai Journal of Mathematics Volume 14 (2016) Number 3 : 553 563 http://thaijmath.in.cmu.ac.th ISSN 1686-0209 Improving Stock Price Prediction with SVM by Simple Transformation: The Sample of Stock Exchange
A general approach to calculating VaR without volatilities and correlations
 page 19 A general approach to calculating VaR without volatilities and correlations Peter Benson * Peter Zangari Morgan Guaranty rust Company Risk Management Research (1-212) 648-8641 zangari_peter@jpmorgan.com
Nonlinear Manifold Learning for Financial Markets Integration
 Nonlinear Manifold Learning for Financial Markets Integration George Tzagkarakis 1 & Thomas Dionysopoulos 1,2 1 EONOS Investment Technologies, Paris (FR) 2 Dalton Strategic Partnership, London (UK) Nice,
FE670 Algorithmic Trading Strategies. Stevens Institute of Technology
 FE670 Algorithmic Trading Strategies Lecture 4. Cross-Sectional Models and Trading Strategies Steve Yang Stevens Institute of Technology 09/26/2013 Outline 1 Cross-Sectional Methods for Evaluation of Factor
EE/AA 578 Univ. of Washington, Fall Homework 8
 EE/AA 578 Univ. of Washington, Fall 2016 Homework 8 1. Multi-label SVM. The basic Support Vector Machine (SVM) described in the lecture (and textbook) is used for classification of data with two labels.
A Statistical Analysis to Predict Financial Distress
 J. Service Science & Management, 010, 3, 309-335 doi:10.436/jssm.010.33038 Published Online September 010 (http://www.scirp.org/journal/jssm) 309 Nicolas Emanuel Monti, Roberto Mariano Garcia Department
Empirical Analysis of the US Swap Curve Gough, O., Juneja, J.A., Nowman, K.B. and Van Dellen, S.
 WestminsterResearch http://www.westminster.ac.uk/westminsterresearch Empirical Analysis of the US Swap Curve Gough, O., Juneja, J.A., Nowman, K.B. and Van Dellen, S. This is a copy of the final version
Risk Control of Mean-Reversion Time in Statistical Arbitrage,
 Risk Control of Mean-Reversion Time in Statistical Arbitrage George Papanicolaou Stanford University CDAR Seminar, UC Berkeley April 6, 8 with Joongyeub Yeo Risk Control of Mean-Reversion Time in Statistical
Random Variables and Probability Distributions
 Chapter 3 Random Variables and Probability Distributions Chapter Three Random Variables and Probability Distributions 3. Introduction An event is defined as the possible outcome of an experiment. In engineering
Modeling Volatility Risk in Equity Options: a Cross-sectional approach
 ICBI Global Derivatives, Amsterdam, 2014 Modeling Volatility Risk in Equity Options: a Cross-sectional approach Marco Avellaneda NYU & Finance Concepts Doris Dobi* NYU * This work is part of Doris Dobi
The mean-variance portfolio choice framework and its generalizations
 The mean-variance portfolio choice framework and its generalizations Prof. Massimo Guidolin 20135 Theory of Finance, Part I (Sept. October) Fall 2014 Outline and objectives The backward, three-step solution
IDENTIFYING BROAD AND NARROW FINANCIAL RISK FACTORS VIA CONVEX OPTIMIZATION: PART II
 1 IDENTIFYING BROAD AND NARROW FINANCIAL RISK FACTORS VIA CONVEX OPTIMIZATION: PART II Alexander D. Shkolnik ads2@berkeley.edu MMDS Workshop. June 22, 2016. joint with Jeffrey Bohn and Lisa Goldberg. Identifying
2D penalized spline (continuous-by-continuous interaction)
") 2D penalized spline (continuous-by-continuous interaction) Two examples (RWC, Section 13.1): Number of scallops caught off Long Island Counts are made at specific coordinates. Incidence of AIDS in Italian
2D penalized spline (continuous-by-continuous interaction) Two examples (RWC, Section 13.1): Number of scallops caught off Long Island Counts are made at specific coordinates. Incidence of AIDS in Italian
I Preliminary Material 1
 Contents Preface Notation xvii xxiii I Preliminary Material 1 1 From Diffusions to Semimartingales 3 1.1 Diffusions.......................... 5 1.1.1 The Brownian Motion............... 5 1.1.2 Stochastic
Vega Maps: Predicting Premium Change from Movements of the Whole Volatility Surface
 Vega Maps: Predicting Premium Change from Movements of the Whole Volatility Surface Ignacio Hoyos Senior Quantitative Analyst Equity Model Validation Group Risk Methodology Santander Alberto Elices Head
Noise Detection Using Higher Order Statistical Method for Satellite Images
 International Journal of Electronics Engineering Research. ISSN 0975-6450 Volume 9, Number 1 (2017) pp. 29-36 Research India Publications http://www.ripublication.com Noise Detection Using Higher Order
Option-Implied Correlations, Factor Models, and Market Risk
 Option-Implied Correlations, Factor Models, and Market Risk Adrian Buss Lorenzo Schönleber Grigory Vilkov INSEAD Frankfurt School Frankfurt School of Finance & Management of Finance & Management 17th November
arxiv: v1 [math.st] 18 Sep 2018
![arxiv: v1 [math.st] 18 Sep 2018](/thumbs/90/102184945.jpg "arxiv: v1 [math.st] 18 Sep 2018") Gram Charlier and Edgeworth expansion for sample variance arxiv:809.06668v [math.st] 8 Sep 08 Eric Benhamou,* A.I. SQUARE CONNECT, 35 Boulevard d Inkermann 900 Neuilly sur Seine, France and LAMSADE, Universit
Gram Charlier and Edgeworth expansion for sample variance arxiv:809.06668v [math.st] 8 Sep 08 Eric Benhamou,* A.I. SQUARE CONNECT, 35 Boulevard d Inkermann 900 Neuilly sur Seine, France and LAMSADE, Universit
SCHOOL OF BUSINESS, ECONOMICS AND MANAGEMENT. BF360 Operations Research
 SCHOOL OF BUSINESS, ECONOMICS AND MANAGEMENT BF360 Operations Research Unit 3 Moses Mwale e-mail: moses.mwale@ictar.ac.zm BF360 Operations Research Contents Unit 3: Sensitivity and Duality 3 3.1 Sensitivity
Enhancing the Practical Usefulness of a Markowitz Optimal Portfolio by Controlling a Market Factor in Correlation between Stocks
 Enhancing the Practical Usefulness of a Markowitz Optimal Portfolio by Controlling a Market Factor in Correlation between Stocks Cheoljun Eom 1, Taisei Kaizoji 2**, Yong H. Kim 3, and Jong Won Park 4 1.
Basic Procedure for Histograms
 Basic Procedure for Histograms 1. Compute the range of observations (min. & max. value) 2. Choose an initial # of classes (most likely based on the range of values, try and find a number of classes that
Key Features Asset allocation, cash flow analysis, object-oriented portfolio optimization, and risk analysis
 Financial Toolbox Analyze financial data and develop financial algorithms Financial Toolbox provides functions for mathematical modeling and statistical analysis of financial data. You can optimize portfolios
In terms of covariance the Markowitz portfolio optimisation problem is:
 Markowitz portfolio optimisation Solver To use Solver to solve the quadratic program associated with tracing out the efficient frontier (unconstrained efficient frontier UEF) in Markowitz portfolio optimisation
Statistical Evidence and Inference
 Statistical Evidence and Inference Basic Methods of Analysis Understanding the methods used by economists requires some basic terminology regarding the distribution of random variables. The mean of a distribution
Financial Mathematics III Theory summary
 Financial Mathematics III Theory summary Table of Contents Lecture 1... 7 1. State the objective of modern portfolio theory... 7 2. Define the return of an asset... 7 3. How is expected return defined?...
Currency Hedging for Long Term Investors with Liabilities
 Currency Hedging for Long Term Investors with Liabilities Gerrit Pieter van Nes B.Sc. April 2009 Supervisors Dr. Kees Bouwman Dr. Henk Hoek Drs. Loranne van Lieshout Table of Contents LIST OF FIGURES...
Problem Set 6. I did this with figure; bar3(reshape(mean(rx),5,5) );ylabel( size ); xlabel( value ); mean mo return %
,5,5) );ylabel( size ); xlabel( value ); mean mo return %") Business 35905 John H. Cochrane Problem Set 6 We re going to replicate and extend Fama and French s basic results, using earlier and extended data. Get the 25 Fama French portfolios and factors from the
Business 35905 John H. Cochrane Problem Set 6 We re going to replicate and extend Fama and French s basic results, using earlier and extended data. Get the 25 Fama French portfolios and factors from the
Jaime Frade Dr. Niu Interest rate modeling
 Interest rate modeling Abstract In this paper, three models were used to forecast short term interest rates for the 3 month LIBOR. Each of the models, regression time series, GARCH, and Cox, Ingersoll,
Convex-Cardinality Problems
 l 1 -norm Methods for Convex-Cardinality Problems problems involving cardinality the l 1 -norm heuristic convex relaxation and convex envelope interpretations examples recent results Prof. S. Boyd, EE364b,
Introduction to Algorithmic Trading Strategies Lecture 9
 Introduction to Algorithmic Trading Strategies Lecture 9 Quantitative Equity Portfolio Management Haksun Li haksun.li@numericalmethod.com www.numericalmethod.com Outline Alpha Factor Models References
symmys.com 3.2 Projection of the invariants to the investment horizon
 122 3 Modeling the market In the swaption world the underlying rate (3.57) has a bounded range and thus it does not display the explosive pattern typical of a stock price. Therefore the swaption prices
The Delta Method. j =.
 The Delta Method Often one has one or more MLEs ( 3 and their estimated, conditional sampling variancecovariance matrix. However, there is interest in some function of these estimates. The question is,
Automated PSF measurement and homogenization in DESDM
 Automated PSF measurement and homogenization in DESDM E.Bertin (IAP) E. Bertin DES Munich meeting 05/2010 1 PSF homogenization History Science requirements PSFEX internals Point source selection PSF modeling
appstats5.notebook September 07, 2016 Chapter 5
 Chapter 5 Describing Distributions Numerically Chapter 5 Objective: Students will be able to use statistics appropriate to the shape of the data distribution to compare of two or more different data sets.
dt+ ρσ 2 1 ρ2 σ 2 κ i and that A is a rather lengthy expression that we may or may not need. (Brigo & Mercurio Lemma Thm , p. 135.
 A 2D Gaussian model (akin to Brigo & Mercurio Section 4.2) Suppose where ( κ1 0 dx(t) = 0 κ 2 r(t) = δ 0 +X 1 (t)+x 2 (t) )( X1 (t) X 2 (t) ) ( σ1 0 dt+ ρσ 2 1 ρ2 σ 2 )( dw Q 1 (t) dw Q 2 (t) ) In this
Linda Allen, Jacob Boudoukh and Anthony Saunders, Understanding Market, Credit and Operational Risk: The Value at Risk Approach
 P1.T4. Valuation & Risk Models Linda Allen, Jacob Boudoukh and Anthony Saunders, Understanding Market, Credit and Operational Risk: The Value at Risk Approach Bionic Turtle FRM Study Notes Reading 26 By
Cross-Section Performance Reversion
 Cross-Section Performance Reversion Maxime Rivet, Marc Thibault and Maël Tréan Stanford University, ICME mrivet, marcthib, mtrean at stanford.edu Abstract This article presents a way to use cross-section
Hitotsubashi ICS-FS Working Paper Series. A method for risk parity/budgeting portfolio based on Gram-Schmidt orthonormalization
 Hitotsubashi ICS-FS Working Paper Series FS-2017-E-003 A method for risk parity/budgeting portfolio based on Gram-Schmidt orthonormalization Kensuke Kamauchi Daisuke Yokouchi The Graduate School of International
Chapter 8. Markowitz Portfolio Theory. 8.1 Expected Returns and Covariance
 Chapter 8 Markowitz Portfolio Theory 8.1 Expected Returns and Covariance The main question in portfolio theory is the following: Given an initial capital V (0), and opportunities (buy or sell) in N securities
Expert Systems with Applications
 Expert Systems with Applications 40 (2013) 3970 3983 Contents lists available at SciVerse ScienceDirect Expert Systems with Applications journal homepage: www.elsevier.com/locate/eswa Measuring firm performance
Risk Measuring of Chosen Stocks of the Prague Stock Exchange
 Risk Measuring of Chosen Stocks of the Prague Stock Exchange Ing. Mgr. Radim Gottwald, Department of Finance, Faculty of Business and Economics, Mendelu University in Brno, radim.gottwald@mendelu.cz Abstract
A way to improve incremental 2-norm condition estimation
 A way to improve incremental 2-norm condition estimation Jurjen Duintjer Tebbens Institute of Computer Science Academy of Sciences of the Czech Republic duintjertebbens@cs.cas.cz Miroslav Tůma Institute
Bloomberg. Portfolio Value-at-Risk. Sridhar Gollamudi & Bryan Weber. September 22, Version 1.0
 Portfolio Value-at-Risk Sridhar Gollamudi & Bryan Weber September 22, 2011 Version 1.0 Table of Contents 1 Portfolio Value-at-Risk 2 2 Fundamental Factor Models 3 3 Valuation methodology 5 3.1 Linear factor
A Primer on the Orthogonal GARCH Model
 1 A Primer on the Orthogonal GARCH Model Professor Carol Alexander ISMA Centre, The Business School for Financial Markets, University of Reading Keywords: Principal component analysis, covariance matrix,
Summary of Statistical Analysis Tools EDAD 5630
 Summary of Statistical Analysis Tools EDAD 5630 Test Name Program Used Purpose Steps Main Uses/Applications in Schools Principal Component Analysis SPSS Measure Underlying Constructs Reliability SPSS Measure
Statistics and Finance
 David Ruppert Statistics and Finance An Introduction Springer Notation... xxi 1 Introduction... 1 1.1 References... 5 2 Probability and Statistical Models... 7 2.1 Introduction... 7 2.2 Axioms of Probability...
Bivariate Birnbaum-Saunders Distribution
 Department of Mathematics & Statistics Indian Institute of Technology Kanpur January 2nd. 2013 Outline 1 Collaborators 2 3 Birnbaum-Saunders Distribution: Introduction & Properties 4 5 Outline 1 Collaborators
Stat 401XV Exam 3 Spring 2017
 Stat 40XV Exam Spring 07 I have neither given nor received unauthorized assistance on this exam. Name Signed Date Name Printed ATTENTION! Incorrect numerical answers unaccompanied by supporting reasoning
1102 IEEE TRANSACTIONS ON INFORMATION THEORY, VOL. 51, NO. 3, MARCH Genyuan Wang and Xiang-Gen Xia, Senior Member, IEEE
 1102 IEEE TRANSACTIONS ON INFORMATION THEORY, VOL 51, NO 3, MARCH 2005 On Optimal Multilayer Cyclotomic Space Time Code Designs Genyuan Wang Xiang-Gen Xia, Senior Member, IEEE Abstract High rate large
On the Distribution of Kurtosis Test for Multivariate Normality
 On the Distribution of Kurtosis Test for Multivariate Normality Takashi Seo and Mayumi Ariga Department of Mathematical Information Science Tokyo University of Science 1-3, Kagurazaka, Shinjuku-ku, Tokyo,
The University of Sydney School of Mathematics and Statistics. Computer Project
 The University of Sydney School of Mathematics and Statistics Computer Project MATH2070/2970: Optimisation and Financial Mathematics Semester 2, 2018 Web Page: http://www.maths.usyd.edu.au/u/im/math2070/
Assessment on Credit Risk of Real Estate Based on Logistic Regression Model
 Assessment on Credit Risk of Real Estate Based on Logistic Regression Model Li Hongli 1, a, Song Liwei 2,b 1 Chongqing Engineering Polytechnic College, Chongqing400037, China 2 Division of Planning and
Financial Econometrics
 Financial Econometrics Introduction to Financial Econometrics Gerald P. Dwyer Trinity College, Dublin January 2016 Outline 1 Set Notation Notation for returns 2 Summary statistics for distribution of data
Alternative VaR Models
 Alternative VaR Models Neil Roeth, Senior Risk Developer, TFG Financial Systems. 15 th July 2015 Abstract We describe a variety of VaR models in terms of their key attributes and differences, e.g., parametric
Intro to GLM Day 2: GLM and Maximum Likelihood
 Intro to GLM Day 2: GLM and Maximum Likelihood Federico Vegetti Central European University ECPR Summer School in Methods and Techniques 1 / 32 Generalized Linear Modeling 3 steps of GLM 1. Specify the
ELEMENTS OF MATRIX MATHEMATICS
 QRMC07 9/7/0 4:45 PM Page 5 CHAPTER SEVEN ELEMENTS OF MATRIX MATHEMATICS 7. AN INTRODUCTION TO MATRICES Investors frequently encounter situations involving numerous potential outcomes, many discrete periods
Contents. An Overview of Statistical Applications CHAPTER 1. Contents (ix) Preface... (vii)
 Preface... (vii)") Contents (ix) Contents Preface... (vii) CHAPTER 1 An Overview of Statistical Applications 1.1 Introduction... 1 1. Probability Functions and Statistics... 1..1 Discrete versus Continuous Functions... 1..
Contents (ix) Contents Preface... (vii) CHAPTER 1 An Overview of Statistical Applications 1.1 Introduction... 1 1. Probability Functions and Statistics... 1..1 Discrete versus Continuous Functions... 1..
Measures of Central tendency
 Elementary Statistics Measures of Central tendency By Prof. Mirza Manzoor Ahmad In statistics, a central tendency (or, more commonly, a measure of central tendency) is a central or typical value for a
Executive Summary: A CVaR Scenario-based Framework For Minimizing Downside Risk In Multi-Asset Class Portfolios
 Executive Summary: A CVaR Scenario-based Framework For Minimizing Downside Risk In Multi-Asset Class Portfolios Axioma, Inc. by Kartik Sivaramakrishnan, PhD, and Robert Stamicar, PhD August 2016 In this
OPERATIONAL EXPANDITURE BENCHMARKING OF REGIONAL DISTRIBUTION UNITS AS A TOOL FOR EFFICIENCY EVALUATION AND DESIRED COST LEVEL ESTIMATION
 OPERATIONAL EXPANDITURE BENCHMARKING OF REGIONAL DISTRIBUTION UNITS AS A TOOL FOR EFFICIENCY EVALUATION AND DESIRED COST LEVEL ESTIMATION Jerzy ANDRUSZKIEWICZ Wojciech ANDRUSZKIEWICZ Roman SŁOWIŃSKI Enea
Copulas? What copulas? R. Chicheportiche & J.P. Bouchaud, CFM
 Copulas? What copulas? R. Chicheportiche & J.P. Bouchaud, CFM Multivariate linear correlations Standard tool in risk management/portfolio optimisation: the covariance matrix R ij = r i r j Find the portfolio
Financial Econometrics
 Financial Econometrics Volatility Gerald P. Dwyer Trinity College, Dublin January 2013 GPD (TCD) Volatility 01/13 1 / 37 Squared log returns for CRSP daily GPD (TCD) Volatility 01/13 2 / 37 Absolute value
A Hybrid Commodity and Interest Rate Market Model
 A Hybrid Commodity and Interest Rate Market Model University of Technology, Sydney June 1 Literature A Hybrid Market Model Recall: The basic LIBOR Market Model The cross currency LIBOR Market Model LIBOR
Financial Contagion in the Recent Financial Crisis: Evidence from the Romanian Capital Market
 Financial Contagion in the Recent Financial Crisis: Evidence from the Romanian Capital Market Cărăușu Dumitru-Nicușor Alexandru Ioan Cuza" University of Iași, Faculty of Economics and Business Administration
Some Characteristics of Data
 Some Characteristics of Data Not all data is the same, and depending on some characteristics of a particular dataset, there are some limitations as to what can and cannot be done with that data. Some key
Reduced models for sparse grid discretizations of the multi-asset Black-Scholes equation
 Reduced models for sparse grid discretizations of the multi-asset Black-Scholes equation The MIT Faculty has made this article openly available. Please share how this access benefits you. Your story matters.
Exploring the Potential of Image-based Deep Learning in Insurance. Luisa F. Polanía Cabrera
 Exploring the Potential of Image-based Deep Learning in Insurance Luisa F. Polanía Cabrera 1 Madison, Wisconsin based American Family Insurance is the nation's third-largest mutual property/casualty insurance
Design of a Financial Application Driven Multivariate Gaussian Random Number Generator for an FPGA
 Design of a Financial Application Driven Multivariate Gaussian Random Number Generator for an FPGA Chalermpol Saiprasert, Christos-Savvas Bouganis and George A. Constantinides Department of Electrical
Survival of Hedge Funds : Frailty vs Contagion
 Survival of Hedge Funds : Frailty vs Contagion February, 2015 1. Economic motivation Financial entities exposed to liquidity risk(s)... on the asset component of the balance sheet (market liquidity) on
Formulating SALCs with Projection Operators
 Formulating SALCs with Projection Operators U The mathematical form of a SALC for a particular symmetry species cannot always be deduced by inspection (e.g., e 1g and e u pi-mos of benzene). U A projection
Modern Methods of Data Analysis - SS 2009
 Modern Methods of Data Analysis Lecture II (7.04.09) Contents: Characterize data samples Characterize distributions Correlations, covariance Reminder: Average of a Sample arithmetic mean of data set: weighted
On multivariate Multi-Resolution Analysis, using generalized (non homogeneous) polyharmonic splines. or: A way for deriving RBF and associated MRA
 polyharmonic splines. or: A way for deriving RBF and associated MRA") MAIA conference Erice (Italy), September 6, 3 On multivariate Multi-Resolution Analysis, using generalized (non homogeneous) polyharmonic splines or: A way for deriving RBF and associated MRA Christophe
MAIA conference Erice (Italy), September 6, 3 On multivariate Multi-Resolution Analysis, using generalized (non homogeneous) polyharmonic splines or: A way for deriving RBF and associated MRA Christophe
Inferences on Correlation Coefficients of Bivariate Log-normal Distributions
 Inferences on Correlation Coefficients of Bivariate Log-normal Distributions Guoyi Zhang 1 and Zhongxue Chen 2 Abstract This article considers inference on correlation coefficients of bivariate log-normal
Markowitz portfolio theory. May 4, 2017
 Markowitz portfolio theory Elona Wallengren Robin S. Sigurdson May 4, 2017 1 Introduction A portfolio is the set of assets that an investor chooses to invest in. Choosing the optimal portfolio is a complex
dt + ρσ 2 1 ρ2 σ 2 B i (τ) = 1 e κ iτ κ i
 = 1 e κ iτ κ i") A 2D Gaussian model (akin to Brigo & Mercurio Section 4.2) Suppose where dx(t) = ( κ1 0 0 κ 2 ) ( X1 (t) X 2 (t) In this case we find (BLACKBOARD) that r(t) = δ 0 + X 1 (t) + X 2 (t) ) ( σ1 0 dt + ρσ 2
A 2D Gaussian model (akin to Brigo & Mercurio Section 4.2) Suppose where dx(t) = ( κ1 0 0 κ 2 ) ( X1 (t) X 2 (t) In this case we find (BLACKBOARD) that r(t) = δ 0 + X 1 (t) + X 2 (t) ) ( σ1 0 dt + ρσ 2
Modelling the Sharpe ratio for investment strategies
 Modelling the Sharpe ratio for investment strategies Group 6 Sako Arts 0776148 Rik Coenders 0777004 Stefan Luijten 0783116 Ivo van Heck 0775551 Rik Hagelaars 0789883 Stephan van Driel 0858182 Ellen Cardinaels
The Loans_processed.csv file is the dataset we obtained after the pre-processing part where the clean-up python code was used.
 Machine Learning Group Homework 3 MSc Business Analytics Team 9 Alexander Romanenko, Artemis Tomadaki, Justin Leiendecker, Zijun Wei, Reza Brianca Widodo The Loans_processed.csv file is the dataset we