Probability: Week 4. Kwonsang Lee. University of Pennsylvania February 13, 2015
|
|
|
- Byron Thompson
- 5 years ago
- Views:
Transcription
1 Probability: Week 4 Kwonsang Lee University of Pennsylvania kwonlee@wharton.upenn.edu February 13, 2015 Kwonsang Lee STAT111 February 13, / 21
2 Probability Sample space S: the set of all possible outcomes Event A: an outcome or a set of outcomes of a random process. For example, we can consider to toss a fair coin twice Sample space S: {HH, HT, TH, TT} Event A = getting at least one head: {HH, HT, TH} Pr(A) = 3/4 Note: Do you know how to solve at least one problem? Kwonsang Lee STAT111 February 13, / 21
3 Disjoint events Events A and B are called disjoint if they never occur together. For example, a fair die is rolled once. The event A is getting a odd number and the event B is getting an even number. Sample space S: {1, 2, 3, 4, 5, 6} Event A: {1, 3, 5} Event B: {2, 4, 6} No intersection A and B Addition Rule for disjoint events: If A and B are disjoint, then Pr(A or B) = Pr(A) + Pr(B) Kwonsang Lee STAT111 February 13, / 21
4 Independent events Events A and B are independent if knowing that one occurs does not change the probability that the other occurs. For example, rolling a fair die twice Event A: getting a even number at first rolling Event B: getting a even number at second rolling A and B are independent. Multiplication Rule for independent events: If A and B are independent, then Pr(A and B) = Pr(A) Pr(B) Kwonsang Lee STAT111 February 13, / 21
5 Independent events (optional) More precisely, A and B are independent Pr(A and B) = Pr(A) Pr(B) Sometimes, independence is not trivial Example: Rolling a fair die once. Sample space S: {1, 2, 3, 4, 5, 6} Event A = getting a even number: {2, 4, 6}, Pr(A) = 3/6 = 1/2 Event B = getting a multiple of three: {3, 6}, Pr(B) = 2/6 = 1/3 A and B: {6}, Pr(A and B) = 1/6 Therefore, A and B are independent. Pr(A and B) = Pr(A) Pr(B) = 1/6!! Kwonsang Lee STAT111 February 13, / 21
6 Conditional Probability The conditional probability that event B occurs given that event A has occurred is Pr(A and B) Pr(B A) =. Pr(A) If A and B are independent, Pr(B A) = Pr(A and B) Pr(A) = Pr(A) Pr(B) Pr(A) = Pr(B). Event A has no effect on event B. Kwonsang Lee STAT111 February 13, / 21
7 Random Variables A random variable is a numerical outcome of a random process or random event. For example, X: outcome when rolling a die - X can be one of {1, 2, 3, 4, 5, 6} X: height of a randomly chosen person in the class - X can be any number between 0 and hypothetically The first random variable is discrete and the second one is continuous. Kwonsang Lee STAT111 February 13, / 21
8 Random Variables (RV) If we observe a value of X once, say x 1, then x 1 is no longer a random variable. This is because there is no randomness here. From the previous examples, if we already rolled a die and face 6 is observed, then we just know the outcome with no uncertainty. Also, if we know which person is chosen in the second example, then the height of the chosen person is not a random variable. HOWEVER, we can use observations to know more about random variables. Kwonsang Lee STAT111 February 13, / 21
9 Random Variables (RV) Let s say that we have n observations x 1, x 2,..., x n. We can get some information of a random variable X from the observation such as mean, standard deviation and even distribution. In the first example, rolling a die, we have 100 observations and all are 6. Then we might think that the die is not fair. Furthermore, we might think that Pr(X = 6) = 1 and Pr(X = other values) = 0. We will talk about details of this later. (How to make inferences from observations) Kwonsang Lee STAT111 February 13, / 21
10 Mean and Spread 1 Mean of a random variable µ = mean of random variable x = mean of observations (data) 2 Spread of a random variable σ = standard deviation of random variable s = standard deviation of observations Review: x = x x n n = n i=1 x i, s = n n i=1 (x i x) 2 n 1 Kwonsang Lee STAT111 February 13, / 21
11 How to calculate µ and σ? If we assume that we know the distribution of X, then we can calculate µ and σ. µ = X i P(X i ), σ = (X i µ) 2 P(X i ) i i where X i are all possible outcomes of X. Kwonsang Lee STAT111 February 13, / 21
12 How to calculate µ and σ? (continued) Example: X is the number of head when tossing a coin twice. S = { HH, HT, TH, TT} Possible values for X = { 0, 1, 2} X 1 = 0 with Pr(X 1 ) = 1/4, X 2 = 1 with Pr(X 2 ) = 2/4 and X 3 = 2 with Pr(X 3 ) = 1/4 µ = i X ip(x i ) = (0 1/4) + (1 2/4) + (2 1/4) = 1 σ = (X i µ) 2 P(X i ) = i ((0 1) 2 1/4) + ((1 1) 2 2/4) + ((2 1) 2 1/4) = 2/4 = 2/2 Kwonsang Lee STAT111 February 13, 2015 / 21
13 Some Useful Properties of RV If there is a new random variable Y is given as Y = a + bx, then mean(y) = a + b mean(x) or µ Y = a + bµ X SD(Y) = b SD(X) or σ Y = b σ X SD(Y) 2 = b 2 SD(X) 2 If there is a new random variable Z is given as Z = a + bx + cy, then mean(z) = a + b mean(x) +c mean(y) SD(Z) = b 2 SD(X) 2 + c 2 SD(Y) 2 SD(Z) 2 = b 2 SD(X) 2 + c 2 SD(Y) 2 Kwonsang Lee STAT111 February 13, / 21
14 The Normal Distribution If a random variable X has the normal distribution with mean µ and standard deviation σ, then we denote it by The density function is defined as X N(µ, σ). p(x = x) = p(x) = 1 e (x µ)2 2σ 2 2πσ If µ = 0 and σ = 1, then N(0, 1) is the standard normal distribution. Kwonsang Lee STAT111 February 13, / 21

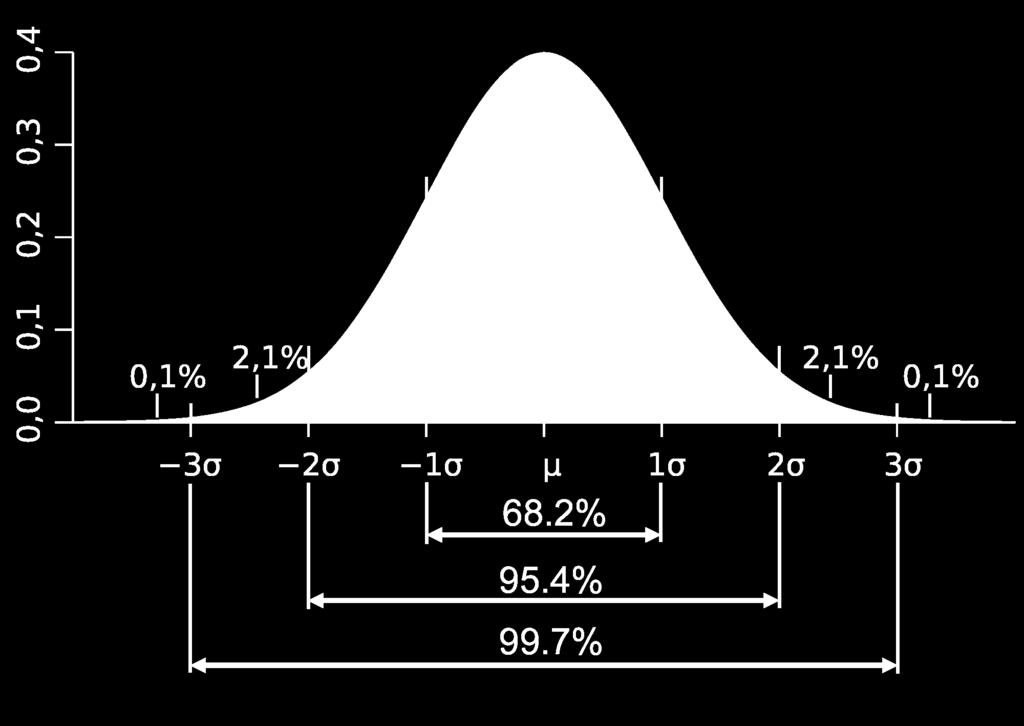
15 Useful facts from google. Kwonsang Lee STAT111 February 13, / 21
16 Standardization The idea of standardization is simple X N(µ, σ) Z = X µ σ N(0, 1) From the previous diagram, Pr( 1 < Z < 1) 0.68 Pr( 2 < Z < 2) 0.95 Pr( 3 < Z < 3) We can do more! Pr(Z > 0) = 0.5,... Kwonsang Lee STAT111 February 13, / 21
17 Question 1 Two balanced dice are tossed. Let event A be that the first die has a number less than 3 and let event B be that second die has a number larger than 3. a. What is Pr(A)? Pr(A) = 2/6 = 1/3 b. What is Pr(B)? Pr(B) = 3/6 = 1/2 c. Are A and B disjoint events? No. A and B have the intersection. d. Are A and B independent events? Yes. Pr(A and B) = Pr(A) Pr(B) Kwonsang Lee STAT111 February 13, / 21
18 Question 2 We will now roll a standard die and a nonstandard die. The second die has three faces with 0 and three faces with 2. Let X equal the sum of the two face numbers. a. What are the possible values of X? {1, 2, 3, 4, 5, 6, 7, 8} b. List the probability distribution of X. X Pr(X ) Kwonsang Lee STAT111 February 13, / 21
19 Question 2 c. What is the mean of the variable X? µ = X i Pr(X i ) 1 = = 54 = 9 2 Kwonsang Lee STAT111 February 13, / 21
20 Question 2 d. What is the standard deviation of the variable X? σ 2 = (X i µ) 2 Pr(X i ) = ( )2 + ( )2 + ( )2 + ( )2 + ( )2 + ( )2 + ( )2 + ( ) = 4 = 47 Therefore, σ = 47 Kwonsang Lee STAT111 February 13, / 21
21 Question 3 Math SAT scores for males have a mean of approximately 6 and a standard deviation of approximately 84. Assume these scores are normally distributed. Use this information and the table of normal probabilities to answer the following questions: a. What percent of students would score above 692? Z = = Pr(Z > 0.95) = = 17.11% b. What SAT score would a male student need in order to be in the top 20 percent? We want to find x to satisfy P(X < x) = 0.8. This is equivalent to find K such that Pr(Z = X µ σ < K = x µ σ ) = 0.8, K 0.84 and needed SAT score is x = µ + σ K = Kwonsang Lee STAT111 February 13, / 21
Shifting our focus. We were studying statistics (data, displays, sampling...) The next few lectures focus on probability (randomness) Why?
 The next few lectures focus on probability (randomness) Why?") Probability Introduction Shifting our focus We were studying statistics (data, displays, sampling...) The next few lectures focus on probability (randomness) Why? What is Probability? Probability is used
Probability Introduction Shifting our focus We were studying statistics (data, displays, sampling...) The next few lectures focus on probability (randomness) Why? What is Probability? Probability is used
5.2 Random Variables, Probability Histograms and Probability Distributions
 Chapter 5 5.2 Random Variables, Probability Histograms and Probability Distributions A random variable (r.v.) can be either continuous or discrete. It takes on the possible values of an experiment. It
Review. Binomial random variable
 Review Discrete RV s: prob y fctn: p(x) = Pr(X = x) cdf: F(x) = Pr(X x) E(X) = x x p(x) SD(X) = E { (X - E X) 2 } Binomial(n,p): no. successes in n indep. trials where Pr(success) = p in each trial If
Determine whether the given events are disjoint. 1) Drawing a face card from a deck of cards and drawing a deuce A) Yes B) No
 Drawing a face card from a deck of cards and drawing a deuce A) Yes B) No") Assignment 8.-8.6 Name MULTIPLE CHOICE. Choose the one alternative that best completes the statement or answers the question. Determine whether the given events are disjoint. 1) Drawing a face card from
Assignment 8.-8.6 Name MULTIPLE CHOICE. Choose the one alternative that best completes the statement or answers the question. Determine whether the given events are disjoint. 1) Drawing a face card from
E509A: Principle of Biostatistics. GY Zou
 E509A: Principle of Biostatistics (Week 2: Probability and Distributions) GY Zou gzou@robarts.ca Reporting of continuous data If approximately symmetric, use mean (SD), e.g., Antibody titers ranged from
Expected Value of a Random Variable
 Knowledge Article: Probability and Statistics Expected Value of a Random Variable Expected Value of a Discrete Random Variable You're familiar with a simple mean, or average, of a set. The mean value of
HUDM4122 Probability and Statistical Inference. February 23, 2015
 HUDM4122 Probability and Statistical Inference February 23, 2015 In the last class We studied Bayes Theorem and the Law of Total Probability Any questions or comments? Today Chapter 4.8 in Mendenhall,
Lecture 23. STAT 225 Introduction to Probability Models April 4, Whitney Huang Purdue University. Normal approximation to Binomial
 Lecture 23 STAT 225 Introduction to Probability Models April 4, 2014 approximation Whitney Huang Purdue University 23.1 Agenda 1 approximation 2 approximation 23.2 Characteristics of the random variable:
Chapter 4 Discrete Random variables
 Chapter 4 Discrete Random variables A is a variable that assumes numerical values associated with the random outcomes of an experiment, where only one numerical value is assigned to each sample point.
Statistics, Their Distributions, and the Central Limit Theorem
 Statistics, Their Distributions, and the Central Limit Theorem MATH 3342 Sections 5.3 and 5.4 Sample Means Suppose you sample from a popula0on 10 0mes. You record the following sample means: 10.1 9.5 9.6
Discrete Random Variables
 Discrete Random Variables In this chapter, we introduce a new concept that of a random variable or RV. A random variable is a model to help us describe the state of the world around us. Roughly, a RV can
Probability. An intro for calculus students P= Figure 1: A normal integral
 Probability An intro for calculus students.8.6.4.2 P=.87 2 3 4 Figure : A normal integral Suppose we flip a coin 2 times; what is the probability that we get more than 2 heads? Suppose we roll a six-sided
Normal Distribution. Notes. Normal Distribution. Standard Normal. Sums of Normal Random Variables. Normal. approximation of Binomial.
 Lecture 21,22, 23 Text: A Course in Probability by Weiss 8.5 STAT 225 Introduction to Probability Models March 31, 2014 Standard Sums of Whitney Huang Purdue University 21,22, 23.1 Agenda 1 2 Standard
Module 4: Probability
 Module 4: Probability 1 / 22 Probability concepts in statistical inference Probability is a way of quantifying uncertainty associated with random events and is the basis for statistical inference. Inference
The normal distribution is a theoretical model derived mathematically and not empirically.
 Sociology 541 The Normal Distribution Probability and An Introduction to Inferential Statistics Normal Approximation The normal distribution is a theoretical model derived mathematically and not empirically.
Theoretical Foundations
 Theoretical Foundations Probabilities Monia Ranalli monia.ranalli@uniroma2.it Ranalli M. Theoretical Foundations - Probabilities 1 / 27 Objectives understand the probability basics quantify random phenomena
Chapter 4 Discrete Random variables
 Chapter 4 Discrete Random variables A is a variable that assumes numerical values associated with the random outcomes of an experiment, where only one numerical value is assigned to each sample point.
4 Random Variables and Distributions
 4 Random Variables and Distributions Random variables A random variable assigns each outcome in a sample space. e.g. called a realization of that variable to Note: We ll usually denote a random variable
MATH 446/546 Homework 1:
 MATH 446/546 Homework 1: Due September 28th, 216 Please answer the following questions. Students should type there work. 1. At time t, a company has I units of inventory in stock. Customers demand the
NORMAL RANDOM VARIABLES (Normal or gaussian distribution)
") NORMAL RANDOM VARIABLES (Normal or gaussian distribution) Many variables, as pregnancy lengths, foot sizes etc.. exhibit a normal distribution. The shape of the distribution is a symmetric bell shape.
NORMAL RANDOM VARIABLES (Normal or gaussian distribution) Many variables, as pregnancy lengths, foot sizes etc.. exhibit a normal distribution. The shape of the distribution is a symmetric bell shape.
Chapter 7: Random Variables
 Chapter 7: Random Variables 7.1 Discrete and Continuous Random Variables 7.2 Means and Variances of Random Variables 1 Introduction A random variable is a function that associates a unique numerical value
4: Probability. What is probability? Random variables (RVs)
") 4: Probability b binomial µ expected value [parameter] n number of trials [parameter] N normal p probability of success [parameter] pdf probability density function pmf probability mass function RV random
4: Probability b binomial µ expected value [parameter] n number of trials [parameter] N normal p probability of success [parameter] pdf probability density function pmf probability mass function RV random
Discrete Probability Distributions
 Discrete Probability Distributions Answers 1. Suppose a statistician working for CSULA Federal Credit Union collected data on ATM withdrawals for the population of the credit union s customers. The statistician
Statistics, Measures of Central Tendency I
 Statistics, Measures of Central Tendency I We are considering a random variable X with a probability distribution which has some parameters. We want to get an idea what these parameters are. We perfom
Business Statistics 41000: Probability 4
 Business Statistics 41000: Probability 4 Drew D. Creal University of Chicago, Booth School of Business February 14 and 15, 2014 1 Class information Drew D. Creal Email: dcreal@chicagobooth.edu Office:
Statistical Methods in Practice STAT/MATH 3379
 Statistical Methods in Practice STAT/MATH 3379 Dr. A. B. W. Manage Associate Professor of Mathematics & Statistics Department of Mathematics & Statistics Sam Houston State University Overview 6.1 Discrete
THE UNIVERSITY OF TEXAS AT AUSTIN Department of Information, Risk, and Operations Management
 THE UNIVERSITY OF TEXAS AT AUSTIN Department of Information, Risk, and Operations Management BA 386T Tom Shively PROBABILITY CONCEPTS AND NORMAL DISTRIBUTIONS The fundamental idea underlying any statistical
Fall 2015 Math 141:505 Exam 3 Form A
 Fall 205 Math 4:505 Exam 3 Form A Last Name: First Name: Exam Seat #: UIN: On my honor, as an Aggie, I have neither given nor received unauthorized aid on this academic work Signature: INSTRUCTIONS Part
5.1 Personal Probability
 5. Probability Value Page 1 5.1 Personal Probability Although we think probability is something that is confined to math class, in the form of personal probability it is something we use to make decisions
Simulation Wrap-up, Statistics COS 323
 Simulation Wrap-up, Statistics COS 323 Today Simulation Re-cap Statistics Variance and confidence intervals for simulations Simulation wrap-up FYI: No class or office hours Thursday Simulation wrap-up
I. Standard Error II. Standard Error III. Standard Error 2.54
 1) Original Population: Match the standard error (I, II, or III) with the correct sampling distribution (A, B, or C) and the correct sample size (1, 5, or 10) I. Standard Error 1.03 II. Standard Error
Math 14 Lecture Notes Ch. 4.3
 4.3 The Binomial Distribution Example 1: The former Sacramento King's DeMarcus Cousins makes 77% of his free throws. If he shoots 3 times, what is the probability that he will make exactly 0, 1, 2, or
PROBABILITY DISTRIBUTIONS
 CHAPTER 3 PROBABILITY DISTRIBUTIONS Page Contents 3.1 Introduction to Probability Distributions 51 3.2 The Normal Distribution 56 3.3 The Binomial Distribution 60 3.4 The Poisson Distribution 64 Exercise
Lecture 9. Probability Distributions. Outline. Outline
 Outline Lecture 9 Probability Distributions 6-1 Introduction 6- Probability Distributions 6-3 Mean, Variance, and Expectation 6-4 The Binomial Distribution Outline 7- Properties of the Normal Distribution
Distribution of the Sample Mean
 Distribution of the Sample Mean MATH 130, Elements of Statistics I J. Robert Buchanan Department of Mathematics Fall 2018 Experiment (1 of 3) Suppose we have the following population : 4 8 1 2 3 4 9 1
Event p351 An event is an outcome or a set of outcomes of a random phenomenon. That is, an event is a subset of the sample space.
 Chapter 12: From randomness to probability 350 Terminology Sample space p351 The sample space of a random phenomenon is the set of all possible outcomes. Example Toss a coin. Sample space: S = {H, T} Example:
Chapter 2: Probability
 Slide 2.1 Chapter 2: Probability Probability underlies statistical inference - the drawing of conclusions from a sample of data. If samples are drawn at random, their characteristics (such as the sample
Lecture 9. Probability Distributions
 Lecture 9 Probability Distributions Outline 6-1 Introduction 6-2 Probability Distributions 6-3 Mean, Variance, and Expectation 6-4 The Binomial Distribution Outline 7-2 Properties of the Normal Distribution
Prof. Thistleton MAT 505 Introduction to Probability Lecture 3
 Sections from Text and MIT Video Lecture: Sections 2.1 through 2.5 http://ocw.mit.edu/courses/electrical-engineering-and-computer-science/6-041-probabilistic-systemsanalysis-and-applied-probability-fall-2010/video-lectures/lecture-1-probability-models-and-axioms/
MATH 118 Class Notes For Chapter 5 By: Maan Omran
 MATH 118 Class Notes For Chapter 5 By: Maan Omran Section 5.1 Central Tendency Mode: the number or numbers that occur most often. Median: the number at the midpoint of a ranked data. Ex1: The test scores
Random variables. Discrete random variables. Continuous random variables.
 Random variables Discrete random variables. Continuous random variables. Discrete random variables. Denote a discrete random variable with X: It is a variable that takes values with some probability. Examples:
Section 0: Introduction and Review of Basic Concepts
 Section 0: Introduction and Review of Basic Concepts Carlos M. Carvalho The University of Texas McCombs School of Business mccombs.utexas.edu/faculty/carlos.carvalho/teaching 1 Getting Started Syllabus
Discrete Random Variables
 Discrete Random Variables ST 370 A random variable is a numerical value associated with the outcome of an experiment. Discrete random variable When we can enumerate the possible values of the variable
Statistics and Probability
 Statistics and Probability Continuous RVs (Normal); Confidence Intervals Outline Continuous random variables Normal distribution CLT Point estimation Confidence intervals http://www.isrec.isb-sib.ch/~darlene/geneve/
Statistics 511 Additional Materials
 Discrete Random Variables In this section, we introduce the concept of a random variable or RV. A random variable is a model to help us describe the state of the world around us. Roughly, a RV can be thought
Chapter 5: Probability
 Chapter 5: These notes reflect material from our text, Exploring the Practice of Statistics, by Moore, McCabe, and Craig, published by Freeman, 2014. quantifies randomness. It is a formal framework with
BIOL The Normal Distribution and the Central Limit Theorem
 BIOL 300 - The Normal Distribution and the Central Limit Theorem In the first week of the course, we introduced a few measures of center and spread, and discussed how the mean and standard deviation are
Learning Goals: * Determining the expected value from a probability distribution. * Applying the expected value formula to solve problems.
 Learning Goals: * Determining the expected value from a probability distribution. * Applying the expected value formula to solve problems. The following are marks from assignments and tests in a math class.
Contents. The Binomial Distribution. The Binomial Distribution The Normal Approximation to the Binomial Left hander example
 Contents The Binomial Distribution The Normal Approximation to the Binomial Left hander example The Binomial Distribution When you flip a coin there are only two possible outcomes - heads or tails. This
Section Random Variables and Histograms
 Section 3.1 - Random Variables and Histograms Definition: A random variable is a rule that assigns a number to each outcome of an experiment. Example 1: Suppose we toss a coin three times. Then we could
Experimental Probability - probability measured by performing an experiment for a number of n trials and recording the number of outcomes
 MDM 4U Probability Review Properties of Probability Experimental Probability - probability measured by performing an experiment for a number of n trials and recording the number of outcomes Theoretical
ECO220Y Introduction to Probability Readings: Chapter 6 (skip section 6.9) and Chapter 9 (section )
 and Chapter 9 (section )") ECO220Y Introduction to Probability Readings: Chapter 6 (skip section 6.9) and Chapter 9 (section 9.1-9.3) Fall 2011 Lecture 6 Part 2 (Fall 2011) Introduction to Probability Lecture 6 Part 2 1 / 44 From
ECO220Y Introduction to Probability Readings: Chapter 6 (skip section 6.9) and Chapter 9 (section 9.1-9.3) Fall 2011 Lecture 6 Part 2 (Fall 2011) Introduction to Probability Lecture 6 Part 2 1 / 44 From
II - Probability. Counting Techniques. three rules of counting. 1multiplication rules. 2permutations. 3combinations
 II - Probability Counting Techniques three rules of counting 1multiplication rules 2permutations 3combinations Section 2 - Probability (1) II - Probability Counting Techniques 1multiplication rules In
Chapter 7. Random Variables
 Chapter 7 Random Variables Making quantifiable meaning out of categorical data Toss three coins. What does the sample space consist of? HHH, HHT, HTH, HTT, TTT, TTH, THT, THH In statistics, we are most
Unit 5: Sampling Distributions of Statistics
 Unit 5: Sampling Distributions of Statistics Statistics 571: Statistical Methods Ramón V. León 6/12/2004 Unit 5 - Stat 571 - Ramon V. Leon 1 Definitions and Key Concepts A sample statistic used to estimate
Unit 5: Sampling Distributions of Statistics
 Unit 5: Sampling Distributions of Statistics Statistics 571: Statistical Methods Ramón V. León 6/12/2004 Unit 5 - Stat 571 - Ramon V. Leon 1 Definitions and Key Concepts A sample statistic used to estimate
STAT 111 Recitation 3
 STAT 111 Recitation 3 Linjun Zhang stat.wharton.upenn.edu/~linjunz/ September 23, 2017 Misc. The unpicked-up homeworks will be put in the STAT 111 box in the Stats Department lobby (It s on the 4th floor
The binomial distribution
 The binomial distribution The coin toss - three coins The coin toss - four coins The binomial probability distribution Rolling dice Using the TI nspire Graph of binomial distribution Mean & standard deviation
Introduction to Business Statistics QM 120 Chapter 6
 DEPARTMENT OF QUANTITATIVE METHODS & INFORMATION SYSTEMS Introduction to Business Statistics QM 120 Chapter 6 Spring 2008 Chapter 6: Continuous Probability Distribution 2 When a RV x is discrete, we can
Binomial Random Variables
 Models for Counts Solutions COR1-GB.1305 Statistics and Data Analysis Binomial Random Variables 1. A certain coin has a 25% of landing heads, and a 75% chance of landing tails. (a) If you flip the coin
Business Statistics 41000: Probability 3
 Business Statistics 41000: Probability 3 Drew D. Creal University of Chicago, Booth School of Business February 7 and 8, 2014 1 Class information Drew D. Creal Email: dcreal@chicagobooth.edu Office: 404
Chapter 3 - Lecture 5 The Binomial Probability Distribution
 Chapter 3 - Lecture 5 The Binomial Probability October 12th, 2009 Experiment Examples Moments and moment generating function of a Binomial Random Variable Outline Experiment Examples A binomial experiment
Section The Sampling Distribution of a Sample Mean
 Section 5.2 - The Sampling Distribution of a Sample Mean Statistics 104 Autumn 2004 Copyright c 2004 by Mark E. Irwin The Sampling Distribution of a Sample Mean Example: Quality control check of light
MULTIPLE CHOICE. Choose the one alternative that best completes the statement or answers the question.
 Chapter 6 Exam A Name The given values are discrete. Use the continuity correction and describe the region of the normal distribution that corresponds to the indicated probability. 1) The probability of
Unit 04 Review. Probability Rules
 Unit 04 Review Probability Rules A sample space contains all the possible outcomes observed in a trial of an experiment, a survey, or some random phenomenon. The sum of the probabilities for all possible
MULTIPLE CHOICE. Choose the one alternative that best completes the statement or answers the question.
 First Name: Last Name: SID: Class Time: M Tu W Th math10 - HW3 MULTIPLE CHOICE. Choose the one alternative that best completes the statement or answers the question. 1) Continuous random variables are
MULTIPLE CHOICE. Choose the one alternative that best completes the statement or answers the question.
 First Name: Last Name: SID: Class Time: M Tu W Th math10 - HW5 MULTIPLE CHOICE. Choose the one alternative that best completes the statement or answers the question. 1) Which choice is another term that
Section Distributions of Random Variables
 Section 8.1 - Distributions of Random Variables Definition: A random variable is a rule that assigns a number to each outcome of an experiment. Example 1: Suppose we toss a coin three times. Then we could
Math 14, Homework 6.2 p. 337 # 3, 4, 9, 10, 15, 18, 19, 21, 22 Name
 Name 3. Population in U.S. Jails The average daily jail population in the United States is 706,242. If the distribution is normal and the standard deviation is 52,145, find the probability that on a randomly
Math 227 (Statistics) Chapter 6 Practice Test MULTIPLE CHOICE. Choose the one alternative that best completes the statement or answers the question.
 Chapter 6 Practice Test MULTIPLE CHOICE. Choose the one alternative that best completes the statement or answers the question.") Math 227 (Statistics) Chapter 6 Practice Test MULTIPLE CHOICE. Choose the one alternative that best completes the statement or answers the question. Using the following uniform density curve, answer the
Math 227 (Statistics) Chapter 6 Practice Test MULTIPLE CHOICE. Choose the one alternative that best completes the statement or answers the question. Using the following uniform density curve, answer the
Midterm Exam III Review
 Midterm Exam III Review Dr. Joseph Brennan Math 148, BU Dr. Joseph Brennan (Math 148, BU) Midterm Exam III Review 1 / 25 Permutations and Combinations ORDER In order to count the number of possible ways
Consider the following examples: ex: let X = tossing a coin three times and counting the number of heads
 Overview Both chapters and 6 deal with a similar concept probability distributions. The difference is that chapter concerns itself with discrete probability distribution while chapter 6 covers continuous
The Normal Distribution. (Ch 4.3)
") 5 The Normal Distribution (Ch 4.3) The Normal Distribution The normal distribution is probably the most important distribution in all of probability and statistics. Many populations have distributions
5 The Normal Distribution (Ch 4.3) The Normal Distribution The normal distribution is probably the most important distribution in all of probability and statistics. Many populations have distributions
No, because np = 100(0.02) = 2. The value of np must be greater than or equal to 5 to use the normal approximation.
 = 2. The value of np must be greater than or equal to 5 to use the normal approximation.") 1) If n 100 and p 0.02 in a binomial experiment, does this satisfy the rule for a normal approximation? Why or why not? No, because np 100(0.02) 2. The value of np must be greater than or equal to 5 to
1) If n 100 and p 0.02 in a binomial experiment, does this satisfy the rule for a normal approximation? Why or why not? No, because np 100(0.02) 2. The value of np must be greater than or equal to 5 to
Introduction to Statistics I
 Introduction to Statistics I Keio University, Faculty of Economics Continuous random variables Simon Clinet (Keio University) Intro to Stats November 1, 2018 1 / 18 Definition (Continuous random variable)
Lecture Stat 302 Introduction to Probability - Slides 15
 Lecture Stat 30 Introduction to Probability - Slides 15 AD March 010 AD () March 010 1 / 18 Continuous Random Variable Let X a (real-valued) continuous r.v.. It is characterized by its pdf f : R! [0, )
Statistical Methods for NLP LT 2202
 LT 2202 Lecture 3 Random variables January 26, 2012 Recap of lecture 2 Basic laws of probability: 0 P(A) 1 for every event A. P(Ω) = 1 P(A B) = P(A) + P(B) if A and B disjoint Conditional probability:
Chapter 6: Random Variables. Ch. 6-3: Binomial and Geometric Random Variables
 Chapter : Random Variables Ch. -3: Binomial and Geometric Random Variables X 0 2 3 4 5 7 8 9 0 0 P(X) 3???????? 4 4 When the same chance process is repeated several times, we are often interested in whether
Chapter 3: Probability Distributions and Statistics
 Chapter 3: Probability Distributions and Statistics Section 3.-3.3 3. Random Variables and Histograms A is a rule that assigns precisely one real number to each outcome of an experiment. We usually denote
Probability & Sampling The Practice of Statistics 4e Mostly Chpts 5 7
 Probability & Sampling The Practice of Statistics 4e Mostly Chpts 5 7 Lew Davidson (Dr.D.) Mallard Creek High School Lewis.Davidson@cms.k12.nc.us 704-786-0470 Probability & Sampling The Practice of Statistics
Statistics 511 Supplemental Materials
 Gaussian (or Normal) Random Variable In this section we introduce the Gaussian Random Variable, which is more commonly referred to as the Normal Random Variable. This is a random variable that has a bellshaped
Central Limit Theorem
 Central Limit Theorem Lots of Samples 1 Homework Read Sec 6-5. Discussion Question pg 329 Do Ex 6-5 8-15 2 Objective Use the Central Limit Theorem to solve problems involving sample means 3 Sample Means
Section 8.1 Distributions of Random Variables
 Section 8.1 Distributions of Random Variables Random Variable A random variable is a rule that assigns a number to each outcome of a chance experiment. There are three types of random variables: 1. Finite
ECON 214 Elements of Statistics for Economists 2016/2017
 ECON 214 Elements of Statistics for Economists 2016/2017 Topic The Normal Distribution Lecturer: Dr. Bernardin Senadza, Dept. of Economics bsenadza@ug.edu.gh College of Education School of Continuing and
Figure 1: 2πσ is said to have a normal distribution with mean µ and standard deviation σ. This is also denoted
 Figure 1: Math 223 Lecture Notes 4/1/04 Section 4.10 The normal distribution Recall that a continuous random variable X with probability distribution function f(x) = 1 µ)2 (x e 2σ 2πσ is said to have a
STA 6166 Fall 2007 Web-based Course. Notes 10: Probability Models
 STA 6166 Fall 2007 Web-based Course 1 Notes 10: Probability Models We first saw the normal model as a useful model for the distribution of some quantitative variables. We ve also seen that if we make a
II. Random Variables
 II. Random Variables Random variables operate in much the same way as the outcomes or events in some arbitrary sample space the distinction is that random variables are simply outcomes that are represented
INF FALL NATURAL LANGUAGE PROCESSING. Jan Tore Lønning, Lecture 3, 1.9
 INF5830 015 FALL NATURAL LANGUAGE PROCESSING Jan Tore Lønning, Lecture 3, 1.9 Today: More statistics Binomial distribution Continuous random variables/distributions Normal distribution Sampling and sampling
Chapter 7. Random Variables: 7.1: Discrete and Continuous. Random Variables. 7.2: Means and Variances of. Random Variables
 Chapter 7 Random Variables In Chapter 6, we learned that a!random phenomenon" was one that was unpredictable in the short term, but displayed a predictable pattern in the long run. In Statistics, we are
STAT Chapter 7: Central Limit Theorem
 STAT 251 - Chapter 7: Central Limit Theorem In this chapter we will introduce the most important theorem in statistics; the central limit theorem. What have we seen so far? First, we saw that for an i.i.d
Central Limit Theorem (cont d) 7/28/2006
 7/28/2006") Central Limit Theorem (cont d) 7/28/2006 Central Limit Theorem for Binomial Distributions Theorem. For the binomial distribution b(n, p, j) we have lim npq b(n, p, np + x npq ) = φ(x), n where φ(x) is
Central Limit Theorem (cont d) 7/28/2006 Central Limit Theorem for Binomial Distributions Theorem. For the binomial distribution b(n, p, j) we have lim npq b(n, p, np + x npq ) = φ(x), n where φ(x) is
Chapter 6: Random Variables and Probability Distributions
 Chapter 6: Random Variables and Distributions These notes reflect material from our text, Statistics, Learning from Data, First Edition, by Roxy Pec, published by CENGAGE Learning, 2015. Random variables
Exam II Math 1342 Capters 3-5 HCCS. Name
 Exam II Math 1342 Capters 3-5 HCCS Name Date Provide an appropriate response. 1) A single six-sided die is rolled. Find the probability of rolling a number less than 3. A) 0.5 B) 0.1 C) 0.25 D 0.333 1)
Section Distributions of Random Variables
 Section 8.1 - Distributions of Random Variables Definition: A random variable is a rule that assigns a number to each outcome of an experiment. Example 1: Suppose we toss a coin three times. Then we could
Chapter 9 & 10. Multiple Choice.
 Chapter 9 & 10 Review Name Multiple Choice. 1. An agricultural researcher plants 25 plots with a new variety of corn. The average yield for these plots is X = 150 bushels per acre. Assume that the yield
Probability and Sample space
 Probability and Sample space We call a phenomenon random if individual outcomes are uncertain but there is a regular distribution of outcomes in a large number of repetitions. The probability of any outcome
CHAPTER 6 Random Variables
 CHAPTER 6 Random Variables 6.1 Discrete and Continuous Random Variables The Practice of Statistics, 5th Edition Starnes, Tabor, Yates, Moore Bedford Freeman Worth Publishers Discrete and Continuous Random
MA 1125 Lecture 14 - Expected Values. Wednesday, October 4, Objectives: Introduce expected values.
 MA 5 Lecture 4 - Expected Values Wednesday, October 4, 27 Objectives: Introduce expected values.. Means, Variances, and Standard Deviations of Probability Distributions Two classes ago, we computed the
SECTION 4.4: Expected Value
 15 SECTION 4.4: Expected Value This section tells you why most all gambling is a bad idea. And also why carnival or amusement park games are a bad idea. Random Variables Definition: Random Variable A random
Elementary Statistics Lecture 5
 Elementary Statistics Lecture 5 Sampling Distributions Chong Ma Department of Statistics University of South Carolina Chong Ma (Statistics, USC) STAT 201 Elementary Statistics 1 / 24 Outline 1 Introduction