Parameter Estimation II
|
|
|
- Martina Boyd
- 5 years ago
- Views:
Transcription
1 Parameter Estimation II ELEC 41 PROF. SIRIPONG POTISUK Estimating μ With Unnown σ This is often true in practice. When the sample is large and σ is unnown, the sampling distribution is approimately normal regardless of the underlying distribution When the sample is small and σ is unnown, we must mae an assumption about the form of the underlying distribution to obtain a valid CI procedure. A reasonable assumption in many cases is that the underlying distribution is normal. 1

2 A Large Sample CI for μ (Unnown σ) CI on μ of a Normal Distribution (Unnown σ) Let X and S be the sample mean and variance of a random sample from a normally distributed population with unnown μ and σ. The random variable T = X S / μ n has a Student-t distribution with n - 1 degrees of freedom.

3 3 Student-t Distribution df and 1 1 ) ( = < < + Γ = f df and, 1 ) ( 1 = < < + Γ = + f X π, } { 0 } { > = = X Var X E The t Confidence Interval on μ
")
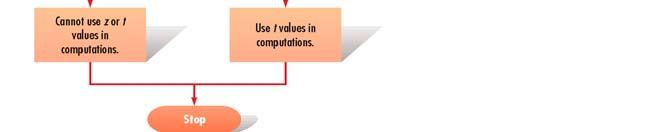
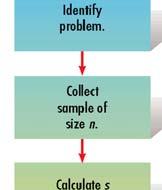
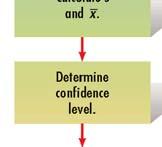
4 Which (if any) distribution to use? Procedure for the interval estimation of μ with σ unnown 4


5 Eample A manager of a paint store, wants to estimate the mean amount of a product sold per day. Twenty business days are monitored, and an average of 3 gallons is sold daily. The sample standard deviation is 1 gallons. Calculate the confidence limits at the 95% confidence level. 5
6 Eample A random sample has been taen from a normal population with the following statistics: N Mean SEmean Stdev Variance Sum 10? 0.507?? (a) Find the missing quantities (?) (b) Construct a 95% CI on the population mean 6
7 Eample The compressive strength of concrete is being tested by a civil engineer. Twelve specimens are tested and the following data are obtained: (a) Chec the assumption that compressive strength is normally distributed. (b) Construct a 95% two-sided confidence interval on the mean strength. 7
8 Estimating the Population Variance Variance shows the etent of the spread or scatter in a data set It is desirable to now such variation so that steps can be taen to control it Tire manufacturer wants to be sure that tires produced are of consistent mileage quality A drug company must focus on the potency of the tablets so that some are not unduly wea while others do not produce overdoses Estimating the Population Variance Let S be the sample variance of a random sample taen from a normally distributed population, the sampling distribution of the sample variance follows a chi-square distribution, i.e., the RV X ( n 1) = S σ has a chi-square (χ ) distribution with n -1 degrees of freedom. 8
9 9 Chi-Square Distribution df and 0, 1 ) ( 1 = > Γ = e f X X V X E } { } { = X Var } { = Chi-Square Distribution


10 CI on the Variance of a Normal Population Eample: A Pressing Problem The strength and conditioning coach of the Citadel football team described the outcomes of a weight- lifting and fitness program he designed. As part of the program s evaluation, he had each player do a one-repetition, maimum-weight bench press. The weights pressed by the linebacers are: 340, 380, 305, 335, 375, 400, 305, 385, and 315. Construct t a 90% confidence interval for the standard deviation in the maimum weights pressed by the population of linebacers who go through this program. 10
11 Estimating Population Proportions Interested in estimating population proportions (or percentages) when dealing with attribute (categorical) data Percent of defective items produced by a machine Percent of minority students at US colleges Estimate a population proportion or percentage on the basis of sample results 11
12 Sampling Distribution of Proportions Population proportion denoted by p Sample proportion denoted by pˆ p and defined as pˆ = ( /n) 100, where is the number of items in a random sample possessing the characteristic of interest, and n is the sample size pˆ p is a point estimate of p The underlying population distribution is the Binomial distribution with mean np and np (1-p) variance Sampling Distribution of Proportions The sampling distribution of proportions P is a distribution of the proportions of all possible samples that could be taen in a given situation, where the samples are simple random samples of fied size n. μ p and σ p are the mean and the standard deviation (standard error) of the distribution, respectively Pˆ 1
13 Normal Approimation for Binomial Proportion Based on the Central Limit Theorem If p is not too close to 0 or 1 and n is relatively large (i.e., np and n(1- p) 5, the sampling distribution of proportions Pˆ is approimately normal. That is, Pˆ is approimately normal with μ p = p and σ p = p( 1 p) n Eample: Did They Inhale? In 1996, it is estimated that 33.1% of all college students used marijuana in the previous 1 months. Suppose a random sample of 80 such students is taen and assume that the 33.1% is the actual percentage. What is the probability that the percentage in this sample who have used marijuana is over 30%? 13


14 Confidence Interval For Population Proportion Procedure for the interval estimation of p using large samples 14


15 Eample: Reelection Bid Political Polls represent one of the major uses of interval estimation of p. Let s assume that President Barac Obama faces a tough reelection campaign and orders a poll to learn how the voters view his candidacy. A random sample of 100 voters reveals that 53 are liely to vote for him, while the others prefer his opponent or undecided. At the 95 percent level of confidence, what s the population percentage of voters who epress a preference for him? 15
16 Choice of sample size If pˆ is used as an estimate of p, we can be 100(1- α)% confident that the error will not eceed a specified amount E when the sample size is zα / n = p(1 p) E An upper bound on n is given by n = z α / E (0.5) Eample Suppose you have been ased by the Red Cross to estimate the percentage of cadets & non-cadets who are willing to donate a pint of blood. The estimate should be within ± 5 percent of the true percentage with a confidence level of 95 %. How big should the sample size be? Assume you have no idea of the true percentage. 16
Statistics for Business and Economics
 Statistics for Business and Economics Chapter 7 Estimation: Single Population Copyright 010 Pearson Education, Inc. Publishing as Prentice Hall Ch. 7-1 Confidence Intervals Contents of this chapter: Confidence
CIVL Confidence Intervals
 CIVL 3103 Confidence Intervals Learning Objectives - Confidence Intervals Define confidence intervals, and explain their significance to point estimates. Identify and apply the appropriate confidence interval
Chapter 7. Sampling Distributions
 Chapter 7 Sampling Distributions Section 7.1 Sampling Distributions and the Central Limit Theorem Sampling Distributions Sampling distribution The probability distribution of a sample statistic. Formed
χ 2 distributions and confidence intervals for population variance
 χ 2 distributions and confidence intervals for population variance Let Z be a standard Normal random variable, i.e., Z N(0, 1). Define Y = Z 2. Y is a non-negative random variable. Its distribution is
Class 16. Daniel B. Rowe, Ph.D. Department of Mathematics, Statistics, and Computer Science. Marquette University MATH 1700
 Class 16 Daniel B. Rowe, Ph.D. Department of Mathematics, Statistics, and Computer Science Copyright 013 by D.B. Rowe 1 Agenda: Recap Chapter 7. - 7.3 Lecture Chapter 8.1-8. Review Chapter 6. Problem Solving
CHAPTER 8. Confidence Interval Estimation Point and Interval Estimates
 CHAPTER 8. Confidence Interval Estimation Point and Interval Estimates A point estimate is a single number, a confidence interval provides additional information about the variability of the estimate Lower
Statistical Intervals (One sample) (Chs )
 (Chs )") 7 Statistical Intervals (One sample) (Chs 8.1-8.3) Confidence Intervals The CLT tells us that as the sample size n increases, the sample mean X is close to normally distributed with expected value µ and
7 Statistical Intervals (One sample) (Chs 8.1-8.3) Confidence Intervals The CLT tells us that as the sample size n increases, the sample mean X is close to normally distributed with expected value µ and
STAT Chapter 7: Confidence Intervals
 STAT 515 -- Chapter 7: Confidence Intervals With a point estimate, we used a single number to estimate a parameter. We can also use a set of numbers to serve as reasonable estimates for the parameter.
ECO220Y Estimation: Confidence Interval Estimator for Sample Proportions Readings: Chapter 11 (skip 11.5)
") ECO220Y Estimation: Confidence Interval Estimator for Sample Proportions Readings: Chapter 11 (skip 11.5) Fall 2011 Lecture 10 (Fall 2011) Estimation Lecture 10 1 / 23 Review: Sampling Distributions Sample
ECO220Y Estimation: Confidence Interval Estimator for Sample Proportions Readings: Chapter 11 (skip 11.5) Fall 2011 Lecture 10 (Fall 2011) Estimation Lecture 10 1 / 23 Review: Sampling Distributions Sample
Normal Probability Distributions
 Normal Probability Distributions Properties of Normal Distributions The most important probability distribution in statistics is the normal distribution. Normal curve A normal distribution is a continuous
Confidence Intervals Introduction
 Confidence Intervals Introduction A point estimate provides no information about the precision and reliability of estimation. For example, the sample mean X is a point estimate of the population mean μ
. 13. The maximum error (margin of error) of the estimate for μ (based on known σ) is:
 of the estimate for μ (based on known σ) is:") Statistics Sample Exam 3 Solution Chapters 6 & 7: Normal Probability Distributions & Estimates 1. What percent of normally distributed data value lie within 2 standard deviations to either side of the
Statistics Sample Exam 3 Solution Chapters 6 & 7: Normal Probability Distributions & Estimates 1. What percent of normally distributed data value lie within 2 standard deviations to either side of the
Version A. Problem 1. Let X be the continuous random variable defined by the following pdf: 1 x/2 when 0 x 2, f(x) = 0 otherwise.
 = 0 otherwise.") Math 224 Q Exam 3A Fall 217 Tues Dec 12 Version A Problem 1. Let X be the continuous random variable defined by the following pdf: { 1 x/2 when x 2, f(x) otherwise. (a) Compute the mean µ E[X]. E[X] x
Math 224 Q Exam 3A Fall 217 Tues Dec 12 Version A Problem 1. Let X be the continuous random variable defined by the following pdf: { 1 x/2 when x 2, f(x) otherwise. (a) Compute the mean µ E[X]. E[X] x
Chapter 7. Sampling Distributions and the Central Limit Theorem
 Chapter 7. Sampling Distributions and the Central Limit Theorem 1 Introduction 2 Sampling Distributions related to the normal distribution 3 The central limit theorem 4 The normal approximation to binomial
Chapter 6 Confidence Intervals Section 6-1 Confidence Intervals for the Mean (Large Samples) Estimating Population Parameters
 Estimating Population Parameters") Chapter 6 Confidence Intervals Section 6-1 Confidence Intervals for the Mean (Large Samples) Estimating Population Parameters VOCABULARY: Point Estimate a value for a parameter. The most point estimate
Chapter 6 Confidence Intervals Section 6-1 Confidence Intervals for the Mean (Large Samples) Estimating Population Parameters VOCABULARY: Point Estimate a value for a parameter. The most point estimate
Unit 5: Sampling Distributions of Statistics
 Unit 5: Sampling Distributions of Statistics Statistics 571: Statistical Methods Ramón V. León 6/12/2004 Unit 5 - Stat 571 - Ramon V. Leon 1 Definitions and Key Concepts A sample statistic used to estimate
Unit 5: Sampling Distributions of Statistics
 Unit 5: Sampling Distributions of Statistics Statistics 571: Statistical Methods Ramón V. León 6/12/2004 Unit 5 - Stat 571 - Ramon V. Leon 1 Definitions and Key Concepts A sample statistic used to estimate
Point Estimation. Principle of Unbiased Estimation. When choosing among several different estimators of θ, select one that is unbiased.
 Point Estimation Point Estimation Definition A point estimate of a parameter θ is a single number that can be regarded as a sensible value for θ. A point estimate is obtained by selecting a suitable statistic
The Central Limit Theorem
 Section 6-5 The Central Limit Theorem I. Sampling Distribution of Sample Mean ( ) Eample 1: Population Distribution Table 2 4 6 8 P() 1/4 1/4 1/4 1/4 μ (a) Find the population mean and population standard
8.1 Estimation of the Mean and Proportion
 8.1 Estimation of the Mean and Proportion Statistical inference enables us to make judgments about a population on the basis of sample information. The mean, standard deviation, and proportions of a population
Chapter 9: Sampling Distributions
 Chapter 9: Sampling Distributions 9. Introduction This chapter connects the material in Chapters 4 through 8 (numerical descriptive statistics, sampling, and probability distributions, in particular) with
LESSON 7 INTERVAL ESTIMATION SAMIE L.S. LY
 LESSON 7 INTERVAL ESTIMATION SAMIE L.S. LY 1 THIS WEEK S PLAN Part I: Theory + Practice ( Interval Estimation ) Part II: Theory + Practice ( Interval Estimation ) z-based Confidence Intervals for a Population
Interval estimation. September 29, Outline Basic ideas Sampling variation and CLT Interval estimation using X More general problems
 Interval estimation September 29, 2017 STAT 151 Class 7 Slide 1 Outline of Topics 1 Basic ideas 2 Sampling variation and CLT 3 Interval estimation using X 4 More general problems STAT 151 Class 7 Slide
Statistical Intervals. Chapter 7 Stat 4570/5570 Material from Devore s book (Ed 8), and Cengage
, and Cengage") 7 Statistical Intervals Chapter 7 Stat 4570/5570 Material from Devore s book (Ed 8), and Cengage Confidence Intervals The CLT tells us that as the sample size n increases, the sample mean X is close to
7 Statistical Intervals Chapter 7 Stat 4570/5570 Material from Devore s book (Ed 8), and Cengage Confidence Intervals The CLT tells us that as the sample size n increases, the sample mean X is close to
Estimating parameters 5.3 Confidence Intervals 5.4 Sample Variance
 Estimating parameters 5.3 Confidence Intervals 5.4 Sample Variance Prof. Tesler Math 186 Winter 2017 Prof. Tesler Ch. 5: Confidence Intervals, Sample Variance Math 186 / Winter 2017 1 / 29 Estimating parameters
GETTING STARTED. To OPEN MINITAB: Click Start>Programs>Minitab14>Minitab14 or Click Minitab 14 on your Desktop
 Minitab 14 1 GETTING STARTED To OPEN MINITAB: Click Start>Programs>Minitab14>Minitab14 or Click Minitab 14 on your Desktop The Minitab session will come up like this 2 To SAVE FILE 1. Click File>Save Project
Applied Statistics I
 Applied Statistics I Liang Zhang Department of Mathematics, University of Utah July 14, 2008 Liang Zhang (UofU) Applied Statistics I July 14, 2008 1 / 18 Point Estimation Liang Zhang (UofU) Applied Statistics
Probability is the tool used for anticipating what the distribution of data should look like under a given model.
 AP Statistics NAME: Exam Review: Strand 3: Anticipating Patterns Date: Block: III. Anticipating Patterns: Exploring random phenomena using probability and simulation (20%-30%) Probability is the tool used
STAT Chapter 6: Sampling Distributions
 STAT 515 -- Chapter 6: Sampling Distributions Definition: Parameter = a number that characterizes a population (example: population mean ) it s typically unknown. Statistic = a number that characterizes
Previously, when making inferences about the population mean, μ, we were assuming the following simple conditions:
 Chapter 17 Inference about a Population Mean Conditions for inference Previously, when making inferences about the population mean, μ, we were assuming the following simple conditions: (1) Our data (observations)
Section 7.2. Estimating a Population Proportion
 Section 7.2 Estimating a Population Proportion Overview Section 7.2 Estimating a Population Proportion Section 7.3 Estimating a Population Mean Section 7.4 Estimating a Population Standard Deviation or
Determining Sample Size. Slide 1 ˆ ˆ. p q n E = z α / 2. (solve for n by algebra) n = E 2
 n = E 2") Determining Sample Size Slide 1 E = z α / 2 ˆ ˆ p q n (solve for n by algebra) n = ( zα α / 2) 2 p ˆ qˆ E 2 Sample Size for Estimating Proportion p When an estimate of ˆp is known: Slide 2 n = ˆ ˆ ( )
Determining Sample Size Slide 1 E = z α / 2 ˆ ˆ p q n (solve for n by algebra) n = ( zα α / 2) 2 p ˆ qˆ E 2 Sample Size for Estimating Proportion p When an estimate of ˆp is known: Slide 2 n = ˆ ˆ ( )
A random variable (r. v.) is a variable whose value is a numerical outcome of a random phenomenon.
 is a variable whose value is a numerical outcome of a random phenomenon.") Chapter 14: random variables p394 A random variable (r. v.) is a variable whose value is a numerical outcome of a random phenomenon. Consider the experiment of tossing a coin. Define a random variable
Chapter 14: random variables p394 A random variable (r. v.) is a variable whose value is a numerical outcome of a random phenomenon. Consider the experiment of tossing a coin. Define a random variable
Statistics for Managers Using Microsoft Excel 7 th Edition
 Statistics for Managers Using Microsoft Excel 7 th Edition Chapter 7 Sampling Distributions Statistics for Managers Using Microsoft Excel 7e Copyright 2014 Pearson Education, Inc. Chap 7-1 Learning Objectives
MgtOp S 215 Chapter 8 Dr. Ahn
 MgtOp S 215 Chapter 8 Dr. Ahn An estimator of a population parameter is a rule that tells us how to use the sample values,,, to estimate the parameter, and is a statistic. An estimate is the value obtained
MATH 3200 Exam 3 Dr. Syring
 . Suppose n eligible voters are polled (randomly sampled) from a population of size N. The poll asks voters whether they support or do not support increasing local taxes to fund public parks. Let M be
The Central Limit Theorem. Sec. 8.2: The Random Variable. it s Distribution. it s Distribution
 The Central Limit Theorem Sec. 8.1: The Random Variable it s Distribution Sec. 8.2: The Random Variable it s Distribution X p and and How Should You Think of a Random Variable? Imagine a bag with numbers
PROBABILITY DISTRIBUTIONS
 CHAPTER 3 PROBABILITY DISTRIBUTIONS Page Contents 3.1 Introduction to Probability Distributions 51 3.2 The Normal Distribution 56 3.3 The Binomial Distribution 60 3.4 The Poisson Distribution 64 Exercise
Chapter 6 Part 6. Confidence Intervals chi square distribution binomial distribution
 Chapter 6 Part 6 Confidence Intervals chi square distribution binomial distribution October 8, 008 Brief review of what we covered last time. In order to get a confidence interval for the population mean
σ 2 : ESTIMATES, CONFIDENCE INTERVALS, AND TESTS Business Statistics
 σ : ESTIMATES, CONFIDENCE INTERVALS, AND TESTS Business Statistics CONTENTS Estimating other parameters besides μ Estimating variance Confidence intervals for σ Hypothesis tests for σ Estimating standard
Learning Objectives for Ch. 7
 Chapter 7: Point and Interval Estimation Hildebrand, Ott and Gray Basic Statistical Ideas for Managers Second Edition 1 Learning Objectives for Ch. 7 Obtaining a point estimate of a population parameter
Statistics Class 15 3/21/2012
 Statistics Class 15 3/21/2012 Quiz 1. Cans of regular Pepsi are labeled to indicate that they contain 12 oz. Data Set 17 in Appendix B lists measured amounts for a sample of Pepsi cans. The same statistics
Chapter 7. Sampling Distributions and the Central Limit Theorem
 Chapter 7. Sampling Distributions and the Central Limit Theorem 1 Introduction 2 Sampling Distributions related to the normal distribution 3 The central limit theorem 4 The normal approximation to binomial
MULTIPLE CHOICE. Choose the one alternative that best completes the statement or answers the question.
 Ch. 9 Estimating the Value of a Parameter 9.1 Estimating a Population Proportion 1 Obtain a point estimate for the population proportion. 1) When 390 junior college students were surveyed,115 said that
1. Covariance between two variables X and Y is denoted by Cov(X, Y) and defined by. Cov(X, Y ) = E(X E(X))(Y E(Y ))
 and defined by. Cov(X, Y ) = E(X E(X))(Y E(Y ))") Correlation & Estimation - Class 7 January 28, 2014 Debdeep Pati Association between two variables 1. Covariance between two variables X and Y is denoted by Cov(X, Y) and defined by Cov(X, Y ) = E(X E(X))(Y
Correlation & Estimation - Class 7 January 28, 2014 Debdeep Pati Association between two variables 1. Covariance between two variables X and Y is denoted by Cov(X, Y) and defined by Cov(X, Y ) = E(X E(X))(Y
Chapter 7 presents the beginning of inferential statistics. The two major activities of inferential statistics are
 Chapter 7 presents the beginning of inferential statistics. Concept: Inferential Statistics The two major activities of inferential statistics are 1 to use sample data to estimate values of population
19. CONFIDENCE INTERVALS FOR THE MEAN; KNOWN VARIANCE
 19. CONFIDENCE INTERVALS FOR THE MEAN; KNOWN VARIANCE We assume here that the population variance σ 2 is known. This is an unrealistic assumption, but it allows us to give a simplified presentation which
1. Statistical problems - a) Distribution is known. b) Distribution is unknown.
 Distribution is known. b) Distribution is unknown.") Probability February 5, 2013 Debdeep Pati Estimation 1. Statistical problems - a) Distribution is known. b) Distribution is unknown. 2. When Distribution is known, then we can have either i) Parameters
Probability February 5, 2013 Debdeep Pati Estimation 1. Statistical problems - a) Distribution is known. b) Distribution is unknown. 2. When Distribution is known, then we can have either i) Parameters
Chapter 6 Confidence Intervals
 Chapter 6 Confidence Intervals Section 6-1 Confidence Intervals for the Mean (Large Samples) VOCABULARY: Point Estimate A value for a parameter. The most point estimate of the population parameter is the
Exercise Set 1 The normal distribution and sampling distributions
 Eercise Set 1 The normal distribution and sampling distributions 1). An orange juice producer buys all his oranges from a large orange grove. The amount of juice squeezed from each of these oranges is
T.I.H.E. IT 233 Statistics and Probability: Sem. 1: 2013 ESTIMATION
 In Inferential Statistic, ESTIMATION (i) (ii) is called the True Population Mean and is called the True Population Proportion. You must also remember that are not the only population parameters. There
Tests for One Variance
 Chapter 65 Introduction Occasionally, researchers are interested in the estimation of the variance (or standard deviation) rather than the mean. This module calculates the sample size and performs power
Central Limit Theorem (cont d) 7/28/2006
 7/28/2006") Central Limit Theorem (cont d) 7/28/2006 Central Limit Theorem for Binomial Distributions Theorem. For the binomial distribution b(n, p, j) we have lim npq b(n, p, np + x npq ) = φ(x), n where φ(x) is
Central Limit Theorem (cont d) 7/28/2006 Central Limit Theorem for Binomial Distributions Theorem. For the binomial distribution b(n, p, j) we have lim npq b(n, p, np + x npq ) = φ(x), n where φ(x) is
AMS7: WEEK 4. CLASS 3
 AMS7: WEEK 4. CLASS 3 Sampling distributions and estimators. Central Limit Theorem Normal Approximation to the Binomial Distribution Friday April 24th, 2015 Sampling distributions and estimators REMEMBER:
Lecture 23. STAT 225 Introduction to Probability Models April 4, Whitney Huang Purdue University. Normal approximation to Binomial
 Lecture 23 STAT 225 Introduction to Probability Models April 4, 2014 approximation Whitney Huang Purdue University 23.1 Agenda 1 approximation 2 approximation 23.2 Characteristics of the random variable:
continuous rv Note for a legitimate pdf, we have f (x) 0 and f (x)dx = 1. For a continuous rv, P(X = c) = c f (x)dx = 0, hence
 0 and f (x)dx = 1. For a continuous rv, P(X = c) = c f (x)dx = 0, hence") continuous rv Let X be a continuous rv. Then a probability distribution or probability density function (pdf) of X is a function f(x) such that for any two numbers a and b with a b, P(a X b) = b a f (x)dx.
continuous rv Let X be a continuous rv. Then a probability distribution or probability density function (pdf) of X is a function f(x) such that for any two numbers a and b with a b, P(a X b) = b a f (x)dx.
Chapter 7. Inferences about Population Variances
 Chapter 7. Inferences about Population Variances Introduction () The variability of a population s values is as important as the population mean. Hypothetical distribution of E. coli concentrations from
Sampling Distributions
 AP Statistics Ch. 7 Notes Sampling Distributions A major field of statistics is statistical inference, which is using information from a sample to draw conclusions about a wider population. Parameter:
CIVL Learning Objectives. Definitions. Discrete Distributions
 CIVL 3103 Discrete Distributions Learning Objectives Define discrete distributions, and identify common distributions applicable to engineering problems. Identify the appropriate distribution (i.e. binomial,
Chapter 8: Sampling distributions of estimators Sections
 Chapter 8 continued Chapter 8: Sampling distributions of estimators Sections 8.1 Sampling distribution of a statistic 8.2 The Chi-square distributions 8.3 Joint Distribution of the sample mean and sample
3.3 Probability Distribution(p102)
") 3.3 Probability Distribution(p102) Mammals: Warm blooded Milk to feed young Take care of young Body hair 3 middle ear bones 3.3 Probability Distribution(p102) 3.3 Probability Distribution(p102) Probability
3.3 Probability Distribution(p102) Mammals: Warm blooded Milk to feed young Take care of young Body hair 3 middle ear bones 3.3 Probability Distribution(p102) 3.3 Probability Distribution(p102) Probability
Review of the Topics for Midterm I
 Review of the Topics for Midterm I STA 100 Lecture 9 I. Introduction The objective of statistics is to make inferences about a population based on information contained in a sample. A population is the
Probability Theory. Mohamed I. Riffi. Islamic University of Gaza
 Probability Theory Mohamed I. Riffi Islamic University of Gaza Table of contents 1. Chapter 2 Discrete Distributions The binomial distribution 1 Chapter 2 Discrete Distributions Bernoulli trials and the
S = 1,2,3, 4,5,6 occurs
 Chapter 5 Discrete Probability Distributions The observations generated by different statistical experiments have the same general type of behavior. Discrete random variables associated with these experiments
1 Introduction 1. 3 Confidence interval for proportion p 6
 Math 321 Chapter 5 Confidence Intervals (draft version 2019/04/15-13:41:02) Contents 1 Introduction 1 2 Confidence interval for mean µ 2 2.1 Known variance................................. 3 2.2 Unknown
Statistics 6 th Edition
 Statistics 6 th Edition Chapter 5 Discrete Probability Distributions Chap 5-1 Definitions Random Variables Random Variables Discrete Random Variable Continuous Random Variable Ch. 5 Ch. 6 Chap 5-2 Discrete
Statistical Tables Compiled by Alan J. Terry
 Statistical Tables Compiled by Alan J. Terry School of Science and Sport University of the West of Scotland Paisley, Scotland Contents Table 1: Cumulative binomial probabilities Page 1 Table 2: Cumulative
Confidence Intervals. σ unknown, small samples The t-statistic /22
 Confidence Intervals σ unknown, small samples The t-statistic 1 /22 Homework Read Sec 7-3. Discussion Question pg 365 Do Ex 7-3 1-4, 6, 9, 12, 14, 15, 17 2/22 Objective find the confidence interval for
Continuous Distributions
 Quantitative Methods 2013 Continuous Distributions 1 The most important probability distribution in statistics is the normal distribution. Carl Friedrich Gauss (1777 1855) Normal curve A normal distribution
Review of key points about estimators
 Review of key points about estimators Populations can be at least partially described by population parameters Population parameters include: mean, proportion, variance, etc. Because populations are often
Estimation and Confidence Intervals
 Estimation and Confidence Intervals Chapter 9-1/2 McGraw-Hill/Irwin Copyright 2011 by the McGraw-Hill Companies, Inc. All rights reserved. LEARNING OBJECTIVES LO1. Define a point estimate. LO2. Define
Estimation. Focus Points 10/11/2011. Estimating p in the Binomial Distribution. Section 7.3
 Estimation 7 Copyright Cengage Learning. All rights reserved. Section 7.3 Estimating p in the Binomial Distribution Copyright Cengage Learning. All rights reserved. Focus Points Compute the maximal length
Lecture Slides. Elementary Statistics Twelfth Edition. by Mario F. Triola. and the Triola Statistics Series. Section 7.4-1
 Lecture Slides Elementary Statistics Twelfth Edition and the Triola Statistics Series by Mario F. Triola Section 7.4-1 Chapter 7 Estimates and Sample Sizes 7-1 Review and Preview 7- Estimating a Population
Week 7. Texas A& M University. Department of Mathematics Texas A& M University, College Station Section 3.2, 3.3 and 3.4
 Week 7 Oğuz Gezmiş Texas A& M University Department of Mathematics Texas A& M University, College Station Section 3.2, 3.3 and 3.4 Oğuz Gezmiş (TAMU) Topics in Contemporary Mathematics II Week7 1 / 19
15.063: Communicating with Data Summer Recitation 4 Probability III
 15.063: Communicating with Data Summer 2003 Recitation 4 Probability III Today s Content Normal RV Central Limit Theorem (CLT) Statistical Sampling 15.063, Summer '03 2 Normal Distribution Any normal RV
Continuous probability distribution
 Microarray Center BIOSTATISTICS Lecture 6 Continuous Probability Distributions 16-4-1 Lecture 6. Continuous probability distributions Dr. Petr Nazarov petr.nazarov@crp-sante.lu OUTLINE Lecture 1 Continuous
Chapter 14 : Statistical Inference 1. Note : Here the 4-th and 5-th editions of the text have different chapters, but the material is the same.
 Chapter 14 : Statistical Inference 1 Chapter 14 : Introduction to Statistical Inference Note : Here the 4-th and 5-th editions of the text have different chapters, but the material is the same. Data x
Class 13. Daniel B. Rowe, Ph.D. Department of Mathematics, Statistics, and Computer Science. Marquette University MATH 1700
 Class 13 Daniel B. Rowe, Ph.D. Department of Mathematics, Statistics, and Computer Science Copyright 017 by D.B. Rowe 1 Agenda: Recap Chapter 6.3 6.5 Lecture Chapter 7.1 7. Review Chapter 5 for Eam 3.
The Normal Approximation to the Binomial
 Lecture 16 The Normal Approximation to the Binomial We can calculate l binomial i probabilities bbilii using The binomial formula The cumulative binomial tables When n is large, and p is not too close
Chapter 8 Statistical Intervals for a Single Sample
 Chapter 8 Statistical Intervals for a Single Sample Part 1: Confidence intervals (CI) for population mean µ Section 8-1: CI for µ when σ 2 known & drawing from normal distribution Section 8-1.2: Sample
Diploma Part 2. Quantitative Methods. Examiner s Suggested Answers
 Diploma Part 2 Quantitative Methods Examiner s Suggested Answers Question 1 (a) The binomial distribution may be used in an experiment in which there are only two defined outcomes in any particular trial
Week 2 Quantitative Analysis of Financial Markets Hypothesis Testing and Confidence Intervals
 Week 2 Quantitative Analysis of Financial Markets Hypothesis Testing and Confidence Intervals Christopher Ting http://www.mysmu.edu/faculty/christophert/ Christopher Ting : christopherting@smu.edu.sg :
Section 7-2 Estimating a Population Proportion
 Section 7- Estimating a Population Proportion 1 Key Concept In this section we present methods for using a sample proportion to estimate the value of a population proportion. The sample proportion is the
Discrete Random Variables
 Discrete Random Variables In this chapter, we introduce a new concept that of a random variable or RV. A random variable is a model to help us describe the state of the world around us. Roughly, a RV can
1/2 2. Mean & variance. Mean & standard deviation
 Question # 1 of 10 ( Start time: 09:46:03 PM ) Total Marks: 1 The probability distribution of X is given below. x: 0 1 2 3 4 p(x): 0.73? 0.06 0.04 0.01 What is the value of missing probability? 0.54 0.16
Business Statistics 41000: Probability 3
 Business Statistics 41000: Probability 3 Drew D. Creal University of Chicago, Booth School of Business February 7 and 8, 2014 1 Class information Drew D. Creal Email: dcreal@chicagobooth.edu Office: 404
Statistics 511 Additional Materials
 Discrete Random Variables In this section, we introduce the concept of a random variable or RV. A random variable is a model to help us describe the state of the world around us. Roughly, a RV can be thought
8.1 Binomial Distributions
 8.1 Binomial Distributions The Binomial Setting The 4 Conditions of a Binomial Setting: 1.Each observation falls into 1 of 2 categories ( success or fail ) 2 2.There is a fixed # n of observations. 3.All
Simulation Wrap-up, Statistics COS 323
 Simulation Wrap-up, Statistics COS 323 Today Simulation Re-cap Statistics Variance and confidence intervals for simulations Simulation wrap-up FYI: No class or office hours Thursday Simulation wrap-up
Key Objectives. Module 2: The Logic of Statistical Inference. Z-scores. SGSB Workshop: Using Statistical Data to Make Decisions
 SGSB Workshop: Using Statistical Data to Make Decisions Module 2: The Logic of Statistical Inference Dr. Tom Ilvento January 2006 Dr. Mugdim Pašić Key Objectives Understand the logic of statistical inference
Useful Probability Distributions
 Useful Probability Distributions Standard Normal Distribution Binomial Multinomial Hypergeometric Poisson Beta Binomial Student s t Beta Gamma Dirichlet Multivariate Normal and Correlation Standard Normal
Confidence Intervals for the Difference Between Two Means with Tolerance Probability
 Chapter 47 Confidence Intervals for the Difference Between Two Means with Tolerance Probability Introduction This procedure calculates the sample size necessary to achieve a specified distance from the
Random Variable: Definition
 Random Variables Random Variable: Definition A Random Variable is a numerical description of the outcome of an experiment Experiment Roll a die 10 times Inspect a shipment of 100 parts Open a gas station
Confidence Intervals and Sample Size
 Confidence Intervals and Sample Size Chapter 6 shows us how we can use the Central Limit Theorem (CLT) to 1. estimate a population parameter (such as the mean or proportion) using a sample, and. determine
Section 0: Introduction and Review of Basic Concepts
 Section 0: Introduction and Review of Basic Concepts Carlos M. Carvalho The University of Texas McCombs School of Business mccombs.utexas.edu/faculty/carlos.carvalho/teaching 1 Getting Started Syllabus
Chapter 5 Discrete Probability Distributions. Random Variables Discrete Probability Distributions Expected Value and Variance
 Chapter 5 Discrete Probability Distributions Random Variables Discrete Probability Distributions Expected Value and Variance.40.30.20.10 0 1 2 3 4 Random Variables A random variable is a numerical description
Data Analysis and Statistical Methods Statistics 651
 Data Analysis and Statistical Methods Statistics 651 http://www.stat.tamu.edu/~suhasini/teaching.html Lecture 14 (MWF) The t-distribution Suhasini Subba Rao Review of previous lecture Often the precision
STA258H5. Al Nosedal and Alison Weir. Winter Al Nosedal and Alison Weir STA258H5 Winter / 42
 STA258H5 Al Nosedal and Alison Weir Winter 2017 Al Nosedal and Alison Weir STA258H5 Winter 2017 1 / 42 CONFIDENCE INTERVALS FOR σ 2 Al Nosedal and Alison Weir STA258H5 Winter 2017 2 / 42 Background We
Chapter 7.2: Large-Sample Confidence Intervals for a Population Mean and Proportion. Instructor: Elvan Ceyhan
 1 Chapter 7.2: Large-Sample Confidence Intervals for a Population Mean and Proportion Instructor: Elvan Ceyhan Outline of this chapter: Large-Sample Interval for µ Confidence Intervals for Population Proportion
Estimation and Confidence Intervals
 Estimation and Confidence Intervals Chapter 9 McGraw-Hill/Irwin Copyright 2010 by The McGraw-Hill Companies, Inc. All rights reserved. GOALS 1. Define a point estimate. 2. Define level of confidence. 3.