Introduction to the Maximum Likelihood Estimation Technique. September 24, 2015
|
|
|
- Kerry Flynn
- 6 years ago
- Views:
Transcription
1 Introduction to the Maximum Likelihood Estimation Technique September 24, 2015
2 So far our Dependent Variable is Continuous That is, our outcome variable Y is assumed to follow a normal distribution having mean xb with variance/covariance σ 2 I. Many economic phenomena do not necessarily fit this story Examples: Foreign Aid Allocation: Many countries receive aid money and many do not. Labor Supply: In your homework, over 1/3 of your sample worked zero hours Unemployment claims: The duration of time on the unemployment roles is left skewed and not normal Bankruptcy: examining household bankruptcies reveals households are in 1 or 2 categories: bankrupt or not School choice: Students pick one of many schools An important difference here, is that we can t use the model errors as we have so far in the class.
3 So far our Dependent Variable is Continuous That is, our outcome variable Y is assumed to follow a normal distribution having mean xb with variance/covariance σ 2 I. Many economic phenomena do not necessarily fit this story Examples: Foreign Aid Allocation: Many countries receive aid money and many do not. Labor Supply: In your homework, over 1/3 of your sample worked zero hours Unemployment claims: The duration of time on the unemployment roles is left skewed and not normal Bankruptcy: examining household bankruptcies reveals households are in 1 or 2 categories: bankrupt or not School choice: Students pick one of many schools An important difference here, is that we can t use the model errors as we have so far in the class.

")
4 A focus on the Job Choice Example from Mroz Suppose you estimate the model on the full sample and calculate Ŷ = xb. Compare to Y Figure: Actual Working Hours (Y) Figure: Predicted Working Hours (Ŷ)
5 Censoring, Truncation, and Sample Selection The preceding example comes from problems arising from censoring/truncation. In effect part of our dependent variable is continous, but a large portion of our sample is stacked on a particular value (e.g. 0 in our example) We don t observe the dependent variable if the individual falls below (or above) a threshold level (truncation) Example: We only observe profits if they are positive. Otherwise, they were negative or zero. We don t observe a lower (or upper) threshold value for the dependent variable if the true dependent variable is below a critical value (censoring) Example:The lowest grade level I can assign is an F. Different students may have different capabilities (albeit not good), but all receive an F. For these kinds of problems, use the Tobit or Heckman models.
6 Dichotomous Choice Consider a model of the unemployed. Some look for work and some may not. In this case the dependent variable is binary (1=Looking for work, 0=not looking for work). In this case, we model the probability that an individual i is looking for work as Prob(i looking) = f (x i β ɛ i )dɛ i (1) Usual assumptions about the error lead to the Probit (based on the Normal Distribution) or the Logit (based on Generalized Extreme Value Type I).
7 Multinomial Choice- Choosing among K alternatives Consider a firm siting decision among K communities. Each community may offer different tax packages, have different amenities, etc. The firm s choice is from among one of the K sites. Now the probability that firm i chooses community k is Prob(k i) = f (x i1β,..., x ik β,..., x ik β ɛ)dɛ Usual assumptions about the error lead to the multinomial probit (based on the Normal Distribution) or the multinomial logit (based on Generalized Extreme Value Type I).
8 Modeling the duration of economic events Suppose you are interested in the duration of recession i (d i ). The probability that a recession is less than 1 year long is Prob(0 < d i < 12) = 12 0 f (x i b ɛ, t)dt (2) The function f (.) is called the hazard function, and this methodology was adapted from survival analysis from the biological literature.
9 A Monte Carlo Experiment I have performed a Monte Carlo experiment following this setup. Data Generation Process for N = 1000: 1. Generate vector x of independent variables 2. Generate the vector ɛ where ɛ is distributed N(0, σ 2 I ). 3. Calculate True Dependent Variable as y N 1 = 5 +.5x N 1 + ɛ N 1 4. Calculate Observed Independent Variable (Y ) as Y = Y if Y > 7.25 Y = 7.25 if Y 7.25
10
11
12
13 BIG FAIL for OLS, IV Estimation, and Traditional Panel Estimators
14 The Maximum Likelihood Approach The idea: Assume a functional form and distribution for the model errors For each observation, construct the probability of observing the dependent variable y i conditional on model parameters b Construct the Log-Likelihood Value Search over values for model parameters b that maximizes the sum of the Log-Likelihood Values
15 MLE: Formal Setup Consider a sample y = [ y 1... y i... y N ] from the population. The probability density function (or pdf) of the random variables y i conditioned on parameters θ is given by f (y i, θ). The joint density of n individually and identically distributed observation is [ y 1... y i... y N ] f (y, θ) = N f (y i, θ) = L(θ y) (3) i=1 is often termed the Likelihood Function and the approach is termed Maximum Likelihood Estimation (MLE).
16 MLE: Our Example In our excel spreadsheet example, f (y i, θ) = f (y i, µ σ 2 = 1) = 1 e (y i µ) 2πσ 2 2 2σ 2 (4) It is common practice to work with the Log-Likelihood Function (better numerical properties for computing): ln(l(θ y)) = N i=1 ( 1 ln e (y i µ) 2πσ 2 2 ) 2σ 2 (5) We showed how changing the values of µ, allowed us to find the maximum log-likelihood value for the mean of our random variables y. Hence the term maximum likelihood.
17 A special case: MLE and OLS Recalling that in an OLS context, y = xb + ɛ. Put another way, y N(xβ, σ 2 I). We can express this in a log likelihood context as f (y i β, σ 2, x i ) = 1 e (y i x i β) 2πσ 2 2 2σ 2 (6) Here we estimate the K β parameters and σ 2. By finding the K + 1 parameter values that maximize the log likelihood function. The maximumum likelihood estimator b MLE and smle 2 are exactly equivalent to their OLS counterparts b OLS and sols 2
18 Characterizing the Maximum Likelihood In order to be assured of an optimal parameter vector b mle, we need the following conditions to hold: dln(l(θ y,x)) 1. dθ = 0 d 2. 2 ln(l(θ y,x)) < 0 dθ 2 When taking this approach to the data, the optimization algorithm in stata evaluates the first and second derivates of the log-likelihood function to climb the hill to the topmost point representing the maximum likelihood. These conditions ignore local versus global concavity issues.
19 Properties of MLE The Maximum Likelihood Estimator has the following properties Consistency: plim(ˆθ) = θ Asymptotic Normality: ˆθ N(θ, I (θ) 1 ) Asymptotic Efficiency: ˆθ is asymptotically efficient and achieves the Rao-Cramer Lower Bound for consistent estimators (minimum variance estimator). Invariance: The MLE of δ = c(θ) is c(ˆθ) if c(θ) is a continuous differentiable function. These properties are roughly analogous to the BLUE properties of OLS. The importance of asymptotics looms large.
20 Hypothesis Testing in MLE: The Information Matrix The variance/covariance matrix of the parameters θ in an MLE framework depend on I (θ) = 1 2 lnl(θ) θ θ (7) and can be estimated by using our estimated parameter vector θ: I (ˆθ) = 1 2 lnl(ˆθ) ˆθ ˆθ (8) The inverse of this matrix is our estimated variance covariance matrix for the parameters with standard errors for parameter i equal to s.e.(i) = I (ˆθ ii ) 1
21 OLS equivalence of var/covariance matrix of the parameters Suppose we estimate an OLS model over N observations and 4 parameters. The variance covariance matrix of the parameters can be written s 2 (x x) 1 = s (9) it can be shown that the first K K rows and columns of I (ˆθ) has the property: I (ˆθ) 1 K K = s2 (x x) 1 (10) Note: the last column of I contains information about the covariance (and variance) of the parameter s 2. See Green
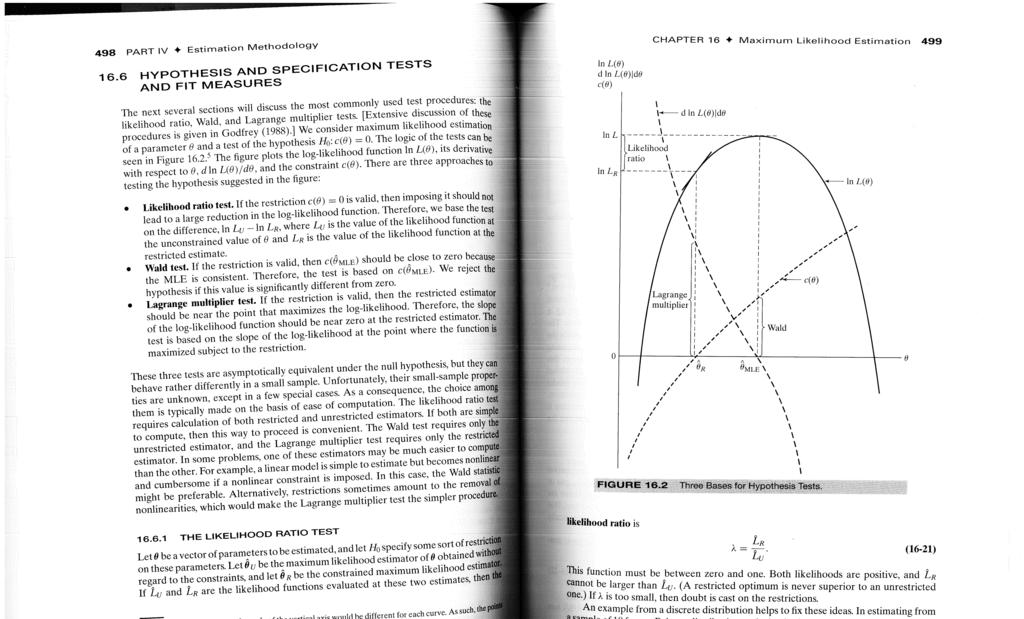
22 Nested Hypothesis Testing Consider a restriction of the form c(θ) = 0. A common restriction we consider is H 0 : c(θ) = θ 1 = θ 2 =... = θ k = 0 (11) In an OLS framework, we can use F tests based off of the Model, Total, and Error sum of squares. We don t have that in the MLE framework because we don t estimate model errors. Instead, we use one of three tests available in an MLE setting: Likelihood Ratio Test- Examine changes in the joint likelihood when restrictions imposed. Wald Test- Look at differences across ˆθ and θ r and see if they can be attributed to sampling error. Lagrange Multiplier Test- examine first derivative when restrictions imposed. These are all asymptotically equivalent and all are NESTED tests.
23
24 The Likelihood Ratio Test (LR Test) Denote ˆθ u as the unconstrained value of θ estimated via MLE and let ˆθ r be the constrained maximum likelihood estimator. If ˆL u and ˆL r are the likelihood function values from these parameter vectors (not Log Likelihood Values), the likelihood ratio is then λ = ˆL r ˆL u (12) The test statistic, LR = 2 ln(λ), is distributed as χ 2 (r) degrees of freedom where r are the number of restrictions. In terms of log-likelihood values, the likelihood ratio test statistic is also LR = 2 (ln(ˆl r ) ln(ˆl u )) (13)
25 The Wald Test This test is conceptually like the Hausman test we considered in the IV sections of the course. Consider a set of linear restrictions (e.g. Rθ = 0). The Wald test statistic is [ ] W = R ˆθ 0 [R[Var.(ˆθ)]R ] 1 [ ] R ˆθ 0 (14) W is distributed as χ 2 (r) degrees of freedom where r are the number of restrictions. For the case of one parameter (and the restriction that it equals zero), this simplifies to W = (ˆθ 0) 2 var(ˆθ) (15)
26 The Lagrange Multiplier Test (LM Test) This one considers how close the derivative of the likelihood function is to zero once restrictions are imposed. If imposing the restrictions doesn t come at a big cost in terms of the slope of the likelihood function, then the restrictions are more likely to be consistent with the data. The test statistic is ( ) ( ) L(R ˆθ) LM = I (ˆθ) ˆθ 1 L(R ˆθ) (16) ˆθ LM is distributed as χ 2 (r) degrees of freedom where r are the number of restrictions. For the case of one parameter (and the restriction that it equals zero), this simplifies to ( ) 2 L(ˆθ=0) LM = ˆθ var(ˆθ) (17)
27 Non-Nested Hypothesis Testing If one wishes to test hypothesis that are not nested, different procedures are needed. A common situation is comparing models (e.g. probit versus the logit). These use Information Criteria Approaches. Akaike Information Criterion (AIC) : 2ln(L) + 2K Bayes/Schwarz Information Criterion (BIC) : 2ln(L) + Kln(N) where K is the number of parameters in the model and N is the number of observations. Choosing the model based on the lowest AIC/BIC is akin to choosing the model with best adjusted R 2 - although it isn t necessarily based on goodness of fit, it depends on the model.
28 Goodness of fit Recall that model R 2 uses the predicted model error. Here, while we have errors, we don t model them directly. Instead, there has been some work related to goodness of fit in maximum likelihood settings. McFadden s Pseudo R 2 is calculated as Psuedo R 2 ln(l(ˆθ)) = 1 ln(l(ˆθ constant )) (18) Some authors (Woolridge) argue that these are poor goodness of fit measures and one should tailor goodness of fit criteria for the situation one is facing.
Intro to GLM Day 2: GLM and Maximum Likelihood
 Intro to GLM Day 2: GLM and Maximum Likelihood Federico Vegetti Central European University ECPR Summer School in Methods and Techniques 1 / 32 Generalized Linear Modeling 3 steps of GLM 1. Specify the
Gov 2001: Section 5. I. A Normal Example II. Uncertainty. Gov Spring 2010
 Gov 2001: Section 5 I. A Normal Example II. Uncertainty Gov 2001 Spring 2010 A roadmap We started by introducing the concept of likelihood in the simplest univariate context one observation, one variable.
Analysis of Microdata
 Rainer Winkelmann Stefan Boes Analysis of Microdata Second Edition 4u Springer 1 Introduction 1 1.1 What Are Microdata? 1 1.2 Types of Microdata 4 1.2.1 Qualitative Data 4 1.2.2 Quantitative Data 6 1.3
Chapter 4: Asymptotic Properties of MLE (Part 3)
") Chapter 4: Asymptotic Properties of MLE (Part 3) Daniel O. Scharfstein 09/30/13 1 / 1 Breakdown of Assumptions Non-Existence of the MLE Multiple Solutions to Maximization Problem Multiple Solutions to
Chapter 4: Asymptotic Properties of MLE (Part 3) Daniel O. Scharfstein 09/30/13 1 / 1 Breakdown of Assumptions Non-Existence of the MLE Multiple Solutions to Maximization Problem Multiple Solutions to
Phd Program in Transportation. Transport Demand Modeling. Session 11
 Phd Program in Transportation Transport Demand Modeling João de Abreu e Silva Session 11 Binary and Ordered Choice Models Phd in Transportation / Transport Demand Modelling 1/26 Heterocedasticity Homoscedasticity
ECON 5350 Class Notes Maximum Likelihood Estimation
 ECON 5350 Class Notes Maximum Likelihood Estimatio 1 Maximum Likelihood Estimatio Example #1. Cosider the radom sample {X 1 = 0.5, X 2 = 2.0, X 3 = 10.0, X 4 = 1.5, X 5 = 7.0} geerated from a expoetial
Models of Multinomial Qualitative Response
 Models of Multinomial Qualitative Response Multinomial Logit Models October 22, 2015 Dependent Variable as a Multinomial Outcome Suppose we observe an economic choice that is a binary signal from amongst
Econometric Methods for Valuation Analysis
 Econometric Methods for Valuation Analysis Margarita Genius Dept of Economics M. Genius (Univ. of Crete) Econometric Methods for Valuation Analysis Cagliari, 2017 1 / 25 Outline We will consider econometric
Chapter 7: Estimation Sections
 1 / 40 Chapter 7: Estimation Sections 7.1 Statistical Inference Bayesian Methods: Chapter 7 7.2 Prior and Posterior Distributions 7.3 Conjugate Prior Distributions 7.4 Bayes Estimators Frequentist Methods:
Definition 9.1 A point estimate is any function T (X 1,..., X n ) of a random sample. We often write an estimator of the parameter θ as ˆθ.
 of a random sample. We often write an estimator of the parameter θ as ˆθ.") 9 Point estimation 9.1 Rationale behind point estimation When sampling from a population described by a pdf f(x θ) or probability function P [X = x θ] knowledge of θ gives knowledge of the entire population.
9 Point estimation 9.1 Rationale behind point estimation When sampling from a population described by a pdf f(x θ) or probability function P [X = x θ] knowledge of θ gives knowledge of the entire population.
Log-linear Modeling Under Generalized Inverse Sampling Scheme
 Log-linear Modeling Under Generalized Inverse Sampling Scheme Soumi Lahiri (1) and Sunil Dhar (2) (1) Department of Mathematical Sciences New Jersey Institute of Technology University Heights, Newark,
The method of Maximum Likelihood.
 Maximum Likelihood The method of Maximum Likelihood. In developing the least squares estimator - no mention of probabilities. Minimize the distance between the predicted linear regression and the observed
Logit Models for Binary Data
 Chapter 3 Logit Models for Binary Data We now turn our attention to regression models for dichotomous data, including logistic regression and probit analysis These models are appropriate when the response
Economics Multinomial Choice Models
 Economics 217 - Multinomial Choice Models So far, most extensions of the linear model have centered on either a binary choice between two options (work or don t work) or censoring options. Many questions
Lecture 10: Point Estimation
 Lecture 10: Point Estimation MSU-STT-351-Sum-17B (P. Vellaisamy: MSU-STT-351-Sum-17B) Probability & Statistics for Engineers 1 / 31 Basic Concepts of Point Estimation A point estimate of a parameter θ,
Chapter 8: Sampling distributions of estimators Sections
 Chapter 8 continued Chapter 8: Sampling distributions of estimators Sections 8.1 Sampling distribution of a statistic 8.2 The Chi-square distributions 8.3 Joint Distribution of the sample mean and sample
Choice Probabilities. Logit Choice Probabilities Derivation. Choice Probabilities. Basic Econometrics in Transportation.
 1/31 Choice Probabilities Basic Econometrics in Transportation Logit Models Amir Samimi Civil Engineering Department Sharif University of Technology Primary Source: Discrete Choice Methods with Simulation
Interval estimation. September 29, Outline Basic ideas Sampling variation and CLT Interval estimation using X More general problems
 Interval estimation September 29, 2017 STAT 151 Class 7 Slide 1 Outline of Topics 1 Basic ideas 2 Sampling variation and CLT 3 Interval estimation using X 4 More general problems STAT 151 Class 7 Slide
A Test of the Normality Assumption in the Ordered Probit Model *
 A Test of the Normality Assumption in the Ordered Probit Model * Paul A. Johnson Working Paper No. 34 March 1996 * Assistant Professor, Vassar College. I thank Jahyeong Koo, Jim Ziliak and an anonymous
Two hours. To be supplied by the Examinations Office: Mathematical Formula Tables and Statistical Tables THE UNIVERSITY OF MANCHESTER
 Two hours MATH20802 To be supplied by the Examinations Office: Mathematical Formula Tables and Statistical Tables THE UNIVERSITY OF MANCHESTER STATISTICAL METHODS Answer any FOUR of the SIX questions.
Small Sample Performance of Instrumental Variables Probit Estimators: A Monte Carlo Investigation
 Small Sample Performance of Instrumental Variables Probit : A Monte Carlo Investigation July 31, 2008 LIML Newey Small Sample Performance? Goals Equations Regressors and Errors Parameters Reduced Form
Stochastic Models. Statistics. Walt Pohl. February 28, Department of Business Administration
 Stochastic Models Statistics Walt Pohl Universität Zürich Department of Business Administration February 28, 2013 The Value of Statistics Business people tend to underestimate the value of statistics.
Back to estimators...
 Back to estimators... So far, we have: Identified estimators for common parameters Discussed the sampling distributions of estimators Introduced ways to judge the goodness of an estimator (bias, MSE, etc.)
Vlerick Leuven Gent Working Paper Series 2003/30 MODELLING LIMITED DEPENDENT VARIABLES: METHODS AND GUIDELINES FOR RESEARCHERS IN STRATEGIC MANAGEMENT
 Vlerick Leuven Gent Working Paper Series 2003/30 MODELLING LIMITED DEPENDENT VARIABLES: METHODS AND GUIDELINES FOR RESEARCHERS IN STRATEGIC MANAGEMENT HARRY P. BOWEN Harry.Bowen@vlerick.be MARGARETHE F.
Maximum Likelihood Estimation
 Maximum Likelihood Estimation EPSY 905: Fundamentals of Multivariate Modeling Online Lecture #6 EPSY 905: Maximum Likelihood In This Lecture The basics of maximum likelihood estimation Ø The engine that
Equity, Vacancy, and Time to Sale in Real Estate.
 Title: Author: Address: E-Mail: Equity, Vacancy, and Time to Sale in Real Estate. Thomas W. Zuehlke Department of Economics Florida State University Tallahassee, Florida 32306 U.S.A. tzuehlke@mailer.fsu.edu
Chapter 7: Estimation Sections
 Chapter 7: Estimation Sections 7.1 Statistical Inference Bayesian Methods: 7.2 Prior and Posterior Distributions 7.3 Conjugate Prior Distributions Frequentist Methods: 7.5 Maximum Likelihood Estimators
PASS Sample Size Software
 Chapter 850 Introduction Cox proportional hazards regression models the relationship between the hazard function λ( t X ) time and k covariates using the following formula λ log λ ( t X ) ( t) 0 = β1 X1
Missing Data. EM Algorithm and Multiple Imputation. Aaron Molstad, Dootika Vats, Li Zhong. University of Minnesota School of Statistics
 Missing Data EM Algorithm and Multiple Imputation Aaron Molstad, Dootika Vats, Li Zhong University of Minnesota School of Statistics December 4, 2013 Overview 1 EM Algorithm 2 Multiple Imputation Incomplete
Chapter 5 Univariate time-series analysis. () Chapter 5 Univariate time-series analysis 1 / 29
 Chapter 5 Univariate time-series analysis 1 / 29") Chapter 5 Univariate time-series analysis () Chapter 5 Univariate time-series analysis 1 / 29 Time-Series Time-series is a sequence fx 1, x 2,..., x T g or fx t g, t = 1,..., T, where t is an index denoting
Chapter 5 Univariate time-series analysis () Chapter 5 Univariate time-series analysis 1 / 29 Time-Series Time-series is a sequence fx 1, x 2,..., x T g or fx t g, t = 1,..., T, where t is an index denoting
Practice Exam 1. Loss Amount Number of Losses
 Practice Exam 1 1. You are given the following data on loss sizes: An ogive is used as a model for loss sizes. Determine the fitted median. Loss Amount Number of Losses 0 1000 5 1000 5000 4 5000 10000
The Delta Method. j =.
 The Delta Method Often one has one or more MLEs ( 3 and their estimated, conditional sampling variancecovariance matrix. However, there is interest in some function of these estimates. The question is,
GMM Estimation. 1 Introduction. 2 Consumption-CAPM
 GMM Estimation 1 Introduction Modern macroeconomic models are typically based on the intertemporal optimization and rational expectations. The Generalized Method of Moments (GMM) is an econometric framework
Duration Models: Parametric Models
 Duration Models: Parametric Models Brad 1 1 Department of Political Science University of California, Davis January 28, 2011 Parametric Models Some Motivation for Parametrics Consider the hazard rate:
Non-informative Priors Multiparameter Models
 Non-informative Priors Multiparameter Models Statistics 220 Spring 2005 Copyright c 2005 by Mark E. Irwin Prior Types Informative vs Non-informative There has been a desire for a prior distributions that
6. Genetics examples: Hardy-Weinberg Equilibrium
 PBCB 206 (Fall 2006) Instructor: Fei Zou email: fzou@bios.unc.edu office: 3107D McGavran-Greenberg Hall Lecture 4 Topics for Lecture 4 1. Parametric models and estimating parameters from data 2. Method
A Two-Step Estimator for Missing Values in Probit Model Covariates
 WORKING PAPER 3/2015 A Two-Step Estimator for Missing Values in Probit Model Covariates Lisha Wang and Thomas Laitila Statistics ISSN 1403-0586 http://www.oru.se/institutioner/handelshogskolan-vid-orebro-universitet/forskning/publikationer/working-papers/
Correcting for Survival Effects in Cross Section Wage Equations Using NBA Data
 Correcting for Survival Effects in Cross Section Wage Equations Using NBA Data by Peter A Groothuis Professor Appalachian State University Boone, NC and James Richard Hill Professor Central Michigan University
A comment on Christoffersen, Jacobs and Ornthanalai (2012), Dynamic jump intensities and risk premiums: Evidence from S&P500 returns and options
, Dynamic jump intensities and risk premiums: Evidence from S&P500 returns and options") A comment on Christoffersen, Jacobs and Ornthanalai (2012), Dynamic jump intensities and risk premiums: Evidence from S&P500 returns and options Garland Durham 1 John Geweke 2 Pulak Ghosh 3 February 25,
A comment on Christoffersen, Jacobs and Ornthanalai (2012), Dynamic jump intensities and risk premiums: Evidence from S&P500 returns and options Garland Durham 1 John Geweke 2 Pulak Ghosh 3 February 25,
Course information FN3142 Quantitative finance
 Course information 015 16 FN314 Quantitative finance This course is aimed at students interested in obtaining a thorough grounding in market finance and related empirical methods. Prerequisite If taken
Amath 546/Econ 589 Univariate GARCH Models
 Amath 546/Econ 589 Univariate GARCH Models Eric Zivot April 24, 2013 Lecture Outline Conditional vs. Unconditional Risk Measures Empirical regularities of asset returns Engle s ARCH model Testing for ARCH
A potentially useful approach to model nonlinearities in time series is to assume different behavior (structural break) in different subsamples
 in different subsamples") 1.3 Regime switching models A potentially useful approach to model nonlinearities in time series is to assume different behavior (structural break) in different subsamples (or regimes). If the dates, the
1.3 Regime switching models A potentially useful approach to model nonlinearities in time series is to assume different behavior (structural break) in different subsamples (or regimes). If the dates, the
Much of what appears here comes from ideas presented in the book:
 Chapter 11 Robust statistical methods Much of what appears here comes from ideas presented in the book: Huber, Peter J. (1981), Robust statistics, John Wiley & Sons (New York; Chichester). There are many
Quantitative Introduction ro Risk and Uncertainty in Business Module 5: Hypothesis Testing Examples
 Quantitative Introduction ro Risk and Uncertainty in Business Module 5: Hypothesis Testing Examples M. Vidyasagar Cecil & Ida Green Chair The University of Texas at Dallas Email: M.Vidyasagar@utdallas.edu
Lecture 3: Factor models in modern portfolio choice
 Lecture 3: Factor models in modern portfolio choice Prof. Massimo Guidolin Portfolio Management Spring 2016 Overview The inputs of portfolio problems Using the single index model Multi-index models Portfolio
Point Estimators. STATISTICS Lecture no. 10. Department of Econometrics FEM UO Brno office 69a, tel
 STATISTICS Lecture no. 10 Department of Econometrics FEM UO Brno office 69a, tel. 973 442029 email:jiri.neubauer@unob.cz 8. 12. 2009 Introduction Suppose that we manufacture lightbulbs and we want to state
Department of Agricultural Economics. PhD Qualifier Examination. August 2010
 Department of Agricultural Economics PhD Qualifier Examination August 200 Instructions: The exam consists of six questions. You must answer all questions. If you need an assumption to complete a question,
CS340 Machine learning Bayesian model selection
 CS340 Machine learning Bayesian model selection Bayesian model selection Suppose we have several models, each with potentially different numbers of parameters. Example: M0 = constant, M1 = straight line,
Lecture 21: Logit Models for Multinomial Responses Continued
 Lecture 21: Logit Models for Multinomial Responses Continued Dipankar Bandyopadhyay, Ph.D. BMTRY 711: Analysis of Categorical Data Spring 2011 Division of Biostatistics and Epidemiology Medical University
Financial Econometrics
 Financial Econometrics Volatility Gerald P. Dwyer Trinity College, Dublin January 2013 GPD (TCD) Volatility 01/13 1 / 37 Squared log returns for CRSP daily GPD (TCD) Volatility 01/13 2 / 37 Absolute value
Omitted Variables Bias in Regime-Switching Models with Slope-Constrained Estimators: Evidence from Monte Carlo Simulations
 Journal of Statistical and Econometric Methods, vol. 2, no.3, 2013, 49-55 ISSN: 2051-5057 (print version), 2051-5065(online) Scienpress Ltd, 2013 Omitted Variables Bias in Regime-Switching Models with
A New Hybrid Estimation Method for the Generalized Pareto Distribution
 A New Hybrid Estimation Method for the Generalized Pareto Distribution Chunlin Wang Department of Mathematics and Statistics University of Calgary May 18, 2011 A New Hybrid Estimation Method for the GPD
Chapter 7 - Lecture 1 General concepts and criteria
 Chapter 7 - Lecture 1 General concepts and criteria January 29th, 2010 Best estimator Mean Square error Unbiased estimators Example Unbiased estimators not unique Special case MVUE Bootstrap General Question
Multivariate probit models for conditional claim-types
 Multivariate probit models for conditional claim-types Gary Young School of Economics Faculty of Business University of New South Wales Sydney, Australia 2052 e-mail: g.young@unsw.edu.au Robert Kohn School
Modelling Returns: the CER and the CAPM
 Modelling Returns: the CER and the CAPM Carlo Favero Favero () Modelling Returns: the CER and the CAPM 1 / 20 Econometric Modelling of Financial Returns Financial data are mostly observational data: they
The Two Sample T-test with One Variance Unknown
 The Two Sample T-test with One Variance Unknown Arnab Maity Department of Statistics, Texas A&M University, College Station TX 77843-343, U.S.A. amaity@stat.tamu.edu Michael Sherman Department of Statistics,
Lecture 17: More on Markov Decision Processes. Reinforcement learning
 Lecture 17: More on Markov Decision Processes. Reinforcement learning Learning a model: maximum likelihood Learning a value function directly Monte Carlo Temporal-difference (TD) learning COMP-424, Lecture
FIT OR HIT IN CHOICE MODELS
 FIT OR HIT IN CHOICE MODELS KHALED BOUGHANMI, RAJEEV KOHLI, AND KAMEL JEDIDI Abstract. The predictive validity of a choice model is often assessed by its hit rate. We examine and illustrate conditions
Applied Statistics I
 Applied Statistics I Liang Zhang Department of Mathematics, University of Utah July 14, 2008 Liang Zhang (UofU) Applied Statistics I July 14, 2008 1 / 18 Point Estimation Liang Zhang (UofU) Applied Statistics
Economics 742 Brief Answers, Homework #2
 Economics 742 Brief Answers, Homework #2 March 20, 2006 Professor Scholz ) Consider a person, Molly, living two periods. Her labor income is $ in period and $00 in period 2. She can save at a 5 percent
Assicurazioni Generali: An Option Pricing Case with NAGARCH
 Assicurazioni Generali: An Option Pricing Case with NAGARCH Assicurazioni Generali: Business Snapshot Find our latest analyses and trade ideas on bsic.it Assicurazioni Generali SpA is an Italy-based insurance
Estimation Procedure for Parametric Survival Distribution Without Covariates
 Estimation Procedure for Parametric Survival Distribution Without Covariates The maximum likelihood estimates of the parameters of commonly used survival distribution can be found by SAS. The following
Extend the ideas of Kan and Zhou paper on Optimal Portfolio Construction under parameter uncertainty
 Extend the ideas of Kan and Zhou paper on Optimal Portfolio Construction under parameter uncertainty George Photiou Lincoln College University of Oxford A dissertation submitted in partial fulfilment for
Molecular Phylogenetics
 Mole_Oce Lecture # 16: Molecular Phylogenetics Maximum Likelihood & Bahesian Statistics Optimality criterion: a rule used to decide which of two trees is best. Four optimality criteria are currently widely
MODEL SELECTION CRITERIA IN R:
 1. R 2 statistics We may use MODEL SELECTION CRITERIA IN R R 2 = SS R SS T = 1 SS Res SS T or R 2 Adj = 1 SS Res/(n p) SS T /(n 1) = 1 ( ) n 1 (1 R 2 ). n p where p is the total number of parameters. R
Analysis of truncated data with application to the operational risk estimation
 Analysis of truncated data with application to the operational risk estimation Petr Volf 1 Abstract. Researchers interested in the estimation of operational risk often face problems arising from the structure
Conditional Heteroscedasticity
 1 Conditional Heteroscedasticity May 30, 2010 Junhui Qian 1 Introduction ARMA(p,q) models dictate that the conditional mean of a time series depends on past observations of the time series and the past
Chapter 7: Estimation Sections
 1 / 31 : Estimation Sections 7.1 Statistical Inference Bayesian Methods: 7.2 Prior and Posterior Distributions 7.3 Conjugate Prior Distributions 7.4 Bayes Estimators Frequentist Methods: 7.5 Maximum Likelihood
Lecture Notes 6. Assume F belongs to a family of distributions, (e.g. F is Normal), indexed by some parameter θ.
, indexed by some parameter θ.") Sufficient Statistics Lecture Notes 6 Sufficiency Data reduction in terms of a particular statistic can be thought of as a partition of the sample space X. Definition T is sufficient for θ if the conditional
Sufficient Statistics Lecture Notes 6 Sufficiency Data reduction in terms of a particular statistic can be thought of as a partition of the sample space X. Definition T is sufficient for θ if the conditional
ST440/550: Applied Bayesian Analysis. (5) Multi-parameter models - Summarizing the posterior
 Multi-parameter models - Summarizing the posterior") (5) Multi-parameter models - Summarizing the posterior Models with more than one parameter Thus far we have studied single-parameter models, but most analyses have several parameters For example, consider
(5) Multi-parameter models - Summarizing the posterior Models with more than one parameter Thus far we have studied single-parameter models, but most analyses have several parameters For example, consider
ECON 6022B Problem Set 2 Suggested Solutions Fall 2011
 ECON 60B Problem Set Suggested Solutions Fall 0 September 7, 0 Optimal Consumption with A Linear Utility Function (Optional) Similar to the example in Lecture 3, the household lives for two periods and
The Weibull in R is actually parameterized a fair bit differently from the book. In R, the density for x > 0 is
 Weibull in R The Weibull in R is actually parameterized a fair bit differently from the book. In R, the density for x > 0 is f (x) = a b ( x b ) a 1 e (x/b) a This means that a = α in the book s parameterization
RESEARCH ARTICLE. The Penalized Biclustering Model And Related Algorithms Supplemental Online Material
 Journal of Applied Statistics Vol. 00, No. 00, Month 00x, 8 RESEARCH ARTICLE The Penalized Biclustering Model And Related Algorithms Supplemental Online Material Thierry Cheouo and Alejandro Murua Département
Unobserved Heterogeneity Revisited
 Unobserved Heterogeneity Revisited Robert A. Miller Dynamic Discrete Choice March 2018 Miller (Dynamic Discrete Choice) cemmap 7 March 2018 1 / 24 Distributional Assumptions about the Unobserved Variables
Rapid computation of prices and deltas of nth to default swaps in the Li Model
 Rapid computation of prices and deltas of nth to default swaps in the Li Model Mark Joshi, Dherminder Kainth QUARC RBS Group Risk Management Summary Basic description of an nth to default swap Introduction
Eco504 Spring 2010 C. Sims FINAL EXAM. β t 1 2 φτ2 t subject to (1)
") Eco54 Spring 21 C. Sims FINAL EXAM There are three questions that will be equally weighted in grading. Since you may find some questions take longer to answer than others, and partial credit will be given
Eco54 Spring 21 C. Sims FINAL EXAM There are three questions that will be equally weighted in grading. Since you may find some questions take longer to answer than others, and partial credit will be given
Maximum Likelihood Estimation
 Maximum Likelihood Estimation The likelihood and log-likelihood functions are the basis for deriving estimators for parameters, given data. While the shapes of these two functions are different, they have
Improved Inference for Signal Discovery Under Exceptionally Low False Positive Error Rates
 Improved Inference for Signal Discovery Under Exceptionally Low False Positive Error Rates (to appear in Journal of Instrumentation) Igor Volobouev & Alex Trindade Dept. of Physics & Astronomy, Texas Tech
15. Multinomial Outcomes A. Colin Cameron Pravin K. Trivedi Copyright 2006
 15. Multinomial Outcomes A. Colin Cameron Pravin K. Trivedi Copyright 2006 These slides were prepared in 1999. They cover material similar to Sections 15.3-15.6 of our subsequent book Microeconometrics:
Web Appendix. Are the effects of monetary policy shocks big or small? Olivier Coibion
 Web Appendix Are the effects of monetary policy shocks big or small? Olivier Coibion Appendix 1: Description of the Model-Averaging Procedure This section describes the model-averaging procedure used in
Gamma Distribution Fitting
 Chapter 552 Gamma Distribution Fitting Introduction This module fits the gamma probability distributions to a complete or censored set of individual or grouped data values. It outputs various statistics
What s New in Econometrics. Lecture 11
 What s New in Econometrics Lecture 11 Discrete Choice Models Guido Imbens NBER Summer Institute, 2007 Outline 1. Introduction 2. Multinomial and Conditional Logit Models 3. Independence of Irrelevant Alternatives
Alastair Hall ECG 790F: Microeconometrics Spring Computer Handout # 2. Estimation of binary response models : part II
 Alastair Hall ECG 790F: Microeconometrics Spring 2006 Computer Handout # 2 Estimation of binary response models : part II In this handout, we discuss the estimation of binary response models with and without
Time Invariant and Time Varying Inefficiency: Airlines Panel Data
 Time Invariant and Time Varying Inefficiency: Airlines Panel Data These data are from the pre-deregulation days of the U.S. domestic airline industry. The data are an extension of Caves, Christensen, and
STRESS-STRENGTH RELIABILITY ESTIMATION
 CHAPTER 5 STRESS-STRENGTH RELIABILITY ESTIMATION 5. Introduction There are appliances (every physical component possess an inherent strength) which survive due to their strength. These appliances receive
Hierarchical Generalized Linear Models. Measurement Incorporated Hierarchical Linear Models Workshop
 Hierarchical Generalized Linear Models Measurement Incorporated Hierarchical Linear Models Workshop Hierarchical Generalized Linear Models So now we are moving on to the more advanced type topics. To begin
Unit 5: Sampling Distributions of Statistics
 Unit 5: Sampling Distributions of Statistics Statistics 571: Statistical Methods Ramón V. León 6/12/2004 Unit 5 - Stat 571 - Ramon V. Leon 1 Definitions and Key Concepts A sample statistic used to estimate
Unit 5: Sampling Distributions of Statistics
 Unit 5: Sampling Distributions of Statistics Statistics 571: Statistical Methods Ramón V. León 6/12/2004 Unit 5 - Stat 571 - Ramon V. Leon 1 Definitions and Key Concepts A sample statistic used to estimate
STATISTICAL METHODS FOR CATEGORICAL DATA ANALYSIS
 STATISTICAL METHODS FOR CATEGORICAL DATA ANALYSIS Daniel A. Powers Department of Sociology University of Texas at Austin YuXie Department of Sociology University of Michigan ACADEMIC PRESS An Imprint of
Financial Risk Management
 Financial Risk Management Professor: Thierry Roncalli Evry University Assistant: Enareta Kurtbegu Evry University Tutorial exercices #4 1 Correlation and copulas 1. The bivariate Gaussian copula is given
Risk Management and Time Series
 IEOR E4602: Quantitative Risk Management Spring 2016 c 2016 by Martin Haugh Risk Management and Time Series Time series models are often employed in risk management applications. They can be used to estimate
Multiple regression - a brief introduction
 Multiple regression - a brief introduction Multiple regression is an extension to regular (simple) regression. Instead of one X, we now have several. Suppose, for example, that you are trying to predict
CHAPTER II LITERATURE STUDY
 CHAPTER II LITERATURE STUDY 2.1. Risk Management Monetary crisis that strike Indonesia during 1998 and 1999 has caused bad impact to numerous government s and commercial s bank. Most of those banks eventually
SYSM 6304 Risk and Decision Analysis Lecture 2: Fitting Distributions to Data
 SYSM 6304 Risk and Decision Analysis Lecture 2: Fitting Distributions to Data M. Vidyasagar Cecil & Ida Green Chair The University of Texas at Dallas Email: M.Vidyasagar@utdallas.edu September 5, 2015
Appendix. Table A.1 (Part A) The Author(s) 2015 G. Chakrabarti and C. Sen, Green Investing, SpringerBriefs in Finance, DOI /
 The Author(s) 2015 G. Chakrabarti and C. Sen, Green Investing, SpringerBriefs in Finance, DOI /") Appendix Table A.1 (Part A) Dependent variable: probability of crisis (own) Method: ML binary probit (quadratic hill climbing) Included observations: 47 after adjustments Convergence achieved after 6 iterations
Appendix Table A.1 (Part A) Dependent variable: probability of crisis (own) Method: ML binary probit (quadratic hill climbing) Included observations: 47 after adjustments Convergence achieved after 6 iterations
IEOR E4703: Monte-Carlo Simulation
 IEOR E4703: Monte-Carlo Simulation Simulation Efficiency and an Introduction to Variance Reduction Methods Martin Haugh Department of Industrial Engineering and Operations Research Columbia University
Comparing the Means of. Two Log-Normal Distributions: A Likelihood Approach
 Journal of Statistical and Econometric Methods, vol.3, no.1, 014, 137-15 ISSN: 179-660 (print), 179-6939 (online) Scienpress Ltd, 014 Comparing the Means of Two Log-Normal Distributions: A Likelihood Approach
Parameter estimation in SDE:s
 Lund University Faculty of Engineering Statistics in Finance Centre for Mathematical Sciences, Mathematical Statistics HT 2011 Parameter estimation in SDE:s This computer exercise concerns some estimation
Lecture 10: Alternatives to OLS with limited dependent variables, part 1. PEA vs APE Logit/Probit
 Lecture 10: Alternatives to OLS with limited dependent variables, part 1 PEA vs APE Logit/Probit PEA vs APE PEA: partial effect at the average The effect of some x on y for a hypothetical case with sample
Actuarial Mathematics and Statistics Statistics 5 Part 2: Statistical Inference Tutorial Problems
 Actuarial Mathematics and Statistics Statistics 5 Part 2: Statistical Inference Tutorial Problems Spring 2005 1. Which of the following statements relate to probabilities that can be interpreted as frequencies?