SIMULATION. The objectives of simulation:
|
|
|
- Miles Melton
- 6 years ago
- Views:
Transcription
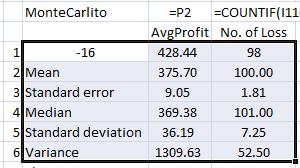
1 Note: This lecture is best taken with file LectureSIM.xls. Please pause the video and open LectureSIM.xls, then continue. You may like to pause whenever you need to understand and repeat what is covered here. SIMULATION The objectives of simulation: 1) To estimate the unknown population mean µ 0 (the average profit) with the confidence interval developed through the grant mean and the standard deviation of MonteCarlito, x z s x p z p 1 p n 2) To estimate the unknown population proportion (of loss) with the confidence interval developed through the grant proportion of MonteCarlito 3) The value of z is given by =NORMSINV(1-α), Z = 1.96 for 1-α = ) Conclusions of simulation study: a) We are 95% sure that the unknown true population mean (profit) is between the calculated lower and upper limits for the mean. b) We are 95% sure that the unknown true population proportion (loss) is between the calculated lower and upper limits for the proportion. 1
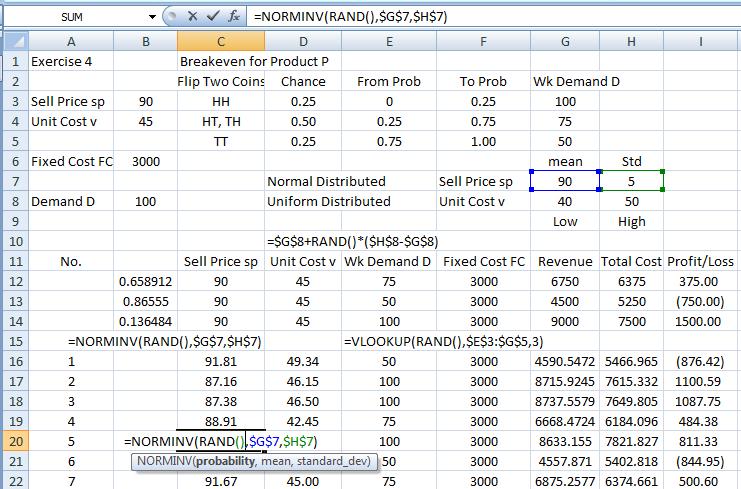
2 Product P and Profitability Analysis I Suppose you are a manager in P Manufacturing that makes Product P only. The demands for Product P are 100 units per week at $90 per unit. The overhead (fixed) cost is $3,000 that includes $1,500 of operators salaries, $1,000 equipment depreciation and $500 of utilities. There are two raw materials: Steel Widget and Metal Bracket for products P. The unit costs for raw materials are $25.00 and $20.00 for Steel Widget, and Metal Bracket, respectively. You are going to decide how many Ps to make in order to break-even (the net profit is zero) for the company Breakeven Units FixedCost SellingPrice VariableCost $ 3000 $ 90 $ 45 Profit Loss $ 90 DemandD $ 3,000 $ 45 DemandD You may want to Pause the Video to open Excel@ file LectureSIM.xls before continue 2


3 Set Manual calculations of formulas and Press F9 to recalculate Remember to Press F9 to recalculate Your computer may work really slow if you do not set up Manual calculations of formulas when doing simulation. Remember to set it back to automatic when finish simulations. 3

4 Using to calculate Breakeven Point: Breakeven Point Units $ 3,000 $90 $45 FixedCost SellPrice UnitVarCost Units Set up Excel@ formulas to calculate Profit/Loss: Profit Loss $ 90 DemandD $ 3,000 $ 45 DemandD Use of One and Two Variable Data Tables in Excel@ for Sensitivity Analysis 4
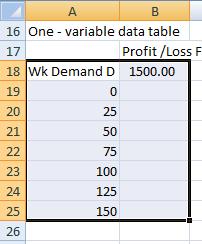
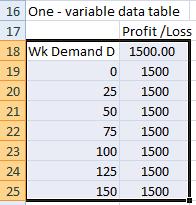
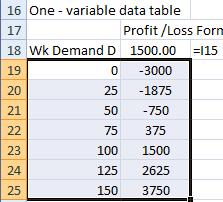
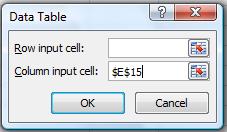
5 Sensitivity Analysis One Variable Data Table Press F9 5
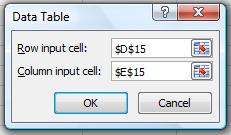


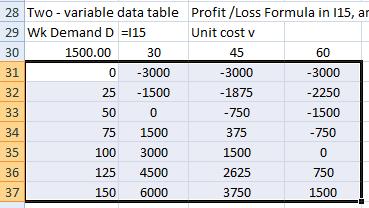
6 Sensitivity Analysis Two Variable Data Table Press F9 6


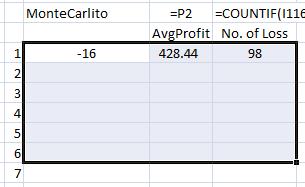
7 Calculate Mean and Standard Deviation of Profit and Percentage of Loss 7
 with given random")

8 Use Discrete Probability in simulation Eyeball =VLOOKUP() with given random numbers Collect statistics for the mean and standard deviation of profit and the number of losses 8
")

9 =VLOOKUP() with given random numbers =VLOOKUP() with =RAND() Use random number generator in simulation 9

")
10 Use random number generator in simulation =VLOOKUP() with =RAND() =VLOOKUP(RAND()) 10
11 It is very useful to have a few rows without random numbers to verify correctness of formulas Double verify the correctness of equations in the first and last rows before production runs of the simulation 11


12 Use Formulas/Show formulas or CTRL+` to show formulas in worksheet Additional adjustment to column width may be needed and use Print Preview/Page setup/fit into 1 or 2 pages to produce professional printouts. 12


13 Set up MonteCarlito 13

14 How to use MonteCarlito 14

15 Use MonteCarlito in simulation Press CTRL+W to MonteCarlito 15

16 Final result of the simulation with MonteCarlito 16
17 x z s x We are 95% sure that the unknown true average profit is between and p z p 1 p n We are 95% sure that the unknown true possibility of loss is between 20.62% and 29.09%. How to interpret simulation results? 17

18 18

19 x z s x We are 95% sure that the unknown true average profit is between and p z p 1 p n We are 95% sure that the unknown true possibility of loss is between 30.43% and 39.79%. Less profit and more loss due to more variations 19

20 Use MonteCarlito to collect statistics for multiple performance measures Press CTRL+W to get Result 20
21 IF D<=Q, THEN SOLD = D, INV LEVEL=Q-D, INV COST=Ci (Q-D) ELSE SOLD = Q, LOST SALES=D-Q, LOSS COST = Cl (D-Q) PROFIT/LOSS = PRICE * SOLD -INV COST LOSS COST In Excel@, use either SOLD=IF(D<=Q,D,Q) or SOLD=MIN(D,Q) For any leftover, use either LEFTOVER=IF(D<=Q,Q-D,0) or LEFTOVER=MAX(Q-D,0) For any lostsale, use either LOSTSALE=IF(D<=Q,0,D-Q) or LOSTSALE=MAX(D-Q,0) Calculate INVCOST=IF(D<=Q,HoldCost*(Q-D),0) or INVCOST=MAX(HoldCost*(Q-D),0) And SHORTCOST=IF(D<=Q,0,ShortUC*(D-Q)) or SHORTCOST=MAX(ShortUC*(D-Q),0) 21
 in Inventory")
22 Use =IF(), =MIN(), and =MAX() in Inventory simulation 22

23 Example of Simulation Process for Inventory Levels 23

24 24

25 25

26 Sample Set up for Queuing or Waiting Line Simulation Use a few easy examples to verify the logics before using random numbers 26

27 The Process of Queuing or Waiting Line Simulation 27
28 The objectives of simulation: To estimate the unknown population mean µ 0 (the average profit) and To estimate the unknown population proportion (of loss) x z s x p z p 1 p n Simulation as a tool in business decision making is very powerful, flexible and easy to use. Enjoy Simulating. 28
Lesson Plan for Simulation with Spreadsheets (8/31/11 & 9/7/11)
") Jeremy Tejada ISE 441 - Introduction to Simulation Learning Outcomes: Lesson Plan for Simulation with Spreadsheets (8/31/11 & 9/7/11) 1. Students will be able to list and define the different components
Jeremy Tejada ISE 441 - Introduction to Simulation Learning Outcomes: Lesson Plan for Simulation with Spreadsheets (8/31/11 & 9/7/11) 1. Students will be able to list and define the different components
Decision Trees: Booths
 DECISION ANALYSIS Decision Trees: Booths Terri Donovan recorded: January, 2010 Hi. Tony has given you a challenge of setting up a spreadsheet, so you can really understand whether it s wiser to play in
Simulation. Decision Models
 Lecture 9 Decision Models Decision Models: Lecture 9 2 Simulation What is Monte Carlo simulation? A model that mimics the behavior of a (stochastic) system Mathematically described the system using a set
LESSON 7 INTERVAL ESTIMATION SAMIE L.S. LY
 LESSON 7 INTERVAL ESTIMATION SAMIE L.S. LY 1 THIS WEEK S PLAN Part I: Theory + Practice ( Interval Estimation ) Part II: Theory + Practice ( Interval Estimation ) z-based Confidence Intervals for a Population
Chapter 6.1 Confidence Intervals. Stat 226 Introduction to Business Statistics I. Chapter 6, Section 6.1
 Stat 226 Introduction to Business Statistics I Spring 2009 Professor: Dr. Petrutza Caragea Section A Tuesdays and Thursdays 9:30-10:50 a.m. Chapter 6, Section 6.1 Confidence Intervals Confidence Intervals
Confidence Intervals for the Difference Between Two Means with Tolerance Probability
 Chapter 47 Confidence Intervals for the Difference Between Two Means with Tolerance Probability Introduction This procedure calculates the sample size necessary to achieve a specified distance from the
Statistics 13 Elementary Statistics
 Statistics 13 Elementary Statistics Summer Session I 2012 Lecture Notes 5: Estimation with Confidence intervals 1 Our goal is to estimate the value of an unknown population parameter, such as a population
Lecture 35 Section Wed, Mar 26, 2008
 on Lecture 35 Section 10.2 Hampden-Sydney College Wed, Mar 26, 2008 Outline on 1 2 3 4 5 on 6 7 on We will familiarize ourselves with the t distribution. Then we will see how to use it to test a hypothesis
Chapter 6 Analyzing Accumulated Change: Integrals in Action
 Chapter 6 Analyzing Accumulated Change: Integrals in Action 6. Streams in Business and Biology You will find Excel very helpful when dealing with streams that are accumulated over finite intervals. Finding
January 29. Annuities
 January 29 Annuities An annuity is a repeating payment, typically of a fixed amount, over a period of time. An annuity is like a loan in reverse; rather than paying a loan company, a bank or investment
Chapter 8 Statistical Intervals for a Single Sample
 Chapter 8 Statistical Intervals for a Single Sample Part 1: Confidence intervals (CI) for population mean µ Section 8-1: CI for µ when σ 2 known & drawing from normal distribution Section 8-1.2: Sample
Confidence Intervals and Sample Size
 Confidence Intervals and Sample Size Chapter 6 shows us how we can use the Central Limit Theorem (CLT) to 1. estimate a population parameter (such as the mean or proportion) using a sample, and. determine
TIE2140 / IE2140e Engineering Economy Tutorial 6 (Lab 2) Engineering-Economic Decision Making Process using EXCEL
 Engineering-Economic Decision Making Process using EXCEL") TIE2140 / IE2140e Engineering Economy Tutorial 6 (Lab 2) Engineering-Economic Decision Making Process using EXCEL Solutions Guide by Wang Xin, Hong Lanqing & Mei Wenjie 1. Learning Objectives In this lab-based
TIE2140 / IE2140e Engineering Economy Tutorial 6 (Lab 2) Engineering-Economic Decision Making Process using EXCEL Solutions Guide by Wang Xin, Hong Lanqing & Mei Wenjie 1. Learning Objectives In this lab-based
Determining Sample Size. Slide 1 ˆ ˆ. p q n E = z α / 2. (solve for n by algebra) n = E 2
 n = E 2") Determining Sample Size Slide 1 E = z α / 2 ˆ ˆ p q n (solve for n by algebra) n = ( zα α / 2) 2 p ˆ qˆ E 2 Sample Size for Estimating Proportion p When an estimate of ˆp is known: Slide 2 n = ˆ ˆ ( )
Determining Sample Size Slide 1 E = z α / 2 ˆ ˆ p q n (solve for n by algebra) n = ( zα α / 2) 2 p ˆ qˆ E 2 Sample Size for Estimating Proportion p When an estimate of ˆp is known: Slide 2 n = ˆ ˆ ( )
Jacob: The illustrative worksheet shows the values of the simulation parameters in the upper left section (Cells D5:F10). Is this for documentation?
. Is this for documentation?") PROJECT TEMPLATE: DISCRETE CHANGE IN THE INFLATION RATE (The attached PDF file has better formatting.) {This posting explains how to simulate a discrete change in a parameter and how to use dummy variables
PROJECT TEMPLATE: DISCRETE CHANGE IN THE INFLATION RATE (The attached PDF file has better formatting.) {This posting explains how to simulate a discrete change in a parameter and how to use dummy variables
DECISION SUPPORT Risk handout. Simulating Spreadsheet models
 DECISION SUPPORT MODELS @ Risk handout Simulating Spreadsheet models using @RISK 1. Step 1 1.1. Open Excel and @RISK enabling any macros if prompted 1.2. There are four on-line help options available.
Lecture 10. Ski Jacket Case Profit calculation Spreadsheet simulation Analysis of results Summary and Preparation for next class
 Decision Models Lecture 10 1 Lecture 10 Ski Jacket Case Profit calculation Spreadsheet simulation Analysis of results Summary and Preparation for next class Yield Management Decision Models Lecture 10
CHAPTER 8. Confidence Interval Estimation Point and Interval Estimates
 CHAPTER 8. Confidence Interval Estimation Point and Interval Estimates A point estimate is a single number, a confidence interval provides additional information about the variability of the estimate Lower
Version A. Problem 1. Let X be the continuous random variable defined by the following pdf: 1 x/2 when 0 x 2, f(x) = 0 otherwise.
 = 0 otherwise.") Math 224 Q Exam 3A Fall 217 Tues Dec 12 Version A Problem 1. Let X be the continuous random variable defined by the following pdf: { 1 x/2 when x 2, f(x) otherwise. (a) Compute the mean µ E[X]. E[X] x
Math 224 Q Exam 3A Fall 217 Tues Dec 12 Version A Problem 1. Let X be the continuous random variable defined by the following pdf: { 1 x/2 when x 2, f(x) otherwise. (a) Compute the mean µ E[X]. E[X] x
Master Budget Excel Project
 Master Budget Excel Project Overview: In this project, you will prepare a master budget in an Excel spreadsheet for Cascade Products Company for the year 2018, based on the materials in Ch. 7 Master Budgeting.
System Simulation Chapter 2: Simulation Examples
 System Simulation Chapter 2: Simulation Examples Fatih Cavdur fatihcavdur@uludag.edu.tr March 29, 21 Introduction Several examples of simulation that can be performed by devising a simulation table either
Confidence Intervals Introduction
 Confidence Intervals Introduction A point estimate provides no information about the precision and reliability of estimation. For example, the sample mean X is a point estimate of the population mean μ
Lecture #26 (tape #26) Prof. John W. Sutherland. Oct. 24, 2001
 Prof. John W. Sutherland. Oct. 24, 2001") Lecture #26 (tape #26) Prof. John W. Sutherland Oct. 24, 2001 Process Capability The extent to which a process produces parts that meet design intent. Most often, how well our process meets the engineering
Lecture #26 (tape #26) Prof. John W. Sutherland Oct. 24, 2001 Process Capability The extent to which a process produces parts that meet design intent. Most often, how well our process meets the engineering
Value of Information in Spreadsheet Monte Carlo Simulation Models
 Value of Information in Spreadsheet Monte Carlo Simulation Models INFORMS 010 Austin Michael R. Middleton, Ph.D. Decision Toolworks Mike@DecisionToolworks.com 15.10.7190 Background Spreadsheet models are
Time Observations Time Period, t
 Operations Research Models and Methods Paul A. Jensen and Jonathan F. Bard Time Series and Forecasting.S1 Time Series Models An example of a time series for 25 periods is plotted in Fig. 1 from the numerical
PROBABILITY AND STATISTICS CHAPTER 4 NOTES DISCRETE PROBABILITY DISTRIBUTIONS
 PROBABILITY AND STATISTICS CHAPTER 4 NOTES DISCRETE PROBABILITY DISTRIBUTIONS I. INTRODUCTION TO RANDOM VARIABLES AND PROBABILITY DISTRIBUTIONS A. Random Variables 1. A random variable x represents a value
Yield Management. Decision Models
 Decision Models: Lecture 10 2 Decision Models Yield Management Yield management is the process of allocating different types of capacity to different customers at different prices in order to maximize
Chapter 7. Confidence Intervals and Sample Sizes. Definition. Definition. Definition. Definition. Confidence Interval : CI. Point Estimate.
 Chapter 7 Confidence Intervals and Sample Sizes 7. Estimating a Proportion p 7.3 Estimating a Mean µ (σ known) 7.4 Estimating a Mean µ (σ unknown) 7.5 Estimating a Standard Deviation σ In a recent poll,
Acritical aspect of any capital budgeting decision. Using Excel to Perform Monte Carlo Simulations TECHNOLOGY
 Using Excel to Perform Monte Carlo Simulations By Thomas E. McKee, CMA, CPA, and Linda J.B. McKee, CPA Acritical aspect of any capital budgeting decision is evaluating the risk surrounding key variables
Lecture # 24. Prof. John W. Sutherland. Oct. 21, 2005
 Lecture # 24 Prof. John W. Sutherland Oct. 21, 2005 Process Capability The extent to which a process produces parts that meet design intent. Most often, how well the process meets the engineering specifications.
Statistics for Business and Economics
 Statistics for Business and Economics Chapter 7 Estimation: Single Population Copyright 010 Pearson Education, Inc. Publishing as Prentice Hall Ch. 7-1 Confidence Intervals Contents of this chapter: Confidence
Point Estimation. Principle of Unbiased Estimation. When choosing among several different estimators of θ, select one that is unbiased.
 Point Estimation Point Estimation Definition A point estimate of a parameter θ is a single number that can be regarded as a sensible value for θ. A point estimate is obtained by selecting a suitable statistic
Chapter 5. Continuous Random Variables and Probability Distributions. 5.1 Continuous Random Variables
 Chapter 5 Continuous Random Variables and Probability Distributions 5.1 Continuous Random Variables 1 2CHAPTER 5. CONTINUOUS RANDOM VARIABLES AND PROBABILITY DISTRIBUTIONS Probability Distributions Probability
Chapter 7. Confidence Intervals and Sample Size. Bluman, Chapter 7. Friday, January 25, 13
 Chapter 7 Confidence Intervals and Sample Size 1 1 Chapter 7 Overview Introduction 7-1 Confidence Intervals for the Mean When σ Is Known and Sample Size 7-2 Confidence Intervals for the Mean When σ Is
Managerial Accounting Prof. Dr. Varadraj Bapat Department School of Management Indian Institute of Technology, Bombay
 Managerial Accounting Prof. Dr. Varadraj Bapat Department School of Management Indian Institute of Technology, Bombay Lecture - 30 Budgeting and Standard Costing In our last session, we had discussed about
Statistics Class 15 3/21/2012
 Statistics Class 15 3/21/2012 Quiz 1. Cans of regular Pepsi are labeled to indicate that they contain 12 oz. Data Set 17 in Appendix B lists measured amounts for a sample of Pepsi cans. The same statistics
Personal Finance Amortization Table. Name: Period:
 Personal Finance Amortization Table Name: Period: Ch 8 Project using Excel In this project you will complete a loan amortization table (payment schedule) for the purchase of a home with a $235,500 loan
Economic Simulations for Risk Analysis
 Session 1339 Economic Simulations for Risk Analysis John H. Ristroph University of Louisiana at Lafayette Introduction and Overview Errors in estimates of cash flows are the rule rather than the exception,
Lecture 2 INTERVAL ESTIMATION II
 Lecture 2 INTERVAL ESTIMATION II Recap Population of interest - want to say something about the population mean µ perhaps Take a random sample... Recap When our random sample follows a normal distribution,
Estimation Y 3. Confidence intervals I, Feb 11,
 Estimation Example: Cholesterol levels of heart-attack patients Data: Observational study at a Pennsylvania medical center blood cholesterol levels patients treated for heart attacks measurements 2, 4,
Statistical Intervals (One sample) (Chs )
 (Chs )") 7 Statistical Intervals (One sample) (Chs 8.1-8.3) Confidence Intervals The CLT tells us that as the sample size n increases, the sample mean X is close to normally distributed with expected value µ and
7 Statistical Intervals (One sample) (Chs 8.1-8.3) Confidence Intervals The CLT tells us that as the sample size n increases, the sample mean X is close to normally distributed with expected value µ and
SQL Training Guide Part 2. SQL Accounting Training Guide Part 2
 SQL Accounting Training Guide Part 2 1 Contents 8 Inventory... 3 8.1 Maintain Stock Group :... 3 8.2 Maintain Stock Item :... 4 8.3 Sales & Purchase Document :... 5 8.4 Stock Received :... 6 8.5 Stock
An Excel Modeling Practice Problem
 An Excel Modeling Practice Problem Excel Review Excel 97 1999-2000 The Padgett s Widgets Problem Market research by Padgett s Widget Company has revealed that the demand for its products varies with the
Chapter 10 Inventory Theory
 Chapter 10 Inventory Theory 10.1. (a) Find the smallest n such that g(n) 0. g(1) = 3 g(2) =2 n = 2 (b) Find the smallest n such that g(n) 0. g(1) = 1 25 1 64 g(2) = 1 4 1 25 g(3) =1 1 4 g(4) = 1 16 1
Estimation and Confidence Intervals
 Estimation and Confidence Intervals Chapter 9-1/2 McGraw-Hill/Irwin Copyright 2011 by the McGraw-Hill Companies, Inc. All rights reserved. LEARNING OBJECTIVES LO1. Define a point estimate. LO2. Define
Unit 2: Statistics Probability
 Applied Math 30 3-1: Distributions Probability Distribution: - a table or a graph that displays the theoretical probability for each outcome of an experiment. - P (any particular outcome) is between 0
Descriptive Statistics
 Chapter 3 Descriptive Statistics Chapter 2 presented graphical techniques for organizing and displaying data. Even though such graphical techniques allow the researcher to make some general observations
Chapter Fourteen: Simulation
 TaylCh14ff.qxd 4/21/06 8:39 PM Page 213 Chapter Fourteen: Simulation PROBLEM SUMMARY 1. Rescue squad emergency calls PROBLEM SOLUTIONS 1. 2. Car arrivals at a service station 3. Machine breakdowns 4. Income
Frequency Distributions
 Frequency Distributions January 8, 2018 Contents Frequency histograms Relative Frequency Histograms Cumulative Frequency Graph Frequency Histograms in R Using the Cumulative Frequency Graph to Estimate
UEP USER GUIDE. Preface. Contents
 UEP_User_Guide_20171203.docx UEP USER GUIDE Preface For questions, problem reporting, and suggestions, please contact: John Schuyler, Decision Precision john@maxvalue.com 001-303-693-0067 www.maxvalue.com
THE UNIVERSITY OF THE WEST INDIES (DEPARTMENT OF MANAGEMENT STUDIES)
") THE UNIVERSITY OF THE WEST INDIES (DEPARTMENT OF MANAGEMENT STUDIES) Mid-Semester Exam: Summer2005 June 20:2005; 7:00 9:00 pm MS 23C: Introduction to Quantitative Methods Instructions 1. This exam has
THE UNIVERSITY OF THE WEST INDIES (DEPARTMENT OF MANAGEMENT STUDIES) Mid-Semester Exam: Summer2005 June 20:2005; 7:00 9:00 pm MS 23C: Introduction to Quantitative Methods Instructions 1. This exam has
MBA 7020 Sample Final Exam
 Descriptive Measures, Confidence Intervals MBA 7020 Sample Final Exam Given the following sample of weight measurements (in pounds) of 25 children aged 4, answer the following questions(1 through 3): 45,
Chapter 8 Additional Probability Topics
 Chapter 8 Additional Probability Topics 8.6 The Binomial Probability Model Sometimes experiments are simulated using a random number function instead of actually performing the experiment. In Problems
LAB 2 INSTRUCTIONS PROBABILITY DISTRIBUTIONS IN EXCEL
 LAB 2 INSTRUCTIONS PROBABILITY DISTRIBUTIONS IN EXCEL There is a wide range of probability distributions (both discrete and continuous) available in Excel. They can be accessed through the Insert Function
ECE 586BH: Problem Set 5: Problems and Solutions Multistage games, including repeated games, with observed moves
 University of Illinois Spring 01 ECE 586BH: Problem Set 5: Problems and Solutions Multistage games, including repeated games, with observed moves Due: Reading: Thursday, April 11 at beginning of class
Math 140 Introductory Statistics. First midterm September
 Math 140 Introductory Statistics First midterm September 23 2010 Box Plots Graphical display of 5 number summary Q1, Q2 (median), Q3, max, min Outliers If a value is more than 1.5 times the IQR from the
Calculating VaR. There are several approaches for calculating the Value at Risk figure. The most popular are the
 VaR Pro and Contra Pro: Easy to calculate and to understand. It is a common language of communication within the organizations as well as outside (e.g. regulators, auditors, shareholders). It is not really
Lecture 8: Skew Tolerant Design (including Dynamic Circuit Issues)
") Lecture 8: Skew Tolerant Design (including Dynamic Circuit Issues) Computer Systems Laboratory Stanford University horowitz@stanford.edu Copyright 2007 by Mark Horowitz w/ material from David Harris 1
Lecture 8: Skew Tolerant Design (including Dynamic Circuit Issues) Computer Systems Laboratory Stanford University horowitz@stanford.edu Copyright 2007 by Mark Horowitz w/ material from David Harris 1
One day workshop Do it yourself Filing of IT Return
 One day workshop Do it yourself Filing of IT Return One day workshop was conducted for M.Com students to provide practical exposure on how to file income tax returns for themselves, family members and
In this chapter: Budgets and Planning Tools. Configure a budget. Report on budget versus actual figures. Export budgets.
 Budgets and Planning Tools In this chapter: Configure a budget Report on budget versus actual figures Export budgets Project cash flow Chapter 23 479 Tuesday, September 18, 2007 4:38:14 PM 480 P A R T
Business Case Modelling 2 Day Course
 Business Case Modelling 2 Day Course This course can be presented in-house for you on a date of your choosing 17 th 18 th May & 29 th 30 th Nov 2018 The Banking and Corporate Finance Training Specialist
Expectation Exercises.
 Expectation Exercises. Pages Problems 0 2,4,5,7 (you don t need to use trees, if you don t want to but they might help!), 9,-5 373 5 (you ll need to head to this page: http://phet.colorado.edu/sims/plinkoprobability/plinko-probability_en.html)
RESOLV CONTAINER MANAGEMENT DESKTOP
 RESOLV CONTAINER MANAGEMENT DESKTOP USER MANUAL Version 9.2 for HANA Desktop PRESENTED BY ACHIEVE IT SOLUTIONS Copyright 2016 by Achieve IT Solutions These materials are subject to change without notice.
Statistics for Managers Using Microsoft Excel 7 th Edition
 Statistics for Managers Using Microsoft Excel 7 th Edition Chapter 7 Sampling Distributions Statistics for Managers Using Microsoft Excel 7e Copyright 2014 Pearson Education, Inc. Chap 7-1 Learning Objectives
Key Objectives. Module 2: The Logic of Statistical Inference. Z-scores. SGSB Workshop: Using Statistical Data to Make Decisions
 SGSB Workshop: Using Statistical Data to Make Decisions Module 2: The Logic of Statistical Inference Dr. Tom Ilvento January 2006 Dr. Mugdim Pašić Key Objectives Understand the logic of statistical inference
Chapter 6 Confidence Intervals
 Chapter 6 Confidence Intervals Section 6-1 Confidence Intervals for the Mean (Large Samples) VOCABULARY: Point Estimate A value for a parameter. The most point estimate of the population parameter is the
Section 8.1 Estimating μ When σ is Known
 Chapter 8 Estimation Name Section 8.1 Estimating μ When σ is Known Objective: In this lesson you learned to explain the meanings of confidence level, error of estimate, and critical value; to find the
3: Balance Equations
 3.1 Balance Equations Accounts with Constant Interest Rates 15 3: Balance Equations Investments typically consist of giving up something today in the hope of greater benefits in the future, resulting in
Lab 6. Microsoft Excel
 Lab 6 Microsoft Excel Objective At the end of this lesson, you should be able to describe components and functions in Excel perform and apply basic Excel operations Introduction to Management Information
Elementary Statistics Triola, Elementary Statistics 11/e Unit 14 The Confidence Interval for Means, σ Unknown
 Elementary Statistics We are now ready to begin our exploration of how we make estimates of the population mean. Before we get started, I want to emphasize the importance of having collected a representative
T.I.H.E. IT 233 Statistics and Probability: Sem. 1: 2013 ESTIMATION
 In Inferential Statistic, ESTIMATION (i) (ii) is called the True Population Mean and is called the True Population Proportion. You must also remember that are not the only population parameters. There
Getting started with WinBUGS
 1 Getting started with WinBUGS James B. Elsner and Thomas H. Jagger Department of Geography, Florida State University Some material for this tutorial was taken from http://www.unt.edu/rss/class/rich/5840/session1.doc
Chapter 7.2: Large-Sample Confidence Intervals for a Population Mean and Proportion. Instructor: Elvan Ceyhan
 1 Chapter 7.2: Large-Sample Confidence Intervals for a Population Mean and Proportion Instructor: Elvan Ceyhan Outline of this chapter: Large-Sample Interval for µ Confidence Intervals for Population Proportion
Chapter 8 Estimation
 Chapter 8 Estimation There are two important forms of statistical inference: estimation (Confidence Intervals) Hypothesis Testing Statistical Inference drawing conclusions about populations based on samples
Chapter 7 presents the beginning of inferential statistics. The two major activities of inferential statistics are
 Chapter 7 presents the beginning of inferential statistics. Concept: Inferential Statistics The two major activities of inferential statistics are 1 to use sample data to estimate values of population
Lecture outline W.B. Powell 1
 Lecture outline Applications of the newsvendor problem The newsvendor problem Estimating the distribution and censored demands The newsvendor problem and risk The newsvendor problem with an unknown distribution
19. CONFIDENCE INTERVALS FOR THE MEAN; KNOWN VARIANCE
 19. CONFIDENCE INTERVALS FOR THE MEAN; KNOWN VARIANCE We assume here that the population variance σ 2 is known. This is an unrealistic assumption, but it allows us to give a simplified presentation which
Laboratory I.9 Applications of the Derivative
 Laboratory I.9 Applications of the Derivative Goals The student will determine intervals where a function is increasing or decreasing using the first derivative. The student will find local minima and
Chapter 14 : Statistical Inference 1. Note : Here the 4-th and 5-th editions of the text have different chapters, but the material is the same.
 Chapter 14 : Statistical Inference 1 Chapter 14 : Introduction to Statistical Inference Note : Here the 4-th and 5-th editions of the text have different chapters, but the material is the same. Data x
Estimating parameters 5.3 Confidence Intervals 5.4 Sample Variance
 Estimating parameters 5.3 Confidence Intervals 5.4 Sample Variance Prof. Tesler Math 186 Winter 2017 Prof. Tesler Ch. 5: Confidence Intervals, Sample Variance Math 186 / Winter 2017 1 / 29 Estimating parameters
Chapter 6 - Continuous Probability Distributions
 Chapter 6 - Continuous Probability s Chapter 6 Continuous Probability s Uniform Probability Normal Probability f () Uniform f () Normal Continuous Probability s A continuous random variable can assume
R & R Study. Chapter 254. Introduction. Data Structure
 Chapter 54 Introduction A repeatability and reproducibility (R & R) study (sometimes called a gauge study) is conducted to determine if a particular measurement procedure is adequate. If the measurement
A) The first quartile B) The Median C) The third quartile D) None of the previous. 2. [3] If P (A) =.8, P (B) =.7, and P (A B) =.
![A) The first quartile B) The Median C) The third quartile D) None of the previous. 2. [3] If P (A) =.8, P (B) =.7, and P (A B) =.](/thumbs/95/124846909.jpg "A) The first quartile B) The Median C) The third quartile D) None of the previous. 2. [3] If P (A) =.8, P (B) =.7, and P (A B) =.") Review for stat2507 Final (December 2008) Part I: Multiple Choice questions (on 39%): Please circle only one choice. 1. [3] Which one of the following summary measures is affected most by outliers A) The
Review for stat2507 Final (December 2008) Part I: Multiple Choice questions (on 39%): Please circle only one choice. 1. [3] Which one of the following summary measures is affected most by outliers A) The
Uniform Probability Distribution. Continuous Random Variables &
 Continuous Random Variables & What is a Random Variable? It is a quantity whose values are real numbers and are determined by the number of desired outcomes of an experiment. Is there any special Random
Statistics TI-83 Usage Handout
 Statistics TI-83 Usage Handout This handout includes instructions for performing several different functions on a TI-83 calculator for use in Statistics. The Contents table below lists the topics covered
The Binomial Distribution
 The Binomial Distribution January 31, 2018 Contents The Binomial Distribution The Normal Approximation to the Binomial The Binomial Hypothesis Test Computing Binomial Probabilities in R 30 Problems The
Elementary Statistics
 Chapter 7 Estimation Goal: To become familiar with how to use Excel 2010 for Estimation of Means. There is one Stat Tool in Excel that is used with estimation of means, T.INV.2T. Open Excel and click on
Financing Feedbacks FORECASTING FINANCIAL STATEMENTS WITH FINANCING FEEDBACKS AND ALTERNATIVE SOURCES OF FUNDS
 W E B E X T E N S I O N9A Financing Feedbacks In Chapter 9, we forecasted financial statements under the assumption that the firm s interest expense can be estimated as the product of the prior year s
One note for Session Two
 ESD.70J Engineering Economy Module Fall 2004 Session Three Link for PPT: http://web.mit.edu/tao/www/esd70/s3/p.ppt ESD.70J Engineering Economy Module - Session 3 1 One note for Session Two If you Excel
Lecture Slides. Elementary Statistics Twelfth Edition. by Mario F. Triola. and the Triola Statistics Series. Section 7.4-1
 Lecture Slides Elementary Statistics Twelfth Edition and the Triola Statistics Series by Mario F. Triola Section 7.4-1 Chapter 7 Estimates and Sample Sizes 7-1 Review and Preview 7- Estimating a Population
2014 EXAMINATIONS KNOWLEDGE LEVEL PAPER 3 : MANAGEMENT INFORMATION
 EXAMINATION NO. 2014 EXAMINATIONS KNOWLEDGE LEVEL PAPER 3 : MANAGEMENT INFORMATION FRIDAY 5 DECEMBER 2014 TIME ALLOWED : 3 HOURS 9.00 AM - 12.00 NOON INSTRUCTIONS: - 1. You are allowed 15 minutes reading
Online Course Manual By Craig Pence. Module 7
 Online Course Manual By Craig Pence Copyright Notice. Each module of the course manual may be viewed online, saved to disk, or printed (each is composed of 10 to 15 printed pages of text) by students enrolled
The Binomial Distribution
 The Binomial Distribution January 31, 2019 Contents The Binomial Distribution The Normal Approximation to the Binomial The Binomial Hypothesis Test Computing Binomial Probabilities in R 30 Problems The
Hydrology 4410 Class 29. In Class Notes & Exercises Mar 27, 2013
 Hydrology 4410 Class 29 In Class Notes & Exercises Mar 27, 2013 Log Normal Distribution We will not work an example in class. The procedure is exactly the same as in the normal distribution, but first
Many companies in the 80 s used this milking philosophy to extract money from the company and then sell it off to someone else.
 Someone looking at a company and considering purchasing it is not going to be too impressed with the company paying out large dividends. Those dividends will go to the investors, the current owners. The
Section 7-2 Estimating a Population Proportion
 Section 7- Estimating a Population Proportion 1 Key Concept In this section we present methods for using a sample proportion to estimate the value of a population proportion. The sample proportion is the
1,40,000 units ( 1,26,00,000 / 90)
") C.A. FINAL Solution to Q. 1 (i) Statement of the Number of Units of the Product Proposed to be Sold (ii) Selling Price per unit 90 Total Sales Revenue 1,26,00,000 Number of Units of the Product (proposed
C.A. FINAL Solution to Q. 1 (i) Statement of the Number of Units of the Product Proposed to be Sold (ii) Selling Price per unit 90 Total Sales Revenue 1,26,00,000 Number of Units of the Product (proposed
Confidence Intervals for Paired Means with Tolerance Probability
 Chapter 497 Confidence Intervals for Paired Means with Tolerance Probability Introduction This routine calculates the sample size necessary to achieve a specified distance from the paired sample mean difference
Class 16. Daniel B. Rowe, Ph.D. Department of Mathematics, Statistics, and Computer Science. Marquette University MATH 1700
 Class 16 Daniel B. Rowe, Ph.D. Department of Mathematics, Statistics, and Computer Science Copyright 013 by D.B. Rowe 1 Agenda: Recap Chapter 7. - 7.3 Lecture Chapter 8.1-8. Review Chapter 6. Problem Solving
Chapter 5. Sampling Distributions
 Lecture notes, Lang Wu, UBC 1 Chapter 5. Sampling Distributions 5.1. Introduction In statistical inference, we attempt to estimate an unknown population characteristic, such as the population mean, µ,