Czech Government Bond yields under FX pressure
|
|
|
- Evangeline Byrd
- 5 years ago
- Views:
Transcription
1 Czech Government Bond yields under FX pressure Mojmír Simerský May 2018 Abstract This paper presents some results of the yield curve (YC) estimation method proposed in [5]. We focus on the Czech Government Bond market in the period , when the Czech National Bank (CNB) weakened the CZK exchange rate by long term currency interventions. The input data is the Czech daily fixing published online by MTS [3]. These quotations suffer, however, from a large bid ask or YTM spreads, a fact that reflects itself in the YC estimation errors. Some 700 YCs were computed and the histograms of yield estimation errors and of YC smoothness are given. Of interest is the comparison of the Czech benchmark zero coupon yields at 1, 5, and 10 years with the ECB AAA yields [2]. Selected YCs in 2017 show that the outstanding depression of the short term bond yields occurred in mid January, some two months before the CNB announced the end of interventions (April 6). The termination itself influenced the Czech bond yields only moderately. Keywords: yield curve estimation, zero coupon yields, Czech bond market, Czech National Bank, ECB JEL: C51, E43, G12 1 Introduction The Czech Government bond secondary market offers an opportunity to put into practice the YC estimation procedure we proposed in [5]. Most importantly, there is a price source [3] covering regularly and fully this market. The number of bonds and the range of maturities are sufficient. As a prerequisite, we are technically acquainted with the Czech bond market conventions and rules. In the last years the policy of central banks led to a new phenomenon negative nominal interest rates, in the Czech case accentuated by the CNB interventions with the aim to fix the exchange rate of CZK at 27 CZK/EUR. As a result, yield curves have acquired Contact: simersky@gmail.com, Location: Prague, Czech Republic 1
2 new and more complicated shapes, not quite tractable by standard parametric estimation. A viable nonparametric approach, which we propose, can therefore prove useful. We start with an evaluation of the quality of input data, i.e., price quotations. The YC estimation works with the mid prices and the level of bid ask spreads relates to the YC estimation errors. Because we optimize the sum of squared yield errors rather than price errors, the YTM spreads are of importance and were evaluated as well. Seen from either side, the quality of the Czech daily fixing price quotations is poor. We processed some 700 YCs in the period The key estimation parameter, the RMSE of estimated yields, depends on the degree of smoothing in the opposite way as does the smoothness of the spot curve. To find a compromise, we took, as a proxy of the smoothness, the number of inflexion points on the spot curve. The histograms of the yield RMS errors and those of the inflexion point numbers are plotted and deemed to corroborate our choice of the smoothing parameter. Next, the computed zero coupon Czech yields at benchmark maturities are compared with the corresponding Eurozone AAA zero coupon yields, as published by the ECB [2]. Because the rating of the Czech Republic is more than one grade lower, it is to be expected that the credit spreads would be permanently positive. For the 1Y maturity, it is certainly not the case. Several YCs were chosen from our library of the Czech YCs ( to document a substantial deepening of the short term bond yields in January 2017, some two months before the CNB reverted its policy of weakening the currency. In the following sections, we present and comment the graphs illustrating the points mentioned above. Our view will be strictly descriptive; we endeavor to eschew any economic speculations, let alone divinations. 2 Input data The Czech daily fixing data are issued on every Czech working day at about 11:30 a.m. [3]. Apart from bid and ask clean prices, there are: mid price, mid YTM, and bond duration. The list of responsible contributors can be found in [4]. In the period we gathered price data of 695 days, up to 22 December 2017, first fortnightly or weekly, from November 2015 daily. The data of the 2017 last week had to be discarded due to their very poor quality. In total, some price quotations were processed. To evaluate price and yield spreads, the quotations were divided into four duration brackets: year, 1 3 years, 3 10 years, and years. The YTM spread was calculated from the fixing data as Y T M SP READ = ASK P RICE BID P RICE MID P RICE 1 + MID Y T M DURAT ION 2
3 in words, the relative price change divided by the modified duration. Fig. 1 presents the histogram of price quotation spreads (left part). Most of the data lie in the bracket bps, except for the bonds with duration 1 3 years, where the maximum is between 10 and 30 bps. With the longest issues, the spreads above 100 bps occur in more than 40% of quotations. The yield spreads show that the shortest bonds are plagued with substantial imprecision of quotes. The peak is between 30 and 100 bps, but some 20% of prices suffer from even greater errors. We note that if we were to insist on the condition stipulated by the ECB methodology: Only actively traded central government bonds with a maximum bid-ask spread per quote of three basis points are selected [2], we could have been able to use only 423 quotations out of , i.e., 3.3 percent. 3 Estimation errors From each fixing, only fixed coupon bonds and zero-coupon bonds were selected. As in the ECB methodology, residual maturities from three months up to 30 years were considered. The number of selected bonds was most often between 18 and 20, the last maturity being in December Due to their number, we could not afford the luxury of outlier detection as in [2]. The only quality test used was the rejection of quotations with the YTM spread larger than 200 bps. The spot value at t = 0, required as an input parameter, was the average of PRIBOR and PRIBID 1 D rates [1]. The division of the time axis consisted of 40 knots, the m-th time knot being t(m) = a+bm 2, where a and b were the constants chosen so that t(1) = 1/12 (the shortest time knot, one month), t(40) = 30 (the last knot, 30 years). The estimation was carried out for three values of the smoothing parameter λ = 1, 0, 1 (λ is an exponent see [5]). As a proxy of the curve smoothness, we chose the number of inflection points on the spot curve. The second derivative of the spot curve is discontinuous at the knots ([5]) and it can be demonstrated that the first derivative is always monotone 3

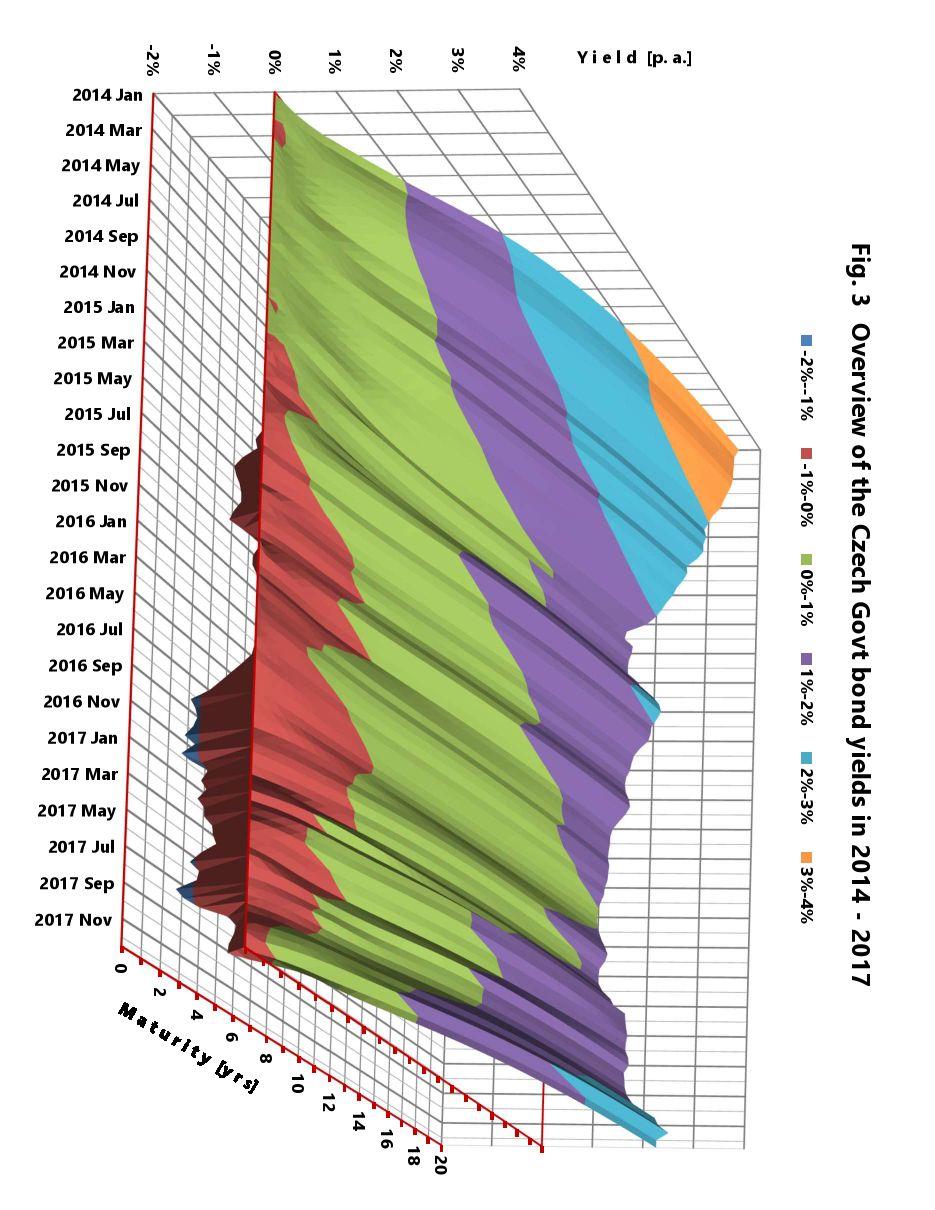
4 between the knots. In the range years we sought the knots where the first derivative was increasing on the time interval to the left and decreasing to the right, or vice versa. To suppress spurious inflexion points due to small derivative values etc., only the cases where the monotonicity lasted for at least two consecutive intervals were counted. Fig. 2 Number of inflexion points on the estimated spot curves and RMS errors as a function of the level of smoothing. There seems to be prevalence of three inflexion points in our data. (The additional inflexion points occur mainly at short maturities, where the density of cashflows is greater and the time knots are denser.) Subjective observation leads to an assessment that five or less inflection points makes the spot curve look smooth. The RMS errors of estimation can be roughly classified as follows: about two thirds of specimens have the RMSE less than 3 bps for λ = 1, less than 4 bps for λ = 0, and less than 5 bps for λ = 1. The last value of λ, however, gives an increased percentage of large estimation errors. In our view, λ = 0 seems to be the most appropriate smoothing level: the cases of excessive number of inflection points are at about 5 per cent and the distribution is near symmetric. We observe that these estimation errors compare favorably with the (half of) yield quotation error levels (Fig.1). On the next page, the development of the Czech zero-coupon yields is presented. The Figure plots 96 curves, two for each month, computed as an average of daily yield curves over a fortnight, i.e., from November 2015, as an average of 10 working days. From the Figure, the extent and the maturity depth of negative yields can be assessed (red and blue colors). 4
5 5
6 4 Zero-coupon yields 0,5% Comparison of CZ Govt Bond Yields with ECB AAA yields 0,0% Yield p.a. -0,5% -1,0% -1,5% 1 year -2,0% ,5% 1,0% Yield p.a. 0,5% 0,0% -0,5% 5 years -1,0% ,0% 2,5% 2,0% Yield p.a. 1,5% 1,0% 0,5% 0,0% 10 years -0,5% Fig. 4 Comparison of Czech Govt Bond yields with ECB AAA yields in the period The Czech benchmark zero-coupon yields at 1, 5, and 10 years (in blue) are from our computations. The red curves plot the data available from the ECB ([2]). 6
7 An interesting point is the propagation of the short-term negative rates in the second half of 2015 up to 10 years of maturity. At that time, the credit spread of the 10 Y Czech zero-coupon yields with respect to the Eurozone AAA (in fact, Germany s ones) reached units of bps. Despite the differences of the estimation methods and their standard errors, this demonstrates that the 10 Y benchmark credit spread, frequently taken as a sign of the credit situation of the sovereign issuer, can be strongly influenced by the central bank policies. Another period worth of interest is the last quarter of 2016 and the first of Such yield depression could hardly be tenable for long. The impact on the 5 Y and 10 Y spreads is visible but short-lived. To our pity, we do not possess information that could explain a swift return of the short-term rates back to more sustainable levels. From Fig. 4 it may be seen that the CNB decision on April 6, 2017, did not change the picture too much. In the following months, however, the return to the standard FX regime had led to adequate yield spreads. Fig. 5 Czech Govt Bond YCs on specific dates. The most negative short-term rates took place in mid-january (12 Jan, blue). The CNB decision to stop, after more than three years, the FX interventions, did not cause any upheaval in the bond market - here the YC one day before the announcement (5 Apr, red) compared with that one month later (5 May, black). At the end of the period of our data (22 Dec, green), the level of yields was substantially higher. 7
8 5 Conclusion In this paper, we tried to demonstrate that the procedure we have been using for the estimation of the Czech Government zero-coupon yield curves for some time, as evidenced on our site offers a viable alternative to existing parametric and nonparametric methods. The CNB action gave us an opportunity to encounter some strangely shaped YCs, not yet considered in the common literature on this subject matter. The reverse of the medal was a substantial worsening of the daily fixing data quality. The problem started approximately half a year before April 2017 and continued until the end of that year. In the future, we would try to find an opportunity to test our procedure on more precise price quotations, either real, or simulated. Finally, we note that in the community of Czech economic experts the reception and appraisal of the CNB measures have been far from unequivocal. Not a surprise, if we believe that Clarke s Law aka Coulomb s Law on experts holds (the latter name may reflect a widely accepted idea that the overall electric charge of the Universe is zero). References [1] markets/money market/pribor/index.html [2] markets and interest rates/euro area yield curves [3] [4] [5] Simersky, M., Zero-coupon yields estimated by zero-degree splines (2018), Acknowledgments: to my first wife 8
A nonparametric zero coupon yield curve
 A nonparametric zero coupon yield curve Mojmír Simerský January 016 Keywords: yield curve estimation, nonparametric regression, optimal smoothness Abstract The paper adds to a volume of publications on
EUROZONE MYC EXPLANATION AND FAQS
 EUROZONE MYC EXPLANATION AND FAQS This paper is addressed to users of the Eurozone Mercer Yield Curve ( Eurozone MYC ) and their auditors. It explains the methodology used to derive the Eurozone MYC which
Debt Portfolio Management Quarterly Review. September 2013
 Ministry of Finance Debt and Financial Assets Management Department Debt Portfolio Management Quarterly Review September 2013 10 October 2013 Ministry of Finance Debt Portfolio Management Quarterly Review
Which Market? The Bond Market or the Credit Default Swap Market?
 Kamakura Corporation Fair Value and Expected Credit Loss Estimation: An Accuracy Comparison of Bond Price versus Spread Analysis Using Lehman Data Donald R. van Deventer and Suresh Sankaran April 25, 2016
AP Statistics Chapter 6 - Random Variables
 AP Statistics Chapter 6 - Random 6.1 Discrete and Continuous Random Objective: Recognize and define discrete random variables, and construct a probability distribution table and a probability histogram
the display, exploration and transformation of the data are demonstrated and biases typically encountered are highlighted.
 1 Insurance data Generalized linear modeling is a methodology for modeling relationships between variables. It generalizes the classical normal linear model, by relaxing some of its restrictive assumptions,
MODELLING OF INCOME AND WAGE DISTRIBUTION USING THE METHOD OF L-MOMENTS OF PARAMETER ESTIMATION
 International Days of Statistics and Economics, Prague, September -3, MODELLING OF INCOME AND WAGE DISTRIBUTION USING THE METHOD OF L-MOMENTS OF PARAMETER ESTIMATION Diana Bílková Abstract Using L-moments
Chapter 7 1. Random Variables
 Chapter 7 1 Random Variables random variable numerical variable whose value depends on the outcome of a chance experiment - discrete if its possible values are isolated points on a number line - continuous
Key issues in reshaping the public debt management framework of the new EU members. Lars Boman Swedish National Debt Office Rome, 27 November 2003
 Key issues in reshaping the public debt management framework of the new EU members Lars Boman Swedish National Debt Office Rome, 27 November 2003 Key issues Foreign currency, domestic currency and the
Smooth estimation of yield curves by Laguerre functions
 Smooth estimation of yield curves by Laguerre functions A.S. Hurn 1, K.A. Lindsay 2 and V. Pavlov 1 1 School of Economics and Finance, Queensland University of Technology 2 Department of Mathematics, University
H EDGING CALLABLE BONDS S WAPS WITH C REDIT D EFAULT. Abstract
 H EDGING CALLABLE BONDS WITH C REDIT D EFAULT S WAPS Jan-Frederik Mai XAIA Investment GmbH Sonnenstraße 19, 8331 München, Germany jan-frederik.mai@xaia.com Date: July 24, 215 Abstract The cash flows of
Debt markets. International Financial Markets. International Financial Markets
 Debt markets Outline Instruments Participants Yield curve Risks 2 Debt instruments Bank loans most typical Reliance on private information Difficult to transfert to third party Government and commercial
Survey of Math Chapter 21: Savings Models Handout Page 1
 Chapter 21: Savings Models Handout Page 1 Growth of Savings: Simple Interest Simple interest pays interest only on the principal, not on any interest which has accumulated. Simple interest is rarely used
Czech Koruna and the Economic Outlook
 Czech Koruna and the Economic Outlook Vladimír Tomšík Vice-Governor Czech National Bank Austrian-Czech Economic Forum Czech National Bank Congress Centre Prague, 7 June 17 Outline 1. The CNB s exchange
Building a Zero Coupon Yield Curve
 Building a Zero Coupon Yield Curve Clive Bastow, CFA, CAIA ABSTRACT Create and use a zero- coupon yield curve from quoted LIBOR, Eurodollar Futures, PAR Swap and OIS rates. www.elpitcafinancial.com Risk-
KPMG Pensions Accounting Survey in the Netherlands
 KPMG Pensions Accounting Survey in the Netherlands 2017 Year-End preview and 2016 Year-End retrospective kpmg.nl 2 KPMG Pensions Accounting Survey in the Netherlands Content Introduction 3 Headlines 4
Chapter 4 Random Variables & Probability. Chapter 4.5, 6, 8 Probability Distributions for Continuous Random Variables
 Chapter 4.5, 6, 8 Probability for Continuous Random Variables Discrete vs. continuous random variables Examples of continuous distributions o Uniform o Exponential o Normal Recall: A random variable =
Interest Rate Futures. Arjun Parthasarathy Founder INRBONDS.com
 Interest Rate Futures Arjun Parthasarathy Founder INRBONDS.com 1 Interest Rate Futures Agenda Pricing How it works? 2 Interest Rate Futures 3 www.investorsareidiots.com Ten Year Cash Settled IRF IRF on
**BEGINNING OF EXAMINATION** A random sample of five observations from a population is:
 **BEGINNING OF EXAMINATION** 1. You are given: (i) A random sample of five observations from a population is: 0.2 0.7 0.9 1.1 1.3 (ii) You use the Kolmogorov-Smirnov test for testing the null hypothesis,
THE NEW EURO AREA YIELD CURVES
 THE NEW EURO AREA YIELD CURVES Yield describe the relationship between the residual maturity of fi nancial instruments and their associated interest rates. This article describes the various ways of presenting
Taxation and Efficiency : (a) : The Expenditure Function
 : The Expenditure Function") Taxation and Efficiency : (a) : The Expenditure Function The expenditure function is a mathematical tool used to analyze the cost of living of a consumer. This function indicates how much it costs in dollars
Taxation and Efficiency : (a) : The Expenditure Function The expenditure function is a mathematical tool used to analyze the cost of living of a consumer. This function indicates how much it costs in dollars
Capital Protection Oriented Schemes - Strategies, Regulation & Rating
 Capital Protection Oriented Schemes - Strategies, Regulation & Rating Introduction The Securities & Exchange Board of India (SEBI), in August 2006, released the guidelines for capital protection oriented
Evaluating the Degree Influence of Different Factors on the Exchange Rates in Ukraine
 Evaluating the Degree Influence of Different Factors on the Exchange Rates in Ukraine SHCHERBAK A.V. Department of Applied Mathematics National Technical University of Ukraine Kiev Polytechnic Institute
Issued On: 21 Jan Morningstar Client Notification - Fixed Income Style Box Change. This Notification is relevant to all users of the: OnDemand
 Issued On: 21 Jan 2019 Morningstar Client Notification - Fixed Income Style Box Change This Notification is relevant to all users of the: OnDemand Effective date: 30 Apr 2019 Dear Client, As part of our
THE USE OF THE LOGNORMAL DISTRIBUTION IN ANALYZING INCOMES
 International Days of tatistics and Economics Prague eptember -3 011 THE UE OF THE LOGNORMAL DITRIBUTION IN ANALYZING INCOME Jakub Nedvěd Abstract Object of this paper is to examine the possibility of
Historical VaR for bonds - a new approach
 - 1951 - Historical VaR for bonds - a new approach João Beleza Sousa M2A/ADEETC, ISEL - Inst. Politecnico de Lisboa Email: jsousa@deetc.isel.ipl.pt... Manuel L. Esquível CMA/DM FCT - Universidade Nova
Weekly 2018 Week 15 WEEK AHEAD. Market Research Czech Republic & Eurozone. April
 Weekly 218 Week 15 MARTIN LOBOTKA, (+42) 777 27 165, MLobotka@42fs.com, Research@42fs.com CALENDAR DAY DATE TIME (CET)* MARKET RELEASE CONSENSUS** 42FS Tuesday 17-Apr 1: ITA (Final) Headline HICP, Mar'18
Statistics 431 Spring 2007 P. Shaman. Preliminaries
 Statistics 4 Spring 007 P. Shaman The Binomial Distribution Preliminaries A binomial experiment is defined by the following conditions: A sequence of n trials is conducted, with each trial having two possible
Basic Procedure for Histograms
 Basic Procedure for Histograms 1. Compute the range of observations (min. & max. value) 2. Choose an initial # of classes (most likely based on the range of values, try and find a number of classes that
starting on 5/1/1953 up until 2/1/2017.
 An Actuary s Guide to Financial Applications: Examples with EViews By William Bourgeois An actuary is a business professional who uses statistics to determine and analyze risks for companies. In this guide,
Sampling Distributions and the Central Limit Theorem
 Sampling Distributions and the Central Limit Theorem February 18 Data distributions and sampling distributions So far, we have discussed the distribution of data (i.e. of random variables in our sample,
The risk of losses because the fair value of the Group s assets and liabilities varies with changes in market conditions.
 4. Market risk 51 4.1. Definition 51 4.2. Policy and responsibility 52 4.3. Monitoring 52 4.4. Use of models 52 4.5. Interest rate risk 54 4.5.1. Floor risk 54 4.6. Exchange rate risk 54 4.7. Equity market
BENEFITS OF ALLOCATION OF TRADITIONAL PORTFOLIOS TO HEDGE FUNDS. Lodovico Gandini (*)
") BENEFITS OF ALLOCATION OF TRADITIONAL PORTFOLIOS TO HEDGE FUNDS Lodovico Gandini (*) Spring 2004 ABSTRACT In this paper we show that allocation of traditional portfolios to hedge funds is beneficial in
BENEFITS OF ALLOCATION OF TRADITIONAL PORTFOLIOS TO HEDGE FUNDS Lodovico Gandini (*) Spring 2004 ABSTRACT In this paper we show that allocation of traditional portfolios to hedge funds is beneficial in
Math 2311 Bekki George Office Hours: MW 11am to 12:45pm in 639 PGH Online Thursdays 4-5:30pm And by appointment
 Math 2311 Bekki George bekki@math.uh.edu Office Hours: MW 11am to 12:45pm in 639 PGH Online Thursdays 4-5:30pm And by appointment Class webpage: http://www.math.uh.edu/~bekki/math2311.html Math 2311 Class
F UNCTIONAL R ELATIONSHIPS BETWEEN S TOCK P RICES AND CDS S PREADS
 F UNCTIONAL R ELATIONSHIPS BETWEEN S TOCK P RICES AND CDS S PREADS Amelie Hüttner XAIA Investment GmbH Sonnenstraße 19, 80331 München, Germany amelie.huettner@xaia.com March 19, 014 Abstract We aim to
What are the Essential Features of a Good Economic Scenario Generator? AFIR Munich September 11, 2009
 What are the Essential Features of a Good Economic Scenario Generator? Hal Pedersen (University of Manitoba) with Joe Fairchild (University of Kansas), Chris K. Madsen (AEGON N.V.), Richard Urbach (DFA
US Bond Markets and Credit Spreads during the Great Depression
 US Bond Markets and Credit Spreads during the Great Depression Toby Daglish 1 and Lyndon Moore 2 1 NZ Institute for the Study of Competition and Regulation 2 University of Melbourne 4 Nov 2011 Literature
Debt Portfolio Management Quarterly Report
 Ministry of Finance Debt and Financial Assets Management Department Debt Portfolio Management Quarterly Report 1 st Half of 2017 21 July 2017 Ministry of Finance Debt Portfolio Management Quarterly Report
Estimating A Smooth Term Structure of Interest Rates
 E STIMATING A SMOOTH LTA 2/98 TERM STRUCTURE P. 159 177 OF INTEREST RATES JARI KÄPPI 1 Estimating A Smooth Term Structure of Interest Rates ABSTRACT This paper extends the literature of the term structure
DEVELOPMENTS IN DOMESTIC FINANCIAL MARKETS IN
 10 FINANCIAL MARKET DEVELOPMENTS IN DOMESTIC FINANCIAL MARKETS IN 2005 1 In 2005, the economy of the Slovak Republic continued to show strong growth, which was, as opposed to 2004, accompanied by a fall
CHAPTER 8. Valuing Bonds. Chapter Synopsis
 CHAPTER 8 Valuing Bonds Chapter Synopsis 8.1 Bond Cash Flows, Prices, and Yields A bond is a security sold at face value (FV), usually $1,000, to investors by governments and corporations. Bonds generally
The transmission mechanism and policy responses to global monetary developments: the Indonesian experience
 The transmission mechanism and policy responses to global monetary developments: the Indonesian experience Perry Warjiyo 1 Abstract This note describes Indonesia s experiences of the monetary policy transmission
Foundations of Finance
 Lecture 7: Bond Pricing, Forward Rates and the Yield Curve. I. Reading. II. Discount Bond Yields and Prices. III. Fixed-income Prices and No Arbitrage. IV. The Yield Curve. V. Other Bond Pricing Issues.
C ARRY MEASUREMENT FOR
 C ARRY MEASUREMENT FOR CAPITAL STRUCTURE ARBITRAGE INVESTMENTS Jan-Frederik Mai XAIA Investment GmbH Sonnenstraße 19, 80331 München, Germany jan-frederik.mai@xaia.com July 10, 2015 Abstract An expected
PARAMETRIC AND NON-PARAMETRIC BOOTSTRAP: A SIMULATION STUDY FOR A LINEAR REGRESSION WITH RESIDUALS FROM A MIXTURE OF LAPLACE DISTRIBUTIONS
 PARAMETRIC AND NON-PARAMETRIC BOOTSTRAP: A SIMULATION STUDY FOR A LINEAR REGRESSION WITH RESIDUALS FROM A MIXTURE OF LAPLACE DISTRIBUTIONS Melfi Alrasheedi School of Business, King Faisal University, Saudi
Weekly 2018 Week 03 WEEK AHEAD. Market Research Czech Republic & Eurozone. January
 Weekly 218 Week 3 MARTIN LOBOTKA, (+42) 777 27 165, MLobotka@42fs.com, Research@42fs.com CALENDAR WEEK AHEAD DAY DATE TIME (CET)* MARKET RELEASE CONSENSUS** 42FS Wednesday 24-Jan 9: CZ 24-Jan 1: EMU Business
* + p t. i t. = r t. + a(p t
 REAL INTEREST RATE AND MONETARY POLICY There are various approaches to the question of what is a desirable long-term level for monetary policy s instrumental rate. The matter is discussed here with reference
Solvency II yield curves
 Solvency II yield curves EIPOA, May 5, 2011 Svend Jakobsen Partner, Ph.D., Scanrate Financial Systems Aarhus, Denmark skj@scanrate.dk 1 Copyright Scanrate Financial Systems 03-06-2011 Overview Presentation
The Yield Curve as a Predictor of Economic Activity the Case of the EU- 15
 The Yield Curve as a Predictor of Economic Activity the Case of the EU- 15 Jana Hvozdenska Masaryk University Faculty of Economics and Administration, Department of Finance Lipova 41a Brno, 602 00 Czech
: The EXAKT Cost Model
 1 of 13 11/03/2011 10:48 PM The EXAKT Cost Model By:Murray Wiseman on:sun 21 of Jan., 2007 02:24 MST (346 Reads) The EXAKT Cost Model Return to WikiHome Slide 1 Nature, and therefore humankind, must optimize
CNB Monetary Policy on its Way Back to Normal
 CNB Monetary Policy on its Way Back to Normal Luboš KOMÁREK Czech National Bank Spring Meetings 2018 Washington, D.C. Exit from FX commitment % CZK/EUR FX commitment was abandoned on 6 April 2017 as conditions
Indian Sovereign Yield Curve using Nelson-Siegel-Svensson Model
 Indian Sovereign Yield Curve using Nelson-Siegel-Svensson Model Of the three methods of valuing a Fixed Income Security Current Yield, YTM and the Coupon, the most common method followed is the Yield To
Data Analysis and Statistical Methods Statistics 651
 Data Analysis and Statistical Methods Statistics 651 http://www.stat.tamu.edu/~suhasini/teaching.html Lecture 10 (MWF) Checking for normality of the data using the QQplot Suhasini Subba Rao Review of previous
Morningstar Fixed-Income Style Box TM
 ? Morningstar Fixed-Income Style Box TM Morningstar Methodology Effective Apr. 30, 2019 Contents 1 Fixed-Income Style Box 4 Source of Data 5 Appendix A 10 Recent Changes Introduction The Morningstar Style
Czech Economic Outlook and Consistency of FX Interventions with Inflation Targeting
 1th INTERNATIONAL CONFERENCE ON FINANCE AND BANKING Czech Economic Outlook and Consistency of FX Interventions with Inflation Targeting Lubomír Lízal, PhD. Hotel Mercure, Ostrava, October 1, 1 CNB Central
Post - Graduate Diploma in Security Analysis & Trading (2 nd Semester Examination)
") Post - Graduate Diploma in Security Analysis & Trading (2 nd Semester Examination) Paper 206 FIMMDA Debt Market (Basic) Maximum Marks: 100 Time Allowed: 3 hours Roll No. Name. INSTRUCTIONS: 1. This Question
Post - Graduate Diploma in Security Analysis & Trading (2 nd Semester Examination) Paper 206 FIMMDA Debt Market (Basic) Maximum Marks: 100 Time Allowed: 3 hours Roll No. Name. INSTRUCTIONS: 1. This Question
Predicting Market Fluctuations via Machine Learning
 Predicting Market Fluctuations via Machine Learning Michael Lim,Yong Su December 9, 2010 Abstract Much work has been done in stock market prediction. In this project we predict a 1% swing (either direction)
ESTIMATION OF A BENCHMARK CERTIFICATE OF DEPOSIT (CD) CURVE
 CURVE") 1.1. Introduction: Certificate of Deposits are issued by Banks for raising short term finance from the market. As the banks have generally higher ratings (specifically short term rating because of availability
1.1. Introduction: Certificate of Deposits are issued by Banks for raising short term finance from the market. As the banks have generally higher ratings (specifically short term rating because of availability
The Normal Distribution
 5.1 Introduction to Normal Distributions and the Standard Normal Distribution Section Learning objectives: 1. How to interpret graphs of normal probability distributions 2. How to find areas under the
The Interest Rate Sensitivity of Tax-Exempt Bonds under Tax-Neutral Valuation
 The Interest Rate Sensitivity of Tax-Exempt Bonds under Tax-Neutral Valuation Boston, Mass. August 1,2013 Andrew Kalotay Andrew Kalotay Associates, Inc. 1 Ultimate Goal: Optimize Tax-Loss Harvesting Taxes
Discount Rates in Financial Reporting: A Practical Guide
 Discount Rates in Financial Reporting: A Practical Guide Extrapolation of yield curve, credit and liquidity risk, inflation Jeremy Kent 27 October 2014 Zurich Extrapolation of yield curve Sometimes need
Model Construction & Forecast Based Portfolio Allocation:
 QBUS6830 Financial Time Series and Forecasting Model Construction & Forecast Based Portfolio Allocation: Is Quantitative Method Worth It? Members: Bowei Li (303083) Wenjian Xu (308077237) Xiaoyun Lu (3295347)
CS 237: Probability in Computing
 CS 237: Probability in Computing Wayne Snyder Computer Science Department Boston University Lecture 12: Continuous Distributions Uniform Distribution Normal Distribution (motivation) Discrete vs Continuous
Week 1 Variables: Exploration, Familiarisation and Description. Descriptive Statistics.
 Week 1 Variables: Exploration, Familiarisation and Description. Descriptive Statistics. Convergent validity: the degree to which results/evidence from different tests/sources, converge on the same conclusion.
Komerční banka, a.s.
 Komerční banka, a.s. UNCONSOLIDATED FINANCIAL STATEMENTS PREPARED IN ACCORDANCE WITH INTERNATIONAL FINANCIAL REPORTING STANDARDS AND INDEPENDENT AUDITOR S REPORT FOR THE YEAR ENDED 31 DECEMBER 2009 Table
Designing retirement products: One size does not fit all!
 Any customer can have a car painted any color he wants so long as it is black Henry Ford, in his 1923 autobiography In our experience, the Australian funds management industry has largely adopted the Henry
Meeting with Analysts
 CNB s New Forecast (Inflation Report III/3) Meeting with Analysts Tibor Hlédik Prague, 9 August, 3 Summary of the Inflation Forecast (i) The recovery of GDP in the effective euro area is postponed again
T R A D E FX BASIC. 1. What is Forex? 2. 8 Majors. 3. What is bought and sold? 4. Types of Charts. 5. Basic Terms EBOOK 01.
 T R A D E 1. What is Forex? 2. 8 Majors 3. What is bought and sold? 4. Types of Charts 5. Basic Terms FX BASIC EBOOK 01 FX BASICS 02 What do you know about Forex? The terminology FOREX stands for the Foreign
Chapter 1 Microeconomics of Consumer Theory
 Chapter Microeconomics of Consumer Theory The two broad categories of decision-makers in an economy are consumers and firms. Each individual in each of these groups makes its decisions in order to achieve
Data Analysis and Statistical Methods Statistics 651
 Data Analysis and Statistical Methods Statistics 651 http://www.stat.tamu.edu/~suhasini/teaching.html Lecture 10 (MWF) Checking for normality of the data using the QQplot Suhasini Subba Rao Checking for
arxiv: v1 [q-fin.rm] 14 Mar 2012
![arxiv: v1 [q-fin.rm] 14 Mar 2012](/thumbs/78/78372791.jpg "arxiv: v1 [q-fin.rm] 14 Mar 2012") Empirical Evidence for the Structural Recovery Model Alexander Becker Faculty of Physics, University of Duisburg-Essen, Lotharstrasse 1, 47048 Duisburg, Germany; email: alex.becker@uni-duisburg-essen.de
Empirical Evidence for the Structural Recovery Model Alexander Becker Faculty of Physics, University of Duisburg-Essen, Lotharstrasse 1, 47048 Duisburg, Germany; email: alex.becker@uni-duisburg-essen.de
Honors Statistics. Daily Agenda
 Honors Statistics Aug 23-8:26 PM Daily Agenda Aug 23-8:31 PM 1 Write a program to generate random numbers. I've decided to give them free will. A Skip 4, 12, 16 Apr 25-10:55 AM Toss 4 times Suppose you
Volatility of Asset Returns
 Volatility of Asset Returns We can almost directly observe the return (simple or log) of an asset over any given period. All that it requires is the observed price at the beginning of the period and the
1. Why is it important for corporate managers to understand how bonds and shares are priced?
 CHAPTER 4 CONCEPT REVIEW QUESTIONS 1. Why is it important for corporate managers to understand how bonds and shares are priced? Managers need to know this because (1) firms regularly issue stocks and bonds
GUIDANCE FOR CALCULATION OF LOSSES DUE TO APPLICATION OF MARKET RISK PARAMETERS AND SOVEREIGN HAIRCUTS
 Annex 4 18 March 2011 GUIDANCE FOR CALCULATION OF LOSSES DUE TO APPLICATION OF MARKET RISK PARAMETERS AND SOVEREIGN HAIRCUTS This annex introduces the reference risk parameters for the market risk component
Some Characteristics of Data
 Some Characteristics of Data Not all data is the same, and depending on some characteristics of a particular dataset, there are some limitations as to what can and cannot be done with that data. Some key
Data Analysis and Statistical Methods Statistics 651
 Data Analysis and Statistical Methods Statistics 651 http://www.stat.tamu.edu/~suhasini/teaching.html Suhasini Subba Rao The binomial: mean and variance Recall that the number of successes out of n, denoted
Quoting Credit Spread Prices for Ringgit Corporate Bonds (PDS) In Addition to Absolute Yields
 In Addition to Absolute Yields") Quoting Credit Spread Prices for Ringgit Corporate Bonds (PDS) In Addition to Absolute Yields Briefing Organised by Bank Negara Malaysia and The Financial Markets Association of Malaysia (PPKM) Lee K.
Quoting Credit Spread Prices for Ringgit Corporate Bonds (PDS) In Addition to Absolute Yields Briefing Organised by Bank Negara Malaysia and The Financial Markets Association of Malaysia (PPKM) Lee K.
Measuring and managing market risk June 2003
 Page 1 of 8 Measuring and managing market risk June 2003 Investment management is largely concerned with risk management. In the management of the Petroleum Fund, considerable emphasis is therefore placed
EXAMINATION II: Fixed Income Valuation and Analysis. Derivatives Valuation and Analysis. Portfolio Management
 EXAMINATION II: Fixed Income Valuation and Analysis Derivatives Valuation and Analysis Portfolio Management Questions Final Examination March 2011 Question 1: Fixed Income Valuation and Analysis (43 points)
DRAM Weekly Price History
 1 9 17 25 33 41 49 57 65 73 81 89 97 105 113 121 129 137 145 153 161 169 177 185 193 201 209 217 225 233 www.provisdom.com Last update: 4/3/09 DRAM Supply Chain Test Case Story A Vice President (the VP)
Understanding the complex dynamics of financial markets through microsimulation Qiu, G.
 UvA-DARE (Digital Academic Repository) Understanding the complex dynamics of financial markets through microsimulation Qiu, G. Link to publication Citation for published version (APA): Qiu, G. (211). Understanding
Weekly 2018 Week 29 WEEK AHEAD. Market Research Czech Republic & Eurozone. July
 Weekly 218 Week 29 MARTIN LOBOTKA, (+42) 777 27 165, MLobotka@42fs.com, Research@42fs.com CALENDAR DAY DATE TIME (CET)* MARKET RELEASE CONSENSUS** 42FS Monday 23-Jul 16: EMU Tuesday 24-Jul 9: CZ 24-Jul
Muni Fortnightly. Treasury curve bear-flattens on tax policy advancement and Flynn plea. Munis generally underperform.
 WEALTH SOLUTIONS GROUP Muni Fortnightly Treasury curve bear-flattens on tax policy advancement and Flynn plea. Munis generally underperform. David N Violette, CFA Senior Fixed Income Analyst December 4,
Spline Methods for Extracting Interest Rate Curves from Coupon Bond Prices
 Spline Methods for Extracting Interest Rate Curves from Coupon Bond Prices Daniel F. Waggoner Federal Reserve Bank of Atlanta Working Paper 97-0 November 997 Abstract: Cubic splines have long been used
Weekly 2018 Week 39 WEEK AHEAD. Market Research Czech Republic & Eurozone. October
 Weekly 2018 Week 39 MARTIN LOBOTKA, (+420) 777 027 165, MLobotka@42fs.com, Research@42fs.com CALENDAR WEEK AHEAD DAY DATE TIME (CET)* MARKET RELEASE CONSENSUS** 42FS Monday 1-Oct-18 8:00 GER Retail sales,
Weekly 2018 Week 52 WEEK AHEAD. Market Research Czech Republic & Eurozone. December
 Weekly 2018 Week 52 MARTIN LOBOTKA, (+420) 777 027 165, MLobotka@42fs.com, Research@42fs.com CALENDAR DAY DATE TIME (CET)* MARKET RELEASE CONSENSUS** 42FS Wednesday 2-Jan-19 9:30 CZ (Final) Manufacturing
ANALYSIS OF THE DISTRIBUTION OF INCOME IN RECENT YEARS IN THE CZECH REPUBLIC BY REGION
 International Days of Statistics and Economics, Prague, September -3, 11 ANALYSIS OF THE DISTRIBUTION OF INCOME IN RECENT YEARS IN THE CZECH REPUBLIC BY REGION Jana Langhamrová Diana Bílková Abstract This
Weekly 2018 Week 30 WEEK AHEAD. Market Research Czech Republic & Eurozone. July
 Weekly 218 Week 3 MARTIN LOBOTKA, (+42) 777 27 165, MLobotka@42fs.com, Research@42fs.com CALENDAR WEEK AHEAD DAY DATE TIME (CET)* MARKET RELEASE CONSENSUS** 42FS Monday 3-Jul 1: SPA (Flash) HICP, Jul'18
Muni Fortnightly. December 18, 2017
 WEALTH SOLUTIONS GROUP Muni Fortnightly Treasury curve flattens after weaker than expected CPI and FOMC hike with intentions of three more in 2018. Muni AAA GO Ratio completes round-trip. David N Violette,
ISHARES GLOBAL 100 ETF (IOO)
") ISHARES GLOBAL 100 ETF (IOO) $46.23 USD Risk: Low Zacks ETF Rank 3 - Hold Fund Type Issuer Benchmark Index World ETFs BLACKROCK S&P GLOBAL 100 INDEX IOO Sector Weights Date of Inception 12/05/2000 AUM
ISHARES GLOBAL 100 ETF (IOO) $46.23 USD Risk: Low Zacks ETF Rank 3 - Hold Fund Type Issuer Benchmark Index World ETFs BLACKROCK S&P GLOBAL 100 INDEX IOO Sector Weights Date of Inception 12/05/2000 AUM
BALANCE OF PAYMENTS JENÍČEK V., KREPL V. Abstract
 BALANCE OF PAYMENTS JENÍČEK V., KREPL V. Abstract Balance of payments is a systematic statistical recording of economic transactions realised between the home economy and the rest of the world during the
Some Historical Examples of Yield Curves
 3 months 6 months 1 year 2 years 5 years 10 years 30 years Some Historical Examples of Yield Curves Nominal interest rate, % 16 14 12 10 8 6 4 2 January 1981 June1999 December2009 0 Time to maturity This
User-tailored fuzzy relations between intervals
 User-tailored fuzzy relations between intervals Dorota Kuchta Institute of Industrial Engineering and Management Wroclaw University of Technology ul. Smoluchowskiego 5 e-mail: Dorota.Kuchta@pwr.wroc.pl
7. Bonds and Interest rates
 1 7. Bonds and Interest rates Fixed income may seem boring, but it s not. It s a huge and very dynamic market. Much larger than equities. Bond traders can take on similar levels of risk and earn similar
Risk-Adjusted Futures and Intermeeting Moves
 issn 1936-5330 Risk-Adjusted Futures and Intermeeting Moves Brent Bundick Federal Reserve Bank of Kansas City First Version: October 2007 This Version: June 2008 RWP 07-08 Abstract Piazzesi and Swanson
b) Selection of Bonds for curve construction: From the Universe of all outstanding bonds :
 Selection of Bonds for curve construction: From the Universe of all outstanding bonds :") THE CUBIC SPLINE METHODOLOGY CUBIC SPLINE METHODOLOGY FOR VAUATION OF G-SECS A model for yield curve takes traded yields for available tenors as input and generates the curve through interpolation and
THE CUBIC SPLINE METHODOLOGY CUBIC SPLINE METHODOLOGY FOR VAUATION OF G-SECS A model for yield curve takes traded yields for available tenors as input and generates the curve through interpolation and
Lecture Slides. Elementary Statistics Tenth Edition. by Mario F. Triola. and the Triola Statistics Series. Slide 1
 Lecture Slides Elementary Statistics Tenth Edition and the Triola Statistics Series by Mario F. Triola Slide 1 Chapter 6 Normal Probability Distributions 6-1 Overview 6-2 The Standard Normal Distribution
Section 7.5 The Normal Distribution. Section 7.6 Application of the Normal Distribution
 Section 7.6 Application of the Normal Distribution A random variable that may take on infinitely many values is called a continuous random variable. A continuous probability distribution is defined by
Lecture Quantitative Finance Spring Term 2015
 implied Lecture Quantitative Finance Spring Term 2015 : May 7, 2015 1 / 28 implied 1 implied 2 / 28 Motivation and setup implied the goal of this chapter is to treat the implied which requires an algorithm