THE ACTIVE SHARE DEBATE WEBINAR. Presented by John Alexander, CFA Billy Welsh
|
|
|
- Spencer Warner
- 5 years ago
- Views:
Transcription
1 THE ACTIVE SHARE DEBATE WEBINAR Presented by John Alexander, CFA Billy Welsh
2 Today s Speakers John Alexander, CFA Solutions Specialist evestment Billy Welsh Client Strategist evestment jalexander@evestment.com bwelsh@evestment.com
3 Agenda for Today s Call About evestment Introduction to Active Share History Philosophy behind the measure Two Consultant Perspectives on Active Share Billy Welsh: Active Share is not the best metric John Alexander: High Active Share should be emphasized in manager selection Wrapping Up the Debate: Productively Applying Active Share Data for Further Analysis & Discussion Q & A *NOTE: We are not seeking to prove/disprove the predictive value of Active Share when seeking future outperformance
4 ABOUT EVESTMENT
5 About evestment Solutions for the investment managers, investors and consultants Greatest depth and breath of data across both traditional and alternative asset classes Full suite of cloud based analytical software solutions to help you make more informed decisions Global client-base of over 2,500 asset managers, consultants and investors
6 ACTIVE SHARE

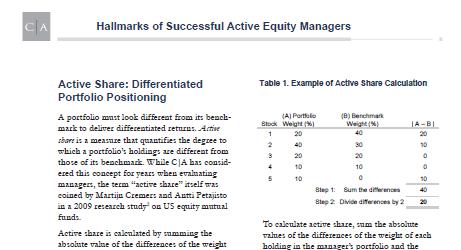
7 Active Share: The Basics Active Share measures the percentage of equity holdings in a portfolio that differ from the index constituents. It is calculated by summing the absolute difference in weight of each holding in the portfolio versus the index and dividing by 2. Active Share = n i=1 w fund(i) w index(i) 2 For each decision to overweight a position in a portfolio, there must be corresponding underweight in another benchmark name. Active Share: measures deviation away from a specific benchmark on a scale of Overlap: measures participation in benchmark names Overlap = Active Share
8 Active Share: Example Low Active Share High Active Share Stock A Stock B Stock C Stock D Stock E Stock F Stock G Stock H Stock I Stock J Stock K Stock L Stock M Stock N Stock O Stock P Stock Q Stock R Stock S Stock T non-benchmark Cash Stock A Stock B Stock C Stock D Stock E Stock F Stock G Stock H Stock I Stock J Portfolio Stock K Stock L Benchmark Stock M Stock N Stock O Stock P Stock Q Stock R Stock S Stock T non-benchmark Cash

9 Background Collateral
10 Market Reaction To Active Share Offensive Position Many investment consulting firms published research favoring higher active share Passive investing grants access to benchmark returns cheaply, so consultants favor more active managers over managers who look like the benchmark Many clients are modifying IPS guidelines toward unconstrained/flexible strategies High active share managers also tended to agree with this research Defensive Position Passive managers and firms with lower active share criticized the measure and published reports contradicting the findings mentioned above Many quantitative firms by nature have lower active share due to stricter portfolio construction around the index A lower active share can help maintain lower tracking error Lower tracking error is one quality their current clients expect of them Better measures of portfolio construction exist 10
11 Background Collateral
12 Two Camps on Active Share: A Divisive Topic Billy Welsh High active share is not necessarily the answer Higher active share a greater chance performance will differ from the index (positive or negative) Active share is extremely benchmark dependent Better measures are out there to get a more complete picture John Alexander Investors should seek managers with high active share If you want lower tracking error, buy an index (cheaply) AUM growth and high excess returns may incentivize mangers to take less active risk versus the benchmark High active share managers have more opportunity to outperform. 12
13 ACTIVE SHARE AND ITS LIMITATIONS From a Consultant s Perspective Billy Welsh
14 Active Share Active Share High Active Share is Not Necessarily the Answer High active share may be import for some investors objectives, but not all Using it as an exclusionary criteria will limit opportunity set of managers who have proven themselves despite having lower active share Looking at US Large Cap Core and Small Cap Core managers suggests as you increase Active Share, your value add (excess return) is not tied to the subsequent increase, but your tracking error is US Large Cap Core US Small Cap Core < Tracking Error & Excess Return < Tracking Error & Excess Return Avg 3 Yr Excess Return Avg 3 Yr Tracking Error Avg 3 Yr Excess Return Avg 3 Yr Tracking Error 3 Year figures over past 12 quarters, ending March 31,

15 Universe Selection Plays a Big Role What is considered high versus low active share? Does it make sense to have the same cut-off points regardless of the universe? Active share above 90 is high Active share below 60 is low Universes have significantly different active share distributions 68% of US Small Cap Core managers have an Active Share above 90 6% of US Large Cap Core managers have an Active Share above 90 15
16 Active Share Active Share Active Share Active Share Active Share Distribution of Various Universes <50 Large Cap Core Equity 0% 10% 20% 30% 40% Percentage of Managers within Universe Large Cap Core Managers Global Large Cap Core Equity <50 Small Cap Core Equity 0% 10% 20% 30% 40% Percentage of Managers within Universe Small Cap Core Managers Emerging Markets Equity <50 0% 10% 20% 30% 40% Percentage of Managers within Universe Global Large Cap Core Managers <50 Average active share over past two years, ended March 31, % 10% 20% 30% 40% Percentage of Managers within Universe Emerging Markets Equity Managers 16
17 Active Share Noise As it is not held in the index, cash can have a notable impact on a manager s Active Share rank within a universe. Looking at the managers with an Active Share of within US Small Cap Core That group of managers held an average weight of 3% in cash The managers holdings in cash helped contribute to approximately 71% of them being in that group Off benchmark holdings Looking outside of the index can be a source of value add When is it considered cheating when compared to the true opportunity set? Comparing oneself against the MSCI EAFE, when the product contains 20-30% in emerging markets (not held in the EAFE), would increase the active share by 10-15% Using an appropriate benchmark The following slide shows the effect of changing the benchmark 17
18 Active Share Active Share Benchmark Selection Can Change Things The following two charts show the Active Share distributions moving from a managers stated core benchmark to a style specific growth oriented benchmark. Changing from MSCI World to World Growth <50 0% 10% 20% 30% 40% 50% Percentage of Managers within Active Share Group <50 Changing from MSCI ACWI to ACWI Growth 0% 10% 20% 30% 40% 50% Percentage of Managers within Active Share Group vs MSCI World vs MSCI World Growth vs MSCI ACWI vs MSCI ACWI Growth Each manager represented belongs to the evestment Global Growth Equity Universe 18
19 Appropriate Benchmark? A product with 100% active share means that not one of the portfolio s holdings is in the benchmark, begging the question, is the benchmark valid, is it still an accurate measure to compare against? You can still be different than the benchmark while still holding some or many of the same names. 19
20 Stock 1 Stock 11 Stock 21 Stock 31 Stock 41 Stock 51 Stock 61 Stock 71 Stock 81 Stock 91 Stock 101 Stock 111 Stock 121 Stock 131 Stock 141 Stock 151 Stock 161 Stock 171 Stock 181 Stock 191 Stock 201 Stock 211 Stock 221 Stock 231 Stock 241 Stock 251 Stock 261 Stock 271 Stock 281 Stock 291 Stock 301 Stock 311 Stock 321 Stock 331 Stock 341 Stock 351 Stock 361 Stock 371 Stock 381 Stock 391 Stock 401 Stock 411 Stock 421 Stock 431 Stock 441 Stock 451 Stock 461 Stock 471 Stock 481 Stock 491 Holding Weight Examples of Low Active Share Adding Value The chart below shows an equal weighted S&P 500 product compared to the S&P 500 (ETF for Holdings and Actual benchmark for performance) Notice in this example the active bets are at the extremes (underweight larger names, overweight smaller ones). Active share is considered low at 44%, yet these are two very different portfolios 3.00 Holdings Comparison of Cap Weighted vs Equal Weighted Holding S&P 500 S&P 500 (Equal Weight) 20
21 Examples of Low Active Share Adding Value Despite a low active share, the Equal Weighted S&P 500 provided many periods of a differentiated performance figure. 21
22 Examples of Low Active Share Adding Value Average Three-Year Tracking Error was 4.6 over the entire time period in this chart, but 3.0 over the last 12 quarters, which is comparable to those in this Active Share Category for Large Cap Core Average TE = 4.6 Average TE =
23 Better Measures It is better to focus more on: Positions (where a manager is different) and concentration in top holdings Cash position Current number of holdings Effective number of holdings (number of holdings that actually drives absolute performance) Tracking error Information ratio
24 Stock 1 Stock 12 Stock 23 Stock 34 Stock 45 Stock 56 Stock 67 Stock 78 Stock 89 Stock 100 Stock 111 Stock 122 Stock 133 Stock 144 Stock 155 Stock 166 Stock 177 Stock 188 Stock 199 Stock 210 Stock 221 Stock 232 Stock 243 Stock 254 Stock 265 Stock 276 Stock 287 Stock 298 Stock 309 Stock 320 Stock 331 Stock 342 Stock 353 Stock 364 Stock 375 Stock 386 Stock 397 Stock 408 Stock 419 Stock 430 Stock 441 Stock 452 Stock 463 Stock 474 Stock 485 Stock 496 Holding Weight Stock 1 Stock 12 Stock 23 Stock 34 Stock 45 Stock 56 Stock 67 Stock 78 Stock 89 Stock 100 Stock 111 Stock 122 Stock 133 Stock 144 Stock 155 Stock 166 Stock 177 Stock 188 Stock 199 Stock 210 Stock 221 Stock 232 Stock 243 Stock 254 Stock 265 Stock 276 Stock 287 Stock 298 Stock 309 Stock 320 Stock 331 Stock 342 Stock 353 Stock 364 Stock 375 Stock 386 Stock 397 Stock 408 Stock 419 Stock 430 Stock 441 Stock 452 Stock 463 Stock 474 Stock 485 Stock 496 Holding Weight Same Active Share, Very Different Portfolio Holdings Comparison of Cap Weighted vs S&p 500 Top 20 Replication S&P 500 Holding S&P Top 20 Replication Holdings Comparison of Cap Weighted vs Equal Weighted S&P 500 Holding S&P 500 (Equal Weight)
25 USING ACTIVE SHARE IN MANAGER SELECTION From a Consultant s Perspective John Alexander, CFA
26 The Fundamental Argument for High Active Share Active Risks -Higher Fees - Risk of Underperformance - Added responsibility of manager selection Passive Risks -No chance to outperform -Full downside volatility -Less perceived consultant value-add WORST CASE SCENARIO: Hiring an active manager and paying the requisite fees, only to find out later that they are a closet indexer with little to no chance of outperformance (net of fees)

27 Consultants May Have Reason for Concern Graphic from Lazard s Taking a Closer Look at Active Share, 2013 The rise in index prevalence has resulted in active managers who look more similar to their respective benchmarks than in years past.
28 Barbell Strategy Passive Core/Active Satellite Rather than getting caught in the middle, consultants have a tendency to barbell the risk of active management towards both ends of the spectrum.


29 Passive Core/Active Satellite Active #1 Consultants anchor many large mandates with passive strategies without abandoning active management altogether. Active # 2 Passive Active #3 Consultants need to evaluate how their active managers behave in different market environments and how they behave together. Managers need to highlight their differentiating factors and talk about how their strategy is positioned to perform going forward.

30 Consultants and Investors Reshaping IPS Guidelines Traditional Investment Policy Statement (IPS) Language New Portfolio Tactics at all times manager shall abide by constraints put forth in the Investment Policy Statement at no point shall greater than 5% of the assets be invested in the assets/liabilities of any single issuer the stated mandate of Large Cap Value manager XYZ shall be to outperform the Russell 1000 Value Index over a market cycle (3 to 5 years)


31 Monitoring Active Share Over Time Behavioral Finance 101: Loss Aversion Human beings strongly prefer avoiding a loss to experiencing an equal gain Portfolio Managers are human, too. Consultants should monitor Active Share over time to evaluate how managers alter portfolio construction through different performance periods and asset flows.
32 Case Study: Active Share at Work evest Capital: Top performer in All Cap Equity in 2009, 2010 & Since then, assets have grown tremendously. Active share is currently Longer term track record is still very strong. What does the Active Share say about this manager? Next we ll see how to use Active Share data to evaluate this manager further.
33 What Does the Data Say? Active Share over time evest Capital evest Capital has significantly decreased its Active Share since its strong performance run in 2009, 2010 and Its Active Share now ranks in the bottom decile among peer managers in its universe. Consultants should be especially cautious when they observe a trend like we see above. Whether evest Capital is consciously deciding to look more like the index or not, the data points to a major shift in portfolio construction.
34 PRODUCTIVELY APPLYING ACTIVE SHARE DATA
35 Portfolio Structuring and Combining Multiple High Active Share Managers The Active Share of the entire portfolio should be considered when looking for a new manager and or structuring a portfolio. High Active share managers (vs. their style specific benchmark), when combined, can result in a lower active share portfolio versus the style neutral benchmark. The following is an Active Share analysis of Four Active Managers. Each has high Active Share vs. their respective Benchmark and vs. each other (overlap = Active Share) When combined in equal weight and compared to the Russell 1000 the Active Share is Manager 1 (Large Value) Manager 2 (Large Value) Manager 3 (Large Growth) Manager 4 (Large Growth) vs R1000 Value vs R1000 Growth Portfolio Weight Active Share vs R1000 Manager 1 (Large Value) Manager 2 (Large Value) Manager 3 (Large Growth) Manager 4 (Large Growth) % % % % Total Portfolio 100%
36 Active Share Active Share Portfolio Structuring and Combining Multiple High Active Share Managers The Active Share of the entire portfolio should be considered when looking for a new manager and or structuring a portfolio. High Active share managers (vs. their style specific benchmark), when combined, can result in a lower active share portfolio versus the style neutral benchmark. Large Cap Value Equity Large Cap Growth Equity < <50 0% 5% 10% 15% 20% 20% 15% 10% 5% 0% Percentage of Managers within Universe Percentage of Managers within Universe Large Cap Value Managers Large Cap Growth Managers Two managers from each of the 95-90% Active Share buckets 36
37 Active Share Portfolio Structuring and Combining Multiple High Active Share Managers The Active Share of the entire portfolio should be considered when looking for a new manager and or structuring a portfolio. High Active share managers (vs. their style specific benchmark), when combined, can result in a lower active share portfolio versus the style neutral benchmark. Large Cap Core Equity <50 The resulting portfolio of combined Large Growth and Large Value mangers results in a total portfolio with an Active Share of 76% when compared to the Russell 1000, which is less than 42% of his peers. 0% 5% 10% 15% 20% Percentage of Managers within Universe Large Cap Core Managers 37
38 Blending Active Share and Excess Returns One way to analyze active share data is in the context of excess returns. Looking at average active share and average excess returns informs us of how efficient a managers has been with bets vs. the benchmark. Active Efficiency = n i=1 R e /AS n How this data can be applied: Consultants should prefer managers who generate the highest excess returns per deviation from the benchmark Managers (especially those with lower active share) should embrace this as a way to demonstrate their skill
39 Active Share Efficiency Active Share Efficiency Active Share Efficiency Distribution Analysis An Equal Weighted S&P 500 portfolio had an Active Efficiency of 7.1 Large Cap Core Equity Small Cap Core Equity > 5 4 : 5 3 : 4 2 : 3 1 : 2 0 : 1-1 : 0-2 : -1-3 : -2-4 : -3-5 : -4 < -5 > 5 4 : 5 3 : 4 2 : 3 1 : 2 0 : 1-1 : 0-2 : -1-3 : -2-4 : -3-5 : -4 < -5 0% 5% 10% 15% 20% Percentage of Managers within Universe Large Cap Core Managers 0% 5% 10% 15% 20% Percentage of Managers within Universe Small Cap Core Managers Average 3 Year excess return and average active share over past 12 quarters, ending March 31, 2014


40 Using Peers as the Benchmark In the event that more managers adopt an non benchmark-oriented style, measuring results becomes difficult. evestment has developed Peer Indices, Peer Attribution, and Peer Share as a potential solution for this issue. evestment Peer Index: an index constituted of securities that represent the average weights of active managers in a space Peer Attribution: running a holdings-based Style/Sector/Region attribution analysis versus an evestment Peer Index Peer Share: Applying active share calculation to the Peer Index, thus measuring how unique a manager is vs. peer group
41 Q & A
42 Questions and Answer Session Please enter your questions into the panel on your screen Thank you for attending this webinar If you are interested in learning more about how evestment s solutions can help you make more intelligent decisions, us at info@evestment.com
University of Maine System Investment Policy Statement Defined Contribution Retirement Plans
 University of Maine System Investment Policy Statement Defined Contribution Retirement Plans As Updated at the December 8, 2016, Investment Committee Meeting Page 1 of 19 Table of Contents Section Statement
Active Share Efficiency: A Measure Beyond Active Share
 Active Share Efficiency: A Measure Beyond Active Share Introduction Active Share measures the proportion of holdings in an equity portfolio that differ from the strategy s benchmark. When initially researched,
Active Share. Active Share is best used as a supplementary measure in conjunction with tracking error.
 Insights march 2015 Active Share Nuvan P. Athukorala Director, Global Portfolio Management Michael A. Welhoelter, CFA Managing Director, Portfolio Manager & Head of Quantitative Research & Risk Management
CONSULTANT BRIEFING. New York City April 20, Chris Riley, Aon Hewitt John Molesphini, evestment Jerrod Stoller, evestment
 CONSULTANT BRIEFING New York City April 20, 2017 Chris Riley, Aon Hewitt John Molesphini, evestment Jerrod Stoller, evestment Fee Pressure Low Yield 2016 BREXIT Market Volatility Active vs. Passive Presidential
Taking a Closer Look at Active Share
 Investment Research Taking a Closer Look at Active Share Erianna Khusainova, CFA, Senior Vice President Juan Mier, Associate The debate concerning the success of active management can be traced back several
Active management can add big value in small-cap equities
 Principal Global Equities Active management can add big value in small-cap equities Brian Pattinson, CFA - Portfolio Manager Key points: Inefficiencies create opportunity Our approach to active investing
Global Investing DIVERSIFYING INTERNATIONAL EQUITY ALLOCATIONS WITH SMALL-CAP STOCKS
 PRICE PERSPECTIVE June 2016 In-depth analysis and insights to inform your decision-making. Global Investing DIVERSIFYING INTERNATIONAL EQUITY ALLOCATIONS WITH SMALL-CAP STOCKS EXECUTIVE SUMMARY International
High-conviction strategies: Investing like you mean it
 BMO Global Asset Management APRIL 2018 Asset Manager Insights High-conviction strategies: Investing like you mean it While the active/passive debate carries on across the asset management industry, it
THE DATA BEHIND THE BUZZWORDS FOR ASSET MANAGERS
 THE DATA BEHIND THE BUZZWORDS FOR ASSET MANAGERS February 11, 2015 John Molesphini John Alexander, CFA Today s Presentation Agenda Sales and marketing challenges Pitfalls of complex terminology Dive into
Lazard Insights. Interpreting Active Share. Summary. Erianna Khusainova, CFA, Senior Vice President, Portfolio Analyst
 Lazard Insights Interpreting Share Erianna Khusainova, CFA, Senior Vice President, Portfolio Analyst Summary While the value of active management has been called into question, the aggregate performance
April The Value of Active Management.
 April 2010 t h e F O C U S A B r a n d e s P u b l i c a t i o n The Value of Active Management www.brandes.com In the aftermath of the credit crisis and extreme price volatility, some investors have questioned
The hedge fund sector has grown at a rapid pace over the last several years. There are a record number of hedge funds,
 The hedge fund sector has grown at a rapid pace over the last several years. There are a record number of hedge funds, and hedge fund of funds in the marketplace. While investors have considerably more
Model portfolio services
 For investment professionals only Model portfolio services Summary Up to seven risk mandates to meet a variety of client objectives Choose from collectives, securities, passives or unit trusts (unitised
Enhancing equity portfolio diversification with fundamentally weighted strategies.
 Enhancing equity portfolio diversification with fundamentally weighted strategies. This is the second update to a paper originally published in October, 2014. In this second revision, we have included
An All-Cap Core Investment Approach
 An All-Cap Core Investment Approach A White Paper by Manning & Napier www.manning-napier.com Unless otherwise noted, all figures are based in USD. 1 What is an All-Cap Core Approach An All-Cap Core investment
Core Asset Manager: A Tailored Investment Strategy
 Core Asset Manager: A Tailored Investment Strategy CHRIS HART, Core Investment Manager Brinker Capital Inc., A Registered Investment Advisor For financial advisor use only. For financial professional use
Tower Square Investment Management LLC Strategic Aggressive
 Product Type: Multi-Product Portfolio Headquarters: El Segundo, CA Total Staff: 15 Geography Focus: Global Year Founded: 2012 Investment Professionals: 12 Type of Portfolio: Balanced Total AUM: $1,422
The Bull Market The Barron s 400. Francis Gupta, Ph.D., MarketGrader Research. September 2018
 The Bull Market The Barron s 400 Francis Gupta, Ph.D., MarketGrader Research. September 2018 The Barron s 400 Bull Market Performance in the Crosshairs Stock market watchers fall into two camps when discussing
In this world nothing can be said to be certain, except death and taxes. 1 Benjamin Franklin
 December 2017 Death, Taxes and Short-Term Underperformance: International Funds In this world nothing can be said to be certain, except death and taxes. 1 Benjamin Franklin Since the Brandes Institute
MPI Quantitative Analysis
 MPI Quantitative Analysis a Mario H. Aguilar Director, Client Services, EMEA February 2011 Markov Processes International Tel +1 908 608 1558 www.markovprocesses.com ASSET CLASS ANALYSIS NORTH AMERICA
Introducing BlackRock's Target Allocation ETF Models
 Introducing BlackRock's Target Allocation ETF Models Eve Cout Director, Managed Accounts Business Thomas Wood, CFA Lead Strategist, US Model Portfolios Tuesday January 23 rd, 2018 BENEFIT # 1 Scale and
April The Value Reversion
 April 2016 The Value Reversion In the past two years, value stocks, along with cyclicals and higher-volatility equities, have underperformed broader markets while higher-momentum stocks have outperformed.
INSTITUTIONAL INVESTMENT & FIDUCIARY SERVICES: Investment Basics: Is Active Management Still Worth the Fees? By Joseph N. Stevens, CFA INTRODUCTION
 INSTITUTIONAL INVESTMENT & FIDUCIARY SERVICES: Investment Basics: Is Active Management Still Worth the Fees? By Joseph N. Stevens, CFA INTRODUCTION As of December 31, 2014, more than 30% of all US Dollar-based
Building Portfolios with Active, Strategic Beta and Passive Strategies
 Building Portfolios with Active, Strategic Beta and Passive Strategies It s a Question of Beliefs Issues to think about on the Active/Passive spectrum: How important are fees to you? Do you believe markets
Voya Large Cap Growth Strategy
 Separately Managed Account I For Quarter Ending June 3, 18 I Strategy Brief I 2Q 18 Voya Large Cap Growth Strategy Strategy-At-A-Glance Objective 1 Inception Date Benchmark Vehicles To outperform the Russell
2018 PUBLIC EQUITY ASSET CLASS REVIEW CITY OF FRESNO RETIREMENT SYSTEMS
 Agenda Item: D-2 Joint Meeting of the Retirement Boards Meeting Date: June 27, 2018 2018 PUBLIC EQUITY ASSET CLASS REVIEW CITY OF FRESNO RETIREMENT SYSTEMS June 26, 2018 Tony Ferrara, CAIA, Consultant
Capital Idea: Expect More From the Core.
 SM Capital Idea: Expect More From the Core. Investments are not FDIC-insured, nor are they deposits of or guaranteed by a bank or any other entity, so they may lose value. Core equity strategies, such
Smart Beta Dashboard. Thoughts at a Glance. January By the SPDR Americas Research Team
 By the SPDR Americas Research Team Thoughts at a Glance 2017 marked another year of factor performance shifts. s comeback in the US on the heels of the US election and the potential for a Trump-flation
High conviction: Creating multi-asset portfolios designed to achieve investors objectives
 The Invesco White Paper Series High conviction: Creating multi-asset portfolios designed to achieve investors objectives Contributors: Duy Nguyen, CFA, CAIA Senior Portfolio Manager Chief Investment Officer
Focusing on investment outcomes:
 Invesco White Paper Series on the Active/Passive Debate This white paper was generated with the support of the Invesco Global Solutions Development and Implementation team. Focusing on investment outcomes:
Identifying a defensive strategy
 In our previous paper Defensive equity: A defensive strategy to Canadian equity investing, we discussed the merits of employing a defensive mandate within the Canadian equity portfolio for some institutional
UK Portfolio Barometer
 NATIXIS PORTFOLIO CLARITY SM Q4 2015 Natixis Global Asset Management s quarterly Portfolio Barometer offers insights into UK financial advisers model portfolios and the allocation decisions they are making.
Passive Investing: Theory vs. Practice. Oliver Murray Brandes Investment Partners & Co.
 Passive Investing: Theory vs. Practice Oliver Murray Brandes Investment Partners & Co. Backgrounder: Passive Investing Passive Investing in Practice Examples from U.S. Equity Markets 2 Sample US Equity
Factor Exposure: Smart Beta ETFs vs Mutual Funds
 Factor Exposure: Smart Beta ETFs vs Mutual Funds August 16, 2018 by Nicolas Rabener of FactorResearch SUMMARY Investors can express factor views via smart beta ETFs or mutual funds Some mutual funds offer
ASSET ALLOCATION: DECISIONS & STRATEGIES
 ASSET ALLOCATION: DECISIONS & STRATEGIES Keith Brown, Ph.D., CFA November 21st, 2007 The Asset Allocation Decision A basic decision that every investor must make is how to distribute his or her investable
Translating Factors to International Markets
 LEADERSHIP SERIES Translating Factors to International Markets Strategies that combine the potential diversification benefits of international exposure with the portfolio-enhancing benefits of factors
RESEARCH Stock Scoring System. An in-depth look at Burney's stock selection process
 RESEARCH Stock Scoring System An in-depth look at Burney's stock selection process Burney Scoring System An in-depth look at Score Burney s proprietary, quantitative stock selection model, called Score,
See Target Date Solutions FROM A WHOLE NEW PERSPECTIVE
 See Target Date Solutions FROM A WHOLE NEW PERSPECTIVE Let s face it: These days, the retirement landscape is getting increasingly more complex. Participants are living longer. New fiduciary realities
How Investment Managers Use Active Share to Win New Business, Retain Clients and Justify Fees
 How Investment Managers Use Active Share to Win New Business, Retain Clients and Justify Fees Including graphics that illustrate eight different ways active share can help managers make the case for their
ASSET MANAGEMENT MARKET COMMENTS EQUITIES & FIXED INCOME
 MARKET COMMENTS EQUITIES & FIXED INCOME FEBRUARY 28, 2011 Equities MARKET COMMENTS FEBRUARY 28, 2011 Reyl Emerging Markets Equities - 1,52 %, class USD - February - 2,81 %, class USD YTD ANALYSIS More
Death, Taxes and Short-Term Underperformance: Emerging Market Funds
 Death, Taxes and Short-Term Underperformance: Emerging Market Funds In this world nothing can be said to be certain, except death and taxes. 1 Benjamin Franklin March 2018 Since the Brandes Institute first
INTERNATIONAL EQUITIES: FLEXIBLE APPROACHES ALIGN WITH DC PLAN SIMPLIFICATION
 BENJAMIN SEGAL Portfolio Manager, Head of Global Equity Team BRIAN FALEIRO Product Specialist Global Equity Team KEITH SKINNER Product Specialist Global Equity Team MICHELLE RAPPA Head of Defined Contribution
How to evaluate factor-based investment strategies
 A feature article from our U.S. partners INSIGHTS SEPTEMBER 2018 How to evaluate factor-based investment strategies Due diligence on smart beta strategies should be anything but passive Original publication
Capital Idea: Expect More From the Core.
 SM Capital Idea: Expect More From the Core. Investments are not FDIC-insured, nor are they deposits of or guaranteed by a bank or any other entity, so they may lose value. Core equity strategies, such
Fund Information. Partnering for Success. SSgA Real-Life Insight
 SM SSgA Real-Life Insight Fund Information Partnering for Success For Plan Participant Use only. The information contained in this document is intended as investment education only. None of the information
EVESTMENT BREAKFAST SEMINAR
 EVESTMENT BREAKFAST SEMINAR Toronto March 21, 2017 Ryan Anderson, Pavilion John Molesphini, evestment Jerrod Stoller, evestment Gaining an Understanding of Your Competitive Landscape Case Study Effective
CEMP Volatility Weighted Indexes
 CEMP Volatility Weighted Indexes Fundamental Criteria with Volatility Weighting in Index Construction By: Stephen M. Hammers, CIMA Chief Investment Officer/Co-Founder An Efficient Solution to Broad Market
Beyond Traditional Infrastructure Investing: Listed Infrastructure Equities as an Income Solution
 October 2018 Beyond Traditional Infrastructure Investing: Listed Infrastructure Equities as an Income Solution James A. Lydotes, CFA, Brock A. Campbell, CFA & William J. Adams Standish, Mellon Capital
Active vs. Passive Money Management
 Active vs. Passive Money Management Exploring the costs and benefits of two alternative investment approaches By Baird s Advisory Services Research Synopsis Proponents of active and passive investment
Managing Portfolios in a Low- Return Environment
 Managing Portfolios in a Low- Return Environment April 2013 1 2 Litman Gregory Overview Established in 1987, we provide investment management services to high-networth individuals, families, nonprofits,
ETF s Top 5 portfolio strategy considerations
 ETF s Top 5 portfolio strategy considerations ETFs have grown substantially in size, range, complexity and popularity in recent years. This presentation and paper provide the key issues and portfolio strategy
Schafer Cullen Capital Management High Dividend Value
 Product Type: Separate Account Manager Headquarters: New York, NY Total Staff: 56 Geography Focus: Domestic Year Founded: 1983 Investment Professionals: 21 Type of Portfolio: Equity Total AUM: $17,896
Minimum Variance and Tracking Error: Combining Absolute and Relative Risk in a Single Strategy
 White Paper Minimum Variance and Tracking Error: Combining Absolute and Relative Risk in a Single Strategy Matthew Van Der Weide Minimum Variance and Tracking Error: Combining Absolute and Relative Risk
Active Management Unleashed: Addressing Mutual Fund Design Flaws and Reestablishing Value. GDC Research 2018
 Active Management Unleashed: Addressing Mutual Fund Design Flaws and Reestablishing Value GDC Research 2018 Active Managers have continued to lose ground to Passive solutions over the past decade in terms
Portfolio Transition Plan October 2015
 ab Portfolio Transition Plan October 2015 1 Summary of Recommendations Objective: Reduce portfolio fees by utilizing low-cost index investments while maintaining an emphasis on downside risk management.
Fall 2013 Volume 19 Number 3 The Voices of Influence iijournals.com
 Fall 2013 Volume 19 Number 3 www.iijsf.com The Voices of Influence iijournals.com How to Value CLO Managers: Tell Me Who Your Manager Is, I ll Tell You How Your CLO Will Do SERHAN SECMEN AND BATUR BICER
Fundamentally weighted index strategies: A primer on asset allocation in three core asset classes
 strategies: A primer on asset allocation in three core asset classes 1 2 3 Key takeaways strategies can serve as a complement to traditional cap-weighted index strategies. Combining fundamentally weighted
Building Efficient Hedge Fund Portfolios August 2017
 Building Efficient Hedge Fund Portfolios August 2017 Investors typically allocate assets to hedge funds to access return, risk and diversification characteristics they can t get from other investments.
With the Portfolio Manager. Gordon Johnson, Ph.D, CFA Co-Portfolio Manager. Shannon Ericson, CFA Co-Portfolio Manager
 Gordon Johnson, Ph.D, CFA Co-Portfolio Manager Shannon Ericson, CFA Co-Portfolio Manager for the LMCG International Small Cap Fund ISMIX, ISMRX Endeavour Investment Partners, LLC 781-749-6040 Partnering
EMPLOYES RETIREMENT SYSTEM OF THE CITY OF MILWAUKEE ANNUITY AND PENSION BOARD. Minutes of the Investment Committee Meeting held February 14, 2007
 EMPLOYES RETIREMENT SYSTEM OF THE CITY OF MILWAUKEE ANNUITY AND PENSION BOARD Minutes of the Investment Committee Meeting held February 14, 2007 The meeting was called to order at 9:10 a.m. Committee Members
Smart Beta Dashboard. Thoughts at a Glance. June By the SPDR Americas Research Team
 By the SPDR Americas Research Team Thoughts at a Glance Factor performance diverged across regions in Q2. In the US, all factors with the exception of underperformed broad US equities. As volatility in
Smart Beta Dashboard. Thoughts at a Glance. March By the SPDR Americas Research Team
 By the SPDR Americas Research Team Thoughts at a Glance For the first two months of Q1, US outperformed the broader market by nearly 5%. However, as 10-year Treasury yields and inflation expectations came
Active vs. Passive Money Management
 Active vs. Passive Money Management Exploring the costs and benefits of two alternative investment approaches By Baird s Advisory Services Research Synopsis Proponents of active and passive investment
Smart Beta 2.0: A Disruptive Innovation
 Smart Beta 2.0: A Disruptive Innovation October 12, 2015 by Steven Vannelli of GaveKal Capital At the beginning of every major disruptive innovation, fear, uncertainty and doubt reign supreme. Consumers
Mutual Funds through the Lens of Active Share
 Mutual Funds through the Lens of Active Share John Bogle, founder of The Vanguard Group, is famous for his opinion that index funds are unequivocally the best way to invest. Indeed, over the last decade,
Quality Value Momentum Strategy
 Quality Value Momentum Strategy Ford Equity Research 11722 Sorrento Valley Road, Suite I San Diego, CA 92121 800.842.0207 (USA) 858.455.6316 Fax www.fordequity.com Background Can a low-turnover portfolio
 BLACKROCK.COM/ED EQUITY DIVIDEND FUND With lifespans increasing, investors desiring a long, comfortable retirement will need growing income. Quality, dividend-paying companies that can generate cash flow
Friday, August 24, Questions received in connection with Total Fund Overlay RFP No. NM INV-001- FY19 (Answers are in bold)
") James Maxon MPA Chair, County Member Wayne Propst Executive Director P: (505) 476-9300 F: (505) 476-9401 Toll Free: 1(800) 342-3422 Friday, August 24, 2018 Questions received in connection with Total Fund
James Maxon MPA Chair, County Member Wayne Propst Executive Director P: (505) 476-9300 F: (505) 476-9401 Toll Free: 1(800) 342-3422 Friday, August 24, 2018 Questions received in connection with Total Fund
The Rise of Factor-Based Investing
 In recent years we have seen a proliferation of systematic or rules-based investment strategies brought to market under the smart beta umbrella. Smart beta incorporates elements of both active and passive
Fayez Sarofim & Co Large Cap Equity
 Product Type: Separate Account Manager Headquarters: Houston, TX Total Staff: 90 Geography Focus: Domestic Year Founded: 1958 Investment Professionals: 20 Type of Portfolio: Equity Total AUM: $22,458 million
Smart Beta and the Evolution of Factor-Based Investing
 Smart Beta and the Evolution of Factor-Based Investing September 2016 Donald J. Hohman Managing Director, Product Management Hitesh C. Patel, Ph.D Managing Director Structured Equity Douglas J. Roman,
Review of Pension Plans Performance (Period ending December 31 st, 2013)
") Review of Pension Plans Performance (Period ending December 31 st, 2013) prepared for Investment Subcommittee (Note all returns and values are expressed in Canadian Dollars- CAD s) 1 Canadian Equity The
Review of Pension Plans Performance (Period ending December 31 st, 2013) prepared for Investment Subcommittee (Note all returns and values are expressed in Canadian Dollars- CAD s) 1 Canadian Equity The
DIVERSIFYING VALUE: THINKING OUTSIDE THE BOX
 Legg Mason Thought Leadership DIVERSIFYING VALUE: THINKING OUTSIDE THE BOX Michael J. LaBella, CFA Portfolio Manager Smart beta can be utilized within the traditional style box framework to help investors
Team Dynamics within Global Equity
 Client Memo Q1 2013 Team Dynamics within Global Equity by Global markets remain an interesting area within asset management as more and more plans allocate a significant portion of their equity to global
ishares S&P Latin American 40 ILF
 Thomson Financial Closed End Funds ishares S&P Latin American 40 ILF Prepared By January 28, 2008 Henry Russell Your Local Firm 123 Same Street Rockvill, MD 20850 UNITED STATES Mutual funds, annuities,
The New Asset Allocation
 Published on AdviceIQ (http://www.adviceiq.com) Home > The New Asset Allocation The New Asset Allocation Submitted by Matthew Tuttle on Tue, 07/17/2012-9:00am Time was, everyone thought the best asset
Deactivating Active Share
 Deactivating Active Share Andrea Frazzini Jacques Friedman Lukasz Pomorski April 21, 2016 AQR Capital Management, LLC Two Greenwich Plaza Greenwich, CT 06830 p: +1.203.742.3600 w: aqr.com Active Share
Investment Insight. Are Risk Parity Managers Risk Parity (Continued) Summary Results of the Style Analysis
 Summary Results of the Style Analysis") Investment Insight Are Risk Parity Managers Risk Parity (Continued) Edward Qian, PhD, CFA PanAgora Asset Management October 2013 In the November 2012 Investment Insight 1, I presented a style analysis
Investment Insight Are Risk Parity Managers Risk Parity (Continued) Edward Qian, PhD, CFA PanAgora Asset Management October 2013 In the November 2012 Investment Insight 1, I presented a style analysis
Opportunities in Emerging Markets Inefficiencies Can Provide Opportunity
 Opportunities in Emerging Markets Inefficiencies Can Provide Opportunity Mark Wimer, CFA Senior Portfolio Manager Introduction Strategic Global Advisors (SGA) has been investing client assets in international
Quarterly Asset Class Report Global Equity
 Quarterly Asset Class Report Global Equity canterburyconsulting.com Canterbury Consulting ( CCI ) is an SEC registered Investment Adviser. Information pertaining to CCI's advisory operations, services,
Goldman Sachs Asset Allocation Portfolios Investment Outlook
 Goldman Sachs Asset Allocation Portfolios Investment Outlook Overview The Goldman Sachs Asset Allocation Portfolios are managed by the Global Portfolio Solutions (GPS) team. 1 GPS has been designing customized
Multi-Asset Class Management
 Multi-Asset Class Management February 27, 2019 Alex Gurvich (Director of Investment Research) Surya Pisapati, CFA (Senior Managing Consultant) PFM 1735 Market Street 43 rd Floor Philadelphia, PA 19103
Russell Investments Research
 Russell Investments Research By: Adam Babson, Senior Portfolio Manager FEBRUARY 2018 Structuring a listed portfolio As a real asset category, offers risk, return and diversification characteristics distinct
POST-ELECTION ACTIVE MANAGEMENT PERFORMANCE
 PRUDENTIAL INVESTMENTS, A PGIM BUSINESS STRATEGIC INVESTMENT RESEARCH GROUP POST-ELECTION ACTIVE MANAGEMENT PERFORMANCE December 216 CHART 1: QUALITY ROE (3Y Avg) ROIC (3Y Avg) Earnings Stability (Last
EVESTMENT WEBINAR. Investor and Consultant Sentiment Toward Fixed Income
 EVESTMENT WEBINAR Investor and Consultant Sentiment Toward Fixed Income Agenda Current interest- rate environment How investors are responding Peer benchmarking with investment and consultant sentiment
Modest Style Bets, Modest Price
 Reprinted by permission of Morningstar, Oct. 21, 2016 Modest Style Bets, Modest Price ETF SPECIALIST 10-21-16 by Alex Bryan, CFA Goldman Sachs ActiveBeta U.S. Large Cap Equity ETF (GSLC) offers exposure
Disciplined Alpha: Building Consistent Alpha, Bond by Bond
 MANAGER INSIGHT Disciplined Alpha: Building Consistent Alpha, Bond by Bond By Lynne Royer, Head of the Loomis Sayles Disciplined Alpha Fixed Income Team and William Stevens KEY TAKEAWAYS The Disciplined
The London Company Domestic Equity SMID Core
 Product Type: Separate Account Manager Headquarters: Richmond, VA Total Staff: 24 Geography Focus: Domestic Year Founded: 1994 Investment Professionals: 5 Type of Portfolio: Equity Total AUM: $7,069 million
Investment Committee Quarterly Activity Report 4. FIXED INCOME
 Investment Committee Quarterly Activity Report 4. FIXED INCOME FIXED INCOME MARKET RISK DASHBOARD As of 6/30/2015 Monetary Policy 3.88% U.S. Unemployment Rate 6.10% 0.25% 0% 9.75% The Fed Funds target
MSCI LOW SIZE INDEXES
 MSCI LOW SIZE INDEXES msci.com Size-based investing has been an integral part of the investment process for decades. More recently, transparent and rules-based factor indexes have become widely used tools
Quarterly Asset Class Report Global Equity
 Quarterly Asset Class Report Global Equity canterburyconsulting.com Canterbury Consulting ( CCI ) is an SEC registered Investment Adviser. Information pertaining to CCI's advisory operations, services,
CAMRI ROUNDTABLE DISCUSSION: MEETING SUMMARY Investment Principles Beliefs and Truths. Charles Brandes Thursday, 13 March 2014
 CAMRI ROUNDTABLE DISCUSSION: MEETING SUMMARY Investment Principles Beliefs and Truths Charles Brandes Thursday, 13 March 2014 (This is a meeting summary of the CAMRI Roundtable Discussion led by Charles
Evolving Equity Investing: Delivering Long-Term Returns in Short-Tempered Markets
 March 2012 Evolving Equity Investing: Delivering Long-Term Returns in Short-Tempered Markets Kent Hargis Portfolio Manager Low Volatility Equities Director of Quantitative Research Equities This information
PIMCO Global Optima Index
 PIMCO Global Optima Index Dynamically Blending Global Equity and U.S. Fixed Income Markets to Help Deliver Upside Growth Potential Issued by American General Life Insurance Company (AGL), an American International
The FRED Report Portfolio Report Card Through 2016
 The FRED Report Portfolios The FRED Report The FRED Report Portfolio Report Card Through 2016 Observations, Full-Year 2016 and Inception to Date Large Cap Sector Portfolio o The Large Cap Sector portfolio
Voya Target Date: A Holistic Approach to Target Date Design
 Voya Target Date: A Holistic Approach to Target Date Design Paul Zemsky, CFA Chief Investment Officer, Multi-Asset Strategies and Solutions Jody Hrazanek Head of Strategy Design and Implementation Halvard
Market Insights. The Benefits of Integrating Fundamental and Quantitative Research to Deliver Outcome-Oriented Equity Solutions.
 Market Insights The Benefits of Integrating Fundamental and Quantitative Research to Deliver Outcome-Oriented Equity Solutions Vincent Costa, CFA Head of Global Equities Peg DiOrio, CFA Head of Global
Voya Target Date: A Holistic Approach to Target Date Design
 Voya Target Date: A Holistic Approach to Target Date Design May 2018 Paul Zemsky, CFA Chief Investment Officer, Multi-Asset Strategies and Solutions Halvard Kvaale, CIMA Head of Manager Research and Selection
A Snapshot of Active Share
 November 2016 WHITE PAPER A Snapshot of Active Share With the rise of index and hedge funds over the past three decades, many investors have been debating about the value of active management. The introduction
The enduring case for high-yield bonds
 November 2016 The enduring case for high-yield bonds TIAA Investments Kevin Lorenz, CFA Managing Director High Yield Portfolio Manager Jean Lin, CFA Managing Director High Yield Portfolio Manager Mark