CONSULTANT BRIEFING. New York City April 20, Chris Riley, Aon Hewitt John Molesphini, evestment Jerrod Stoller, evestment
|
|
|
- Vernon Lindsey
- 5 years ago
- Views:
Transcription
1 CONSULTANT BRIEFING New York City April 20, 2017 Chris Riley, Aon Hewitt John Molesphini, evestment Jerrod Stoller, evestment


2 Fee Pressure Low Yield 2016 BREXIT Market Volatility Active vs. Passive Presidential Election
3 How Managers Describe their Investment Process to the Marketplace Firm A s small cap value strategy seeks to capitalize on their expertise in small cap U.S. equities, applying internally generated fundamental research and bottom-up stock selection in creating a defined small cap value portfolio. Firm A believes that a disciplined and consistent approach to fundamental, bottom-up research leads to superior long-term investment performance.
4 How Managers Describe their Investment Process to the Marketplace Disciplined, structured approach Research-intensive process -- in-house research Idea generation Bottom-up, fundamental analysis Conviction Confidence Systematic application of data insights
5 How Distribution Teams Should Describe their Process within the Firm Disciplined, structured approach Research-intensive process -- in-house research Idea generation Bottom-up, fundamental analysis Conviction Confidence Systematic application of data insights
6 3 factors critical to winning and retaining assets Universe Health Product Strategy Fund Performance Portfolio Managers Distribution Sales / Marketing RFP Team Consultant Relations

7 Product Strategy Marketing Consultant Relations Data Sales RFP Team Client Service An integrated process with a consistent message
8 Gaining an Understanding of Your Competitive Landscape Plan Viewing Yourself Through the Lens of an Investor Perception Identifying Relevant Opportunities Prospect Preparing for Success Position Taking Action on Your Opportunities Pursue
9 PLAN Gaining an Understanding of Your Competitive Landscape

10 10 Source: State of Connecticut, AON Hewitt, Public Plan IQ
11 Firm Strategy - Predict Future Cash Flows *Bubble size = revenue (AUM x management fees) $20,000 $2,000 $200 AUM ($m) Flow Forecast Rating $ Outflow Inflow

12 Source: RVK, SBCERS, Public Plan IQ 12
13 Opportunities for Offense and Defense - Equity Universe Q Inst. AUM (USD BN) 4Q'16 Net Inst. Flows (USD BN) 4Q'16 Gross Inflows 4Q'16 Gross Outflows FY 2016 Change FY 2015 Change FY 2014 Change All Japan Equity $ $0.10 $4.33 ($4.23) -4.09% -2.78% 0.88% All Australian Equity $ ($0.57) $3.59 ($4.16) -4.25% -2.02% -7.98% All UK Equity $99.76 ($1.16) $0.46 ($1.62) -7.63% -3.30% -1.49% All Emerging Mkts Equity $ ($1.67) $13.27 ($14.94) 0.24% -2.22% 2.32% All ACWI ex-us Equity $ ($2.81) $9.91 ($12.72) 1.01% 4.08% 2.82% All Canadian Equity $ ($3.80) $2.31 ($6.11) -0.33% -1.83% -4.75% All Asia Pacific Equity $ ($4.11) $4.03 ($8.14) -8.01% -9.97% -6.47% All EAFE Equity $1, ($5.02) $22.94 ($27.96) -0.58% 1.23% 0.89% All Europe Equity $ ($7.77) $5.30 ($13.03) % 2.32% 2.90% All Global Equity $1, ($24.33) $37.55 ($61.89) -2.78% -1.60% 0.97% All US Equity $6, ($87.09) $ ($201.53) -5.30% -4.79% -3.95%
14 Opportunities for Offense and Defense Fixed Income Universe Q Inst. AUM (USD BN) 4Q'16 Inst. Flows (USD BN) 4Q'16 Gross Inflows 4Q'16 Gross Outflows FY 2016 Change FY 2015 Change FY 2014 Change All US Fixed Income $6, $32.61 $ ($131.71) 1.79% -1.09% -1.38% All UK Fixed Income $ $6.86 $12.81 ($5.95) 4.10% -9.07% 3.84% All Asia Pacific Fixed Income $80.68 $0.37 $1.83 ($1.46) 10.08% 9.56% -6.59% All Japan Fixed Income $56.27 ($0.09) $0.87 ($0.96) 5.49% % % All EAFE Fixed Income $24.97 ($1.20) $0.09 ($1.29) % % -6.93% All Australian Fixed Interest $67.27 ($2.13) $1.45 ($3.58) -7.02% -3.10% -1.12% All Global Fixed Income $1, ($3.85) $33.93 ($37.78) -2.72% 1.02% 5.77% All Canadian Fixed Income $ ($4.45) $4.13 ($8.58) -2.24% 0.75% 3.46% All Europe Fixed Income $ ($5.60) $13.36 ($18.96) 5.32% 8.76% 4.64% All Emerg Mkts Fixed Income $ ($13.71) $12.31 ($26.01) -3.28% -7.12% -1.40%

15 Returns Counterbalance Institutional Outflows

16 State of Long-only Asset Management
17 Institutional Flow Equilibrium 100% 90% 80% % with outflows 70% 60% 50% 40% 30% 20% % with inflows 10% 0% Q Q Q Q Q Q Q Q3 2015

18 Trends in Investor Behavior
19 60% Portfolio Distribution 55% 50% 45% 40% 35% 30% 25% 20% 15% 10% Q Q Q Q Q Q Q Q Q Q Traditional EQ Traditional FI Other (incl. Alternatives)
20 100% 90% 80% 70% 60% 50% 40% 30% 20% 10% 0% Q Q Q EQ Portfolio Distribution & Cumulative Flows Q Q Q Q Q Q Q Q Q $1,000,000 $500,000 $- $(500,000) All Active Equity All Passive Equity Active EQ Flows Passive EQ Flows $(1,000,000) $(1,500,000) $(2,000,000) $(2,500,000)

21 Resiliency of EM Equity

22 Source: NEPC, Public Plan IQ22
23 $500,000 Emerging Markets Equity Flows $0 -$500,000 -$1,000,000 -$1,500,000 -$2,000,000 Q Q Q Q Q Q Q Q Q Q All Equity All Emerging Mkts Equity
24 EM Equity Returns & Flows Q Q Q Q Q Q Q $250,000 $200,000 $150,000 $100,000 $50,000 $- $(50,000) evestment All US Equity evestment All Asia Pacific Equity evestment All ACWI ex-us Equity evestment All Europe Equity evestment All EAFE Equity Active EM Equity Flows

25 Flow Volatility = Opportunity
26 Case of US Core Plus Fixed
27 100% Case of US Core Plus Fixed 90% 80% 70% 60% 50% 40% 30% 20% 10% 0% Q Q Q Q Q Q Q % with Inflows % with Outflows

28 CHRIS RILEY
29 Gaining an Understanding of Your Competitive Landscape Plan Case Study Creating Distribution Alpha Viewing Yourself Through the Lens of an Investor Identifying Relevant Opportunities Perception Prospect Preparing for Success Position Taking Action on Your Opportunities Pursue
30 CAN P: 4.2% U:9% US P: 46.2% U:67.4% LAT AM P:0.0% U:0.0% Where to Invest Time and Effort Universe Interest UK P: 7.7% U:9.3% Europe P: 2.9% U: 6.4% Africa U:1.3% Asia P: 21.6% U:3.5% Australia U:2.3% Japan P:12.2% U:0.8%
31 33% of the Interest in this Universe is Outside of US

32 Understanding Perception Consultant/Investor Views 3-year Quartile Top Perceived Peer Passed/Failed Screens Adds to Universes 52 2 Dimensional Fund Advisors 104/97 46 Product Total Views Dimensional Fund Advisors EM All Cap Core Strategy 814 Acadian Asset Management EM Equity 980 LSV Asset Management EM Value Equity 509 Fisher Investments EM Equity 625 Harding Loevner LP EM 1220 Clarivest EM 349 Axiom EM Equity Strategy 623
33 Consultant s Favorable Investment Manager Evaluation Qualities and Characteristics for the EM Equity Universe Organizational and Professional Performance and Investment Vehicle Investment Process Organizational and Professional Performance and Investment Vehicle Investment Process Low turnover among staff, particularly key Verifiable track record, with reasonable level of Very few changes to investment team, style and investment Low turnover professionals among staff, particularly key assets Verifiable in the track fund record, with reasonable Very process few changes to investment team, style investment professionals level of assets in the fund and process Limited number of professionals involved in final Superior performance over meaningful amount Limited clients lost Limited investment number decisions of professionals (with few committees involved in of Superior time performance over meaningful final between investment idea generation decisions and (with implementation few Limited clients lost amount of time committees between idea generation and Performance consistent with stated investment Portfolio managers have flexibility indecisionmaking process Logical business plan style and market capitalization implementation Performance consistent with stated Investment management activities are profitable Past investment decisions adhere to stated Reasonable risk profile and risk-adjusted returns Portfolio managers have flexibility in and account Logical for business a large plan portion of firm revenue investment style and market decision-making investment process process capitalization Reasonable level of assets under management along Investment management activities are Competitive fees, with value-added on a net of Ideas are successfully implemented (i.e., no with reasonable growth in assets under fees Reasonable basis risk profile and risk-adjusted Past disconnect investment between decisions process adhere and performance to stated management profitable and account for a large portion of returns investment process firm revenue No use (or very limited use) of complex Reasonable level of assets under Performance pattern complements current Ideas are successfully implemented (i.e., no Experienced, knowledgeable staff investment instruments such as futures, managers Competitive (e.g. no fees, style with "drift") value-added on a management along with reasonable growth disconnect derivatives, between swaps, etc. process and net of fees basis in assets under management performance) Competitive compensation and incentive policies If applicable, clear quantitative modeling (e.g., employee ownership) No approach use (or very (i.e., limited no black use) box") of complex Performance pattern compliments current Experienced, knowledgeable staff investment instruments such as futures, Peer or horizontal relationships among key managers (e.g. no style "drift") If applicable, fundamental analysis is logical and professionals derivatives, thorough swaps, etc. Competitive compensation and incentive If applicable, clear quantitative modeling policies (e.g., employee ownership) approach (i.e., no black box") Peer or horizontal relationships among key If applicable, fundamental analysis is logical professionals and thorough 33
34 Understanding what Investors Want to See 17.7% Current # of Holdings Screen Term Actual Value Active Share Screen Term Actual value % Missing Data Criteria Not Met Screen Term EM Equity Value Market Cap Actual value EM Equity Core
35 Characteristics of a winner EM All Cap Core Equity Product Performance Asset Flows Marketability Universe Health Distr. Impact Winner Your Product Source: ev Scorecard Metric Score Value Investor Sentiment 5 81 Fee Level ($50 Mil) 3 90 BPS Number of Holdings 2 142
36 Characteristics of a winner - Fees Metric Score Value Investor Sentiment 5 81 Fee Level ($50 Mil) 3 90 BPS Number of Holdings Universe Quintile Ranking 17.5 BPS 76.5 BPS Perceived Peer Comparison EM All Cap Core EM All Cap Value EM All Cap Value EM Large Cap Core EM All Cap Growth Value 55 BPS 100 BPS 100 BPS 97.5 BPS 97 BPS 87.5 BPS 95 BPS 108 BPS 125 BPS
37 Characteristics of a winner Portfolio Concentration Metric Score Value Investor Sentiment 5 81 Fee Level ($50 Mil) 3 90 BPS Number of Holdings Perceived Peer Comparison Value EM All Cap Core 4489 EM All Cap Value 397 EM All Cap Value 180 EM Large Cap Core 72 EM All Cap Growth 78 Universe Quintile Ranking
38 Gaining an Understanding of Your Competitive Landscape Plan Case Study Creating Distribution Alpha Viewing Yourself Through the Lens of an Investor Identifying Relevant Opportunities Perception Prospect Preparing for Success Position Taking Action on Your Opportunities Pursue

39 Target 4/20/
40 Staying Current People Changes Large AUM Changes Consultant Views Constituent Changes Products in Bottom Quartile Product Consultant Views Change GMO Emerging Domestic Opportunities Strategy Invesco Developing Markets Westwood Global EM Markets Macquarie Investment Management EM Equity Stewart Investors Global EM Leaders Strategy Wells Capital SF Global EM Markets Leaders 33 19
41 Prospecting Opportunities- Bottom Performers Product Returns (Trailing 3 Year) Rank Total AUM* Views Emerging Markets $113 3 Parity EM Fund $54 0 Global EM Equity $74 15 EM Equity $1,481 6 EM Equity Strategy $4, *AUM in millions
42 Prospecting Opportunities- Outflows Product Flows by Inst. AUM* Rank Total AUM* Views Global EM Equity -2, $26, Global EM Focused -2, $5, Fundamental EM Equity -1, $1,202 3 Global EM Opportunities -1, $3, EM Growth fund $1, *Flows and AUM in millions
43 Prospecting Opportunities Risk Based Opportunities Product Tracking Error (Trailing 3 Year) Rank Total AUM* Views Global EM Markets Equity $ EM Equity $ Global EM Strategy $1, Global EM Equity Strategy $4, EM Fund $8 7 *AUM in millions
44 Prospecting Opportunities Least Correlated Product Correlation: Excess Return (Trailing 3 Year) Rank Total AUM* Views Emerging Markets $113 3 EM Equity $3, EM Equity $ EM Ext. Opportunity $776 3 EM Equity Strategy $3, *AUM in millions
45 Gaining an Understanding of Your Competitive Landscape Plan Case Study Creating Distribution Alpha Viewing Yourself Through the Lens of an Investor Identifying Relevant Opportunities Perception Prospect Preparing for Success Position Taking Action on Your Opportunities Pursue

46 # of Securities Fees Source: Summit, City of Austin, Public Plan IQ 46

47 Intrinsic Differentiators

48 Sample EM Equity Portfolio EM All Cap Core Universe LARGE CAP VALUE LARGE CAP CORE LARGE CAP GROWTH
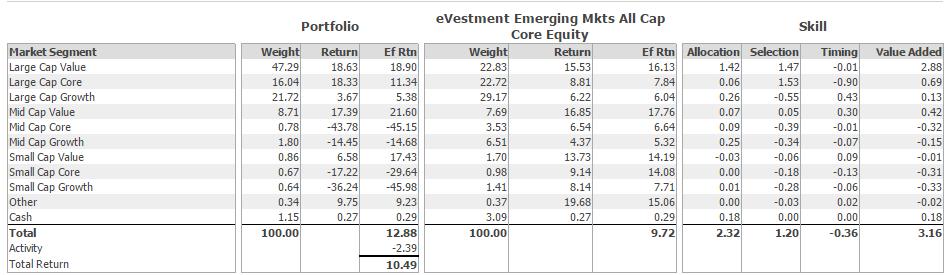
49 Style allocations

50 Concentration 10 largest holdings Eight of the top ten largest holdings Were positive contributors to return vs peers Top 10 holdings are 25% of the portfolio vs. 19% for the peer group
51 Technology Consumer Staples Consumer Discretionary Energy Utilities Health Care Producer Durables Materials & Processing Financial Services Explaining Investment Philosophy and Emphasizing Differentiation -6.0% -4.0% -2.0% 0.0% 2.0% 4.0% Sample EM Equity Strategy EM Equity Universe
52 Gaining an Understanding of Your Competitive Landscape Plan Case Study Creating Distribution Alpha Viewing Yourself Through the Lens of an Investor Identifying Relevant Opportunities Perception Prospect Preparing for Success Position Taking Action on Your Opportunities Pursue


53 Competitive Insights Top Emerging Markets Equity competitors (Over 3yrs) Aggregated competitive intelligence Gain access to presentation materials, consultant evaluations and negotiated fees. Source: ev Public Plan IQ
54 Consultant s Summary of Investment Manager Evaluation Process for the EM Equity Universe Organizational and Professional Performance and Investment Vehicle Investment Process Low turnover among Firm / staff, Product particularly key Verifiable Reason track record, for Exclusion with reasonable level of Very few changes to investment team, style and investment professionals Emerging Markets Equity assets in the Relatively fund high product assets process Emerging Markets Equity Consultant / staff prefer other candidates Limited number of professionals involved in final Superior performance over meaningful amount Limited clients lost Emerging Markets Leading Companies Prefer manager's other EM strategy investment decisions (with few committees Global Emerging Markets Equity of time Relatively high investment management between fees idea generation and implementation Emerging Domestic Opportunities Strategy Performance Relatively consistent high with investment stated investment management Portfolio fees managers have flexibility indecisionmaking trailing process five-, seven-, and ten- Logical business plan style and Strategy market capitalization underperformed benchmark over Investment management EM Strategy activities are profitable years Past investment decisions adhere to stated Reasonable Relatively risk profile weak and performance risk-adjusted versus returnsbenchmark over trailing five- and and account for a large portion of firm revenue investment process Emerging Markets Equity seven years Reasonable level of assets under management along Emerging Markets Value Equity Competitive High fees, investment with value-added management on a net fees of Ideas are successfully implemented (i.e., no with reasonable growth in assets under fees basis disconnect between process and performance management Emerging Markets Equity Only $384 MM of product assets in commingled fund Emerging Markets Equity High investment management fees No use (or very limited use) of complex Performance Strategy pattern underperformed complements current versus benchmark and peers over one- and Experienced, knowledgeable staff investment instruments such as futures, Emerging Markets Equity Strategy managers three- (e.g. no years style "drift") derivatives, swaps, etc. Global Emerging Market Equity Firm did not submit to the invitation only SFP Competitive compensation and incentive policies If applicable, clear quantitative modeling (e.g., employee ownership) approach (i.e., no black box") Emerging Markets Core Equity Weak performance versus benchmark over trailing one- and three years Peer or horizontal relationships among key If applicable, fundamental analysis is logical and Emerging Markets Growth Firm did not submit to the invitation only SFP professionals thorough Equities Emerging Markets Consultant / staff preference for other candidates Emerging Markets Equity Strategy Departure of lead portfolio manager for EM equity strategy Emerging Markets Relatively high investment management fees Emerging Markets Plus Firm did not submit to the invitation only SFP 54
55 Head-to-head comparisons EM Strategy A vs EM Strategy B Excess Returns 1 Year 3 Year 5 Year
56 Head-to-head comparisons EM Strategy A vs EM Strategy B Fees 10mm 25mm 50mm 75mm 100mm


57 Head-to-head comparisons EM Strategy A vs EM Strategy B People Total Number Avg. Experience Avg. Years at Firm Number Lost
58 Always Be Prepared Sample EM Strategy Competitor 1 Competitor 2 People THIRD SECOND FIRST Portfolio Mgrs/Dual Role PM s Research Analysts CFA Charterholders Avg Years Exp: PM s Avg Yrs Exp: Analysts Avg Yrs w Firm: PM s Portfolio Mgrs Lost

59 Always Be Prepared Sample EM Strategy Competitor 1 Competitor 2 Risk FIRST THIRD SECOND Standard Deviation 3 YRS Beta 3 YRS Annualized Alpha 3 YRS Information Ratio 3 YRS Sharpe Ratio 3 YRS Upside Market Capture 3 YRS Downside Market Capture 3 YRS
60 Contact Us evestment Alliance, LLC. All rights reserved. The information contained herein is proprietary information of evestment and/or its content providers and this information is for use by evestment s intended recipients only. You may not redistribute or copy any of the material contained herein without the express, written permission of evestment. Neither evestment nor any of its content providers will be responsible for any damages or losses arising from any use of this information. The information contained herein is for informational and research purposes only and you should not make any investment decisions relying on any of this information. evestment and the E logo are registered trademarks of evestment Alliance, LLC.
EVESTMENT BREAKFAST SEMINAR
 EVESTMENT BREAKFAST SEMINAR Toronto March 21, 2017 Ryan Anderson, Pavilion John Molesphini, evestment Jerrod Stoller, evestment Gaining an Understanding of Your Competitive Landscape Case Study Effective
GENERATING ALPHA IN INSTITUTIONAL SALES & DISTRIBUTION
 GENERATING ALPHA IN INSTITUTIONAL SALES & DISTRIBUTION Andrew Bevan, CFA, CAIA Formerly in Business Development Horizon Kinetics LLC Maria Simon Formerly in Institutional Marketing Local Tapiola Asset
EVESTMENT INSTITUTIONAL INVESTMENT INTELLIGENCE CONFERENCE
 EVESTMENT INSTITUTIONAL INVESTMENT INTELLIGENCE CONFERENCE 2018 Trends Update: Industry Themes Data Driven Insight Peter Laurelli Global Head of Research, evestment John Molesphini Global Head of Strategic
EVESTMENT WEBINAR. Investor and Consultant Sentiment Toward Fixed Income
 EVESTMENT WEBINAR Investor and Consultant Sentiment Toward Fixed Income Agenda Current interest- rate environment How investors are responding Peer benchmarking with investment and consultant sentiment
THE ACTIVE SHARE DEBATE WEBINAR. Presented by John Alexander, CFA Billy Welsh
 THE ACTIVE SHARE DEBATE WEBINAR Presented by John Alexander, CFA Billy Welsh Today s Speakers John Alexander, CFA Solutions Specialist evestment Billy Welsh Client Strategist evestment jalexander@evestment.com
Core Asset Manager: A Tailored Investment Strategy
 Core Asset Manager: A Tailored Investment Strategy CHRIS HART, Core Investment Manager Brinker Capital Inc., A Registered Investment Advisor For financial advisor use only. For financial professional use
Schafer Cullen Capital Management High Dividend Value
 Product Type: Separate Account Manager Headquarters: New York, NY Total Staff: 56 Geography Focus: Domestic Year Founded: 1983 Investment Professionals: 21 Type of Portfolio: Equity Total AUM: $17,896
Invesco second quarter 2016 results
 Invesco second quarter 2016 results Martin L. Flanagan President and Chief Executive Officer Loren M. Starr Chief Financial Officer July 28, 2016 Forward-looking statements This presentation, and comments
Invesco third quarter 2017 results
 Invesco third quarter 2017 results Martin L. Flanagan President and Chief Executive Officer Dan Draper Global Head of ETFs Loren M. Starr Chief Financial Officer October 26, 2017 Forward-looking statements
Summit Strategies Group 8182 Maryland Avenue, 6th Floor St. Louis, Missouri
 Summit Strategies Group 8182 Maryland Avenue, 6th Floor St. Louis, Missouri 63105 314.727.7211 International Equity Search City of Jacksonville Police & Fire Pension Fund June 10, 2016 EXECUTIVE SUMMARY
Active management can add big value in small-cap equities
 Principal Global Equities Active management can add big value in small-cap equities Brian Pattinson, CFA - Portfolio Manager Key points: Inefficiencies create opportunity Our approach to active investing
Equities: Enhancing the Core/Satellite Framework
 Equities: Enhancing the Core/Satellite Framework March 13, 2015 by Sabrina Callin, Andrew Pyne of PIMCO In a lower-returning environment, investors may need to look beyond traditional active or passive
Voya Large Cap Growth Strategy
 Separately Managed Account I For Quarter Ending June 3, 18 I Strategy Brief I 2Q 18 Voya Large Cap Growth Strategy Strategy-At-A-Glance Objective 1 Inception Date Benchmark Vehicles To outperform the Russell
Invesco first quarter 2015 results
 Invesco first quarter 2015 results Martin L. Flanagan President and Chief Executive Officer Loren M. Starr Chief Financial Officer April 30, 2015 Forward-looking statements This presentation, and comments
The London Company Domestic Equity SMID Core
 Product Type: Separate Account Manager Headquarters: Richmond, VA Total Staff: 24 Geography Focus: Domestic Year Founded: 1994 Investment Professionals: 5 Type of Portfolio: Equity Total AUM: $7,069 million
An All-Cap Core Investment Approach
 An All-Cap Core Investment Approach A White Paper by Manning & Napier www.manning-napier.com Unless otherwise noted, all figures are based in USD. 1 What is an All-Cap Core Approach An All-Cap Core investment
The Value of an Investment Process
 The Value of an Investment Process Advance Capital Management, Inc. is an SEC registered investment adviser. Registration with the SEC does not imply any level of skill or training. THIS MATERIAL IS FOR
Smart Beta ETFs: 3 ways to address investor needs
 Smart Beta ETFs: 3 ways to address investor needs Help achieve investor goals with smart beta ETFs This guide highlights three ways investors are using ishares smart beta ETFs: 1 Lower volatility can help
Evolving Equity Investing: Delivering Long-Term Returns in Short-Tempered Markets
 March 2012 Evolving Equity Investing: Delivering Long-Term Returns in Short-Tempered Markets Kent Hargis Portfolio Manager Low Volatility Equities Director of Quantitative Research Equities This information
Asset Flows Report Q June 7, Summary
 Asset Flows Report June 7, Summary evestment s Traditional Asset Flows Report shows the flow of institutional funds across investment strategies, regions, and investor types. Investor flows are calculated
Mid Cap Dividend Growth Strategy
 Mid Cap Dividend Growth Strategy Product Level Investment Process Stock Universe Companies that have increased their dividends with market capitalizations of $1 billion to $15 billion Stock Selection Top
Smart Beta Dashboard. Thoughts at a Glance. June By the SPDR Americas Research Team
 By the SPDR Americas Research Team Thoughts at a Glance Factor performance diverged across regions in Q2. In the US, all factors with the exception of underperformed broad US equities. As volatility in
Alternative Data Integration, Analysis and Investment Research
 Alternative Data Integration, Analysis and Investment Research Yin Luo, CFA Vice Chairman Quantitative Research, Economics, and Portfolio Strategy QES Desk Phone: 1.646.582.9230 Luo.QES@wolferesearch.com
Nasdaq Chaikin Power US Small Cap Index
 Nasdaq Chaikin Power US Small Cap Index A Multi-Factor Approach to Small Cap Introduction Multi-factor investing has become very popular in recent years. The term smart beta has been coined to categorize
Smart Beta Dashboard. Thoughts at a Glance. March By the SPDR Americas Research Team
 By the SPDR Americas Research Team Thoughts at a Glance For the first two months of Q1, US outperformed the broader market by nearly 5%. However, as 10-year Treasury yields and inflation expectations came
Investment manager research
 Page 1 of 10 Investment manager research Due diligence and selection process Table of contents 2 Introduction 2 Disciplined search criteria 3 Comprehensive evaluation process 4 Firm and product 5 Investment
Equity Investing T. ROWE PRICE S GLOBAL STOCK FUND
 FUND SPOTLIGHT November 2017 In-depth analysis and insights to inform your decision-making. Equity Investing T. ROWE PRICE S GLOBAL STOCK FUND David Eiswert Portfolio Manager, Global Stock Fund EXECUTIVE
COVERED CALL STRATEGY An enhanced income and low volatility approach to equities
 COVERED CALL STRATEGY An enhanced income and low volatility approach to equities JULY, 2017 230 Park Avenue 10 th Floor Suite 61 New York, NY 10169 About us Founded in 1995, Griffin Asset Management, Inc.
Tactical Income ETF. Investor Presentation N ORTHC OAST I NVESTMENT A DVISORY T EAM NORTHCOASTAM. COM
 Tactical Income ETF Investor Presentation N ORTHC OAST I NVESTMENT A DVISORY T EAM 203.532.7000 INFO@ NORTHCOASTAM. COM NORTHCOAST ASSET MANAGEMENT An established leader in the field of tactical investment
SYMONS CAPITAL MANAGEMENT
 SYMONS Managing U.S. Equity Portfolios Since 1983 And Building Durable Wealth Through Risk Management Symons Value 3rd Quarter 2018 650 Washington Road, Suite 800, Pittsburgh, PA 15228 412-344-7690 1 www.symonscapital.com
SEI UK Equity Fund Quarter 4, 2008
 Benchmark FTSE Actuaries All Share Index Base Currency GBP Currencies Available USD, EUR, GBP Fund Complex SEI Global Master Fund PLC SEI UK Equity Fund Quarter 4, 2008 SEI MANAGER OF MANAGERS PHILOSOPHY
Cash. Period Ending 06/30/2016 Period Ending 3/31/2016. Equity. Fixed Income. Other
 Product Type: Multi-Product Portfolio Headquarters: Austin, TX Total Staff: 46 Geography Focus: Global Year Founded: 1996 Investment Professionals: 16 Type of Portfolio: Balanced Total AUM: $12,046 million
Building value for clients and shareholders Third quarter 2018 results and the planned combination with OppenheimerFunds
 Building value for clients and shareholders Third quarter 2018 results and the planned combination with OppenheimerFunds Martin L. Flanagan President and Chief Executive Officer Loren M. Starr Chief Financial
Fayez Sarofim & Co Large Cap Equity
 Product Type: Separate Account Manager Headquarters: Houston, TX Total Staff: 90 Geography Focus: Domestic Year Founded: 1958 Investment Professionals: 20 Type of Portfolio: Equity Total AUM: $22,458 million
UBS Conservative Income - Muni FI
 Product Type: Multi-Product Portfolio Headquarters: New York, NY Total Staff: 2,329 Geography Focus: Global Year Founded: 1989 Investment Professionals: 953 Type of Portfolio: Balanced Total AUM: $627,645
Emerging Markets Navigating Rough Seas
 Asset Management Quality Growth Boutique Emerging Markets Navigating Rough Seas Jin Zhang, CFA Portfolio Manager Douglas Bennett Client Portfolio Manager October 2018 For institutional investors only /
Additional series available. Morningstar TM Rating. Funds in category. Equity style Market cap %
 Sun Life Dynamic American Fund Series A Additional series available Note: Effective February 10, 2017, Sun Life Dynamic American Value Fund was renamed Sun Life Dynamic American Fund. $13.5130 Net asset
Additional series available. Morningstar TM Rating - Funds in category. Equity style Market cap % Micro 0.2. as of October 31, 2018
 Sun Life Excel India Fund Series A Additional series available Note: On June 18, 2018, the Excel India Fund changed its name to the Sun Life Excel India Fund. $35.1566 CAD Net asset value per security
FIDELITY NORTHSTAR FUND
 FIDELITY NORTHSTAR FUND QUARTERLY FUND REVIEW December 31, 2017 Fund overview Investment objective The Fund aims to achieve long-term capital growth. It invests primarily in equity securities of companies
4Q17 Global & International Equity GLOBAL EQUITY. 10+ Years of Providing High Income Through Global Dividends
 4Q17 Global & International Equity GLOBAL EQUITY INCOME FUND 10+ Years of Providing High Income Through Global Dividends A: HFQAX C: HFQCX I: HFQIX N: HFQRX S: HFQSX T: HFQTX Overall Morningstar Rating
Fundamental. Thinking. Worldwide. International Equity ADR Review Fourth Quarter 2018
 Fundamental. Thinking. Worldwide. International Equity ADR Review Fourth Quarter 2018 Quality-Growth Investment Philosophy As of December 31, 2018 More Profitable Lower Risk Faster Growth Profit Margin
WHY EQUITIES NOW? THINGS TO CONSIDER
 October 4, 2017 WHY EQUITIES NOW? THINGS TO CONSIDER Scott Krauthamer, CFA, CAIA Managing Director Equities, AB MJ Zayac Director, Institutional Retirement Specialist, AB There is no guarantee that any
Invesco fourth quarter and full year 2017 results
 Invesco fourth quarter and full year 2017 results Martin L. Flanagan President and Chief Executive Officer Loren M. Starr Chief Financial Officer January 31, 2018 Forward-looking statements This presentation,
Tower Square Investment Management LLC Strategic Aggressive
 Product Type: Multi-Product Portfolio Headquarters: El Segundo, CA Total Staff: 15 Geography Focus: Global Year Founded: 2012 Investment Professionals: 12 Type of Portfolio: Balanced Total AUM: $1,422
Additional series available. Morningstar TM Rating. Funds in category. Equity style Market cap % Giant 71.7 Large 20.3 Medium 8.0 Small 0.0 Micro 0.
 Sun Life Excel China Fund Series A Additional series available Note: On June 18, 2018, the Excel China Fund changed its name to the Sun Life Excel China Fund. $3.6904 CAD Net asset value per security (NAVPS)
CIBC Wood Gundy Recommended Funds
 Investment Strategy Group Funds Research December 2015 Daniel Arsenault, CFA, FRM Director, Investment Funds CIBC Wood Gundy Recommended Mutual Funds Summary Recommended Funds - Equities ISG Funds Research
Investment Comparison
 Investment Data as of 1/31/217 PAGE 2 OF 7 Fi36 FIDUCIARY SCORE OVERVIEW INVESTMENT ClearBridge Small Cap Value I MassMutual Premier Small Cap Opps R5 ishares Russell 2 Small-Cap Idx Instl Victory Integrity
CFI Multi-Strategy Equity Fund, LLC Objective and Strategy March 31, 2015
 CFI Multi-Strategy Equity Fund, LLC Objective and Strategy Objective To offer an actively managed, multi-manager investment program that will provide broad exposure to global equity markets. The fund seeks
Beyond Traditional Infrastructure Investing: Listed Infrastructure Equities as an Income Solution
 October 2018 Beyond Traditional Infrastructure Investing: Listed Infrastructure Equities as an Income Solution James A. Lydotes, CFA, Brock A. Campbell, CFA & William J. Adams Standish, Mellon Capital
November Under The Manager Microscope: Causeway s Risk Lens
 Under The Manager Microscope: Causeway s Risk Lens Abstract How is your investment manager spending your portfolio s risk budget? Is your investment manager pursuing a strategy true to label? How concentrated
Additional series available. Morningstar TM Rating. Funds in category 411. Equity style Market cap % Micro 2.0. Canada 56.9 as of February 28, 2018
 Sun Life Dynamic Equity Income Fund Investment objective Series A $10.6262 Net asset value per security (NAVPS) as of June 06, 2018 $0.0277 0.26% Benchmark S&P/TSX Composite Index Fund category Canadian
DIVIDEND GROWTH STRATEGY
 DIVIDEND GROWTH STRATEGY The investment objective of Griffin s Dividend is long-term capital appreciation and income. The Strategy invests primarily in large and mid-capitalization dividend paying stocks
Templeton Non-US Equity. Imperial County Employees' Retirement System. February SEATTLE LOS ANGELES
 Templeton Non-US Equity Imperial County Employees' Retirement System February 14 SEATTLE 6.6.37 LOS ANGELES 31.97.1777 www.wurts.com MANAGER OVERVIEW Firm Ownership Firm Name Product Name Product Total
INSTITUTIONAL INVESTMENT & FIDUCIARY SERVICES: Investment Basics: Is Active Management Still Worth the Fees? By Joseph N. Stevens, CFA INTRODUCTION
 INSTITUTIONAL INVESTMENT & FIDUCIARY SERVICES: Investment Basics: Is Active Management Still Worth the Fees? By Joseph N. Stevens, CFA INTRODUCTION As of December 31, 2014, more than 30% of all US Dollar-based
Additional series available. Morningstar TM Rating. Funds in category Equity style Market cap %
 Sun Life MFS Global Value Fund Investment objective Series A $21.8820 CAD Net asset value per security (NAVPS) as of January 04, 2019 $0.3356 1.56% Benchmark MSCI World C$ Index Fund category Global Equity
Smart Beta Dashboard. Thoughts at a Glance. January By the SPDR Americas Research Team
 By the SPDR Americas Research Team Thoughts at a Glance 2017 marked another year of factor performance shifts. s comeback in the US on the heels of the US election and the potential for a Trump-flation
Investment Policy Statement for. MyHSA Program
 Investment Policy Statement for MyHSA Program Part I. THE PLAN The Alliance Benefit Group of Illinois ( Sponsor ) sponsors a Health Savings Account program dba MyHSA ( Program ). This program was established
Additional series available. Morningstar TM Rating - Funds in category - Equity style Market cap %
 Sun Life MFS Low Volatility International Equity Fund Investment objective Series A $8.7749 Net asset value per security (NAVPS) as of April 1, 2018 $0.0005 0.01% Benchmark MSCI EAFE C$ Index Fund category
Additional series available. Morningstar TM Rating. Funds in category. Equity style Market cap %
 Sun Life MFS Canadian Equity Growth Fund Series A $48.7284 Net asset value per security (NAVPS) as of February 12, 2018 $0.6295 1.31% Benchmark Blended benchmark Fund category Canadian Focused Equity Additional
Managed Accounts. FTA/Morningstar International Core Strategy. First Quarter 2018
 Managed Accounts FTA/Morningstar International Core Strategy First Quarter 2018 Firm Profile First Trust Advisors L.P./First Trust Portfolios L.P. Established in 1991; privately owned Over 700 employees
Additional series available. Morningstar TM Rating. Funds in category 192. Equity style Market cap %
 Sun Life Sionna Canadian Small Cap Equity Class Series A Additional series available Note: Sun Life Sionna Canadian Small Cap Equity Class will be closed effective November 16, 2018. View press release.
Additional series available. Morningstar TM Rating. Funds in category 403. Equity style Market cap %
 Sun Life MFS International Value Fund Investment objective Series A $19.6632 CAD Net asset value per security (NAVPS) as of December 24, 2018 $-0.0015-0.01% Benchmark MSCI EAFE C$ Index Fund category International
Specialist International Share Fund
 Specialist International Share Fund Manager Profile January 2016 Adviser use only Specialist International Share Fund process process for this Fund is structured in the following steps: Step 1 Objectives:
Additional series available. Morningstar TM Rating. Funds in category 431. Credit quality %
 Sun Life MFS Dividend Income Fund Investment objective Series A $12.9438 CAD Net asset value per security (NAVPS) as of October 05, 2018 $-0.0365-0.28% Benchmark S&P/TSX Capped Composite Index Fund category
Market Insights. The Benefits of Integrating Fundamental and Quantitative Research to Deliver Outcome-Oriented Equity Solutions.
 Market Insights The Benefits of Integrating Fundamental and Quantitative Research to Deliver Outcome-Oriented Equity Solutions Vincent Costa, CFA Head of Global Equities Peg DiOrio, CFA Head of Global
Growth Investing. in Times of Market Volatility. White Paper
 White Paper Growth Investing in Times of Market Volatility April 2018 Executive Summary Many investors may be dismayed by the volatile nature of high-flying growth stocks. While, by definition, growth
Additional series available. Morningstar TM Rating - Funds in category. Equity style Market cap %
 Sun Life Excel New India Leaders Fund Series A Additional series available Note: On June 18, 2018, the Excel New India Leaders Fund changed its name to the Sun Life Excel New India Leaders Fund. $5.7880
Translating Factors to International Markets
 LEADERSHIP SERIES Translating Factors to International Markets Strategies that combine the potential diversification benefits of international exposure with the portfolio-enhancing benefits of factors
Request for Proposal
 Request for Proposal City of Annapolis Police and Fire Retirement Plan Emerging Investment Manager PROPOSAL DEADLINE: DECEMBER 30, 2014 TIME: 5:00 PM TABLE OF CONTENTS INTRODUCTION... 1 GOALS FOR UTILIZATION
Can Behavioral Factors Improve Tactical Performance?
 Can Behavioral Factors Improve Tactical Performance? More and more, Financial Advisors agree that portfolios with a tactical tilt provide increased asset allocation flexibility that can improve returns
Top 10 Reasons This Remains A Misunderstood and Underutilized Asset Class. Please see last page for important disclosures.
 18 INTERNATIONAL SMALL CAP Top 10 Reasons This Remains A Misunderstood and Underutilized Asset Class Please see last page for important disclosures. 1 INTERNATIONAL INVESTING IS RISKY. 2 INTERNATIONAL
Annual Returns: S&P 500 vs. ACWI ex-u.s. (Global Equities outside U.S.)
") 2015 Strategy Review Tactical Growth (Managed ETFs) December 31, 2015 The following report provides in-depth analysis into the successes and challenges of Tactical Growth throughout 2015, important research
2015 Strategy Review Tactical Growth (Managed ETFs) December 31, 2015 The following report provides in-depth analysis into the successes and challenges of Tactical Growth throughout 2015, important research
ishares Edge Minimum Volatility ETFs
 ishares Edge Minimum Volatility ETFs A new approach for the core of your portfolio Min Vol USA ETF Exp. Ratio: 0.15% Min Vol EAFE ETF Net Exp. Ratio: 0.20% Min Vol Emerging Markets ETF Net Exp. Ratio:
Additional series available. Morningstar TM Rating. Funds in category. Equity style Market cap % Giant 0.0 Large 1.9 Medium 58.5 Small 37.1 Micro 2.
 Sun Life Schroder Global Mid Cap Fund Series A $11.6434 CAD Net asset value per security (NAVPS) as of September 27, 2018 $0.0408 0.35% Benchmark MSCI World Small Cap Index Fund category Global Small/Mid
Invesco third quarter 2014 results
 Invesco third quarter 2014 results Martin L. Flanagan President and Chief Executive Officer Loren M. Starr Chief Financial Officer October 30, 2014 Forward-looking statements This presentation, and comments
Additional series available. Morningstar TM Rating. Funds in category. Equity style Market cap %
 Sun Life BlackRock Canadian Equity Fund Series A $13.5549 Net asset value per security (NAVPS) as of January 04, 2018 $0.0452 0.33% Benchmark S&P/TSX Capped Composite Index Fund category Canadian Focused
Additional series available. Morningstar TM Rating. Funds in category 363. Fixed income % of fixed income allocation
 Sun Life BlackRock Canadian Balanced Fund Investment objective Series A $12.4584 Net asset value per security (NAVPS) as of August 20, 2018 $0.0128 0.10% Benchmark Blended benchmark Fund category Canadian
Managed Accounts. FTA/Morningstar Multi-Discipline 75/25 Strategy. First Quarter 2018
 Managed Accounts FTA/Morningstar Multi-Discipline 75/25 Strategy First Quarter 2018 Firm Profile First Trust Advisors L.P./First Trust Portfolios L.P. Established in 1991; privately owned Over 700 employees
Invesco first quarter 2018 results
 Invesco first quarter 2018 results Martin L. Flanagan President and Chief Executive Officer Loren M. Starr Chief Financial Officer April 26, 2018 Forward-looking statements This presentation, and comments
Additional series available. Morningstar TM Rating. Funds in category. Equity style Market cap %
 Sun Life MFS Dividend Income Fund Series A $13.3108 Net asset value per security (NAVPS) as of December 22, 2017 $-0.0115-0.09% Benchmark S&P/TSX Capped Composite Index Fund category Canadian Dividend
THE DATA BEHIND THE BUZZWORDS FOR ASSET MANAGERS
 THE DATA BEHIND THE BUZZWORDS FOR ASSET MANAGERS February 11, 2015 John Molesphini John Alexander, CFA Today s Presentation Agenda Sales and marketing challenges Pitfalls of complex terminology Dive into
Additional series available. Morningstar TM Rating - Funds in category. Equity style Market cap %
 Sun Life Infrastructure Fund Series A $7.6099 Net asset value per security (NAVPS) as of February 07, 2018 $0.0792 1.05% Benchmark S&P Global Infrastructure Total Return C$ Index Fund category Global Infrastructure
Yacktman Special Opportunities Fund Class I (YASSX) Class Z (YASLX) September 2018
 Class Z (YASLX) September 2018") Yacktman Special Opportunities Fund Class I (YASSX) Class Z (YASLX) September 2018 FOR INVESTMENT PROFESSIONAL USE ONLY NOT FOR DISTRIBUTION TO OR USE WITH THE GENERAL PUBLIC QUARTERLY PERFORMANCE () AND
Yacktman Special Opportunities Fund Class I (YASSX) Class Z (YASLX) September 2018 FOR INVESTMENT PROFESSIONAL USE ONLY NOT FOR DISTRIBUTION TO OR USE WITH THE GENERAL PUBLIC QUARTERLY PERFORMANCE () AND
Federated Investors, Inc. Analyst Update
 Stability Investment Solutions Diligence Federated Investors, Inc. Analyst Update Data as of March 31, 2018 4/18; data as of 3/31/18 18-74239 Forward-Looking Information This presentation is provided as
Report to Investment Committee
 Report to Investment Committee Agenda of: SEPTEMBER 12, 2017 From: Thomas Moutes, General Manager ITEM: VI SUBJECT: INVESTMENT MANAGER CONTRACT WITH PANAGORA ASSET MANAGEMENT, INC. REGARDING THE MANAGEMENT
Additional series available. Morningstar TM Rating. Funds in category. Equity style Market cap %
 Sun Life BlackRock Canadian Composite Equity Class Series A $11.6889 CAD Net asset value per security (NAVPS) as of August 31, 2018 $-0.0752-0.64% Benchmark S&P/TSX Capped Composite Index Fund category
Total
 The following report provides in-depth analysis into the successes and challenges of the Northcoast Tactical Growth managed ETF strategy throughout 2017, important research into the mechanics of the strategy,
Additional series available. Morningstar TM Rating - Funds in category. Fixed income % of fixed income allocation
 Sun Life Excel India Balanced Fund Series A Additional series available Note: On June 18, 2018, the Excel India Balanced Fund changed its name to the Sun Life Excel India Balanced Fund. $5.7621 CAD Net
Dividend Investing Review Dividend Builder Fund Review of the 4th Quarter 2015
 Dividend Investing Review Dividend Builder Fund Review of the 4th Quarter 2015 Investing in Human Progress Fund manager biographies 2 Matthew Page, CFA Portfolio manager of strategy since 2010 Joined Guinness
MUTUAL FUND RESEARCH PROCESS
 Identifying high quality managers // Clearly defined process KEY TAKEAWAYS Raymond James believes providing in-depth, unbiased research is an important tool for making the best investment decisions possible.
Invesco third quarter 2013 results
 Invesco third quarter 2013 results Martin L. Flanagan President and Chief Executive Officer Loren M. Starr Chief Financial Officer October 31, 2013 Forward-looking statements This presentation, and comments
Mutual Fund Research Process
 Mutual Fund Research Process Identifying high-quality managers // Clearly defined process KEY TAKEAWAYS Raymond James believes that providing in-depth, unbiased research is an important tool for making
Additional series available. Morningstar TM Rating. Funds in category. Equity style Market cap % Micro 0.0. Global equity sectors * %
 Sun Life Dynamic Energy Fund Series A $9.3147 CAD Net asset value per security (NAVPS) as of September 14, 2018 $-0.0059-0.06% Benchmark S&P/TSX Capped Energy Index Fund category Energy Equity Additional
Introducing BlackRock's Target Allocation ETF Models
 Introducing BlackRock's Target Allocation ETF Models Eve Cout Director, Managed Accounts Business Thomas Wood, CFA Lead Strategist, US Model Portfolios Tuesday January 23 rd, 2018 BENEFIT # 1 Scale and
Death, Taxes and Short-Term Underperformance: Emerging Market Funds
 Death, Taxes and Short-Term Underperformance: Emerging Market Funds In this world nothing can be said to be certain, except death and taxes. 1 Benjamin Franklin March 2018 Since the Brandes Institute first
Tactical Growth ETF. Investor Presentation N ORTHC OAST I NVESTMENT A DVISORY T EAM NORTHCOASTAM. COM
 Tactical Growth ETF Investor Presentation N ORTHC OAST I NVESTMENT A DVISORY T EAM 203.532.7000 INFO@ NORTHCOASTAM. COM NORTHCOAST ASSET MANAGEMENT An established leader in the field of tactical investment
2018 PUBLIC EQUITY ASSET CLASS REVIEW CITY OF FRESNO RETIREMENT SYSTEMS
 Agenda Item: D-2 Joint Meeting of the Retirement Boards Meeting Date: June 27, 2018 2018 PUBLIC EQUITY ASSET CLASS REVIEW CITY OF FRESNO RETIREMENT SYSTEMS June 26, 2018 Tony Ferrara, CAIA, Consultant
Additional series available. Morningstar TM Rating. Funds in category. Fixed inc style Credit quality %
 Sun Life Excel High Income Fund Series A Additional series available Note: On June 18, 2018, the Excel High Income Fund changed its name to the Sun Life Excel High Income Fund. $4.5462 CAD Net asset value
Global Investing DIVERSIFYING INTERNATIONAL EQUITY ALLOCATIONS WITH SMALL-CAP STOCKS
 PRICE PERSPECTIVE June 2016 In-depth analysis and insights to inform your decision-making. Global Investing DIVERSIFYING INTERNATIONAL EQUITY ALLOCATIONS WITH SMALL-CAP STOCKS EXECUTIVE SUMMARY International
9/1/ /1/1977 9/1/ /1/ /1/1963
 CAPITAL IDEAS It Pays to Collect Dividends Executive Summary Dividend income makes up a significant portion of total return over long time periods. 18.0% 16.0% 14.0% 12.0% 10.0% Figure 1: Dividend Yield