THE DATA BEHIND THE BUZZWORDS FOR ASSET MANAGERS
|
|
|
- Hester Beasley
- 5 years ago
- Views:
Transcription
1 THE DATA BEHIND THE BUZZWORDS FOR ASSET MANAGERS February 11, 2015 John Molesphini John Alexander, CFA
2 Today s Presentation Agenda Sales and marketing challenges Pitfalls of complex terminology Dive into data on select trends evestment s approach to measuring success
3 The Challenge of Institutional Sales: A Three Part Equation Competitive factors: - Sales ability - Longevity -Branding Macro Factors: - Asset Class Trends - Geographic Activity - Investor Herding Micro Factors: - Performance - Capacity - Characteristics

4 The Challenge of Institutional Sales: Micro Factors
5 The Challenge of Institutional Sales: Macro Factors
6 The Winds of Change are Constant The nomenclature of institutional investing is always changing. Our job as professionals is to look critically past the lingo and use discernment.

7 The Alternative Taking the terminology du jour at face value can be costly


8 Our Approach
9 So What Are Today s Definable Trends? Concentrated Equity Strategies The Search for Yield in Fixed Income Globalization of Portfolios (both Equity and Fixed) Low Volatility Equity Smart Beta/Enhanced Indexing Liability-Driven Investing Listed Infrastructure Environmental, Social, Governance (ESG) Constraints Dedicated Frontier Markets
10 Theme #1: Concentrated vs. Non-concentrated Equity Conventional Wisdom: Institutional investors increasingly prefer high active share managers who look very different from their benchmarks. Low Active Share High Active Share Stock A Stock B Stock C Stock D Stock E Stock F Stock G Stock H Stock I Stock J Stock K Stock L Stock M Stock N Stock O Stock P Stock Q Stock R Stock S Stock T non-benchmark Cash Stock A Stock B Stock C Stock D Stock E Stock F Stock G Stock H Stock I Stock J Portfolio Stock K Benchmark Stock L Stock M Stock N Stock O Stock P Stock Q Stock R Stock S Stock T non-benchmark Cash
11 Theme #1: Concentrated vs. Non-concentrated Equity Methodology: Sort select universes into concentrated and non-concentrated buckets and ascertain trends over five years Top 25% Most Concentrated Portfolios Remaining 75% Least Concentrated Portfolios Bucket #1 Bucket #2
12 Theme #1: Concentrated vs. Non-concentrated Equity 100% Share of Consultant Viewership-Global All Cap 90% 80% 70% 60% 50% 40% 30% 20% 10% 0% Concentrated Unconcentrated
13 Theme #1: Concentrated vs. Non-concentrated Equity 100% Share of Consultant Viewership-Global Large Cap 90% 80% 70% 60% 50% 40% 30% 20% 10% 0% Concentrated Unconcentrated
14 Theme #1: Concentrated vs. Non-concentrated Equity 100% Share of Consultant Viewership-ACWI ex-us Large Cap 90% 80% 70% 60% 50% 40% 30% 20% 10% 0% Concentrated Unconcentrated
15 Theme #1: Concentrated vs. Non-concentrated Equity 100% Share of Consultant Viewership-US Large Cap 90% 80% 70% 60% 50% 40% 30% 20% 10% 0% Concentrated Unconcentrated
16 Theme #1: Concentrated vs. Non-concentrated Equity 100% Share of Consultant Viewership-Canadian Large Cap 90% 80% 70% 60% 50% 40% 30% 20% 10% 0% Concentrated Unconcentrated
17 Theme #1: Concentrated vs. Non-concentrated Equity 100% Share of Consultant Viewership--EM-All Cap 90% 80% 70% 60% 50% 40% 30% 20% 10% 0% Concentrated Unconcentrated
18 Theme #1: Concentrated vs. Non-concentrated Equity 100% Share of Consultant Viewership-EM Large Cap 90% 80% 70% 60% 50% 40% 30% 20% 10% 0% Concentrated Unconcentrated
19 Theme #1: Concentrated vs. Non-concentrated Equity Q Q Q Q Q Q Q Q Q Q Q Q Q Q Q Q ACWI Ex-US All Cap 1.35% 0.28% -1.82% -1.67% -1.50% -0.12% 0.98% 0.75% 1.46% 2.67% 3.36% -3.30% -0.06% -0.69% 0.03% 0.43% ACWI Ex-US Large Cap 0.42% 0.75% -0.53% -0.38% -1.33% -2.73% -1.28% 0.89% 1.12% -0.78% 1.40% 2.07% 1.91% 2.97% 2.12% 0.11% Canadian All Cap -3.20% -2.36% -0.76% -0.05% 1.15% 1.02% 2.64% 1.43% 3.25% 0.81% -0.89% 0.04% 3.30% 0.67% -0.26% -0.54% Canadian Large Cap 4.53% -3.29% -0.54% -2.01% -1.49% 3.55% 9.75% -3.28% -1.77% -0.18% -2.15% -0.32% 3.70% 0.29% -2.00% 7.62% EAFE All Cap 0.38% 0.01% 0.87% 1.24% -0.17% 2.54% 0.63% 0.64% 0.80% -0.03% 0.70% -0.08% 0.25% -0.29% -1.25% -0.56% EAFE Large Cap 1.42% 1.53% 0.96% 0.58% 0.64% 0.54% 0.79% 1.03% 0.91% -0.78% 0.99% -0.97% 0.00% -0.64% 0.32% -1.13% Emerging Markets All Cap -1.98% -0.61% -1.79% -2.05% -2.75% -1.60% -1.28% -1.29% -2.03% -0.51% -0.17% -0.71% -0.06% -0.75% -0.15% -0.38% Emerging Markets Large Cap -0.90% 0.58% 1.48% 0.64% 2.78% -0.99% -0.49% 0.92% -0.72% -0.72% 1.80% -2.53% 0.01% 1.12% -0.31% -1.21% Global All Cap 0.06% -0.05% -0.32% -0.76% -0.46% 0.68% -0.16% -0.80% 0.52% 0.22% -0.55% -0.80% -0.38% -0.34% -0.31% 2.22% Global Large Cap -0.67% 1.83% 0.04% 1.54% 1.03% 1.23% 4.27% 4.32% 4.20% 2.43% 1.54% 2.10% 0.16% -0.15% 0.44% -0.89% Pan Europe All Cap 0.08% -4.57% 3.34% 0.91% -3.82% 4.84% -0.34% 3.28% 0.62% 0.76% 1.42% 2.14% 0.32% 2.20% -5.63% 2.32% Pan Europe Large Cap 2.04% 1.87% -0.35% 7.04% 0.03% -6.79% 4.52% -0.72% 0.51% 2.06% 1.12% 2.23% 0.08% -2.10% 8.96% -0.24% US All Cap -0.79% 0.40% 1.30% -1.08% 0.11% 1.78% 0.50% 0.50% 1.86% -0.48% 2.11% 1.98% 2.06% -4.75% 3.22% 1.32% US Large Cap 1.60% 0.86% 1.20% 1.64% 1.49% 0.64% 1.26% 1.58% 1.26% 1.49% 1.74% 1.66% 0.97% -1.39% 0.06% -0.34% US Micro Cap -0.63% 0.80% 2.41% 1.07% 2.21% 1.30% 2.54% 1.20% 2.27% 0.38% 3.55% 1.52% 1.96% % 3.81% 3.14% US Mid Cap -0.70% 0.73% 1.39% 1.31% 0.01% -0.18% 0.21% -0.44% -0.86% -0.13% -0.43% 0.34% -0.19% 0.25% 0.36% 0.77% US Small Cap 1.13% 0.26% 0.62% 1.11% 0.77% -0.25% 0.24% 1.06% 0.27% -0.50% 1.14% 0.93% 1.39% 0.73% 0.40% 1.39% US SMID Cap -0.67% 1.25% 1.16% 0.48% -0.17% -0.30% 2.66% 1.83% 1.74% 1.03% 1.17% 1.91% -0.34% 0.27% 2.10% -0.23% Methodology: Normalizing for universe size and product size, the % indicated in the table above represents the +/- flow benefit for being in the top quartile most concentrated strategies in the universe Application: Avg US Large Cap Equity strategy AUM =$1.3 Billion A 1.60% flow benefit in Q means the average flow for a given concentrated strategy was $21 million (1.3Bn * 1.6%) greater than a given non-concentrated strategy in that quarter


20 Theme #1: Concentrated vs. Non-concentrated Equity Q Q Q Q Q Q Q Q Q Q Q Q Q Q Q Q ACWI Ex-US All Cap 1.35% 0.28% -1.82% -1.67% -1.50% -0.12% 0.98% 0.75% 1.46% 2.67% 3.36% -3.30% -0.06% -0.69% 0.03% 0.43% ACWI Ex-US Large Cap 0.42% 0.75% -0.53% -0.38% -1.33% -2.73% -1.28% 0.89% 1.12% -0.78% 1.40% 2.07% 1.91% 2.97% 2.12% 0.11% Canadian All Cap -3.20% -2.36% -0.76% -0.05% 1.15% 1.02% 2.64% 1.43% 3.25% 0.81% -0.89% 0.04% 3.30% 0.67% -0.26% -0.54% Canadian Large Cap 4.53% -3.29% -0.54% -2.01% -1.49% 3.55% 9.75% -3.28% -1.77% -0.18% -2.15% -0.32% 3.70% 0.29% -2.00% 7.62% EAFE All Cap 0.38% 0.01% 0.87% 1.24% -0.17% 2.54% 0.63% 0.64% 0.80% -0.03% 0.70% -0.08% 0.25% -0.29% -1.25% -0.56% EAFE Large Cap 1.42% 1.53% 0.96% 0.58% 0.64% 0.54% 0.79% 1.03% 0.91% -0.78% 0.99% -0.97% 0.00% -0.64% 0.32% -1.13% Emerging Markets All Cap -1.98% -0.61% -1.79% -2.05% -2.75% -1.60% -1.28% -1.29% -2.03% -0.51% -0.17% -0.71% -0.06% -0.75% -0.15% -0.38% Emerging Markets Large Cap -0.90% 0.58% 1.48% 0.64% 2.78% -0.99% -0.49% 0.92% -0.72% -0.72% 1.80% -2.53% 0.01% 1.12% -0.31% -1.21% Global All Cap 0.06% -0.05% -0.32% -0.76% -0.46% 0.68% -0.16% -0.80% 0.52% 0.22% -0.55% -0.80% -0.38% -0.34% -0.31% 2.22% Global Large Cap -0.67% 1.83% 0.04% 1.54% 1.03% 1.23% 4.27% 4.32% 4.20% 2.43% 1.54% 2.10% 0.16% -0.15% 0.44% -0.89% Pan Europe All Cap 0.08% -4.57% 3.34% 0.91% -3.82% 4.84% -0.34% 3.28% 0.62% 0.76% 1.42% 2.14% 0.32% 2.20% -5.63% 2.32% Pan Europe Large Cap 2.04% 1.87% -0.35% 7.04% 0.03% -6.79% 4.52% -0.72% 0.51% 2.06% 1.12% 2.23% 0.08% -2.10% 8.96% -0.24% US All Cap -0.79% 0.40% 1.30% -1.08% 0.11% 1.78% 0.50% 0.50% 1.86% -0.48% 2.11% 1.98% 2.06% -4.75% 3.22% 1.32% US Large Cap 1.60% 0.86% 1.20% 1.64% 1.49% 0.64% 1.26% 1.58% 1.26% 1.49% 1.74% 1.66% 0.97% -1.39% 0.06% -0.34% US Micro Cap -0.63% 0.80% 2.41% 1.07% 2.21% 1.30% 2.54% 1.20% 2.27% 0.38% 3.55% 1.52% 1.96% % 3.81% 3.14% US Mid Cap -0.70% 0.73% 1.39% 1.31% 0.01% -0.18% 0.21% -0.44% -0.86% -0.13% -0.43% 0.34% -0.19% 0.25% 0.36% 0.77% US Small Cap 1.13% 0.26% 0.62% 1.11% 0.77% -0.25% 0.24% 1.06% 0.27% -0.50% 1.14% 0.93% 1.39% 0.73% 0.40% 1.39% US SMID Cap -0.67% 1.25% 1.16% 0.48% -0.17% -0.30% 2.66% 1.83% 1.74% 1.03% 1.17% 1.91% -0.34% 0.27% 2.10% -0.23% In two universes, Global All Cap and Global Emerging Markets All Cap, being more concentrated negatively impacted institutional asset flows.
21 Theme #1: Concentrated vs. Non-concentrated Equity Q Q Q Q Q Q Q Q Q Q Q Q Q Q Q Q ACWI Ex-US All Cap 1.35% 0.28% -1.82% -1.67% -1.50% -0.12% 0.98% 0.75% 1.46% 2.67% 3.36% -3.30% -0.06% -0.69% 0.03% 0.43% ACWI Ex-US Large Cap 0.42% 0.75% -0.53% -0.38% -1.33% -2.73% -1.28% 0.89% 1.12% -0.78% 1.40% 2.07% 1.91% 2.97% 2.12% 0.11% Canadian All Cap -3.20% -2.36% -0.76% -0.05% 1.15% 1.02% 2.64% 1.43% 3.25% 0.81% -0.89% 0.04% 3.30% 0.67% -0.26% -0.54% Canadian Large Cap 4.53% -3.29% -0.54% -2.01% -1.49% 3.55% 9.75% -3.28% -1.77% -0.18% -2.15% -0.32% 3.70% 0.29% -2.00% 7.62% EAFE All Cap 0.38% 0.01% 0.87% 1.24% -0.17% 2.54% 0.63% 0.64% 0.80% -0.03% 0.70% -0.08% 0.25% -0.29% -1.25% -0.56% EAFE Large Cap 1.42% 1.53% 0.96% 0.58% 0.64% 0.54% 0.79% 1.03% 0.91% -0.78% 0.99% -0.97% 0.00% -0.64% 0.32% -1.13% Emerging Markets All Cap -1.98% -0.61% -1.79% -2.05% -2.75% -1.60% -1.28% -1.29% -2.03% -0.51% -0.17% -0.71% -0.06% -0.75% -0.15% -0.38% Emerging Markets Large Cap -0.90% 0.58% 1.48% 0.64% 2.78% -0.99% -0.49% 0.92% -0.72% -0.72% 1.80% -2.53% 0.01% 1.12% -0.31% -1.21% Global All Cap 0.06% -0.05% -0.32% -0.76% -0.46% 0.68% -0.16% -0.80% 0.52% 0.22% -0.55% -0.80% -0.38% -0.34% -0.31% 2.22% Global Large Cap -0.67% 1.83% 0.04% 1.54% 1.03% 1.23% 4.27% 4.32% 4.20% 2.43% 1.54% 2.10% 0.16% -0.15% 0.44% -0.89% Pan Europe All Cap 0.08% -4.57% 3.34% 0.91% -3.82% 4.84% -0.34% 3.28% 0.62% 0.76% 1.42% 2.14% 0.32% 2.20% -5.63% 2.32% Pan Europe Large Cap 2.04% 1.87% -0.35% 7.04% 0.03% -6.79% 4.52% -0.72% 0.51% 2.06% 1.12% 2.23% 0.08% -2.10% 8.96% -0.24% US All Cap -0.79% 0.40% 1.30% -1.08% 0.11% 1.78% 0.50% 0.50% 1.86% -0.48% 2.11% 1.98% 2.06% -4.75% 3.22% 1.32% US Large Cap 1.60% 0.86% 1.20% 1.64% 1.49% 0.64% 1.26% 1.58% 1.26% 1.49% 1.74% 1.66% 0.97% -1.39% 0.06% -0.34% US Micro Cap -0.63% 0.80% 2.41% 1.07% 2.21% 1.30% 2.54% 1.20% 2.27% 0.38% 3.55% 1.52% 1.96% % 3.81% 3.14% US Mid Cap -0.70% 0.73% 1.39% 1.31% 0.01% -0.18% 0.21% -0.44% -0.86% -0.13% -0.43% 0.34% -0.19% 0.25% 0.36% 0.77% US Small Cap 1.13% 0.26% 0.62% 1.11% 0.77% -0.25% 0.24% 1.06% 0.27% -0.50% 1.14% 0.93% 1.39% 0.73% 0.40% 1.39% US SMID Cap -0.67% 1.25% 1.16% 0.48% -0.17% -0.30% 2.66% 1.83% 1.74% 1.03% 1.17% 1.91% -0.34% 0.27% 2.10% -0.23% In six universes, being more concentrated had a strong positive impact on institutional asset flows. In many of these universes the percentage difference in institutional flows represents an incremental flow per product of > $10 MM/quarter

22 Theme #2: The Search for Yield in Fixed Income Conventional Wisdom: As bond yields have decreased, institutional investors are turning their attention away from plain vanilla fixed income towards unconstrained, global or niche products.
23 Theme #2: The Search for Yield in Fixed Income The evestment All US Fixed Income Universe viewership has marched slowly higher over the past four years
24 Theme #2: The Search for Yield in Fixed Income But how much of the sustained interest in US Fixed Income is due to heightened interest in High Yield, Floating Rate Bank Loans and Long Duration mandates (LDI)??
25 Theme #2: The Search for Yield in Fixed Income On balance, diversified US Fixed Income consultant views dropped from 80% of total activity to roughly 56% of activity before rebounding to ~73%
26 Jan-10 Mar-10 May-10 Jul-10 Sep-10 Nov-10 Jan-11 Mar-11 May-11 Jul-11 Sep-11 Nov-11 Jan-12 Mar-12 May-12 Jul-12 Sep-12 Nov-12 Jan-13 Mar-13 May-13 Jul-13 Sep-13 Nov-13 Jan-14 Mar-14 May-14 Jul-14 Sep-14 Nov-14 Jan-15 Theme #2: The Search for Yield in Fixed Income Interest in Global Fixed Income has grown roughly 4X since A large part of this has been the emergence of Global Unconstrained Fixed Income, making up roughly 1/3 of viewership more recently Global Fixed Income Viewership evestment All Global Fixed Income evestment Global High Yield Fixed Income evestment Global Unconstrained Fixed Income

27 Theme #2: The Search for Yield in Fixed Income Unconstrained is still very much undefined. Our data collection tells us that the industry has not figured out how best to analyze these strategies.


28 Theme #3: Specific Geography vs Global Product Demand


29 Theme #3: Specific Geography vs Global Product Demand Our Asset Flows Forecasting indicates that the trend towards globalization of portfolios will continue on its current path.


30 Theme #3: Specific Geography vs Global Product Demand For domestic equity/fixed managers, the macro trend is negative but areas of opportunity are out there. Don t ignore your global audience: 9% of interest in US Equity comes from abroad 25% of interest in UK Equity comes from abroad 11% of interest in CAD Equity comes from abroad 9% of US High Yield interest comes from abroad Get acquainted with all of the potential buyers: US Equity had net positive flows from Sov. Wealth, Union Plans and Superannuation Funds in 4Q 2014 UK Equity had net > 1 BN positive flows from Foundations and Corporate Plans in 4Q 2014


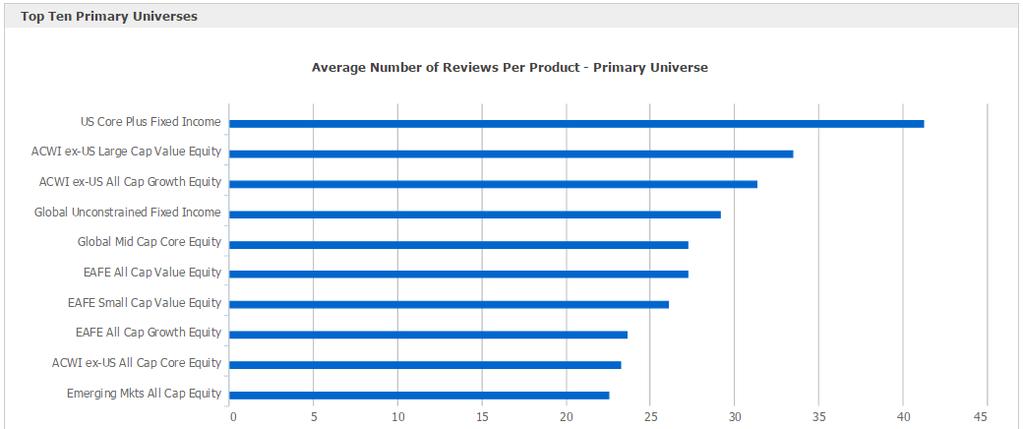
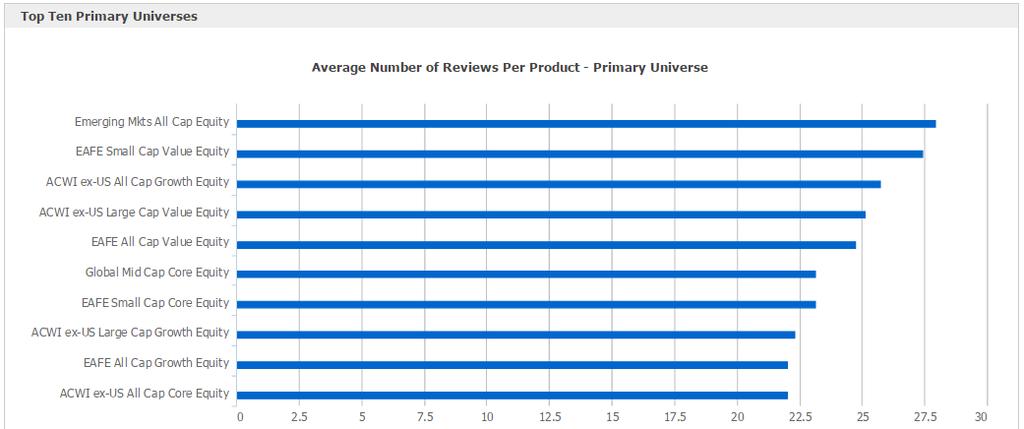
31 Theme #3: Specific Geography vs Global Product Demand For international/global/emerging managers, the macro trends are at your back. Make sure you seize your share of the market while this is the case. Seven EM Equity products command 31% of the institutional assets. If you aren t one of these firms, how does this impact you? Global Fixed Income Flows have been regionally strong in Japan and the Middle East. Are you currently marketing to these regions? Close to 4% of consultant viewership of the Global Fixed Income universe comes from Asia ex-japan evestment is forecasting roughly $12 Billion of net institutional inflows into Global TIPS/Inflation Protected Fixed Income in the coming four quarters.
32 The Challenge of Institutional Sales: A Three Part Equation Competitive factors: - Sales ability - Longevity -Branding Macro Factors: Micro Factors: - Asset Class Trends - Geographic Activity - Investor Herding -Performance -Capacity -Characteristics
33 The Challenge of Institutional Sales: A Three Part Equation Competitive factors: - Sales ability - Longevity -Branding Macro Factors: - Asset Class Trends - Geographic Activity - Investor Herding Micro Factors: -Performance -Capacity -Characteristics


34 Introducing: evestment Scorecard Our First-ever Look Into Firm-Specific Competitive Metrics Scorecard ties together all of evestment s data sources to answer critical questions regarding your business.

35 Questions? Use the Best Institutional Intelligence & Analysis
GENERATING ALPHA IN INSTITUTIONAL SALES & DISTRIBUTION
 GENERATING ALPHA IN INSTITUTIONAL SALES & DISTRIBUTION Andrew Bevan, CFA, CAIA Formerly in Business Development Horizon Kinetics LLC Maria Simon Formerly in Institutional Marketing Local Tapiola Asset
THE ACTIVE SHARE DEBATE WEBINAR. Presented by John Alexander, CFA Billy Welsh
 THE ACTIVE SHARE DEBATE WEBINAR Presented by John Alexander, CFA Billy Welsh Today s Speakers John Alexander, CFA Solutions Specialist evestment Billy Welsh Client Strategist evestment jalexander@evestment.com
EVESTMENT INSTITUTIONAL INVESTMENT INTELLIGENCE CONFERENCE
 EVESTMENT INSTITUTIONAL INVESTMENT INTELLIGENCE CONFERENCE 2018 Trends Update: Industry Themes Data Driven Insight Peter Laurelli Global Head of Research, evestment John Molesphini Global Head of Strategic
CONSULTANT BRIEFING. New York City April 20, Chris Riley, Aon Hewitt John Molesphini, evestment Jerrod Stoller, evestment
 CONSULTANT BRIEFING New York City April 20, 2017 Chris Riley, Aon Hewitt John Molesphini, evestment Jerrod Stoller, evestment Fee Pressure Low Yield 2016 BREXIT Market Volatility Active vs. Passive Presidential
Asset Flows Report Q June 7, Summary
 Asset Flows Report June 7, Summary evestment s Traditional Asset Flows Report shows the flow of institutional funds across investment strategies, regions, and investor types. Investor flows are calculated
MSCI ENVIRONMENTAL, SOCIAL & GOVERNANCE (ESG) INDEXES. A modern approach to ESG indexes
 INDEXES. A modern approach to ESG indexes") MSCI ENVIRONMENTAL, SOCIAL & GOVERNANCE (ESG) INDEXES A modern approach to ESG indexes MSCI ESG UNIVERSAL INDEXES The new MSCI ESG Universal Indexes are a modern way of indexing, and are designed to address
MSCI ENVIRONMENTAL, SOCIAL & GOVERNANCE (ESG) INDEXES A modern approach to ESG indexes MSCI ESG UNIVERSAL INDEXES The new MSCI ESG Universal Indexes are a modern way of indexing, and are designed to address
Economic Exposure Indices:
 Economic Exposure Indices: The Future of Country- Based Analysis Matt Hougan Executive Vice President, Global Head of Content IndexUniverse Raman Aylur Subramanian, CFA Executive Director, Index Applied
EVESTMENT BREAKFAST SEMINAR
 EVESTMENT BREAKFAST SEMINAR Toronto March 21, 2017 Ryan Anderson, Pavilion John Molesphini, evestment Jerrod Stoller, evestment Gaining an Understanding of Your Competitive Landscape Case Study Effective
MSCI ENVIRONMENTAL, SOCIAL & GOVERNANCE (ESG) INDEXES. A modern approach to ESG indexes
 INDEXES. A modern approach to ESG indexes") MSCI ENVIRONMENTAL, SOCIAL & GOVERNANCE (ESG) INDEXES A modern approach to ESG indexes MSCI ESG INDEXES With indexes that represent the performance of the most relevant environmental, social and governance
MSCI ENVIRONMENTAL, SOCIAL & GOVERNANCE (ESG) INDEXES A modern approach to ESG indexes MSCI ESG INDEXES With indexes that represent the performance of the most relevant environmental, social and governance
Portfolio Construction Including ETFs: Impressive Opportunities and Clear Benefits
 Portfolio Construction Including ETFs: Impressive Opportunities and Clear Benefits Rohit Mehta Executive Vice-President, Distribution & Strategy First Asset Investment Management, Inc. ETF AUM over the
Asset Flows Report Q March 8, Summary
 Asset Flows Report March 8, 2018 Summary evestment s Traditional Asset Flows Report shows the flow of institutional funds across investment strategies, regions, and investor types. Investor flows are calculated
Traditional Asset Flows Report Second Quarter 2016
 Traditional Asset Flows Report Second Quarter 2016 September 15, 2016 Summary This report shows the flow of institutional funds across regions, universes and products based on data reported to evestment
Global Investing DIVERSIFYING INTERNATIONAL EQUITY ALLOCATIONS WITH SMALL-CAP STOCKS
 PRICE PERSPECTIVE June 2016 In-depth analysis and insights to inform your decision-making. Global Investing DIVERSIFYING INTERNATIONAL EQUITY ALLOCATIONS WITH SMALL-CAP STOCKS EXECUTIVE SUMMARY International
WAYS INTERNATIONAL INVESTING IS CHANGING
 5 WAYS INTERNATIONAL INVESTING IS CHANGING Today s headlines can be distracting. In 2018 alone, world markets are wrestling with any number of geopolitical challenges, including bubbling debt, trade and
Risk Has Trended Down... So Should I Be Nervous?
 Risk Has Trended Down... So Should I Be Nervous? Presentation to QWAFAFEW Melissa R. Brown, CFA Senior Director of Applied Research, Axioma January 8, 2013 Agenda Risk fell dramatically throughout 2012,
VT Vanguard Total World Stock ETF
 Vanguard Total World Stock ETF ETF.com segment: Equity: Global - Total Market Competing ETFs: ACWI, MJ, XMX, ACIM, DRIV Related ETF Channels: Total Market, Broad-based, Vanilla, Global, Equity, Size and
ASSET FLOWS REPORT. Second Quarter 2015
 ASSET FLOWS REPORT Second Quarter 2015 About the evestment Asset Flows Report Asset Flows Report This report is intended to show the flow of institutional funds across regions, universes and products.
Market Update: Broad Market Returns and Indicators
 Market Update Eckler Ltd. collects information directly from sources believed to be reliable. Eckler Ltd. does not guarantee or warrant the accuracy, timeliness, or completeness of the information either
HOW DO YOU DEFINE YOUR BORDERS? THE MODERN INDEX STRATEGY. msci.com
 HOW DO YOU DEFINE YOUR BORDERS? THE MODERN INDEX STRATEGY msci.com MSCI DELIVERS THE MODERN INDEX STRATEGY The MSCI EAFE Index is designed to represent the performance of large- and mid-cap securities
M&A IN THE ASSET MANAGEMENT SPACE: USING INSTITUTIONAL DATA TO EVALUATE OPPORTUNITIES
 M&A IN THE ASSET MANAGEMENT SPACE: USING INSTITUTIONAL DATA TO EVALUATE OPPORTUNITIES 1 Executive Summary The institutional asset management industry is going through a disruption, which is likely to impact
J U P I T E R 2018 Interim Results
 J U P I T E R 2018 Interim Results Introduction 1 Maintaining shareholder returns Delivering growth through investment excellence Net Management Fees Underlying Earnings per Share Net Sales Investment
SIL Global X Silver Miners ETF
 Global X Silver Miners ETF ETF.com segment: Equity: Global Silver Miners Competing ETFs: SLVP, J Related ETF Channels: Silver, Vanilla, Global, Equity, Sectors, Silver Miners Find more ETFs with our ETF
ROBO ROBO Global Robotics and Automation Index ETF
 Global Robotics and Automation Index ETF ETF.com segment: Equity: Global - Total Market Competing ETFs: LEGR, ROBT, FANZ, VT, ACWI Related ETF Channels: Equal-Weighted, Smart-Beta ETFs, Total Market, Broad-based,
The Mercantile Investment Trust plc Investment Trust Adviser Seminar
 The Mercantile Investment Trust plc Investment Trust Adviser Seminar October 2015 FOR PROFESSIONAL CLIENTS ONLY NOT FOR RETAIL USE OR DISTRIBUTION Agenda Overview of fund strategy Benefits of investment
City of Toronto Investment Report for 2017 and the First Quarter of 2018 and Policy Update
 EX35.16 REPORT FOR ACTION City of Toronto Investment Report for 2017 and the First Quarter of 2018 and Policy Update Date: June 5, 2018 To: Executive Committee From: Interim Chief Financial Officer Wards:
VIDI Vident International Equity Fund
 Vident International Equity Fund ETF.com segment: Equity: Global Ex-U.S. - Total Market Competing ETFs: IQDF, IFV, MOTI, IQDE, IQDY Related ETF Channels: Smart-Beta ETFs, Total Market, Broad-based, Multi-factor,
MSCI. J.P. Morgan Global High Yield & Leveraged Finance Conference Kathleen Winters, CFO. February 28, 2017
 MSCI J.P. Morgan Global High Yield & Leveraged Finance Conference Kathleen Winters, CFO February 28, 2017 2017 MSCI Inc. All rights reserved. Please refer to the disclaimer at the end of this document.
EXPERT SERIES STRATEGIC BETA IN EMERGING MARKETS
 NOVEMBER 2016 EXPERT SERIES STRATEGIC BETA IN EMERGING MARKETS Highlights There is an opportunity for investors in EM to implement a rules-based investment process that reflects the systemization of alpha
Alternative Manager Delivering Risk Adjusted Upper Quartile Returns
 Alternative Manager Delivering Risk Adjusted Upper Quartile Returns Contents 1. Overview 3 2. Expansion Strategy 12 3. Summary 17 Exhibit I - Market Opportunity 20 www. steppesalternativeassetmanagement
UWINCO Board Update and Investment Performance Quarterly Report Quarter Ended September 30, 2017
 STANDING COMMITTEES F 9 Finance and Asset Management Committee UWINCO Board Update and Investment Performance Quarterly Report Quarter Ended September 30, 2017 INFORMATION This item is being presented
OMAM. Investor Presentation. Fourth Quarter 2014
 OMAM Investor Presentation Fourth Quarter 2014 DISCLAIMER Forward Looking Statements This presentation may contain forward looking statements for the purposes of the safe harbor provision under the Private
Monthly European ETF Market Trends 2013 in brief
 LYXOR ETF BAROMETER JANUARY 214 Monthly European ETF Market Trends 213 in brief Lyxor ETF Marlène Hassine Head of ETF Research +33 1 42 13 59 56 marlene.hassine@lyxor.com 213 has been another strong year
Down, Set, Hut! Quarterbacking your LDI Program. Martin Jaugietis, CFA Managing Director, LDI Solutions, Russell Investments
 Down, Set, Hut! Quarterbacking your LDI Program Martin Jaugietis, CFA Managing Director, LDI Solutions, Russell Investments Funded Ratios (%) The end zone is getting closer funding levels have improved
2015 Market Review & Outlook. January 29, 2015
 2015 Market Review & Outlook January 29, 2015 Economic Outlook Jason O. Jackman, CFA President & Chief Investment Officer Percentage Interest Rates Unexpectedly Decline 4.5 10-Year Government Yield 4 3.5
ASET FlexShares Real Assets Allocation Index Fund
 FlexShares Real Assets Allocation Index Fund ETF.com segment: Equity: Global - Total Market Competing ETFs: QXGG, FVC, DWLV, VT, ACWI Related ETF Channels: Trend-Following, Size and Style, Smart-Beta ETFs,
IBUY Amplify Online Retail
 Amplify Online Retail ETF.com segment: Equity: Global Retail Competing ETFs: RTH Related ETF Channels: Equal-Weighted, Smart-Beta ETFs, Global, Equity, Sectors, Consumer Discretionary, Consumer Cyclicals,
LVHI Legg Mason International Low Volatility High Dividend ETF
 Legg Mason International Low Volatility High Dividend ETF ETF.com segment: Equity: Developed Markets Ex-U.S. - Total Market Competing ETFs: IHDG, JPIH, DHDG, FLQH, DBEF Related ETF Channels: Developed
Ewing Morris Opportunities Fund LP
 Ewing Morris Opportunities Fund LP An investment partnership managed by Ewing Morris & Co. Investment Partners Ltd. Investor Presentation December 2017 Ewing Morris & Co. Investment Partners Ltd. 1407
ABU DHABI INVESTMENT AUTHORITY
 ABU DHABI INVESTMENT AUTHORITY Managing More of its Assets Internally and Taking a More Active Approach to Investing Than Ever Before SPECIAL REPORT +1-877-588-5030 sales@ipreo.com www.ipreo.com As Sovereign
ACWX ishares MSCI ACWI ex U.S. ETF
 ishares MSCI ACWI ex U.S. ETF ETF.com segment: Equity: Global Ex-U.S. - Total Market Competing ETFs: CWI, VEU, VXUS, IXUS, DBAW Related ETF Channels: Total Market, Vanilla, Equity, Global Ex-US, Size and
ASSET FLOWS REPORT. First Quarter 2016
 ASSET FLOWS REPORT First Quarter 2016 About the evestment Asset Flows Report Asset Flows Report This report is intended to show the flow of institutional funds across regions, universes and products. We
ACWX ishares MSCI ACWI ex U.S. ETF
 ishares MSCI ACWI ex U.S. ETF ETF.com segment: Equity: Global Ex-U.S. - Total Market Competing ETFs: CWI, VEU, VXUS, IXUS, DBAW Related ETF Channels: Total Market, Broad-based, Vanilla, Equity, Global
Executive Summary. July 17, 2015
 Executive Summary July 17, 2015 The Revenue Estimating Conference adopted interest rates for use in the state budgeting process. The adopted interest rates take into consideration current benchmark rates
Federated Investors, Inc. Analyst Update
 Stability Investment Solutions Diligence Federated Investors, Inc. Analyst Update Data as of December 31, 2018 19-10010 Forward-Looking Information This presentation is provided as of the date on the cover.
ISCF ishares Edge MSCI Multifactor Intl Small-Cap ETF
 ishares Edge MSCI Multifactor Intl Small-Cap ETF ETF.com segment: Equity: Developed Markets Ex-U.S. - Small Cap Competing ETFs: FDTS, SCZ, SCHC, GWX, FNDC Related ETF Channels: Developed Markets Ex-U.S.,
DWX SPDR S&P International Dividend ETF
 SPDR S&P International Dividend ETF ETF.com segment: Equity: Global Ex-U.S. - High Dividend Yield Competing ETFs: HDAW, VYMI Related ETF Channels: Smart-Beta ETFs, Dividend, Broad-based, ESG, Dividends,
URA Global X Uranium ETF
 Global X Uranium ETF ETF.com segment: Equity: Global Nuclear Energy Competing ETFs: NLR Related ETF Channels: Nuclear Energy, Nuclear, Vanilla, Theme Investing, Global, Equity, Sectors Find more ETFs with
Investor Overview Q2 2017
 Investor Overview Q2 2017 AMG Overview Business Highlights Global, diversified asset management firm Unique, multi-faceted growth strategy Proprietary opportunity to partner with additional top boutiques
Market Update: Broad Market Returns and Indicators
 Market Update Eckler Ltd. collects information directly from sources believed to be reliable. Eckler Ltd. does not guarantee or warrant the accuracy, timeliness, or completeness of the information either
Developing the next generation of talented asset managers. March 27, 2014
 Developing the next generation of talented asset managers March 27, 2014 Facilitating opportunity Grow and diversify the pool of talented entrepreneurial managers to the benefit of the asset management
SCZ ishares MSCI EAFE Small-Cap ETF
 ishares MSCI EAFE Small-Cap ETF ETF.com segment: Equity: Developed Markets Ex-U.S. - Small Cap Competing ETFs: SCHC, GWX, H, FNDC, DLS Related ETF Channels: Developed Markets Ex-U.S., Broad-based, Vanilla,
Morningstar Advisor Workstation
 Morningstar Advisor Workstation Selecting a Benchmark Below outline s the applicable benchmarks to use for each CIFSC categories. These investments can be used to compare investments in Graphs, Portfolios
CFI Multi-Strategy Equity Fund, LLC Objective and Strategy March 31, 2015
 CFI Multi-Strategy Equity Fund, LLC Objective and Strategy Objective To offer an actively managed, multi-manager investment program that will provide broad exposure to global equity markets. The fund seeks
FINX Global X FinTech ETF
 Global X FinTech ETF ETF.com segment: Equity: Global Technology Competing ETFs: IXN, CIBR, IPAY, SOCL, AIQ Related ETF Channels: Technology, Broad-based, Vanilla, Equity, Sectors Find more ETFs with our
VEGI ishares MSCI Global Agriculture Producers ETF
 VEGI ishares MSCI Global Agriculture Producers ETF ETF.com segment: Equity: Global Agriculture Competing ETFs: SOIL, PAGG, CROP, MOO, FTAG Related ETF Channels: Global, Vanilla, Theme Investing, Equity,
2018 Half Year Results Six months to 31 March 2018
 2018 Half Year Results Six months to 31 March 2018 Emilio Gonzalez CFA, Group Chief Executive Officer Cameron Williamson CA, Group Chief Financial Officer 10 May 2018 Welcome to Pendal Group s Interim
Endowment Funds Performance (Year ending March 31 st, 2013)
") Endowment Funds Performance (Year ending March 31 st, 2013) Investment Management Committee Meeting May 16 th, 2013 (Note: all returns and values are expressed in Canadian Dollars- CAD s) 1 Total Endowment
Endowment Funds Performance (Year ending March 31 st, 2013) Investment Management Committee Meeting May 16 th, 2013 (Note: all returns and values are expressed in Canadian Dollars- CAD s) 1 Total Endowment
GAMR ETFMG Video Game Tech ETF
 ETFMG Video Game Tech ETF ETF.com segment: Equity: Global Toys & Games Competing ETFs: N/A Related ETF Channels: Sectors, Global, Consumer Cyclicals, Vanilla, Toys & Games, Equity, Consumer Discretionary
WIP SPDR FTSE International Government Inflation- Protected Bond ETF
 WIP SPDR FTSE International Government Inflation- Protected Bond ETF ETF.com segment: Fixed Income: Global Ex-U.S. - Sovereign Inflation-Protected Competing ETFs: Related ETF Channels: Fixed Income, Sovereign,
BOTZ Global X Robotics & Artificial Intelligence ETF
 Global X Robotics & Artificial Intelligence ETF ETF.com segment: Equity: Developed Markets - Total Market Competing ETFs: URTH, SNSR, RFDI, FDRR, JPGE Related ETF Channels: Total Market, Broad-based, Artificial
Update on UC s s Absolute Return Program. 603 Committee on Investments / Investment Advisory Committee February 14, 2006
 Update on UC s s Absolute Return Program 603 Committee on Investments / Investment Advisory Committee February 14, 2006 AGENDA Page I. Understanding of Absolute Return as an Asset Class 3 II. Review of
FDT First Trust Developed Markets ex-us AlphaDEX Fund
 First Trust Developed Markets ex-us AlphaDEX Fund ETF.com segment: Equity: Developed Markets Ex-U.S. - Total Market Competing ETFs: JPIN, GSIE, INTF, RODM, UIVM Related ETF Channels: Developed Markets
MOTI VanEck Vectors Morningstar International Moat ETF
 VanEck Vectors Morningstar International Moat ETF ETF.com segment: Equity: Global Ex-U.S. - Total Market Competing ETFs: IQDF, IFV, VIDI, IQDE, IQDY Related ETF Channels: Smart-Beta ETFs, Global Ex-US,
Capital Idea: Expect More From the Core.
 SM Capital Idea: Expect More From the Core. Investments are not FDIC-insured, nor are they deposits of or guaranteed by a bank or any other entity, so they may lose value. Core equity strategies, such
MTUM ishares Edge MSCI U.S.A. Momentum Factor ETF
 ishares Edge MSCI U.S.A. Momentum Factor ETF ETF.com segment: Equity: U.S. - Total Market Competing ETFs: PDP, QMOM, DWTR, DWAQ, MMTM Related ETF Channels: North America, Smart-Beta ETFs, Total Market,
Fund Performance Summary as of December 31, 2017
 Supplemental Income at Retirement Plan (SIRP) Fund Performance Summary as of December 31, 2017 Fund YTD 1 Year 2 Years 3 Years 5 Years 10 Years General Fixed Income 1 3.58% 3.58% 3.71% 3.83% 4.07% 4.90%
SCIJ Global X Scientific Beta Japan ETF
 Global X Scientific Beta Japan ETF ETF.com segment: Equity: Japan - Total Market Competing ETFs: FJP, GSJY, QJPN, JHDG, EWJ Related ETF Channels: Multi-factor, Smart-Beta ETFs, Single Country, Total Market,
ETF portfolio review, 30th September ETF portfolios with ESG overlay. market overview. portfolio performance
 ETF portfolio review, 30th September 2017 market overview All our ETF portfolios performed better than s in September and all portfolios bar fixed-income continued to add to their gains year-to-date. Our
ETFs: Regulatory (High) Impact. Commerzbank, leaders in ETF February 2018
 Impact. Commerzbank, leaders in ETF February 2018") ETFs: Regulatory (High) Impact Commerzbank, leaders in ETF February 2018 What are ETFs? Securities that track the value of an index, commodities or a basket of assets and trade like a stock on the exchange
ETFs: Regulatory (High) Impact Commerzbank, leaders in ETF February 2018 What are ETFs? Securities that track the value of an index, commodities or a basket of assets and trade like a stock on the exchange
The What And Why Of LDI
 The What And Why Of LDI KEY TAKEAWAYS > Demand for fixed income Liability Driven Investment (LDI) strategies is being pushed higher by rising corporate pension funding levels and corporate tax reform deadlines
ANNOUNCEMENT OF PRELIMINARY RESULTS
 The leading high service distributor to engineers worldwide ANNOUNCEMENT OF PRELIMINARY RESULTS YEAR ENDED 31 MARCH 2009 29 May 2009 Agenda Overview and current trading Ian Mason Financial performance
IYR ishares U.S. Real Estate ETF
 IYR ishares U.S. Real Estate ETF ETF.com segment: Equity: U.S. Real Estate Competing ETFs: VNQ, SCHH, XLRE, RWR, USRT Related ETF Channels: North America, U.S., Vanilla, DJ Global United States (All) /
UWINCO Investment Performance Quarterly Report Quarter Ended December 31, 2017
 STANDING COMMITTEES F 11 Finance and Asset Management Committee UWINCO Investment Performance Quarterly Report Quarter Ended December 31, 2017 INFORMATION This item is for information only. Attachment
City of Fresno Retirement System
 City of Fresno Retirement System Emerging Markets Educational Presentation December 16, 2013 Don Stracke, CFA, CAIA, Senior Consultant Allan Martin, Partner Tony Ferrara, Senior Analyst Table of Contents
Manager Retention and Watch List Policy Review
 Manager Retention and Watch List Policy Review Los Angeles Fire and Police Pension System February 2012 Hiring and Firing Investment Managers Asset allocation drives portfolio return. Thus, institutional
QQQC Global X NASDAQ China Technology ETF
 Global X NASDAQ China Technology ETF ETF.com segment: Equity: China Technology Competing ETFs: CQQQ, KWEB Related ETF Channels: Technology, China, Broad-based, Vanilla, Asia-Pacific, Emerging Markets,
Schroder ISF Global Multi-Asset Income
 Unconstrained income investing Schroder ISF Global Multi-Asset Income SGD Share Classes Schroder ISF Global Multi-Asset Income (the "Fund") is designed to help investors generate regular income regardless
Fixed Income. Drawing on a spectrum of global fixed income opportunities to meet a range of client goals
 1 Fixed Income Drawing on a spectrum of global fixed income opportunities to meet a range of client goals August 2018 For professional investors only. Switzerland: For Qualified Investors only. Not for
Benchmarking of GPFG management costs. Report for the Norwegian Ministry of Finance November 2017
 Benchmarking of GPFG management costs Report for the Norwegian Ministry of Finance November 2017 2 3 Benchmarking of GPFG management costs This report was developed solely for the Norwegian Ministry of
Endowment Funds Performance (Year ending March 31st, 2012)
") Endowment Funds Performance (Year ending March 31st, 2012) Investment Management Committee Meeting June 20 th, 2012 (Note: all returns and values are expressed in Canadian Dollars- CAD s) 1 $ M Endowmwent
Endowment Funds Performance (Year ending March 31st, 2012) Investment Management Committee Meeting June 20 th, 2012 (Note: all returns and values are expressed in Canadian Dollars- CAD s) 1 $ M Endowmwent
4Q17 Global & International Equity GLOBAL EQUITY. 10+ Years of Providing High Income Through Global Dividends
 4Q17 Global & International Equity GLOBAL EQUITY INCOME FUND 10+ Years of Providing High Income Through Global Dividends A: HFQAX C: HFQCX I: HFQIX N: HFQRX S: HFQSX T: HFQTX Overall Morningstar Rating
Building Efficient Return Seeking Portfolios Reassessing the Equity Allocation
 Building Efficient Return Seeking Portfolios Reassessing the Equity Allocation Paul M. Martin, CFA Vice President & Portfolio Manager Phillips, Hager & North Investment Management Sources of Risk in a
Consulting Group Perspectives October Michael Deo, CFA Analyst
 Consulting Group Perspectives October 2017 Why ESG Investing Makes Sense Environmental, social and governance strategies allow investors to incorporate their principles into portfolios without sacrificing
An introduction to measuring trading costs - TCA
 An introduction to measuring trading costs - TCA Ofir Gefen, Head of Research & Liquidity Managment ITG Asia Pacific 20 Investment Technology Group, Inc. All rights reserved. Not to be reproduced or retransmitted
Claymore Presentation. Som Seif President & CEO Claymore Investments, Inc.
 Claymore Presentation Som Seif President & CEO Claymore Investments, Inc. Claymore ETFs: Intelligent ETFs for Canada Claymore Investments (Canada) is a subsidiary of Claymore Group (US) Designed for Canadian
4th - Asian Fixed Income Summit Investing in Asia s Fixed Income Market
 4th - Asian Fixed Income Summit Investing in Asia s Fixed Income Market September 217 Derek Armstrong Credit Suisse Head of Debt Capital Markets, Asia Pacific These materials may not be used or relied
HEDGE FUNDS AND AUTOMOBILES AN OVERVIEW
 HEDGE FUNDS AND AUTOMOBILES AN OVERVIEW PETER MULDOWNEY SENIOR VICE PRESIDENT, INSTITUTIONAL STRATEGY CONNOR, CLARK & LUNN FINANCIAL GROUP CHALLENGING THE BAD RAP HIGHER FEES TRANSPARENCY COMPLEXITY 3
Perpetual Trustees Australia Limited ( Perpetual ) November Presentation to Macquarie Equities
 November Presentation to Macquarie Equities") Perpetual Trustees Australia Limited ( Perpetual ) November 2004 Presentation to Macquarie Equities Content Business and Financial Overview Business operations Wealth Management Business operations Corporate
Perpetual Trustees Australia Limited ( Perpetual ) November 2004 Presentation to Macquarie Equities Content Business and Financial Overview Business operations Wealth Management Business operations Corporate
44% 3 TRENDS IN CLIENT ASSETS AND ALLOCATION KEY FINDINGS
 THE INVESTMENT ASSOCIATION 3 TRENDS IN CLIENT ASSETS AND ALLOCATION KEY FINDINGS CLIENT TYPE >> Institutional clients continue to account for the majority (79%) of total assets under management in the
The Compelling Case for Value
 The Compelling Case for Value July 2, 2018 SOLELY FOR THE USE OF INSTITUTIONAL INVESTORS AND PROFESSIONAL ADVISORS 0 Jan-75 Jan-77 Jan-79 Jan-81 Jan-83 Jan-85 Jan-87 Jan-89 Jan-91 Jan-93 Jan-95 Jan-97
NLR VanEck Vectors Uranium+Nuclear Energy ETF
 VanEck Vectors Uranium+Nuclear Energy ETF ETF.com segment: Equity: Global Nuclear Energy Competing ETFs: URA Related ETF Channels: Nuclear Energy, Nuclear, Global, Vanilla, Theme Investing, Equity, Sectors
Our continued success is reliant upon achieving our clients investment objectives.
 Strategic report Strategy and business review Our business model starts with our clients. Our continued success is reliant upon achieving our clients investment objectives. It is only by demonstrating
- Victor Haghani, Founder Elm. Watch the full talk here
 "After more than 20 years in finance, from the LSE to Salomon Brothers to LTCM, you d have thought that I d have figured out how to invest my family s savings. Well, it was 2002, I just turned 40, and
No Portfolio is an Island
 Agenda No Portfolio is an Island David Blanchett, CFA, CFP, AIFA Head of Retirement Research Morningstar Investment Management A Total Wealth Approach to Asset Allocation Human Capital Pension Wealth Housing
Understanding the Principles of Investment Planning Stochastic Modelling/Tactical & Strategic Asset Allocation
 Understanding the Principles of Investment Planning Stochastic Modelling/Tactical & Strategic Asset Allocation John Thompson, Vice President & Portfolio Manager London, 11 May 2011 What is Diversification
JPN Xtrackers Japan JPX-Nikkei 400 Equity ETF
 Xtrackers Japan JPX-Nikkei 400 Equity ETF ETF.com segment: Equity: Japan - Total Market Competing ETFs: JPXN, DXJ, HJPX, DDJP, EWJ Related ETF Channels: Smart-Beta ETFs, Broad-based, Total Market, Single
NLR VanEck Vectors Uranium+Nuclear Energy ETF
 VanEck Vectors Uranium+Nuclear Energy ETF ETF.com segment: Equity: Global Nuclear Energy Competing ETFs: URA Related ETF Channels: Nuclear Energy, Nuclear, Vanilla, Theme Investing, Global, Equity, Sectors
JPN Xtrackers Japan JPX-Nikkei 400 Equity ETF
 Xtrackers Japan JPX-Nikkei 400 Equity ETF ETF.com segment: Equity: Japan - Total Market Competing ETFs: JPXN, DXJ, HJPX, DDJP, EWJ Related ETF Channels: Smart-Beta ETFs, Total Market, Single Country, Fundamental,
ETFs The new wave of acceptance
 Public ETFs The new wave of acceptance March 2016 Discussion The new wave of acceptance Clear drivers of investment selection ETFs are growing in popularity among planners Australia use of ETFs continues
Los Angeles City Employees' Retirement System
 Los Angeles City Employees' Retirement System Emerging Investment Manager Program November 28, 2017 Carolyn Smith, Partner Kevin Novak, Consultant Michael Malchenko, Senior Analyst 1 LACERS Current Emerging