City of Anaheim OFFICE OF THE CITY TREASURER
|
|
|
- Raymond Bishop
- 5 years ago
- Views:
Transcription

1 City of Anaheim OFFICE OF THE CITY TREASURER DATE: NOVEMBER 15, 2011 FROM: OFFICE OF THE CITY TREASURER +COUNCIL AGENDA REPORT SUBJECT: INVESTMENT PORTFOLIO REPORT OCTOBER 2011 ATTACHMENT (Y/N): YES ITEM # RECOMMENDATION: That the City Council, by Motion, approve the Investment Portfolio Report for October DISCUSSION: This is the investment report for the City s general pool for the month ending October 31, The report is provided to ensure that the City Council is informed as to the investment activities and fulfills the reporting requirements of the City s adopted investment policy. COMPLIANCE: All investment transactions were executed in accordance with the California Government Code and the City s Investment Policy. There is sufficient liquidity to meet the City s anticipated expenditure requirements for the next six months. INVESTMENT SUMMARY: The following table shows summary investment information for the month ending October 31, 2011: Short-term Portfolio Long-term Portfolio Total Portfolio Values Portfolio Balance (Market Value) * $ 97,174,816 $ 287,167,526 $ 384,342,342 Effective Yield 0.28 % 2.19 % 1.70 % Avg. Weighted Maturity 5 Days 2.4 Years 1.82 Years Net Earnings $ 22,900 $ 514,894 $ 537,794 Benchmark** 0.01% 0.29% 0.21 % * Portfolio balance includes approximately $79.1 million of the 2011A Electric Bond project funds ** Benchmark value is the Interpolated Treasury Yield to the Portfolio s Avg. Weighted Maturity INVESTMENT ACTIVITIES 201 S. Anaheim Blvd. Suite #901 Anaheim, CA Tel: (714) Fax: (714) The City Treasurer s Investment Portfolio has a current rating of AAf from Standard and Poor s (S&P). This rating was effective August 8, 2011, as a result of the action of S&P downgrading the debt issues of the United States Treasury and Federal Agencies from a credit rating of AAA to AA+. The credit rating reflects the investment holdings of the City s Investment Portfolio (approximately 58% of funds in Federal Agency issues) and not the management of the investment fund.
2 Page 2 of 4 It should be pointed out the downgrade in credit rating is the sole action of Standard and Poor s, since the other two major national credit firms of Moody s Investor Services and Fitch Ratings have maintained the AAA credit rating on all U.S. Treasury and Federal Agency debt issues. Even with the credit downgrade to the investment portfolio, the investment portfolio is still eligible and qualifies as a permitted investment for City bond funds (i.e., project or acquisition funds). This credit rating is for the City s investment portfolio and does NOT reflect the credit rating of the City s bond issues. On August 11, 2008, the City of Anaheim s Investment Policy was recognized and certified by the Association of Professional Treasurers of the United States and Canada (APT US&C) as meeting all standards and criteria established by the APT US&C. INVESTMENT ENVIRONMENT The month of October 2011 saw the financial markets stressed over the continuing debt crisis in Europe. The European banking system... has been dealing for more than a year with the financial instability of Greece and the other so-called PIIGS nations Portugal, Ireland, Italy and Spain. The five nations are all coping with severe debt, leading to unpopular attempts to impose austerity measures and efforts by more stable neighboring countries to work out bailout plans. Moody s Investor Services downgraded Greece (sovereign debt) on July 25, 2011 to one class above default. To further complicate the situation, after an initial agreement with the European Union on a rescue plan for Greece, the legislative body announced they would issue a referendum for a vote on the overall financial rescue package. This reversal to a done deal will cause the world financial markets continued volatility. This ongoing issue is causing concern of a possible collapse of the European bond market and has investors seeking a safe haven for their funds. Consequently, even with the S&P downgrade of U.S Treasury debt issues to AA+ (note that Moody s and Fitch still list U.S. Treasury debt as AAA ) investors have been heavily purchasing U.S. issued debt. There is no other market in the world that provides the efficiencies and volume of funds than the United States financial markets and U.S. Treasury issues. This flight to quality in investment securities has lowered yields on all U.S. Treasury debt to historic low levels. Associating the slow-growth of the U.S. economy with the European crisis, the Federal Reserve has continued a program of maintaining short-term interest rates at current low levels to attempt to provide stimulus for the economy. Federal Reserve Chairman Bernanke has announced he intends to keep rates at these levels through midyear The chart below shows the interest rates for U. S. Treasury issues for the month ending October 2011: Source: Bloomberg Financial Systems Please note the October 31, 2011 yield on the 3 month Treasury Bill was a negative percent as the result of this concern to fix the Greece financial issue. The Federal Reserve announced at the September 21, 2011 Federal Open Market Committee (FOMC) meeting that the target Federal Funds rate would remain at the range of 0.0% to 0.25%, citing continued risk to growth to the economy. This key market interest rate has remained at this level since the FOMC meeting on December 16, The Federal Funds interest rate is the interest rate that banks charge other banks to borrow money.


3 Page 3 of 4 Against this backdrop, the economic data for the U.S. economy continues to show signs of a slow recovery that began in the spring of A key economic indicator is the national unemployment rate, which tends to show the overall health of the national economy. For the month of October 2011, the national unemployment rate was reported at 9.0%, a decrease from the past three months which were at 9.1%. The unemployment rate appears to be stalled in a narrow range from a low of 8.8% in March 2011 to a high of 9.2% in June As noted, the unemployment rate is considered a lagging economic indicator and does not reflect immediate or current financial and economic events. The unemployment rate does indicate the level of idle workers as a percentage of the overall labor force. The chart below shows the national unemployment rate for the past twelve months: Source: Bureau of Statistics, Dept of Labor Another key economic factor we review is the monthly Retail Sales (less Autos), which measures the level of consumer spending and provides an indication of the underlying vitality of the overall national economy. At the time of this monthly report, the October 2011 retail sales data had not been released, however, the September 2011 data indicates the consumer is continuing to spend but at marginally lower levels in the past four months. The chart below shows the monthly increase in consumer spending for the past twenty four months. Source: Census Bureau, US Government Since the U.S. economy is heavily weighted on the consumer spending, the year to year increase (September 2010 to September 2011) of 7.8% is a strong positive sign the economy has stabilized from the strong downturn at the end of The City s investment portfolio remains strongly diversified and invested in high credit quality issues of U.S. Treasuries, Federal Agencies, Medium Term Corporate Notes and high grade commercial paper. Investments in money market accounts are restricted to U.S. Treasury and Federal Agencies only and a review of the State of California Local Agency Investment Fund (LAIF) shows high levels of liquidity and safe investments. The City s investment strategy continues to focus on safety and providing liquidity for the City s operational requirements.


4 Page 4 of 4 INVESTMENT PERFORMANCE For October 2011, the City Treasurer s Investment Portfolio performance was: Amount of Funds (Market Value) Maturity Effective Yield Interpolated Yield Total Return Monthly Total Return Annual Short-Term Portfolio $ 97,174,816 5 days 0.28 % 0.01 % Long-Term Portfolio $ 287,167, years 2.19 % 0.29 % Total Portfolio $ 384,342, years 1.70 % 0.21 % The portfolio balance reflects a deposit of $76,732,798 for acquisition funds from the 2011A Electric Bonds. As a AA credit rated portfolio, we are recognized as a permitted investment by the bond indenture of the above bonds. These funds enjoy the advantage of superior market rates of return in a historically low interest rate environment. Please note the use of interpolated yield values and total return values are guidelines and not used in the performance evaluation of the portfolio. The investment of public funds is exposed to a large range of variable factors, such as increases or decreases in revenues and expenditures as well as seasonal timing, which can affect the cash flow of the City. The City s investment portfolio continues to provide an above market rate of return on funds as shown in the following graph which shows the City s net overall performance to a market indicator for the past twelve months: Source: Treasurer s Office, Anaheim A complete listing of the portfolio holdings and investment activity for the City of Anaheim s Investment Portfolio for the month of October 2011 is on the following pages. IMPACT ON BUDGET: There is no impact on the General Fund. Respectfully submitted, Henry W. Stern, CTP City Treasurer Attachment 1. City Treasurer s Investment Report
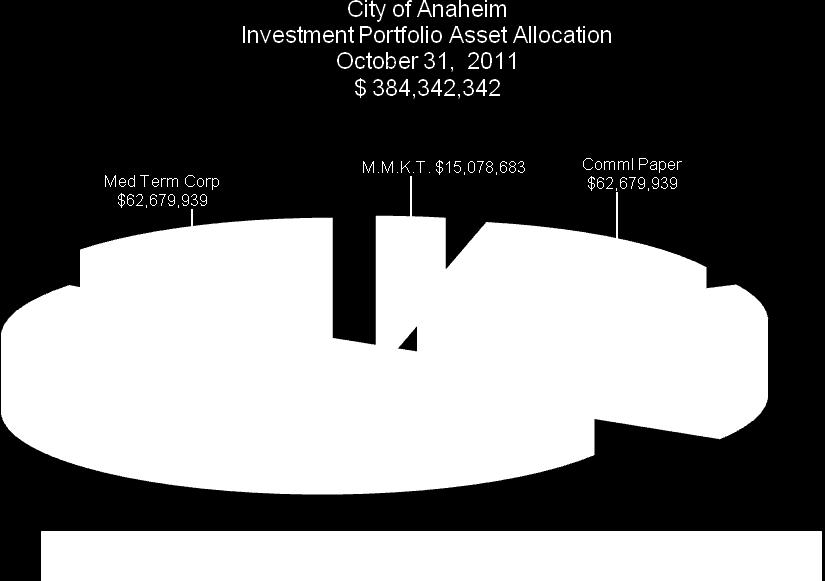
5 Page 1 of 11 Balances, Yields and Average Maturities October 31, 2011 Description Par Value Book Value Market Value Yield to Maturity Percent of Average Weighted Maturity Total Funds Days Years Short-Term Portfolio Money Market Funds $15,078,683 $15,078,683 $15,078, % 3.92% L.A.I.F. (State of California $69,096,983 $69,096,983 $69,096, % 17.98% subtotal: Cash and Overnight Investments $84,175,666 $84,175,666 $84,175, % Commercial Paper $13,000,000 $12,999,150 $12,999, % 3.38% Medium Term Corporate Notes $0 $0 $0 0.00% 0.00% U.S. Federal Agencies $0 $0 $0 0.00% 0.00% U.S. Treasury $0 $0 $0 0.00% 0.00% subtotal: Pooled Investments $13,000,000 $12,999,150 $12,999, % 3.38% Total Short-Term Portfolio: $97,175,666 $97,174,816 $97,174, % 25.28% Long -Term Portfolio Commercial Paper $0 $0 $0 0.00% Medium Term Corporate Notes $61,391,000 $61,637,631 $62,679, % 16.31% U.S. Federal Agencies $220,185,000 $219,937,351 $224,487, % 58.41% U.S. Treasury $0 $0 $0 0.00% 0.00% Total Long-Term Portfolio: $281,576,000 $281,574,982 $287,167, % 74.72% Total Cash and Pooled Investments $378,751,666 $378,749,798 $384,342, % %

6 Page 2 of 11

7 Page 3 of 11 Liquidity Schedule October 31, 2011 Availability Market Value Cumulative Balances % of Total Assets Money Market Funds Immediate $15,078,683 $15,078, % L.A.I.F. (State of California) Immediate $69,096,983 $84,175, % Pooled Investment Maturities: < 30 Days $3,999,908 $88,175, % Total Cash and Pooled Investments: $384,342, to 90 Days $26,355,013 $114,530, % 91 to 180 Days $5,069,240 $119,599, % 181 to 365 Days $15,386,655 $134,986, % 1 to 2 years $59,652,698 $194,639, % 2 to 3 years $72,520,748 $267,159, % 3 to 4 years $82,300,427 $349,460, % 4 to 5 years $34,881,987 $384,342, %
8 Page 4 of 11 Summary and Comparison of Yields and Balances October 31, 2011 Description Current Month Prior Month Yield to Maturity (at market): October 31, 2011 September 30, 2011 Money Market Funds (US Treasuries) 0.01% 0.01% L.A.I.F. (State of California) 0.38% 0.41% U.S. Treasuries 0.00% 0.00% Federal Agency Bonds 1.91% 1.99% Commercial Paper 0.07% 0.00% Medium Term Corporate Notes 3.17% 3.15% 1.70% 1.65% Weighted Average Maturity (Days) Weighted Average Maturity (Years) Balances (at Market Value) Money Market Funds (US Gov Sec) $15,078,683 $46,715,815 L.A.I.F. (State of California) $69,096,983 $69,036,161 U.S. Treasuries $0 $0 Federal Agencies $224,487,587 $234,726,559 Commercial Paper $12,999,150 $0 Medium Term Corporate Notes $62,679,939 $57,273,415 Total Portfolio: $384,342,342 $407,751,950 Current Month Fiscal Year to Earnings: October 31, 2011 Date Earnings Total Interest Earnings for Month: $580, $2,449, Total Adjustments from Premiums and Discounts -$43, $160, Total Capital Gains or Losses $0.00 $3, Total Earnings for Month $537, $2,292,840.13
9 Page 5 of 11 City of Anaheim Month / Yr Core Portfolio Reserve Portfolio Investment Portfolio Summary Portfolio Balance (market value) Portfolio Yield Avg Wgt Mat.- Days Avg Wgt Mat. - Yrs Inter - polated Yld Curve Difference: City Yield / Interpolated Jun-09 $92,988,732 $316,049,180 $409,037, % % 1.14% Jun-10 $127,268,510 $256,712,953 $383,981, % % 1.42% Jul-10 $123,081,456 $242,447,380 $365,528, % % 1.42% Aug-10 $117,235,549 $242,490,054 $359,725, % % 1.51% Sep-10 $119,485,790 $227,468,279 $346,954, % % 1.56% Oct-10 $100,978,349 $219,241,780 $320,220, % % 1.66% Nov-10 $101,526,759 $218,216,183 $319,742, % % 1.57% Dec-10 $105,898,549 $210,264,073 $316,162, % % 1.54% Jan-11 $108,407,446 $234,543,785 $342,951, % % 1.50% Feb-11 $104,729,248 $236,419,373 $341,148, % % 1.50% Mar-11 $111,156,980 $235,802,908 $346,959, % % 1.26% Apr-11 $116,033,678 $227,553,117 $343,586, % % 1.45% May-11 $102,200,682 $240,161,108 $342,361, % % 1.50% Jun-11 $180,459,755 $261,836,213 $442,295, % % 1.17% Jul-11 $110,147,815 $302,809,741 $412,957, % % 1.38% Aug-11 $112,051,416 $303,126,356 $415,177, % % 1.52% Sep-11 $115,751,976 $291,999,974 $407,751, % % 1.40% Oct-11 $97,174,816 $287,167,526 $384,342, % % 1.49% Note: October 2011 balance reflects acquisition funds from 2011A Electric Bonds, approx $76.7 million
10 Page 6 of 11 CITY OF ANAHEIM Short-Term Portfolio Listing October 31, 2011 CUSIP Security # Issuer Security Type S&P Rating Par Value Book Value Market Value Purchase Date Maturity Date Stated Rate SYS LAIF MMKT AA 36,932, ,932, ,932, % SYS LAIF MMKT AA 32,164, ,164, ,164, % SYS FIDELITY GOVERNMENT MMKT MMKT AA+ 5,184, ,184, ,184, % SYS GOLDMAN SACHS PRIME MMKT AA+ 9,894, ,894, ,894, % 2546R3YJ Disney CP A1/P1 4,000, ,999, ,999, /12/ /18/ % 47816GZ Johnson & Johnson CP A1/P1 5,000, ,999, ,999, /07/ /02/ % 19121BZM COCA COLA CP A1/P1 4,000, ,999, ,999, /07/ /21/ % Total Short-Term Portfolio: 97,175, ,174, ,174, % CITY OF ANAHEIM Long-Term Portfolio Listing October 31, 2011 CUSIP Security # Issuer Security Type S&P Rating Par Value Book Value Market Value Purchase Date Maturity Date Stated Rate 3133XVQL FEDERAL HOME LOAN BANKS Fed Agy AA+ 3,240, ,240, ,243, /28/ /09/ % 3137EACF FED HOME LOAN MORT CORP Fed Agy AA+ 5,000, ,000, ,006, /28/ /15/ % 38141GBU Goldman Sachs Group MTN A 9,005, ,070, ,106, /28/ /15/ % 36962GXS GENERAL ELEC CAP CORP MTN AA+ 5,000, ,052, ,069, /28/ /15/ % 3133XWDC FEDERAL HOME LOAN BANKS Fed Agy AA+ 5,000, ,996, ,028, /28/ /25/ % 31359MPF FED NATL MORTGAGE ASSN Fed Agy AA+ 10,000, ,016, ,358, /25/ /15/ % 3133XVNT FEDERAL HOME LOAN BANKS Fed Agy AA+ 9,850, ,863, ,999, /04/ /14/ % 3137EACG FED HOME LOAN MORT CORP Fed Agy AA+ 5,000, ,984, ,063, /29/ /09/ % 31398AME FED NATL MORTGAGE ASSN Fed Agy AA+ 10,000, ,000, ,442, /28/ /28/ % NY WELLS FARGO CO MTN A+ 8,000, ,971, ,319, /23/ /31/ % 59018YM BANK OF AMERICA MTN A- 8,206, ,388, ,297, /23/ /05/ % 38141GDB Goldman Sachs Group MTN A 2,224, ,280, ,301, /23/ /01/ % 02666QB American Honda MTN A+ 5,000, ,999, ,221, /02/ /02/ % 3134G2QF FED HOME LOAN MORT CORP Fed Agy AA+ 10,000, ,000, ,007, /18/ /18/ % 31331J2Z FEDERAL FARM CREDIT BANK Fed Agy AA+ 5,000, ,969, ,044, /07/ /26/ % 3133XSP FEDERAL HOME LOAN BANKS Fed Agy AA+ 6,845, ,861, ,225, /15/ /13/ % 3136FPZ FED NATL MORTGAGE ASSN Fed Agy AA+ 5,000, ,999, ,009, /24/ /13/ % 31398A3K FED NATL MORTGAGE ASSN Fed Agy AA+ 5,000, ,994, ,085, /23/ /14/ % D FEDERAL HOME LOAN BANKS Fed Agy AA+ 4,000, ,999, ,003, /11/ /11/ % 31331GTJ FEDERAL FARM CREDIT BANK Fed Agy AA+ 8,000, ,002, ,395, /17/ /17/ % 31331GTJ FEDERAL FARM CREDIT BANK Fed Agy AA+ 4,500, ,489, ,722, /01/ /17/ %
11 Page 7 of 11 CITY OF ANAHEIM Long-Term Portfolio Listing October 31, 2011 CUSIP Security # Issuer Security Type S&P Rating Par Value Book Value Market Value Purchase Date Maturity Date Stated Rate 31331GTJ FEDERAL FARM CREDIT BANK Fed Agy AA+ 4,000, ,032, ,197, /29/ /17/ % 31398AXJ FED NATL MORTGAGE ASSN Fed Agy AA+ 5,000, ,024, ,240, /30/ /15/ % AX Johnson & Johnson MTN AAA 3,000, ,997, ,045, /20/ /15/ % 3136FPV FED NATL MORTGAGE ASSN Fed Agy AA+ 2,350, ,349, ,355, /07/ /03/ % 3135G0BT FED NATL MORTGAGE ASSN Fed Agy AA+ 10,000, ,000, ,036, /11/ /11/ % JS FEDERAL HOME LOAN BANKS Fed Agy AA+ 8,000, ,956, ,157, /23/ /12/ % 31331KHW FEDERAL FARM CREDIT BANK Fed Agy AA+ 5,000, ,036, ,129, /16/ /19/ % 31398AZV FED NATL MORTGAGE ASSN Fed Agy AA+ 8,000, ,014, ,474, /30/ /20/ % 3134G2HC FED HOME LOAN MORT CORP Fed Agy AA+ 5,000, ,999, ,003, /25/ /25/ % W FEDERAL HOME LOAN BANKS Fed Agy AA+ 5,000, ,929, ,061, /24/ /12/ % 3136FRXN FED NATL MORTGAGE ASSN Fed Agy AA+ 10,000, ,000, ,033, /30/ /30/ % 3134G2MX FED HOME LOAN MORT CORP Fed Agy AA+ 5,000, ,998, ,006, /06/ /06/ % 3134G2MX FED HOME LOAN MORT CORP Fed Agy AA+ 10,000, ,997, ,013, /06/ /06/ % 3134G2MX FED HOME LOAN MORT CORP Fed Agy AA+ 5,000, ,999, ,006, /06/ /06/ % 3133XWX FEDERAL HOME LOAN BANKS Fed Agy AA+ 2,000, ,001, ,126, /19/ /13/ % 31331KFS FEDERAL FARM CREDIT BANK Fed Agy AA+ 5,000, ,984, ,135, /24/ /24/ % 31331KKU FEDERAL FARM CREDIT BANK Fed Agy AA+ 5,000, ,004, ,066, /16/ /13/ % 3136FRSL FED NATL MORTGAGE ASSN Fed Agy AA+ 5,000, ,995, ,031, /29/ /29/ % AG Microsoft Corp MTN AAA 5,000, ,000, ,117, /09/ /25/ % 31398A4K FED NATL MORTGAGE ASSN Fed Agy AA+ 3,000, ,999, ,094, /11/ /15/ % CX Walmart MTN AA 2,956, ,899, ,999, /18/ /25/ % 31331J3T FEDERAL FARM CREDIT BANK Fed Agy AA+ 5,000, ,895, ,122, /07/ /01/ % 31331J3T FEDERAL FARM CREDIT BANK Fed Agy AA+ 5,000, ,905, ,122, /24/ /01/ % 38143USC Goldman Sachs Group MTN A 5,000, ,992, ,954, /08/ /07/ % AY Johnson & Johnson MTN AAA 3,000, ,991, ,110, /20/ /15/ % 3136FRTM FED NATL MORTGAGE ASSN Fed Agy AA+ 5,000, ,998, ,015, /28/ /28/ % 3136FRTM FED NATL MORTGAGE ASSN Fed Agy AA+ 6,400, ,398, ,419, /29/ /28/ % 36962G5H GENERAL ELEC CAP CORP MTN AA+ 5,000, ,994, ,138, /17/ /17/ % Long-Term Portfolio Listing: 281,576, ,574, ,167, % Total Portfolio Listing: 378,751, ,749, ,342, %
12 Page 8 of 11
13 Page 9 of 11

14 Page 10 of 11 CITY OF ANAHEIM
15 Page 11 of 11 BOND FUND INVESTMENTS September 30, 2011 Total Trustee Debt Issue Trustee Book Value Holdings Decommissioning Trust Union Bank of Calif. $ 120,426,252 APFA Revenue Bds, 1998 Series Union Bank of Calif. $ 1 $ 120,426,253 COP 1992 Convention Ctr. US Bank $ 8,219, Land Acquisition Program Lease US Bank $ 2,565,481 Anaheim R/A Tax Allocation Bond - Escrow Fd US Bank $ 30,444,964 Anaheim CFD no US Bank $ 830,891 APFR Rev Bds. - Escrow Fd US Bank $ - Anaheim CFD , Sycamore Canyon US Bank $ 428,687 Anaheim CFD , Highlands Sp Tax Bds US Bank $ 692,017 CITY OF ANAHEIM CFD DIST US Bank $ 707,287 Anaheim CFD Platinum Triangle US Bank $ 28,543,046 Anaheim RDA 2007 Tax Allocation Refunding Bds US Bank $ 19,928,037 APFA Lease Revenue Refunding Bonds Ser 2008 US Bank $ 4,434,500 APFA Water System Bonds 2010-A & 2010-B US Bank $ 22,585,908 Anaheim RDA 2010 Tax Allocation Bond US Bank $ 657,848 Anaheim 11A Electric US Bank $ 88,192,827 $ 208,230,812 Anaheim Dist Sys 99 BNY Western Trust $ 3,135,647 Anaheim Arena 03 BNY Western Trust $ - Anaheim 04 Electric Purchase BNY Western Trust $ 10,090,257 Anaheim Debt Service Payment Account BNY Western Trust $ - Anaheim/Disney Lease Revenue 1997A BNY Western Trust $ 53,870,250 Anaheim Lenain Reserve BNY Western Trust $ 1,276,407 APFA 02 A BNY Western Trust $ 7,168,771 APFA 03 B BNY Western Trust $ 9,720,660 Anaheim 03 A BNY Western Trust $ 4,958,832 Anaheim 03 B BNY Western Trust $ - Anaheim 93 A Reserve Fund BNY Western Trust $ - Anaheim 04 Water BNY Western Trust $ 1,257,363 APFA 2007A BNY Western Trust $ 17,596,214 APFA 2007A Farecal Escrow BNY Western Trust $ 768,501 Anaheim Sewer Rev Bds 2007 BNY Western Trust $ 27,946,691 Anaheim (Dsny) 2007 Ref Ser A BNY Western Trust $ 780,768 Anaheim (Dsny) 2007 Ref Ser B BNY Western Trust $ 494,772 Anaheim/Disney 97 Series A-1/B Escrow BNY Western Trust $ - Anaheim/Disney 97 Series A-2 Escrow BNY Western Trust $ - Farecal Anaheim BNY Western Trust $ - Anaheim 08 Water BNY Western Trust $ 4,083,307 Anaheim 09A Electric BNY Western Trust $ 4,177 $ 143,152,616 Total Bond Funds with external Trustees: $ 471,809,682 Anaheim RDA PFA 1992 Tax Alloc Rev City Treasurer $ RDA SubAccount City Treasurer $ 23, RDA Bond - A City Treasurer $ RDA Bond - B City Treasurer $ RDA Bond - D City Treasurer $ - Total Bond Funds with City Treasurer: $ 24,021 Total Bond Funds: $ 471,833,702
City of Anaheim OFFICE OF THE CITY TREASURER
 City of Anaheim OFFICE OF THE CITY TREASURER DATE: OCTOBER 22, 2013 FROM: OFFICE OF THE CITY TREASURER +COUNCIL AGENDA REPORT SUBJECT: INVESTMENT PORTFOLIO REPORT SEPTEMBER 2013 ATTACHMENT (Y/N): YES ITEM
City of Anaheim OFFICE OF THE CITY TREASURER
 City of Anaheim OFFICE OF THE CITY TREASURER DATE: JANUARY 28, 2014 FROM: OFFICE OF THE CITY TREASURER COUNCIL AGENDA REPORT SUBJECT: INVESTMENT PORTFOLIO REPORT DECEMBER 2013 ATTACHMENT (Y/N): YES ITEM
City of Anaheim OFFICE OF THE CITY TREASURER
 City of Anaheim OFFICE OF THE CITY TREASURER DATE: JUNE 10, 2014 FROM: OFFICE OF THE CITY TREASURER COUNCIL AGENDA REPORT SUBJECT: INVESTMENT PORTFOLIO REPORT APRIL 2014 ATTACHMENT (Y/N): YES ITEM # RECOMMENDATION:
City of Anaheim OFFICE OF THE CITY TREASURER
 City of Anaheim OFFICE OF THE CITY TREASURER DATE: AUGUST 18, 2015 FROM: OFFICE OF THE CITY TREASURER COUNCIL AGENDA REPORT SUBJECT: INVESTMENT PORTFOLIO REPORT JULY 2015 ATTACHMENT (Y/N): YES ITEM # RECOMMENDATION:
City of Anaheim FINANCE DEPARTMENT
 City of Anaheim FINANCE DEPARTMENT DATE: JANUARY 26, 2016 FROM: FINANCE DEPARTMENT CITY COUNCIL AGENDA REPORT SUBJECT: INVESTMENT PORTFOLIO REPORT DECEMBER 2015 ATTACHMENT (Y/N): YES ITEM # 02 RECOMMENDATION:
City of Anaheim FINANCE DEPARTMENT
 City of Anaheim FINANCE DEPARTMENT DATE: MAY 17, 2016 FROM: FINANCE DEPARTMENT CITY COUNCIL AGENDA REPORT SUBJECT: INVESTMENT PORTFOLIO REPORT APRIL 2016 ATTACHMENT (Y/N): YES ITEM # 04 RECOMMENDATION:
City of Anaheim FINANCE DEPARTMENT
 City of Anaheim FINANCE DEPARTMENT COUNCIL AGENDA REPORT DATE: APRIL 26, 2016 FROM: FINANCE DEPARTMENT SUBJECT: INVESTMENT PORTFOLIO REPORT MARCH 2016 ATTACHMENT (Y/N): YES ITEM # RECOMMENDATION: That
Anaheim s Portfolio Balances
 Impact on Cash Management and Investment Strategies Henry Stern, CTP City Treasurer City of Anaheim C.M.T.A. San Diego April 21, 2011 Elements of a Portfolio Management Program Investment Policy Return
CITY OF MANHATTAN BEACH Portfolio Management Portfolio Details - Investments May 31, 2013
 CUSIP Investment # LAIF Issuer CITY OF MANHATTAN BEACH Portfolio Management Portfolio Details - Investments May 31, 2013 Purchase Date Par Value Market Value Book Value Stated Rate S&P YTM Days to 365
CITY OF MANHATTAN BEACH Portfolio Management Portfolio Details - Investments April 30, 2013
 CUSIP Investment # LAIF Issuer CITY OF MANHATTAN BEACH Portfolio Management Portfolio Details - Investments April 30, 2013 Purchase Date Par Value Market Value Book Value Stated Rate S&P YTM Days to 365
City of El Segundo Office of the City Treasurer
 City of El Segundo Office of the City Treasurer Date: September 15, 2015 From: Office of the City Treasurer To: El Segundo City Council RE: Investment Portfolio Report As of June 30, 2015 Introduction:
City of Anaheim FINANCE DEPARTMENT
 City of Anaheim FINANCE DEPARTMENT CITY COUNCIL AGENDA REPORT DATE: JULY 25, 2017 FROM: FINANCE DEPARTMENT SUBJECT: INVESTMENT PORTFOLIO REPORT JUNE 2017 ATTACHMENT (Y/N): YES ITEM # RECOMMENDATION: That
CITY OF MANHATTAN BEACH Portfolio Management Portfolio Details - Investments December 31, 2016
 CUSIP Investment # LAIF Issuer CITY OF MANHATTAN BEACH Portfolio Management Portfolio Details - Investments December 31, 2016 Purchase Par Value Market Value Book Value Stated Rate S&P YTM Days to 365
Presentation to the City of Los Angeles Investment Advisory Committee. September 30, 2013
 Presentation to the City of Los Angeles Investment Advisory Committee September 30, 2013 Economic Update-Overall Economy 8 U.S. GDP (Quarter over Quarter Annualized)* 6 4.9 4.9 Percent 4 2 0-2 -4 1.3 0.3
Presentation to the City of Los Angeles Investment Advisory Committee. August 31, 2013
 Presentation to the City of Los Angeles Investment Advisory Committee August 31, 2013 Economic Update-Overall Economy 8 U.S. GDP (Quarter over Quarter Annualized)* 6 4.9 4.9 Percent 4 2 0-2 -4 1.3 0.3
CITY OF MANHATTAN BEACH Portfolio Management Portfolio Details - Investments February 28, 2019
 CUSIP Investment # LAIF Issuer CITY OF MANHATTAN BEACH Portfolio Management Portfolio Details - Investments February 28, 2019 Purchase Par Value Market Value Book Value Stated Rate S&P YTM Days to 365
A Longer View of Treasury Yields
 OVERVIEW January March 3, 204 Exhibit A Investment Portfolio Review Quarter Ending March 3, 204 During the January to March quarter, the Treasury yield curve flattened moderately, with longer maturities
CITY OF MANHATTAN BEACH Portfolio Management Portfolio Details - Investments December 31, 2018
 CUSIP Investment # LAIF Issuer CITY OF MANHATTAN BEACH Portfolio Management Portfolio Details - Investments December 31, 2018 Purchase Par Value Market Value Book Value Stated Rate S&P YTM Days to 365
Presentation to the City of Los Angeles Treasurer on the City's General Pool Investments. September 30, 2018
 Presentation to the City of Los Angeles Treasurer on the City's General Pool Investments September 30, 2018 Economic Update: Overall Economy 6 U.S. GDP (Quarter over Quarter Annualized)* 5 4.7 5.1 4.9
Subject: City Monthly Cash and Investment Report for February 2010
 Information Item Date: February 28, 2010 To: From: Mayor and City Council Carol Swindell, Director of Finance/City Treasurer Subject: City Monthly Cash and Investment Report for February 2010 Introduction
Subject: City Monthly Cash and Investment Report for February 2011
 Information Item Date: August 11, 2011 To: From: Mayor and City Council Carol Swindell, Director of Finance/City Treasurer Subject: City Monthly Cash and Investment Report for February 2011 Introduction
Subject: City Monthly Cash and Investment Report for March 2010
 Information Item Date: March 31, 2010 To: From: Mayor and City Council Carol Swindell, Director of Finance/City Treasurer Subject: City Monthly Cash and Investment Report for March 2010 Introduction In
CITY OF MANHATTAN BEACH Portfolio Management Portfolio Details - Investments March 31, 2018
 CUSIP Investment # LAIF Issuer CITY OF MANHATTAN BEACH Portfolio Management Portfolio Details - Investments March 31, 2018 Purchase Date Par Value Market Value Book Value Stated Rate S&P YTM Days to 365
Gigi Decavalles-Hughes, Acting Director of Finance/City Treasurer
 Information Item Date: September 21, 2011 To: From: Mayor and City Council Gigi Decavalles-Hughes, Acting Director of Finance/City Treasurer Subject: City Monthly Cash and Investment Report for June 2011
REQUEST FOR CITY COUNCIL ACTION
 REQUEST FOR CITY COUNCIL ACTION MEETING DATE: MARCH 28, 2017 TITLE: TREASURER'S REPORT FOR THE QUARTER ENDED DECEMBER 31, 2016 RECOMMENDED ACTION Receive and file the Treasurer's Report for the quarter
CITY OF MANHATTAN BEACH Portfolio Management Portfolio Details - Investments June 30, 2016
 CUSIP Investment # LAIF Issuer CITY OF MANHATTAN BEACH Portfolio Management Portfolio Details - Investments June 30, 2016 Purchase Par Value Market Value Book Value Stated Rate S&P YTM Days to 365 Maturity
Presentation to the City of Los Angeles Treasurer on the City's General Pool Investments. August 31, 2018
 Presentation to the City of Los Angeles Treasurer on the City's General Pool Investments August 31, 2018 Q4 2010 Q1 2011 Q2 2011 Q3 2011 Q4 2011 Q1 2012 Q2 2012 Q3 2012 Q4 2012 Q1 2013 Q2 2013 Q3 2013
Presentation to the City of Los Angeles Treasurer on the City's General Pool Investments. October 31, 2018
 Presentation to the City of Los Angeles Treasurer on the City's General Pool Investments October 31, 2018 Economic Update: Overall Economy 6 U.S. GDP (Quarter over Quarter Annualized)* 5 4.7 5.1 4.9 4.2
Presentation to the City of Los Angeles Treasurer on the City's General Pool Investments. April 30, 2018
 Presentation to the City of Los Angeles Treasurer on the City's General Pool Investments April 30, 2018 Economic Update: Overall Economy 6 5 U.S. GDP (Quarter over Quarter Annualized)* 4.6 4.6 5.2 Percent
BUTTE COUNTY TREASURY OVERSIGHT COMMITTEE
 BUTTE COUNTY TREASURY OVERSIGHT COMMITTEE 25 County Center Drive, Ste 125 Oroville, CA 95965 Lisa Anderson, BCOE Director of Fiscal Services, Superintendent of Schools Representative David A. Houser, Butte
Presentation to the City of Los Angeles Treasurer on the City's General Pool Investments. March 31, 2017
 Presentation to the City of Los Angeles Treasurer on the City's General Pool Investments March 31, 2017 Economic Update: Overall Economy 8 U.S. GDP (Quarter over Quarter Annualized)* Percent 6 4 2 0-2
Presentation to the City of Los Angeles Investment Advisory Committee. December 31, 2014
 Presentation to the City of Los Angeles Investment Advisory Committee December 31, 2014 Economic Update-Overall Economy 8 U.S. GDP (Quarter over Quarter Annualized)* Percent 6 4 2 0-2 -4 0.2 3.1 2.7 1.4-2.7
Presentation to the City of Los Angeles Investment Advisory Committee. August 31, 2014
 Presentation to the City of Los Angeles Investment Advisory Committee August 31, 2014 Economic Update-Overall Economy 8 U.S. GDP (Quarter over Quarter Annualized)* Percent 6 4 2 0-2 -4 3.2 0.2 3.1 2.7
Presentation to the City of Los Angeles Treasurer on the City's General Pool Investments. August 31, 2016
 Presentation to the City of Los Angeles Treasurer on the City's General Pool Investments August 31, 2016 Economic Update: Overall Economy 8 U.S. GDP (Quarter over Quarter Annualized)* Percent 6 4 2 0-2
Presentation to the City of Los Angeles Treasurer on the City's General Pool Investments. April 30, 2017
 Presentation to the City of Los Angeles Treasurer on the City's General Pool Investments April 30, 2017 Economic Update: Overall Economy 8 U.S. GDP (Quarter over Quarter Annualized)* Percent 6 4 2 0-2
Presentation to the City of Los Angeles Treasurer on the City's General Pool Investments. January 31, 2018
 Presentation to the City of Los Angeles Treasurer on the City's General Pool Investments January 31, 2018 Economic Update: Overall Economy 6 5 U.S. GDP (Quarter over Quarter Annualized)* 4.6 4.6 5.2 4
Presentation to the City of Los Angeles Treasurer on the City's General Pool Investments. February 28, 2018
 Presentation to the City of Los Angeles Treasurer on the City's General Pool Investments February 28, 2018 Economic Update: Overall Economy 6 5 U.S. GDP (Quarter over Quarter Annualized)* 4.6 4.6 5.2 4
Presentation to the City of Los Angeles Treasurer on the City's General Pool Investments. April 30, 2015
 Presentation to the City of Los Angeles Treasurer on the City's General Pool Investments April 30, 2015 Economic Update-Overall Economy 8 U.S. GDP (Quarter over Quarter Annualized)* Percent 6 4 2 0-2 -4
Asset Liability Management Report 4 Q 2018
 Asset Liability Management Report 4 Q 2018 Performance Indicators and Key Measures Cash, Investment and Debt Balances Book Value ($M) Restricted Cash and Investments 529.8 Unrestricted Cash and Investments
Quarter End Report September 2011
 WASHINGTON COUNTY Quarter End Report September 2011 We urge you to compare the information contained in this periodic statement with the account statement(s) you receive directly fromcustodian that holds
City of Los Angeles Office of the Treasurer
 City of Los Angeles Office of the Treasurer INVESTMENT & CASH MANAGEMENT REPORT August 31, 2009 Joya C. De Foor, CTP City Treasurer Crista Binder, CTP Assistant Treasurer 200 N. Spring Street Room 201,
QUARTERLY REPORT AND CERTIFICATION OF THE COUNTY TREASURER For Quarter Ending September 30, 2014
 QUARTERLY REPORT AND CERTIFICATION OF THE COUNTY TREASURER For Quarter Ending September 30, 2014 The Government Code requires the County Treasurer to render a Quarterly Report to the County Administrator,
Presentation to the City of Los Angeles Treasurer on the City's General Pool Investments. July 31, 2015
 Presentation to the City of Los Angeles Treasurer on the City's General Pool Investments July 31, 2015 Economic Update-Overall Economy 8 U.S. GDP (Quarter over Quarter Annualized)* Percent 6 4 2 0-2 -4
City of San Juan Capistrano
 City of San Juan Capistrano Fourth Quarter 2013 Portfolio and Market Review Sarah Meacham, Director PFM Asset Management LLC Federal Reserve Taper Talk Drives Interest Rates The Federal Open Market Committee
REQUEST FOR CITY COUNCIL ACTION
 REQUEST FOR CITY COUNCIL ACTION MEETING DATE: SEPTEMBER 8, 2015 TITLE: TREASURER'S ANNUAL REPORT FOR THE FISCAL YEAR ENDED JUNE 30, 2015 Director of Administrative Services Cit~~ RECOMMENDED ACTION Receive
City of Los Angeles Office of the Treasurer
 City of Los Angeles Office of the Treasurer INVESTMENT REPORT May 31, 2011 Steve Ongele Interim City Treasurer Thomas Juarez Chief Investment Officer 200 N. Spring Street Room 201, City Hall Los Angeles,
QUARTERLY REPORT AND CERTIFICATION OF THE COUNTY TREASURER For Quarter Ending September 30, 2013 COMPLIANCE CERTIFICATION
 QUARTERLY REPORT AND CERTIFICATION OF THE COUNTY TREASURER For Quarter Ending September 30, 2013 The Government Code requires the County Treasurer to render a Quarterly Report to the County Administrator,
REQUEST FOR CITY COUNCIL ACTION TREASURER'S REPORT FOR THE QUARTER ENDED SEPTEMBER 30, 2015
 REQUEST FOR CITY COUNCIL ACTION MEETING DATE: DECEMBER 8, 2015 TITLE: TREASURER'S REPORT FOR THE QUARTER ENDED SEPTEMBER 30, 2015 Interim Director of Administrative Services City~ RECOMMENDED ACTION Receive
City of Santa Rosa. Monthly Investment Report. August 31, PFM Aset Management LLC. 50 California Street Suite 2300 San Francisco, CA 94111
 City of Santa Rosa Monthly Investment Report August 31, 2017 PFM Aset Management LLC 50 California Street Suite 2300 San Francisco, CA 94111 Paulina Woo, Director 415-982-5544 pfm.com 0 City s Investment
Irvine Pooled Investment Portfolio Rolling 12-Month Quarterly Comparison
 Page 2 of 10 at quarter end and fiscal year end to the Investment Advisory Committee, Finance Commission, and City Council. The report includes investment activity and performance for each of the City
QUARTERLY REPORT AND CERTIFICATION OF THE COUNTY TREASURER For Quarter Ending September 30, 2015 COMPLIANCE CERTIFICATION
 QUARTERLY REPORT AND CERTIFICATION OF THE COUNTY TREASURER For Quarter Ending September 30, 2015 The Government Code requires the County Treasurer to render a Quarterly Report to the County Administrator,
QUARTERLY REPORT AND CERTIFICATION OF THE COUNTY TREASURER For Quarter Ending June 30, 2013 COMPLIANCE CERTIFICATION
 QUARTERLY REPORT AND CERTIFICATION OF THE COUNTY TREASURER For Quarter Ending June 30, 2013 The Government Code requires the County Treasurer to render a Quarterly Report to the County Administrator, the
QUARTERLY REPORT AND CERTIFICATION OF THE COUNTY TREASURER For Quarter Ending March 31, 2013
 QUARTERLY REPORT AND CERTIFICATION OF THE COUNTY TREASURER For Quarter Ending March 31, 2013 The Government Code requires the County Treasurer to render a Quarterly Report to the County Administrator,
Palm Beach County School District
 Palm Beach County School District Investment Performance Review Quarter Ended March 31, 2009 Investment Advisors Steven Alexander, CTP, CGFO, Managing Director Mel Hamilton, Senior Managing Consultant
Polk County Public Schools, Florida
 Polk County Public Schools, Florida Investment Performance Review As of December 31, 2011 Investment Advisors Steven Alexander, CTP, CGFO, Managing Director David Jang, CTP, Senior Managing Consultant
INVESTMENT & CASH MANAGEMENT. program
 C I T Y O F M O R E N O V A L L E Y INVESTMENT & CASH MANAGEMENT program WHY & HOW THE CITY INVESTS ITS MONEY Mission Statement: To prudently manage cash resources and to utilize funds not immediately
Moving On Up Today s Economic Environment
 Moving On Up Today s Economic Environment Presented by PFM Asset Management LLC Gray Lepley, Senior Analyst, Portfolio Strategies November 8, 2018 PFM 1 U.S. ECONOMY Today s Agenda MONETARY POLICY GEOPOLITICAL
Palm Beach County School District
 Palm Beach County School District Investment Performance Review Quarter Ended March 31, 2008 Investment Advisors Steven Alexander, CTP, CGFO, Managing Director 300 S. Orange Avenue, Suite 1170 Orlando,
REQUEST FOR CITY COUNCIL ACTION
 REQUEST FOR CITY COUNCIL ACTION MEETING DATE: June 28,2016 TITLE: TREASURER'S REPORT FOR THE MARCH 31,2016 Dire RECOMMENDED ACTION Receive and file the Treasurer's Report for the quarter ended March 31,2016.
Making the Most of Your Financial Assets: Portfolio Management Strategies & Reporting
 Making the Most of Your Financial Assets: Portfolio Management Strategies & Reporting Presented By: Sarah Meacham, Managing Director Lesley Murphy, Senior Managing Consultant September 14, 2017 PFM Asset
REQUEST FOR CITY COUNCIL ACTION
 REQUEST FOR CITY COUNCIL ACTION MEETING DATE: MARCH 27, 2018 TITLE: TREASURER'S REPORT FOR THE QUARTER ENDED DECEMBER 31,2017 Director RECOMMENDED ACTION Receive and file the Treasurer's Report for the
Sacramento Public Library Authority
 Sacramento Public Library Authority July 24, 2014 Agenda Item 7.0: Monthly Treasurer s Report April 2014 TO: FROM: Sacramento Public Library Authority Board Denise M. Davis, Deputy Library Director RE:
City of Santa Rosa Monthly Investment Report
 City of Santa Rosa Monthly Investment Report February 28, 2018 PFM Aset Management LLC 50 California Street Suite 2300 San Francisco, CA 94111 Paulina Woo, Director 415-982-5544 pfm.com 0 City s Investment
Moving On Up Investing in Today s Rate Environment
 Moving On Up Investing in Today s Rate Environment Presented by PFM Asset Management LLC Steve Faber, Managing Director Gray Lepley, Senior Analyst, Portfolio Strategies September 18, 2018 PFM 1 Today
Investment Report Treasury Division
 CITY OF PORTLAND OFFICE OF MANAGEMENT AND FINANCE Sam Adams, Mayor Jack D. Graham, Chief Administrative Officer Richard F. Goward, Jr., Chief Financial Officer Eric H. Johansen, City Treasurer Bureau of
QUARTERLY REPORT AND CERTIFICATION OF THE COUNTY TREASURER For Quarter Ending September 30, 2017 COMPLIANCE CERTIFICATION
 QUARTERLY REPORT AND CERTIFICATION OF THE COUNTY TREASURER For Quarter Ending September 30, 2017 The Government Code requires the County Treasurer to render a Quarterly Report to the County Administrator,
REQUEST FOR CITY COUNCIL ACTION
 REQUEST FOR CITY COUNCIL ACTION MEETING DATE: JUNE 9, 2015 TITLE: TREASURER'S REPORT FOR THE MARCH 31, 2015 Di ector of Admmrstratrve Servrces RECOMMENDED ACTION Receive and file the Treasurer's Report
Santa Margarita Water District
 Santa Margarita Water District MEMORANDUM TO: Board of Directors DATE: April 19, 2013 FROM: SUBJECT: Kristin Griffith Revised PFM Transaction Report Santa Margarita Water District PFM statements for investments
2018 Investment and Economic Outlook
 2018 Investment and Economic Outlook Presented 3/19/18 Jeffrey Neer, CFA Client Portfolio Manager 410-237-5592 jeffrey.neer@pnc.com 1 Monetary Policy: Key Factors Inflation U.S. U.S. Labor Market 2.4%
Executive Summary. July 17, 2015
 Executive Summary July 17, 2015 The Revenue Estimating Conference adopted interest rates for use in the state budgeting process. The adopted interest rates take into consideration current benchmark rates
State and Local Government Debt Since the Financial Crisis
 State and Local Government Debt Since the Financial Crisis Chicago Federal Reserve 29 th Annual Economic Outlook Symposium John Mousseau, CFA Executive Vice President & Director of Fixed Income john.mousseau@cumber.com.
FIN 684 Fixed-Income Analysis Corporate Debt Securities
 FIN 684 Fixed-Income Analysis Corporate Debt Securities Professor Robert B.H. Hauswald Kogod School of Business, AU Corporate Debt Securities Financial obligations of a corporation that have priority over
Managing Public Funds Safely
 Managing Public Funds Safely Scott Stitcher, CFA & Richard Pengelly, CFA, CTP November 9, 2016 2016 PFM Asset Management LLC The Mission Local Government Officials Have a Significant Fiduciary Responsibility
Attachment A Financial Markets & Debt Portfolio Update October 21, 2016 Introduction Public Financial Management Inc. (PFM), financial advisor to the
, financial advisor to the") Attachment A Financial Markets & Debt Portfolio Update October 21, 2016 Introduction Public Financial Management Inc. (PFM), financial advisor to the Contra Costa Transportation Authority (CCTA) has prepared
Attachment A Financial Markets & Debt Portfolio Update October 21, 2016 Introduction Public Financial Management Inc. (PFM), financial advisor to the Contra Costa Transportation Authority (CCTA) has prepared
George Linatsas Group Managing Director Axia Ventures Group
 Investment Opportunities For Foreign Investors In The Greek Stock Market George Linatsas Group Managing Director Axia Ventures Group December 2, 2010 The Athens Exchange General Index has reached multi-year
Liquidity is Relevant Again
 Liquidity is Relevant Again April 2019 Not FDIC Insured May Lose Value No Bank Guarantee Not NCUA or NCUSIF insured. May lose value. No credit union guarantee. For institutional use only. l 2019 FMR LLC.
Perspective on Colorado s Budget and Economy
 Perspective on Colorado s Budget and Economy November 2012 Office of State Planning and Budgeting Henry Sobanet, Director Erick Scheminske, Deputy Director www.colorado.gov/ospb Comparison of Change in
Q Economic Outlook
 Q1 Economic Outlook Presented by: Craig Dismuke Chief Economic Strategist cdismuke@viningsparks.com 1/24/ Page 1 Q1 ECONOMIC OUTLOOK A. European Drama, Weak U.S. Growth, and Central Bank Intervention B.
Some Historical Examples of Yield Curves
 3 months 6 months 1 year 2 years 5 years 10 years 30 years Some Historical Examples of Yield Curves Nominal interest rate, % 16 14 12 10 8 6 4 2 January 1981 June1999 December2009 0 Time to maturity This
Quarterly Pooled Investment Fund Report As Prescribed By California Government Code Section For The Quarter Ended June 30, 2013
 Quarterly Pooled Investment Fund Report As Prescribed By California Government Code Section 53646 For The Quarter Ended June 30, 2013 Compliance to Investment Policy Based on the Director of Finance s
Portfolio Master Summary: This one page report summarizes all cash and investments held by the Water Authority.
 October 19, 2016 Attention: Administrative and Finance Committee Monthly Treasurer s Report on Investments and Cash Flow Purpose The purpose of the Treasurer s Report is to provide monthly financial information
Ohlone Community College District
 Ohlone Community College District General Obligation Bond Refinancing Overview June 8, 2016 Outstanding General Obligation Bonds Issue Date Issue Amount Description Call Date Maturity Outstanding 6/19/2002
Outstanding debt in all sectors of the US fixed income market has gone from $4.6 trillion in 1985 to $33 trillion in 2008.
 US Fixed Income Debt Outstanding and Issuance, Selected Years Outstanding debt in all sectors of the US fixed income market has gone from $4.6 trillion in 1985 to $33 trillion in 2008. In 2008, NYSE total
STAR Update December 8, 2015
 STAR Update December 8, 2015 James Pisula, Investment Officer, Office of Ohio Treasurer Josh Mandel Zach Amendolea, Investment Officer, Office of Ohio Treasurer Josh Mandel Jason Click, President, Public
Administrative Services Department 1901 Airport Road, Suite 210 South Lake Tahoe, CA (530) FAX
 FAX") 3 "making sfafifre~ 6fif nee now,, CITY COUNCIL MEETING OF AUGUST 16, 2016 To: From: Nancy Kerry, City Manager Debbie Mcintyre, Deputy Director, Financial Services RE : Investment Portfolio Report as of
3 "making sfafifre~ 6fif nee now,, CITY COUNCIL MEETING OF AUGUST 16, 2016 To: From: Nancy Kerry, City Manager Debbie Mcintyre, Deputy Director, Financial Services RE : Investment Portfolio Report as of
CITY OF SEAL BEACH Preliminary Investment Report 1/31/2014
 CITY OF SEAL BEACH Preliminary Investment Report 1/31/2014 Investments: Book Value Market Value LAIF City 17,500,674.80 17,500,674.80 LAIF Successor Agency 115,689.54 115,689.54 CDs and Bonds 28,163,009.89
Housing and Mortgage Market Update
 Housing and Mortgage Market Update VCU Real Estate Trends Conference October 14, 29 Amy Crews Cutts, PhD Deputy Chief Economist Recession Risks Still Elevated, Housing Contraction Ongoing Recession risks
QUARTERLY REPORT AND CERTIFICATION OF THE COUNTY TREASURER For Quarter Ending June 30, 2009 COMPLIANCE CERTIFICATION
 QUARTERLY REPORT AND CERTIFICATION OF THE COUNTY TREASURER For Quarter Ending June 30, 2009 The Government Code requires the County Treasurer to render a Quarterly Report to the County Administrator, the
Marquette Associates Market Environment
 M Marquette Associates Market Environment April 2010 U.S. Economy Fixed Income Markets U.S. Equity Markets International Equity Markets Hedge Fund Markets Real Estate Markets Private Equity and Hedge Fund
Fiscal Year 2018 Project 1 Annual Budget
 Fiscal Year 2018 Project 1 Annual Budget Table of Contents Table Page Summary 3 Summary of Costs Table 1 4 Treasury Related Expenses Table 2 5 Summary of Full Time Equivalent Table 3 6 Positions Cost-to-Cash
REQUEST FOR CITY COUNCIL ACTION. Receive and file the Treasurer's Report for the quarter ended March 31, 2014.
 REQUEST FOR CITY COUNCIL ACTION MEETING DATE: JUNE 10, 2014 TITLE: TREASURER'S REPORT FOR THE QUARTER ENDED MARCH 31, 2014 Di~~SeNices RECOMMENDED ACTION Receive and file the Treasurer's Report for the
January 25, 2017 Financial Markets & Debt Portfolio Update Contra Costa Transportation Authority Introduction Public Financial Management Inc. (PFM),
,") January 25, 2017 Introduction Public Financial Management Inc. (PFM), financial advisor to the (CCTA) has prepared the following report as an update of market conditions through December 30, 2016. The
January 25, 2017 Introduction Public Financial Management Inc. (PFM), financial advisor to the (CCTA) has prepared the following report as an update of market conditions through December 30, 2016. The
Investing a portion in longer term maturies, with the intention of holding to maturity, will improve overal invesmtent yields.
 Issue: The Development Fund is now accumulating funds for longer term projects. In accordance with Investment Policy (Board Resolution 2015-5, Attachment A), investment in instruments with a term greater
PRESENTATION BY JACOB A. FRENKEL AT THE FORUM: INTELLIGENCE ON THE WORLD, EUROPE, AND ITALY. Villa d'este, Cernobbio - September 7, 8 and 9, 2012
 PRESENTATION BY JACOB A. FRENKEL AT THE FORUM: INTELLIGENCE ON THE WORLD, EUROPE, AND ITALY Villa d'este, Cernobbio - September 7, 8 and 9, 1 Working paper, September 1. Kindly authorized by the Author.
5-yr Investment Grade Corporate CDS Markit (bps) 500
 500") Treasury Yield Curve (percent) 2-yr/1-yr Treasury Spread (bps) % 7. 35 6. 3 25 5. 2 4. 15 3. 2. 1. Treasury Curve 'A' Composite 1 5-5. 1-yr 5-yr 1-yr 3-yr The Treasury yield curve is derived from available
Treasury Yield Curve (percent) 2-yr/1-yr Treasury Spread (bps) % 7. 35 6. 3 25 5. 2 4. 15 3. 2. 1. Treasury Curve 'A' Composite 1 5-5. 1-yr 5-yr 1-yr 3-yr The Treasury yield curve is derived from available
Investment Portfolio Compliance Report July 31, County of Monterey. Investment Portfolio Compliance Report. July 31, 2017
 County of Monterey Investment Portfolio Compliance Report July 31, 2017 County of Monterey Investment Portfolio Compliance Report July 31, 2017 Sarah Meacham Managing Director 50 California Street Suite
ALAMO COLLEGES QUARTERLY INVESTMENT REPORT AS REQUIRED BY THE PUBLIC FUNDS INVESTMENT ACT FOR PERIOD BEGINNING SEPTEMBER 1, 2010 AND ENDING NOVEMBER
 QUARTERLY INVESTMENT REPORT AS REQUIRED BY THE PUBLIC FUNDS INVESTMENT ACT FOR PERIOD BEGINNING SEPTEMBER 1, 2010 AND ENDING NOVEMBER 30, 2010 Summary of Changes in Market Value for the Quarter: Total
Looking at a Variety of Municipal Valuation Metrics
 Looking at a Variety of Municipal Valuation Metrics Muni vs. Treasuries, Corporates YEAR MUNI - TREASURY RATIO YEAR MUNI - CORPORATE RATIO 200% 80% 175% 150% 75% 70% 65% 125% Average Ratio 0% 75% 50% 60%
BUTTE COUNTY TREASURER - INVESTMENT REPORT
 BUTTE COUNTY TREASURER - INVESTMENT REPORT September 30, 2005 AVERAGE PORTFOLIO AVERAGE PORTFOLIO MATURITY YIELD DIRECT INVESTMENTS* 917 Days 4.047% COMBINED PORTFOLIO** 755 Days 3.920% Cost Carried Monthly
Business & Financial Services December 2017
 Business & Financial Services December 217 Completed Procurement Transactions by Month 2 4 175 15 125 1 75 5 2 1 Business Days to Complete 25 Jan Feb Mar Apr May Jun Jul Aug Sep Oct Nov Dec 217 Procurement