STATE OF THE CANADIAN SPACE SECTOR
|
|
|
- Hillary Cooper
- 6 years ago
- Views:
Transcription

1 STATE OF THE CANADIAN SPACE SECTOR 2000 EXTERNAL RELATIONS DIRECTORATE CANADIAN SPACE AGENCY
2 TABLE OF CONTENTS MISSION STATEMENT About the Authors About this Report MESSAGE FROM THE PRESIDENT 2 EXECUTIVE SUMMARY 3 OVERVIEW OF THE REPORT 4 METHODOLOGY 4 ANNUAL STATISTICAL REVIEW 4 DEFINITION OF CANADA'S SPACE SECTOR 4 RESULTS 5 OVERALL REVENUES 5 DOMESTIC v. EXPORT REVENUES 5 DOMESTIC REVENUES 5 EXPORT REVENUES 6 REVENUES OF THE TOP 30 SPACE ORGANISATIONS 7 REVENUES BY SPACE CATEGORIES 7 Space Segment 7 Ground Segment 7 Applications and Services 7 Space Research 7 REVENUES BY SECTORS OF ACTIVITY 8 Telecommunications 8 Earth Observation 8 Robotics 8 Space Science 8 Navigation 8 Other 8 REVENUES BY REGION 9 British Columbia 9 Prairies 9 Ontario 9 Quebec 9 Atlantic Canada 10 SPACE SECTOR WORKFORCE 11 Workforce Groups 11 Workforce by Region 12 The Canadian Space Agency is committed to leading the development and application of space knowledge for the benefit of Canadians and humanity. About the Authors The External Relations Directorate manages the strategic relationships between the Canadian Space Agency and its domestic and international partners. Key mandates include the development and implementation of policies and strategies relating to co-operation partnerships with domestic stakeholders (Federal and Provincial governments, industry and academia) and international agencies and industries. External Relations plays a pivotal role in supporting the commercial initiatives of Canadian space companies on world markets - a core mandate of the CSA - and in providing stakeholders with strategic and timely information. About this Report The State of the Canadian Space Sector report provides those working in the space sector, government and industry alike, with insight into the sector in which we operate. In turn, this information supports decision-makers in their endeavor to make informed and strategic choices for the future. For more information Information specific to Canadian space business and industry, including an electronic version of this report, is found at the following address: /business/. Acknowledgments The CSA wishes to acknowledge the important contribution of the many organisations, both public and private, without which this report would simply not be possible. Government of Canada, 2002 Aussi disponible en français 1

3 MESSAGE FROM THE PRESIDENT I am very pleased to report that the first year of the new millennium for Canada s space industry produced steady revenues in the ever-volatile space marketplace. At C$1.43 billion, a slight increase over 1999 results, our space sector continued to garner the benefits of inroads into new and existing foreign markets. Export revenues rose fifteen percent to $656m in 2000, representing a record forty-six percent of total receipts compared to thirty-one percent five years earlier. Taking the lead once again were telecommunications activities at the core of Canada s legacy in space generating over sixty percent of overall revenues. Marc Garneau CSA President Numbers aside, it is becoming increasingly apparent that technological advancements in orbiting space technologies are giving way to innovations in their utilization. From the conservationist using remote sensing images to monitor forestry operations to the weekend backpacker using GPS to locate the trail, space is no longer out of reach for the average Canadian. Moreover, it is being applied to an even greater degree by governments at all levels to support public service activities, from surveillance to education to healthcare. As we continue to push the boundaries of space exploration, our space sector is transforming knowledge and technology into industrial prowess, in all regions of the country. The voyage is certainly not an easy one, with market forces sometimes as harsh as the space environment itself. Still, the prevailing confidence in Canada s space industry should prove invaluable through the ongoing quest for novel ideas, new opportunities and exciting discoveries exploited for the benefit of all Canadians. 2
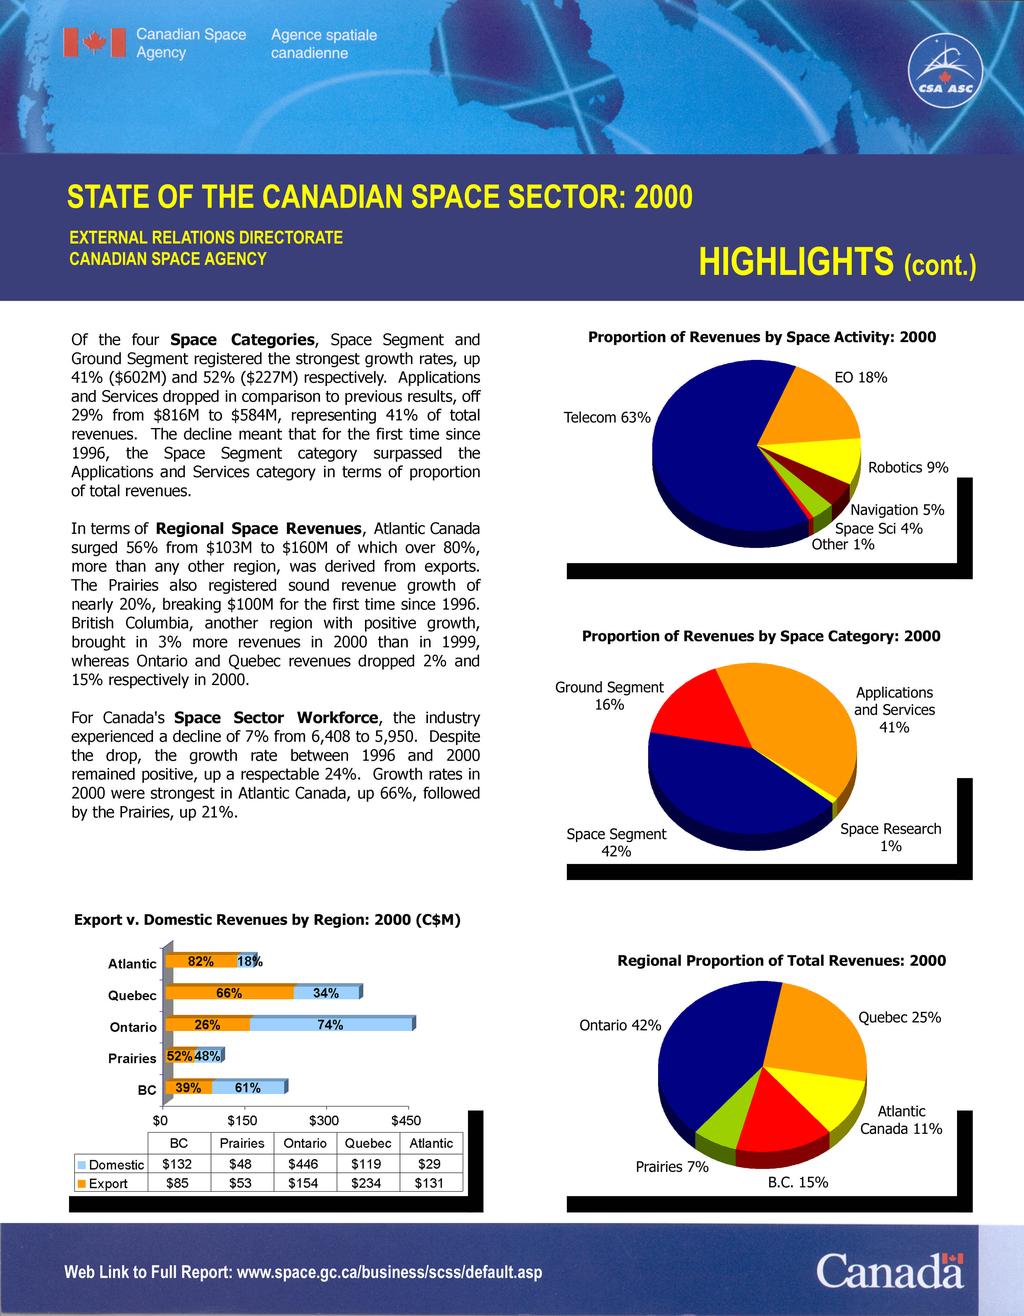
4 EXECUTIVE SUMMARY In 2000, Total Revenues in Canada s space sector remained stable, increasing less than 1% from $1.425b to $1.431b 1. Growth was due to increases in the export revenues of Canadian space sector companies. Although Domestic Revenues fell by $80m or 9%, from $855m to $775m, Export Revenues, on the other hand, rose a healthy 15%, from $571m to $656m. As a result, export revenues' proportion of total revenues rose from 40% to 46%, a level similar to 1997 and Between 1996 and 2000, overall export revenues increased by nearly 120% compared to 16% increases in overall domestic revenues - results that indicate an increasingly export-oriented space industry. Of the four Space Categories, Space Segment and Ground Segment registered the strongest growth rates, up 41% ($602m) and 52% ($227m) respectively. Applications and Services dropped in comparison to previous results, off 29% from $816m to $584m, representing 41% of total revenues. The decline meant that for the first time since 1996, the Space Segment category surpassed the Applications and Services category in terms of proportion of total revenues. In terms of Regional Space Revenues, Atlantic Canada surged 56% from $103m to $160m of which over 80%, more than any other region, was derived from exports. The Prairies also registered sound revenue growth of nearly 20%, breaking $100m for the first time since British Columbia, another region with positive growth, brought in 3% more revenues in 2000 than in 1999 whereas Ontario and Quebec revenues dropped 2% and 15% respectively in For Canada's Space Sector Workforce, the industry experienced a decline of 7% from 6,408 to 5,950. Despite the drop, the growth rate between 1996 and 2000 remained positive, up a respectable 24%. Growth rates in 2000 were strongest in Atlantic Canada, up 66%, followed by the Prairies, up 21%. Telecommunications continued to dominate Space Activities in Canada, generating 63% ($920m) of total space revenues. Earth Observation followed with 18% of overall revenues ($254m), representing a modest increase of 3%. On the downturn were Canada's Robotic activities, sliding 10% in 2000, along with Space Science which fell 23%. Navigation activities, on the other hand, recorded revenue increases of 15%, from $58m to $67m. OVERALL RESULTS: Year Total Revenues Domestic Revenues Exports Revenues Workforce $ $ % $ % n ,430,941, ,729, ,212, , ,425,256, ,455, ,800, , ,420,153, ,255, ,898, , ,256,362, ,006, ,355, , ,849, ,678, ,170, ,812 1 All currency in Canadian dollars. 3
5 OVERVIEW OF THE REPORT In order to measure the changes taking place in Canada s space sector, the CSA undertakes an annual survey and publishes the results in the State of the Canadian Space Sector report. The 2000 edition profiles the sector over the course of January 1 to December 31, Data is provided in the following areas: - Overall space revenues; - Domestic v. export revenues; - Revenues of Canada's Top 30 organisations developing and/or using space to generate revenues; - Revenues by space categories (Space Segment, Ground Segment, Applications and Services, and Space Research); - Revenues by sectors of activity (Telecommunications, Robotics, Earth Observation, Space Science, and Satellite Navigation); - Regional Revenues (British Columbia, Prairies, Ontario, Quebec and Atlantic Canada); - Workforce characteristics. METHODOLOGY Questionnaires were sent to over 200 private sector companies, research organisations and universities in Canada who have a defined strategic interest in the space industry. Additional data were collected through internal consultation with CSA and government officials whose dealings with stakeholders were deemed statistically relevant. DEFINITION OF CANADA'S SPACE SECTOR The Canadian space sector is defined as organisations (private, public and academic) whose activities rely on the development and use of space assets and/or space data. Accordingly, the sector encompasses the following activities: Space Segment: Research and Development (R&D), manufacturing, testing, integration and launch of platforms (satellites, spacecraft and robotic systems), complete systems, subsystems and components. Ground Segment: R&D, manufacturing, testing, and integration of facilities on Earth for controlling space-based systems and satellites, for linking satellites to operational terrestrial networks and for processing satellite-derived data. Applications and Services: Development and/or provision of services and value-added products and technologies that are derived from the use of space systems and/or data, and the provision of consulting and engineering services. Space Research: Primarily research related to non- or precommercial space activities. It is important to note that the company-specific information used to compile this report remains strictly confidential and cannot be released in a manner other than in an aggregate form. 2 Consequently, in certain circumstances, the authors are prevented from providing a more detailed explanation or indepth analysis of the results. ANNUAL STATISTICAL REVIEW In order to ensure high levels of reliability, the CSA conducts recurring reviews of survey results with its industrial partners. During the review process conducted throughout 2001 for the 2000 survey, certain companies reported that results submitted and reported in previous years, in particular 1998 and 1999, required adjustments. As a result, overall space revenues in 1998 were revised downward from $1.65b to $1.42b. In 1999, overall revenues were adjusted from $1.83b to $1.43b. The results presented in this report reflect these modifications. 2 CSA acknowledges a margin of error in the final results of approximately 2.5%. 4
6 REVENUES Overall Revenues Domestic v. Export Revenues OVERALL REVENUES In 2000, total revenues in Canada s space sector remained stable, increasing less than 1% from $1.425b to $1.431b. Over the three-year period, the sector experienced flat growth, rising a negligible 0.8% from $1.40b to $1.43b. However, the overall growth trend has been strong, rising 48% between 1996 and 2000, from $969m to $1.431b. $1,500 $1,200 Total Space Revenues: (C$m) $900 $600 $300 $0 $969 $1,256 $1,420 $1,425 $1,431 DOMESTIC v. EXPORT REVENUES From 1999 to 2000, revenues derived from domestic sources declined $80m (-9%) from $855m to $775m. This decline was offset by an increase in export revenues, up $85m (+15%) from $571m to $656m. The decline in domestic revenues resulted in a further decline in their proportion of overall revenues, slipping from 60% ($854m of $1.43b) in 1999 to 54% ($768m of $1.41b) in Alternatively, export revenues' proportion of overall space revenues rose from 40% to 46%. Over the timeframe, total export revenues increased by 118% - indicating an increasingly export-oriented space industry. By comparison, domestic revenues increased 16% over this same period, from $671m to $775m, peaking in 1999 at $855m. Domestic v. Export Revenues: (C$m) $900 $600 $300 $0 Domestic $671 $690 $802 $854 $775 Export $301 $566 $618 $571 $656 5
7 REVENUES Domestic Revenues Export Revenues DOMESTIC REVENUES In 2000, of the $775m total domestic revenues, nongovernmental sources ( Private ) declined nearly 40% from $583m to $353m. Domestic revenues attributed to government sources ("Public"), on the other hand, were up 55% from $271m to $422m, indicating an important public sector clientele for space-related products and services. The rise in revenues from government sources resulted in a noticeable change in the overall ratio between government/nongovernment sources of revenues - from 32/68% in 1999 to 54/46% in It marked the first year since data collection began in 1996 that revenues from government sources outweighed those from non-government sources. EXPORT REVENUES The U.S. market remained the dominant source of export revenues for Canada's space organisations, registering $348m or 53% of the $656m in total export revenues. Yet while results between 1996 and 2000 indicated a solid 94% increase in export revenues from our neighbors to the south (from $180m in 1996 to $348m in 2000), numbers have slid since the peak in 1998 ($383m), dropping 3% to $370m in 1999 and another 6% in 2000 to $348m. Revenues from Europe rose nearly 10% in 2000, up from $110m to $121m. In spite of this increase, Europe's proportion of the overall $656m export revenues remained relatively unchanged in 2000, accounting for 18% of the export market compared to 19% in With the exception of 1998, revenues from Europe have consecutively increased since up 71% over this five-year period. Revenues from Asia recovered in 2000, rising $16m or 29% from $55m to $71m (11% of total export revenues). This compares to a 25% decline registered between 1998 and 1999, a result of fluctuating Asian economies over this period. On the whole, Asia has proven a good source of revenues for Canada's space industry, up 180% between 1996 and In 2000, Canada's space industry conducted more and more business outside of traditional trade channels. In 2000, revenues from "Other" regions grew a remarkable 231%, from $35m to $116m. In fact, revenue levels in this category increased 356% from the initial low of $25m in Sources of revenues in this category include Canadian industrial activity in Australia, Africa, Central and South America, amongst others. Sources of Domestic Revenues: Public v. Private (C$m) $600 $400 $200 $0 $400 $300 $200 $100 $0 Public $241 $208 $271 $271 $422 Private $430 $482 $531 $583 $353 Sources of Export Revenues: (C$m) US $180 $364 $383 $370 $348 Europe $71 $100 $98 $110 $121 Asia $25 $73 $74 $55 $71 Other $25 $30 $63 $35 $116 Sources of Export Revenues: 2000 Europe 18.4% US 53.0% Asia 10.8% Africa 0.3% Oceania 0.8% Other 16.7% 6
8 REVENUES Revenues of Canada s Top 30 Revenues by Space Categories REVENUES OF CANADA S TOP 30 SPACE ORGANISATIONS The Top 30 Canadian organisations developing and/or using space assets account for 97% of the total space revenues in This was up from the 1999 level of 94%, and is consistent with the upward trend since the 1996 level of 86%. Of the total number of respondents in 2000, 44 organisations reported revenues equal to or in excess of $1m, a sum that has remained relatively stable since 1997 (42 in 1997, 44 in 1998 and 45 in 1999). By comparison, these numbers fall short of the 1996 results in which 77 companies reported revenues equal to or in excess of $1m. REVENUES BY SPACE CATEGORIES Space Segment: continued to climb, up 41% to a new level of $602m over $425m in Overall, a 76% increase since The Space Segment category accounted for 42% of total revenues compared to 30% in Ground Segment: even stronger growth rates in 2000, up 56% to $228m from $147m in This result meant a recovery to levels consistent with those of 1997 and 1998, registering $211m and $213m respectively. As a proportion of total revenues, the Ground Segment category rose from 10% in 1999 to 16% in Applications and Services: 2000 results were in the order of $584m compared to $816m in 1999, a drop of 29%. For the first time since 1996, the Space Segment category (42%) surpassed the Applications and Services category (41%) in terms of proportion of total revenues, a category that had previously occupied 57% of the revenue returns in 1999 and over 60% in Total Revenues by Space Category: (C$m) $1,000 $800 $600 $400 $200 $0 Apps & Services $532 $558 $929 $816 $584 Space Segment $342 $466 $294 $425 $602 Ground Segment $79 $211 $213 $147 $229 Space Research $16 $21 $34 $37 $16 Proportion of Revenues by Space Category: 2000 Ground Segment 16% Applications and Services 41% Space Research: the upward trend registered between 1996 and 1999 reversed significantly in 2000, with revenues falling 56% to $16m revenues from the space research category returned to levels recorded in 1996, where they accounted for 1% of total revenues. Space Segment 42% Space Research 1% 7
9 REVENUES Revenues by Sectors of Activity REVENUES BY SECTOR OF ACTIVITY Telecommunications: Telecommunications continued to dominate Canada's space sector activities in 2000, generating 63% or $920m of total revenues. This represents a 2% increase over the 1999 results of $901m yet is below the 1998 peak of $960m. Between 1996 and 2000, telecommunications activities rose 59%, from $580m to $920m. Earth Observation: Earth Observation (EO) activities made up the second largest space sector activity in 2000 with revenues in the order of $254m, up 3% from the 1999 results of $246m. In comparison to other sectors, EO comprised 18% of total space revenues in 2000, a proportion similar to 1999 and registered the most significant increase between 1996 and 2000, up $147m or 137%. Robotics: Canada's Robotic activities fell by 10% in 2000, from $140M to $126M. Between 1996 and 2000, this activity declined by 32%. As a proportion of all activities, revenues generated from Robotics activities continued to hover around the 10% level (10% in 1997, 9% in 1998, 10% in 1999 and 9% in 2000). Space Science: A downturn in the Research category was matched by a similar decline in Space Science activities, down 23% in 2000 to $52m from the 1999 plateau of $68m. As a proportion of all activities, revenues generated from Space Science activities in 2000 constituted 4% of total revenues. Over the five-year 1996 to 2000 period, revenues in the Space Science sector declined by 9%. Navigation: Navigation activities, principally those exploiting the Global Positioning System (GPS) satellite network, recorded revenues of $67m in 2000, up 15% from 1999 ($58m). Since being separated from the "Other" sector, Navigation revenues have registered limited growth rates, around 1% since Navigation generated approximately 5% of total revenues in Other: Organisations reporting space-related activities in a sector of activity "Other" than those mentioned above recorded similar revenues in 2000 ($11.9m) as in 1999 ($12.3m). Revenues by Sector of Activity: 1996 to 2000 (C$m) $1,000 $100 $10 Telecom $580 $861 $960 $901 $920 Robotics $184 $126 $134 $140 $126 EO $107 $177 $166 $246 $254 Sp Science $57 $45 $47 $68 $52 Navigation $67 $58 $67 Other $41 $47 $47 $12 $12 Proportion of Revenues by Space Activity: 2000 Telecom 63% EO 18% Robotics 9% Navigation 5% Space Sci 4% Other 1% 8
10 REVENUES Revenues by Region REVENUES BY REGION British Columbia: British Columbia (B.C.) ranked third in terms of total revenues (15%) and brought in 3% more revenues in 2000 than 1999, from $211m to $217m. Despite a decline in 1999 (-8%), B.C. has generated strong revenue growth since 1996, up 195% from $74m to $217m. Accordingly, its share of total revenues rose in 2000 from 8% to 15%. B.C. also remained domestically oriented, with over 60% of the region's space revenues ($132m) derived from domestic sources, compared to nearly 40% ($85m) from exports. Between 1996 and 2000, B.C.'s domestic space revenues increased by over 240%, from $38m to $132m. Exports faired equally well, up 142% from $35m to $85m. Prairies: Canada's Prairie region (defined by Alberta, Saskatchewan and Manitoba) registered sound revenue growth of nearly 20%, breaking $100m for the first time since Between 1996 and 2000, its ratio of total revenues rose from 4 to 7%. In 2000, the region registered an almost even 50/50 ($48m/$53m) domestic/export revenue split. Over the period, domestic revenues rose over 200%, from $15m to $48m. Exports were equally healthy over this same period, growing by over 100% from $26m to $53m. Ontario: Though generating more revenues than any other region, Ontario experienced a 2% decrease in 2000, from $611m to $600m. The province's ratio of total revenues also declined further from the 1996 peak of 53% to 44% in Domestic revenues dominated at 74% ($446m) compared to 26% ($154m) from exports. Between 1996 and 2000, growth rates of domestic v. export revenues moved in opposite directions; space revenues derived from domestic sources rose 32% from $338m to $446m whereas export revenue sources declined 14% from $179m to $154m. Overall, the five-year rate of revenue growth in the province rose 16%. Revenues by Region: (C$m) $700 $600 $500 $400 $300 $200 $100 $0 B.C. $74 $139 $229 $211 $217 Prairies $41 $67 $72 $85 $101 Ontario $518 $525 $614 $611 $600 Quebec $328 $467 $445 $415 $353 Atlantic $9 $58 $60 $103 $160 Regional Proportion of Total Revenues: 2000 Ontario 42% Quebec 25% Quebec: Revenues generated in Quebec experienced the sharpest drop in 2000, down 15% from $415m to $353m. As such, the province's share of total space revenues slipped from 29% to 25%. In spite of a third consecutive decline since the peak of $467m in 1997 ($445m in 1998, $415m in 1999 and $353m in 2000), Quebec still registered a positive growth rate of 8% between 1996 and This growth was predominantly due to stronger export revenues: In 2000, over 66% ($234m) of the $353m of provincial revenues came from exports, an increase of 27% over 1999 ($183m). By comparison, returns from domestic revenues were $120m, a drop of nearly 50% over 1999 ($232m to $120m). Prairies 7% B.C. 15% Atlantic Canada 11% 9
11 REVENUES Revenues by Region REVENUES BY REGION CONT. Quebec cont. Over the course of 1996 to 2000, the trade-off between Quebec's domestic and export revenues was noteworthy. In 1996, 82% of Quebec's space revenues were derived domestically compared to 18% from exports. By 2000, domestic revenues had dropped to 34% of the provinces overall revenues while exports had risen to 66%. Between 1996 and 2000, exports increased by 88% from $58m to $234m. Domestic revenues subsequently declined by $151m, or 56%, from $270m to $120m. Atlantic Canada: On Canada s east coast, Atlantic Canada (defined as Newfoundland, New Brunswick, Nova Scotia and Prince Edward Island) revenues grew by 56% from $103m to $160m. The region's share of the national revenues also rose rather soundly from 7% to 11%. Similar to Quebec, Atlantic Canada is increasingly export oriented with 82% of the region's space revenues generated from abroad, a jump of 46% over Export v. Domestic Revenues by Region: 2000 (C$m) Atlantic 82% 18% Quebec 66% 34% Ontario 26% 74% Prairies 52% 48% BC 39% 61% $0 $150 $300 $450 BC Prairies Ontario Quebec Atlantic Domestic $132 $48 $446 $119 $29 Export $85 $53 $154 $234 $131 10
12 SPACE SECTOR WORKFORCE Workforce Groups SPACE SECTOR WORKFORCE In 2000, the workforce in Canada s space industry declined 7%, from 6,408 to 5,950 - a level similar to that of Nevertheless, the growth rate between 1996 and 2000 remained positive, growing 24% from 4,812 to 5,950. 7,000 6,000 5,000 4,000 3,000 2,000 1,000 0 Space Sector Workforce: ,812 5,336 5,930 6,408 5,950 WORKFORCE GROUPS Of the five main sector employment groups, the "Engineers and Scientists" group comprised the highest number of employees, 2,128 or 36% of the total workforce. Below is a chart that outlines the results for all employment groups: Workforce Groups by Region: 2000 Atlantic Quebec Ontario Prairies Workforce by Space Employment Categories: 2000 Mngmt 11% Eng/Scientists 35% Admin/Other 28% Mktg/Sales 7% Technicians 19% BC 0 1,000 2,000 3,000 BC Prairies Ontario Quebec Atlantic Total Technicians ,127 Mktg/ Sales Mngmt Eng/ Scientists ,128 Admin/ Other , ,658 Total ,794 1, ,953 11
13 SPACE SECTOR WORKFORCE Workforce by Region WORKFORCE BY REGION British Columbia employed 817 or 14% of the nation's space workforce in 2000, a 32% decline from the 1999 high of 1,193. Between 1996 and 2000, however, the growth rate was 13% from 721 to 817, with the ratio of the national workforce remaining constant at around 14-15%. As a reversal to the 11% drop in 1999, the workforce in the Prairies rose 21% in 2000, from 414 to 499, which represented 8% of the national workforce. Between 1996 and 2000, this region's overall space sector workforce increased by over 70%, from 288 to nearly 500. In 2000, Ontario continued to employ nearly half, 2,793 or 46%, of the nation's space sector workforce. This figure, however, represented a drop of 273 employees (-9%) from 3,066 to 2,793. Between 1996 and 2000, Ontario's workforce rose by 13%, from 2,470 to 2,793. Similar to Ontario, Quebec recorded a 12% decline in its workforce in 2000, slipping from 1,335 to 1,176. Quebec employed nearly 20% of the overall workforce in Over the five-year period, Quebec s space sector workforce underwent little to no change, from 1,172 in 1996 to 1,176 in Atlantic Canada employed 11% of the country's space sector workforce in 2000, jumping an unprecedented 66% from 401 to 665. Since 1996, Atlantic Canada jobs linked to space-related assets rose more than any other region, up over 300% from the 1996 results of 161 workers, largely due to a strong telecommunications service sector. Space Sector Workforce by Region: ,500 3,000 2,500 2,000 1,500 1, B.C ,023 1, Prairies Ontario 2,470 2,115 2,870 3,066 2,793 Quebec 1,172 1,534 1,291 1,335 1,176 Atlantic

14
15
STATE OF THE CANADIAN SPACE SECTOR Policy and External Relations
 STATE OF THE CANADIAN SPACE SECTOR Policy and External Relations 2007 0 TABLE OF CONTENTS MISSION STATEMENT About the Authors About this Report MESSAGE FROM THE PRESIDENT 2 EXECUTIVE SUMMARY 3 TEN YEAR
STATE OF THE CANADIAN SPACE SECTOR. Policy and External Relations
 STATE OF THE CANADIAN SPACE SECTOR Policy and External Relations Table of Contents MANDAT STATEMENT 3 MESSAGE FROM THE PRESIDENT 5 RADARSAT-1 RSAT Mosaic of Africa RADARSAT -1 Mosaic of the Maritimes EXECUTIVE
STATE OF THE CANADIAN SPACE SECTOR Policy and External Relations
 STATE OF THE CANADIAN SPACE SECTOR Policy and External Relations State of the Canadian Space Sector Table of Contents Mission STATEMENT 4 MESSAGE FROM THE PRESIDENT 6 EXECUTIVE SUMMARY 7 METHODOLOGY 8
THE STATE OF THE CANADIAN SPACE SECTOR 1998 AND 1999 EXTERNAL RELATIONS DIRECTORATE CANADIAN SPACE AGENCY
 THE STATE OF THE CANADIAN SPACE SECTOR AND EXTERNAL RELATIONS DIRECTORATE CANADIAN SPACE AGENCY TABLE OF CONTENTS MISSION STATEMENT 1 FOREWORD BY W.M. (MAC) EVANS, CSA PRESIDENT 2 EXECUTIVE SUMMARY 3 OVERVIEW
BC JOBS PLAN ECONOMY BACKGROUNDER. Current statistics show that the BC Jobs Plan is working: The economy is growing and creating jobs.
 We know that uncertainty continues to remain in the global economy and we expect to see some monthly fluctuations in jobs numbers. That is why we will continue to create an environment that is welcoming
2010 CSA Survey on Retirement and Investing
 2010 CSA Survey on Retirement and Investing Prepared for: Canadian Securities Administrators Executive Summary September 28, 2010 www.ipsos.ca TABLE OF CONTENTS EXECUTIVE SUMMARY... 1 Key Findings... 1
Alberta s Labour Productivity Declined in 2016
 ECONOMIC COMMENTARY Alberta s Labour Productivity Declined in 2016 Highlights: The 2015/2016 recession and the Fort Mc Murray forest fires caused Alberta s labour productivity to decline again in 2016
CREA Updates Resale Housing Forecast Ottawa, ON, December 15, 2014
 CREA Updates Resale Housing Forecast Ottawa, ON, December 15, 2014 The Canadian Real Estate Association (CREA) has updated its forecast for home sales activity via the Multiple Listing Service (MLS ) Systems
Trends in Labour Productivity in Alberta
 Trends in Labour Productivity in Alberta July 2012 -2- Introduction Labour productivity is the single most important determinant in maintaining and enhancing sustained prosperity 1. Higher productivity
Catalogue no XIE. Income in Canada
 Catalogue no. 75-202-XIE Income in Canada 2005 How to obtain more information Specific inquiries about this product and related statistics or services should be directed to: Income in Canada, Statistics
LETTER. economic. Slowdown in international trade: has interprovincial trade made up for it? DECEMBER bdc.ca
 economic LETTER DECEMBER Slowdown in international trade: has interprovincial trade made up for it? Canada has always been a country open to the world, but it has become increasingly so over the years.
This document is available on demand in multiple formats by contacting O-Canada ( ); teletypewriter (TTY)
; teletypewriter (TTY)") You can download this publication by going online: canada.ca/publicentre-esdc This document is available on demand in multiple formats by contacting 1 800 O-Canada (1-800-622-6232); teletypewriter (TTY)
You can download this publication by going online: canada.ca/publicentre-esdc This document is available on demand in multiple formats by contacting 1 800 O-Canada (1-800-622-6232); teletypewriter (TTY)
Mortgage Loan Insurance Business Supplement
 CANADA MORTGAGE AND HOUSING CORPORATION Mortgage Loan Insurance Business Supplement FIRST QUARTER March 31, 2015 To supplement CMHC s unaudited Quarterly Consolidated financial statements, which are prepared
Catalogue no XIE. Income in Canada. Statistics Canada. Statistique Canada
 Catalogue no. 75-202-XIE Income in Canada 1999 Statistics Canada Statistique Canada How to obtain more information Specific inquiries about this product and related statistics or services should be directed
Measuring Nova Scotia s Results in Health Research
 Collins Management Consulting & Research Ltd. Measuring Nova Scotia s Results in Health Research 2009 Update Report Health Research 2009 Update Report Prepared on behalf of the Nova Scotia Health Research
Canada Education Savings Program Annual Statistical Review Canada Education Savings Program LC E
 Canada Education Savings Program Annual Statistical Annual Review Statistical 2013 Review 2013 Canada Education Savings Program LC-146-07-14E You can download this publication by going online: http://www12.hrsdc.gc.ca
Net interest income on average assets and liabilities Table 66
 Supplemental information Net interest income on average assets and liabilities Table 66 Average balances Interest (1) Average rate (C$ millions, except percentage amounts) 2009 2008 2007 2009 2008 2007
Federal and Provincial/Territorial Tax Rates for Income Earned
 by a CCPC Effective January 1, 2015 and 2016 by a CCPC Effective January 1, 2015 1 Federal rates General corporate rate 38.0% 38.0% 38.0% Federal abatement (10.0) (10.0) (10.0) 28.0 28.0 28.0 business
Canada Education Savings Program Annual Statistical Review. December 2008
 Canada Education Savings Program Annual Statistical Review December 2008 TABLE OF CONTENTS MESSAGE TO STAKEHOLDERS... 3 CANADA EDUCATION SAVINGS PROGRAM (CESP)... 4 REPORT METHODOLOGY... 4 KEY HIGHLIGHTS
STATISTICS CANADA RELEASES 2015 NET FARM INCOME AND FARM CASH RECEIPTS DATA
 STATISTICS CANADA RELEASES 2015 NET FARM INCOME AND FARM CASH RECEIPTS DATA 2015 NET FARM INCOME On May 25, 2016 Statistics Canada released estimates of Net Farm Income for Canada and the provinces for
Catalogue no XIE. Income in Canada. Statistics Canada. Statistique Canada
 Catalogue no. 75-202-XIE Income in Canada 2000 Statistics Canada Statistique Canada How to obtain more information Specific inquiries about this product and related statistics or services should be directed
Canada Social Report. Welfare in Canada, 2013
 Canada Social Report Welfare in Canada, 2013 Anne Tweddle, Ken Battle and Sherri Torjman November 2014 Copyright 2014 by The Caledon Institute of Social Policy ISBN 1-55382-630-2 Published by: Caledon
Trends in Labour Productivity in Alberta
 Trends in Labour Productivity in Alberta June 2016 -2- Introduction Labour productivity is the single most important determinant in maintaining and enhancing sustained prosperity for Albertans. Higher
Real Estate Rental and Leasing and Property Management
 Catalogue no. 63-249-X. Service bulletin Real Estate Rental and Leasing and Property Management 2011. Highlights In 2011, real estate rental and leasing and property management industries generated $82.6
MLS Sales vs. Listings (seasonaly adjusted)
") QUARTER 4: Canada Guaranty Housing Market Review OCTOBER - DECEMBER 21 The Canadian economy posted positive indicators of growth in early 21; however, the optimistic sentiment deteriorated in the latter
QUARTER 4: Canada Guaranty Housing Market Review OCTOBER - DECEMBER 21 The Canadian economy posted positive indicators of growth in early 21; however, the optimistic sentiment deteriorated in the latter
Canada Education Savings Program Annual Statistical Review Canada Education Savings Program Annual Statistical Review 2014 LC E
 Canada Education Savings Program Annual Statistical Review 2013 Canada Education Savings Program Annual Statistical Review 2014 LC-155-07-15E You can download this publication by going online: publicentre.esdc.gc.ca
Post-Secondary Education, Training and Labour Prepared May New Brunswick Minimum Wage Report
 Post-Secondary Education, Training and Labour Prepared May 2018 2018 New Brunswick Minimum Wage Report Contents Section 1 Minimum Wage Rates in New Brunswick... 2 1.1 Recent History of Minimum Wage in
Post-Secondary Education, Training and Labour August New Brunswick Minimum Wage Factsheet 2017
 Post-Secondary Education, Training and Labour August 2017 New Brunswick Minimum Wage Factsheet 2017 Contents PART 1 - Minimum Wage Rates in New Brunswick... 3 1.1 Recent History of Minimum Wage in New
Post-Secondary Education, Training and Labour Prepared November New Brunswick Minimum Wage Report
 Post-Secondary Education, Training and Labour Prepared November 2018 2018 New Brunswick Minimum Wage Report Contents Section 1 Minimum Wage Rates in New Brunswick... 2 1.1 Recent History of Minimum Wage
RESIDENTIAL SUMMARY 94,100 NEW ENTRANTS 37,400 (-7.3%) EMPLOYMENT CHANGE
 EMPLOYMENT CHANGE") CONSTRUCTION & MAINTENANCE LOOKING FORWARD RESIDENTIAL SUMMARY Retirements dominate hiring needs; 118,000 expected to retire by 2026 New workers will be required in residential construction over the 2017
CONSTRUCTION & MAINTENANCE LOOKING FORWARD RESIDENTIAL SUMMARY Retirements dominate hiring needs; 118,000 expected to retire by 2026 New workers will be required in residential construction over the 2017
Real Estate Rental and Leasing and Property Management
 Catalogue no. 63-249-X. Service bulletin Real Estate Rental and Leasing and Property Management 2009. Highlights In 2009, real estate rental and leasing and property management industries generated $76.5
CREA Updates Resale Housing Forecast Ottawa, ON, September 15, 2016
 CREA Updates Resale Housing Ottawa, ON, September 15, 2016 The Canadian Real Estate Association (CREA) has updated its forecast for home sales activity via the Multiple Listing Service (MLS ) Systems of
Gross Domestic Expenditures on Research and Development in Canada (GERD), and the Provinces
, and the Provinces") Catalogue no. 88-221-X Gross Domestic Expenditures on Research and Development in Canada (GERD), and the Provinces National estimates 2002 to 2012 / estimates 2006 to 2010 How to obtain more information
Catalogue no. 88-221-X Gross Domestic Expenditures on Research and Development in Canada (GERD), and the Provinces National estimates 2002 to 2012 / estimates 2006 to 2010 How to obtain more information
Source(s): Statistics Canada, Cansim Table , Seasonally Adjusted
: Statistics Canada, Cansim Table , Seasonally Adjusted") Monthly Headlines Low Loonie Not Increasing Canadian Manufacturing Employment... Yet. From June to July, total employment fell by 600 (-0.3%) to 236,500 on a seasonally adjusted basis. i While full-time
Monthly Headlines Low Loonie Not Increasing Canadian Manufacturing Employment... Yet. From June to July, total employment fell by 600 (-0.3%) to 236,500 on a seasonally adjusted basis. i While full-time
Q Introduction. Investment and fundraising. ($ millions) Increase in year-over-year investment
 Increase in year-over-year investment") Q4 www.sme-fdi.gc.ca/vcmonitor Introduction This year-end issue of the Venture Capital Monitor covers venture capital (VC) activity from January to December, which experienced its highest level of investments
Q4 www.sme-fdi.gc.ca/vcmonitor Introduction This year-end issue of the Venture Capital Monitor covers venture capital (VC) activity from January to December, which experienced its highest level of investments
VENTURE CAPITAL MONITOR
 Q1 212 www.ic.gc.ca/vcmonitor VENTURE CAPITAL MONITOR A QUARTERLY UPDATE ON THE CANADIAN VENTURE CAPITAL INDUSTRY This publication provides current information about the venture capital industry in Canada.
Welfare in Canada 2012
 Welfare in Canada 2012 by Anne Tweddle, Ken Battle and Sherri Torjman December 2013 Welfare in Canada 2012 by Anne Tweddle, Ken Battle and Sherri Torjman December 2013 Copyright 2013 by The Caledon Institute
Policy Brief. Canada s Labour Market Puts in a Strong Performance in The Canadian Chamber is committed to fostering.
 Canada s Labour Market Puts in a Strong Performance in 2012 Introduction Policy Brief Economic Policy Series February 2013 Canada s labour market ended 2012 on a high note with almost 100,000 net new jobs
Net interest income on average assets and liabilities Table 75
 Supplementary information Net interest income on average assets and liabilities Table 75 balances Interest rate (Millions of dollars, except for percentage amounts) 2014 2013 2012 (1) 2014 2013 2012 (1)
What s Next for Canada s Construction Industry,
 What s Next for Canada s Construction Industry, 216-225 New Brunswick Building Trades March 23, 216 Tracking conditions by province... How are investments and labour demands stacking up or changing? What
Sound Recording and Music Publishing
 Catalogue no. 87F0008X. Service bulletin Sound Recording and Music Publishing 2009. Highlights In 2009, the Canadian Sound Recording Industry experienced a 3.2% decline in its combined operating revenues
Comparing Ontario s Fiscal Position with Other Provinces
 Comparing Ontario s Fiscal Position with Other Provinces Key Points In 2017, the Ontario provincial government received $10,415 in total revenue per person 1, the lowest in the country. Despite the lowest
Specialized Design Services
 Catalogue no. 63-251-X. Service bulletin Specialized Design Services 2012. Highlights revenues generated by businesses in the specialized design services industries increased 3.8% to $2.9 billion in 2012,
Budget As the leading voice CORE
 As the industry recovers and looks to develop a more innovative and greener approach to mineral exploration, the PDAC is urging government to invest in Aboriginal communities, support exploration and development
Business Barometer Newfoundland & Labrador
 Newfoundland & Labrador February 18 Optimism among Newfoundland & Labrador's small businesses improved again in February. Its Business Barometer bounced almost points to reach 6.. The other indicators
Scotiabank Ombudsman. Annual Report. The Year in Review. Click here
 Annual Report Scotiabank Ombudsman The Year in Review The Canadian economy, like the global economy, continued to expand at a moderate rate in for the second year in a row. At Scotiabank s Office of the
2001 COOPERATIVE CREDIT ASSOCIATIONS - (in thousands of dollars) TABLE 1 - ASSETS
 TABLE 1 - ASSETS") TABLE 1 - ASSETS British Columbia Ontario Ltd. Nova Scotia Alberta Canada Cash resources 0 28,905 5 19,473 2,622 Deposits with regulated financial institutions.. 532,821 32,743 160,372 8,802 0 Securities
TABLE 1 - ASSETS British Columbia Ontario Ltd. Nova Scotia Alberta Canada Cash resources 0 28,905 5 19,473 2,622 Deposits with regulated financial institutions.. 532,821 32,743 160,372 8,802 0 Securities
Saskatchewan Labour Force Statistics
 Saskatchewan Labour Force Statistics April 2017 UNADJUSTED DATA According to the Statistics Canada Labour Force Survey during the week covering April 9 th to 15 th,, 2017, there were 560,100 persons employed
National Instrument Definitions. (3) In a national instrument or multilateral instrument
 In a national instrument or multilateral instrument") PART 1 DEFINITIONS AND INTERPRETATION 1.1 and Interpretation (1) Every term that is defined or interpreted in the statute of the local jurisdiction referred to in Appendix B, the definition or interpretation
PART 1 DEFINITIONS AND INTERPRETATION 1.1 and Interpretation (1) Every term that is defined or interpreted in the statute of the local jurisdiction referred to in Appendix B, the definition or interpretation
GLOBAL ECONOMICS GLOBAL AUTO REPORT
 Canadian Auto Sales Expected to Total Million Units in 1 BEST BACK-TO-BACK ANNUAL TOTAL ON RECORD, EVEN AS SALES IN ONTARIO DECLINE 3% Canadian passenger vehicle sales exceeded mn units for the first time
VENTURE CAPITAL MONITOR
 VENTURE CAPITAL MONITOR A QUARTERLY UPDATE ON THE CANADIAN VENTURE CAPITAL INDUSTRY www.ic.gc.ca/vcmonitor This publication by the Small Business Branch provides current information about the venture capital
NATIONAL INSTRUMENT DEFINITIONS Act means the Securities Act of 1933 of the United States of America, as amended from time to time;
 This document is an unofficial consolidation of all amendments to National Instrument 14-101 Definitions, current to December 7, 2017. It includes local amendments made outside Ontario, as set out in CSA
National System Results. Fourth Quarter 2016
 National System Results Fourth Quarter 2016 National System Results Fourth Quarter 2016 Canadian credit unions ended 2016 with solid growth and a strong balance sheet. Canadian Credit Union Association
Past, Present, Future. Health Care Costs in Ontario
 Past, Present, Future Health Care Costs in Ontario Spring 2017 About this Document The Institute of Fiscal Studies and Democracy (IFSD) is a Canadian think-tank sitting at the nexus of public finance and
THE HOME STRETCH. A Review of Debt and Home Ownership Among Canadian Seniors
 THE HOME STRETCH A Review of Debt and Home Ownership Among Canadian THE HOME STRETCH The importance of property ownership is deeply ingrained in Canadian society, economy and politics. The drive to own
KEY SMALL BUSINESS STATISTICS
 KEY SMALL BUSINESS STATISTICS JUNE 2016 Innovation, Science and Economic Development Canada Small Business Branch www.ic.gc.ca/sbstatistics This publication is also available online in HTML in print-ready
CANADIAN MANUFACTURERS & EXPORTERS BUSINESS CONDITIONS SURVEY
 CANADIAN MANUFACTURERS & EXPORTERS BUSINESS CONDITIONS SURVEY August 2009 CME Business Conditions Survey August 2009 CME, in partnership with member associations of the Canadian Manufacturing Coalition,
Business Barometer Newfoundland & Labrador
 Newfoundland & Labrador July Business optimism in Newfoundland & Labrador has bounced up slightly. The July Business Barometer gained almost three points and reached 2.9 still below the national average
Highlights. For the purpose of this profile, the population is defined as women 15+ years.
 A L B E R T A L A B O U R F O R C E P R O F I L ES Women 2014 Highlights For the purpose of this profile, the population is defined as women 15+. Working Age Population of Women in Alberta The number of
POVERTY PROFILE UPDATE FOR
 POVERTY PROFILE UPDATE FOR 1991 National Council of Welfare Jeanne Mance Building OTTAWA K1A 0K9 613 957-2961 Winter 1993 POVERTY IN CANADA IN 1991 The pages that follow contain selected poverty statistics
LETTER. economic. Future of the manufacturing sector JUNE bdc.ca
 economic LETTER JUNE Future of the manufacturing sector Canada s manufacturing sector has had quite a rough ride over the past decade, but it has not suffered alone. The development of emerging countries,
Annual Alberta Labour Market Review
 06 Annual Alberta Labour Market Review Employment Unemployment EconomicRegions Migration Industries Wages Occupations Education HoursWorked UnionCoverage Demographics AboriginalPeople Employment ALBERTA
HOUSING MARKET OUTLOOK Canada Edition
 H o u s i n g M a r k e t I n f o r m a t i o n HOUSING MARKET OUTLOOK Canada Edition C a n a d a M o r t g a g e a n d H o u s i n g C o r p o r a t i o n Date Released: Third Quarter 2011 Canada s Housing
Economic Spotlight. ALBERTA FINANCE Office of Budget and Management March 23, 2006 ALBERTA S ECONOMIC PERFORMANCE:
 Economic Spotlight ALBERTA FINANCE Office of Budget and Management March 23, 2006 ALBERTA S ECONOMIC PERFORMANCE: 1994-2004 A review of Alberta s record on growth, innovation & diversification INTRODUCTION
Insolvency Statistics in Canada. September 2015
 Insolvency Statistics in Canada September 2015 List of Tables Table 1: Total Insolvencies... 1 Table 2: Insolvencies Filed by Consumers... 2 Table 3: Insolvencies Filed by Businesses... 3 Table 4: Insolvencies
Comments on Selected Financial Information. 4.3 Debt
 4.3 Debt As at 31 March 2006, borrowings were reported in the Consolidated Statement of Financial Position at $6.5 billion, which represents total borrowings of $7.4 billion less sinking fund assets of
KEY SMALL BUSINESS STATISTICS
 KEY SMALL BUSINESS STATISTICS JUNE 2016 Innovation, Science and Economic Development Canada Small Business Branch www.ic.gc.ca/sbstatistics This publication is also available online in HTML in print-ready
2. Full-time staffing intentions, next 3 months 3. General state of business health. * 12-month moving averages. * 12-month moving averages.
 Newfoundland & Labrador March After two months of improved optimism, Newfoundland & Labrador's small businesses have seen a less confident month of March. The Business Barometer lost almost 4 points to
Operating revenues earned by engineering firms were $25.8 billion in 2011, up 14.2% from 2010.
 Catalogue no. 63-258-X. Service bulletin Engineering Services 2011. Highlights Operating revenues earned by engineering firms were $25.8 billion in 2011, up 14.2% from 2010. Similarly, the industry s operating
2008 ANNUAL ALBERTA LABOUR MARKET REVIEW
 ANNUAL ALBERTA LABOUR MARKET REVIEW employment unemployment economic regions migration aboriginal people industries occupations education demographics Employment and Immigration EMPLOYMENT Employment increased
State. of the Economy CANADIAN CENTRE FOR POLICY ALTERNATIVES. By David Robinson. Volume 1 No. 2 Spring What s Inside:
 State Volume 1 No. 2 Spring 2001 of the Economy By David Robinson CANADIAN CENTRE FOR POLICY ALTERNATIVES What s Inside: The U.S. slowdown spills into Canada The Outlook for Canada Government revenue losses
Statistical Overview of the Canadian Maple Industry 2016
 Statistical Overview of the Canadian Maple Industry 2016 Prepared by: Market Analysis and Information Section Horticulture and Cross Sectoral Division Agriculture and Agri-Food Canada October 2017 Her
The Nova Scotia Minimum Wage Review Committee Report
 Annual Report January 26 2018 The Nova Scotia Minimum Wage Review Committee Report Minimum Wage Review Committee Report Page 5 of 4 Honourable Labi Kousoulis Minister of Labour and Advanced Education 1505
Financial Statement Discussion and Analysis Report
 PROVINCE OF BRITISH COLUMBIA 11 Highlights The highlights section provides a summary of the key events affecting the financial statements based on information taken from the Summary Financial Statements
Economic Spotlight June 20, 2009
 Economic Spotlight June 2, 29 Summary: Consumer Bankruptcy Deteriorating economic conditions, combined with rising unemployment and declining asset values, have caused a significant increase in consumer
Labour Market: Quebec Loses Ground, Ontario Makes Gains
 ECONOMIC NEWS Labour Market: Loses Ground, Makes Gains HIGHLIGHTS ff As in August, s labour market dipped slightly in September (-7,6). ff The unemployment rate ticked down from % to % due to the 12,4
Summary Public School Indicators for the Provinces and Territories, to
 Catalogue no. 81-9-MIE No. 44 ISSN: 1711-831X ISBN: -662-43681-4 Research Paper Culture, Tourism and the Centre for Education Statistics Summary Public School Indicators for the Provinces and Territories,
Annual Provincial Pre-Budget Submission January 10 th, 2013
 \ Annual Provincial Pre-Budget Submission 2013-2014 January 10 th, 2013 1 WE ARE A not-for-profit business organization that takes a business - like approach to its operations. Objective and non-partisan;
How Investment Income is Taxed
 When it comes to investment income, all is not equal after tax. Knowing how tax rules affect your investments is essential in order to maximize your after tax return. This publication explains the taxation
EDUCATION SPENDING in Public Schools in Canada
 EDUCATION SPENDING in Public Schools in Canada 2019 Edition Angela MacLeod and Joel Emes Contents Executive summary / iii Introduction / 1 Education spending and public student enrolment / 2 Understanding
Alberta back in the saddle: to lead all provinces in growth in 2017
 PROVINCIAL OUTLOOK September 7 Alberta back in the saddle: to lead all provinces in growth in 7 s economic momentum this year is impressive but not equally shared across provinces After two years of lackluster
Property Taxes in Saskatchewan
 Property in Saskatchewan Report # 1: - A Historical Overview, 1985-2000 - News Release Prepared by: Richard Truscott Saskatchewan Director, Canadian Taxpayers Federation November 6, 2001 TABLE OF CONTENTS:
LETTER. economic. Is Canada less dependent on the United States than it used to be? DECEMBER 2011 JANUARY bdc.ca
 economic LETTER DECEMBER JANUARY 212 Is less dependent on the United States than it used to be? weathered the last recession better than the United States. The decline in real GDP in was less pronounced
Labour Market Bulletin
 Labour Market Bulletin Newfoundland and Labrador 2016 This Labour Market Bulletin provides an analysis of Labour Force Survey results for the province of Newfoundland and Labrador, including the regions
Province of Alberta Investor Meetings Asia October Stephen J. Thompson, CFA Executive Director, Capital Markets Treasury Board and Finance
 Province of Alberta Investor Meetings Asia October 2018 Stephen J. Thompson, CFA Executive Director, Capital Markets Treasury Board and Finance Alberta, Canada Canada 10th largest economy and 9th least
STATISTICS CANADA RELEASES 2016 GDP DATA
 STATISTICS CANADA RELEASES 2016 GDP DATA On November 8, 2017 Statistics Canada released Provincial Gross Domestic Product (GDP) data for 2016 as well as revisions for 2011 to 2015. The PEI GDP at market
How Investment Income is Taxed
 B M O N E S B I T T B U R N S How Investment Income is Taxed When it comes to investment income, all is not equal after tax. Knowing how tax rules affect your investments is essential in order to maximize
Tax Alert Canada Private company tax reform: Personal tax increases on noneligible dividends scheduled for 2018 and 2019
 Issue No. 51 23 November Tax Alert Canada Private company tax reform: Personal tax increases on noneligible dividends scheduled for and EY Tax Alerts cover significant tax news, developments and changes
How Investment Income is Taxed
 BMO Financial Group How Investment Income is Taxed When it comes to investment income, all is not equal after tax. Knowing how tax rules affect your investments is essential in order to maximize your after
2016 Alberta Labour Force Profiles Women
 2016 Alberta Labour Force Profiles Alberta s Highlights Population Statistics Labour Force Statistics lowest percentage of women in the working age population 1. 51.7% NS 2. 51.5% PEI 9. 49.6% SK 10. 49.3%
Income, pensions, spending and wealth
 CHAPTER 18 Income, pensions, spending and wealth After four years of growth, the median after-tax income for Canadian families of two or more people remained virtually stable in 2008 at $63,900. The level
Individual Taxation Tax Planning Guide
 Taxable Income TABLE I1 ONTARIO (2014) TAX TABLE Tax Effective Marginal Rate Federal Ontario Total Rate Federal Ontario Total $ $ $ $ 10,000-17 17 0.2 0.0 5.0 5.0 11,000-67 67 0.6 12.9 5.1 18.0 12,000
BC CAMPAIGN FACT SHEETS
 2006 FACT SHEETS Fact Sheet #1 - What is Child Poverty? Fact Sheet #2 - BC Had the Worst Record Three Years in a Row Fact Sheet #3 - Child Poverty over the Years Fact Sheet #4 - Child Poverty by Family
This document is also available on the federal/provincial/territorial internet Web site at
 May 1999 This document is also available on the federal/provincial/territorial internet Web site at http://socialunion.gc.ca For more information or additional copies of this paper, please write to: National
2004 BCSECCOM 264. Applicable British Columbia Provisions Securities Act, R.S.B.C.1996, c. 418, ss. 34(1)(a), 48, 61, 76, , 110 and 114(2)(c)
(a), 48, 61, 76, , 110 and 114(2)(c)") Headnote Mutual Reliance Review System for Exemptive Relief Application relief granted from the registration, prospectus and take over bid requirements to permit an offer made in compliance with laws of
Headnote Mutual Reliance Review System for Exemptive Relief Application relief granted from the registration, prospectus and take over bid requirements to permit an offer made in compliance with laws of
CAPITAL MARKETS RESEARCH
 CAPITAL MARKETS RESEARCH INVESTMENT D E A L E R S ASSOCIATION OF CANADA www.ida.ca Trends in Secondary Debt Trading January - December Signs of Recovery in Latter Part of the Year July 2001 Overview The
Insolvency Statistics in Canada. April 2013
 Insolvency Statistics in Canada April 2013 List of Tables Table 1: Total Insolvencies... 1 Table 2: Insolvencies Filed by Consumers... 2 Table 3: Insolvencies Filed by Businesses... 3 Table 4: Insolvencies
Province of Alberta CIBC Government Finance Conference Vancouver June 11, 2018
 Province of Alberta CIBC Government Finance Conference Vancouver June 11, 2018 Stephen J Thompson Executive Director Capital Markets, Treasury Board and Finance and Catherine Rothrock Chief Economist &
GLOBAL ECONOMICS GLOBAL AUTO REPORT
 Luxury Sales Accelerate In China CONTACTS US drives global sales higher in March. Canadian sales remain on a stronger-than-expected trajectory. German brands are the luxury leaders in China, and will benefit
How Investment Income is Taxed
 BMO Wealth Management How Investment Income is Taxed When it comes to investment income, all is not equal after tax. Knowing how tax rules affect your investments is essential in order to maximize your