GCC Economic Insight 2012 Qatar National Bank SAQ P.O. Box 1000 Doha, Qatar Tel: (+974) Fax: (+974) qnb.com.qa
|
|
|
- Scarlett Holt
- 6 years ago
- Views:
Transcription


1 Economic Insight 2012
2
3 Contents Charts Outlook Summary 3 1. Overview and Demographics 4 2. GDP GDP by Sector External Sector Money and Prices Public Finance Banking Sector Equity Market Business Environment 46 Key Macroeconomic Indicators 47 Contents 1
4 Charts Title Page Title Page 1. Overview and Demographics Fig 1.1: s Share of Global Nominal GDP (2011) 4 Fig 4.8: Export Destinations (2010) 27 Fig 1.2: Global Nominal GDP Growth 4 Fig 4.9: Non-Physical Balances ( ) 27 Fig 1.3: World and GDP breakdown by Economic Sectors (2010) 4 Fig 4.10: Capital Account Balance ( ) 28 Fig 1.4: Oil and Gas Wealth (2011) 5 Fig 4.11: Capital-Account Balance by Country 28 Fig 1.5: GDP in the (2011) 6 Fig 4.12: Cumulative FDI flows ( ) 28 Table 1.1: Long-Term Ratings (2011) 6 Fig 4.13: International Reserves ( ) 29 Fig 1.6: Population Density (2011) 7 Fig 4.14: External Debt ( ) 29 Fig 1.7: Population ( ) 8 5. Money and Prices Fig 1.8: Population Breakdown (2011) 8 Table 5.1: Exchange Rates (2011) 31 Fig 1.9: Population by Age and Gender (2010) 9 Fig 5.1: Average Three-Month Interbank Rates* ( ) 31 Fig 1.10: Labour Force by Country ( ) 9 Table 5.2: Central Bank Policy Rates GDP Fig 5.2: Money Supply ( ) 32 Fig 2.1: Nominal GDP and Oil Prices ( ) 11 Fig 5.3: Money Supply by Country ( ) 32 Fig 2.2: Nominal GDP Forecasts ( ) 11 Fig 5.4: CPI ( ) 33 Fig 2.3: Nominal GDP by Main Economic Sectors ( ) 12 Table 5.3: CPI Weights by Sector 33 Fig 2.4: Breakdown of Nominal GDP by Country ( ) 12 Fig 5.5: Inflation by Country ( ) 33 Fig 2.5: Non-Oil GDP by Sector (2011) Public Finance Fig 2.6: World Real GDP Growth ( ) 13 Fig 6.1: Fiscal Balances ( ) 35 Fig 2.7: Real GDP Growth ( ) 13 Fig 6.2: Government Revenue ( ) 35 Fig 2.8: World Real GDP Forecasts ( ) 14 Fig 6.3: Government Expenditure ( ) 36 Fig 2.9: Real GDP Forecasts ( ) 14 Fig 6.4: Breakdown of Government Expenditure (2011) GDP by Sector Fig 6.5: Public Debt ( ) 37 Fig 3.1: GDP by Economic Sectors (2011) 15 Fig 6.6: Breakdown of Public Debt in the (2011) 37 Fig 3.2: World Proven Oil Reserves and Oil Production (2010) Banking Sector Fig 3.3: World Oil Reserves-to-Production Ratios (2010) 16 Table 7.1: Banking Risk Assessment 38 Fig 3.4: Proven Oil Reserves and Production (2011) 16 Fig 7.1: Total Banking Assets to GDP (2011) 38 Fig 3.5: Oil Reserves-to-Production Ratio (2011) 17 Fig 7.2: Loan Penetration (2011) 39 Table 3.1: World s Largest Oil Fields (2010) 17 Fig 7.3: Total Banking Sector Assets ( ) 39 Fig 3.6: World Proven Gas Reserves and Gas Production (2010) 18 Table 7.2: Top Banks by Assets (2011) 40 Fig 3.7: World Gas Reserves-to-Production Ratios (2010) 18 Table 7.3: Top Banks by Net profit (2011) 41 Fig 3.8: Gas Reserves and Production (2011) 18 Table 7.4: Top Banks by Shareholders' Equity (2011) 41 Fig 3.9: Gas Reserves-to-Production Ratio (2011) 19 Table 7.5: Ratings of Largest Banks 41 Fig 3.10: Services Sector Nominal GDP ( ) Equity Market Fig 3.11: Services Sector by Country (2011) 20 Fig 8.1: Market Capitalisation in the ( ) 43 Fig 3.12: Non-Oil Industry Nominal GDP ( ) 21 Fig 8.2: Market Capitalisation by Country (2011) 43 Fig 3.13: Non-Oil Industry by Country (2011) 22 Table 8.1: Key Financial Indicators of Equity Indices (2011) External Sector Fig 8.3: Performance of Stockmarket Indices (2011) 44 Fig 4.1: Balance of Payments ( ) 23 Table 8.2: Key Financial Indicators (2011) 45 Fig 4.2: Current Account Constituents ( ) 23 Fig 8.4: Stockmarket Performance by Sector (2011) 45 Fig 4.3: Shares of Current-Account Surplus ( ) Business Environment Fig 4.4: Current Account Surpluses by Country (2011) 24 Fig 9.1: Regional Competitiveness Scores and Ranks (2011/12) 46 Fig 4.5: Imports ( ) 25 Fig 9.2: Competitiveness Ranks ( ) 46 Fig 4.6: Import Sources (2010) 26 Fig 9.3: Regional Doing Business Ranks (2012) 46 Fig 4.7: Total Goods Exports ( ) 26 Fig 9.4: Doing Business Ranks ( ) 46 2 Charts
5 Outlook Summary The GDP of the has almost quadrupled since 2001 and is likely to reach US$1.5trn in 2013 as the hydrocarbons sector drives growth, assuming average Brent oil prices of US$108/b in Strong government spending has encouraged diversification, leading to expansion in non-oil sectors will be key to boosting real GDP growth to 4.6% in Gas production growth at 4.3% will outpace oil production growth at 0.4% due to stable global demand, OPEC caps and an investment focus on the gas sector. Non-oil industrial growth of 9.0% will be driven by manufacturing, particularly heavy investments into petrochemicals, fertilisers and metals production in Qatar and Saudi Arabia, and construction. High levels of public expenditure will drive growth of 5.6% in services in , which is largely made up of government and financial services and is expected to account for 36% of nominal GDP. Economic activity is attracting foreign workers to the region resulting in population growth that is almost triple the world rate with about 50m people expected to be living in the by Key Economic Indicators Comparison ( ) World 4.6% 3.6% 3.2% 3.8% 3.0% 3.6% 1.0% -3.7% Real GDP growth (% CAGR) Population Growth (% change) Budget Balance (% GDP) Inflation (% change) Source: IMF World Economic Outlook (WEO), QNB Group forecasts The is likely to have a larger current-account surplus than either Japan or Germany in as high oil prices boost exports. Inflation is expected to reach 3.0% in mainly due to rising rents in Saudi Arabia, without which forecasted inflation would only be 1.8%. Around 86% of the s US$1.2trn in total revenue for will come from the oil sector, supporting forecast expenditure of US$1.0trn on social investments, administration and infrastructural development projects. The banking sector is resilient, well capitalised, profitable, has a low level of non-performing loans and is favourably placed to withstand turbulence in global markets during the forecast period. The outlook for regional bourses is positive as government expenditure and solid GDP growth will support corporate profitability in The s business environment is internationally competitive, ranking above the Eurozone in the World Bank s Doing Business rankings (#30) and the WEF Competitiveness rankings (#25) in Outlook Summary 3
6 1. Overview and Demographics A. Overview The is one of the world s fastest growing regions with nominal GDP of US$1.4trn in 2011 Fig 1.2: Global Nominal GDP Growth (US$trn, % CAGR shown) 7.7% The six nations of the Gulf Cooperation Council 1 () have a combined nominal GDP of US$1.4trn (Fig 1.1), which accounts for 2.0% of global GDP. 16.3% Fig 1.1: s Share of Global Nominal GDP2 (2011) (US$trn) 18.0 EU US Developing Asia 2 Non- MENA EU Developing Asia 13.1% MENA 14.2% Source: National statistical authorities, IMF WEO database, QNB Group estimates Other World Source: IMF World Economic Outlook (WEO), QNB Group estimate The GDP of the has almost quadrupled in nominal terms since 2001, growing at a compound annual growth rate (CAGR) of 14.2% 3 (Fig 1.2). This has led to a near doubling in its percentage share of global nominal GDP from 1.1% in 2001 to 2.0% in The hydrocarbons 4 sector dominates the economy and has been the key growth driver The rise in the s weight in the global economy is a result of both high energy prices and rapid real economic growth. real GDP grew at an annual rate of 4.7% from compared with a world growth rate of 2.8%, making it one of the fastest growing regions in the world. QNB Group forecasts GDP growth in the to reach 4.6% in , outperforming global GDP growth, which the IMF expects at 3.6%. 1 The Gulf Cooperation Council () is a political and economic union between the Gulf states of Bahrain, Kuwait, Oman, Qatar, Saudi Arabia, and the United Arab Emirates. 2 Developing Asia, as defined by the IMF, consists of 27 countries. 3 This is the compound annual growth rate (CAGR), which is a geometric growth mean. In general, unless otherwise specified, all multi-year growth rates mentioned in this report will be CAGRs, rather than arithmetic growth means. 4 Refers to oil and gas in this report. The economies are dominated by the oil and gas sector (Fig 1.3). Oil and gas accounts for 5% of global GDP, but for 43% in the. Meanwhile, services account for 63% of global GDP but only for 39% of the economy. Advanced economies tend to have large services sectors, and as the develops, the contribution of the services sector to GDP should expand. Fig 1.3: World and GDP breakdown by Economic Sectors (2010) (% shares) 43% 39% 17% 2% Oil and Gas Services Non-Oil Industry Agriculture World Source: IMF, National statistical authorities, QNB Group estimates The strong performance in the oil and gas sector over the last five years has been a result of high energy prices and a sharp increase in gas production. Regional oil production grew at 1.5% in , to reach 19.4m barrels/day (b/d), while gas production surged ahead by 9.9% a year to 35bn cubic feet/day (cu ft/d). The strong increase in gas production is mainly attributable to Qatar, where production increased at a rate of 24% in to 14.4bn cu ft/d. 5% 6% 25% 63% 4 Overview and Demographics
7 The accounts for 36% of the world s proven oil reserves and 22% of gas reserves, equating to 30% of global hydrocarbons reserves, measured in barrels of oil equivalent (boe) 5. This is a significant share of global natural resource wealth, especially given the s limited share of global population (Fig 1.4). Fig 1.4: Oil and Gas Wealth (2011) Oman s eighth five-year plan runs from with planned total investment of US$78bn Bahrain s National Plan maps out land use and infrastructure development up to 2030 UAE s seven emirates each have their own development frameworks, including Plan Abu Dhabi 2030, which envisaged US$200bn of spending from Hydrocarbon revenue (US$k / national) Qatar UAE Kuwait Hydrocarbon reserves (k boe / national) Strong government spending has encouraged diversification from hydrocarbon dependence Development plans aim to diversify the economies away from dependence on hydrocarbons and to create jobs for nationals, particularly in the private sector where they are poorly represented. Source: BP, IMF, QNB Group estimates Within the, Qatar has by far the largest relative endowment of hydrocarbons wealth, in terms of both reserves and revenue. This is primarily due to its development of the North Field, the world s largest non-associated 6 natural gas field. The overall average revenue and reserves per national (US$22,000 and 32,000 boe respectively) is kept low by the large number of nationals in Saudi Arabia. Excluding Saudi Arabia, revenue and reserves per national in the would be US$53,000 and 91,000 boe. National development plans aim to expand infrastructure and further diversify economies In general, economies are at an emerging stage of development. They are currently expanding and modernising basic infrastructure and raising educational standards, which will enable them to gradually move towards a more advanced and services-oriented economic model. countries have produced long-term visions as a guide for their development, along with more detailed medium-term implementation plans: Saudi Bahrain Oman Average Saudi Arabia s ninth development plan covers the period with US$384bn of planned spending Qatar s National Development Strategy for with US$225bn of investment is based on the Qatar National Vision 2030 Kuwait has a Vision 2035 and a development plan with US$110bn investments 5 This data is based on BP s Statistical Review of World Energy Hydrocarbons refers to only oil and gas. 6 A gas field that produces solely gas, rather than gas that is extracted along with oil These development plans are largely funded through hydrocarbon revenue, although most countries have also made serious efforts to enhance their business environments to attract foreign investment and encourage the development of the domestic private sector. On average in , governments spent 33% of GDP per year through their national budgets on investment and public services. This spending was vital in stimulating a broad base of economic activity, which has fostered diversification. The main common features of the s development plans are: Developing basic infrastructure through heavy investment, including new cities, housing, schools and universities, hospitals and transport systems Leveraging hydrocarbons to move up the value chain to products such as petrochemicals, or, to power energyintensive industries, such as metals production Attracting international companies, especially in the financial sector, by offering a favourable business environment, including low taxes and establishing free zones and financial centres Building a knowledge economy through investment in education, science and research and offering benefits to high-tech international companies by supporting the development of technology parks economies have differentiating characteristics in their economic development Although states share a number of similar development features, there are also a number of distinguishing characteristics observed. Key characteristics of each state, arranged by order of the size of their economies, are highlighted below. Saudi Arabia is the largest country in the in terms of its land area, population and GDP (Fig 1.5). Saudi Arabia has the world s largest proven oil reserves, with 19.1% of total global reserves, and its economy is dominated by the oil sector, Overview and Demographics 5
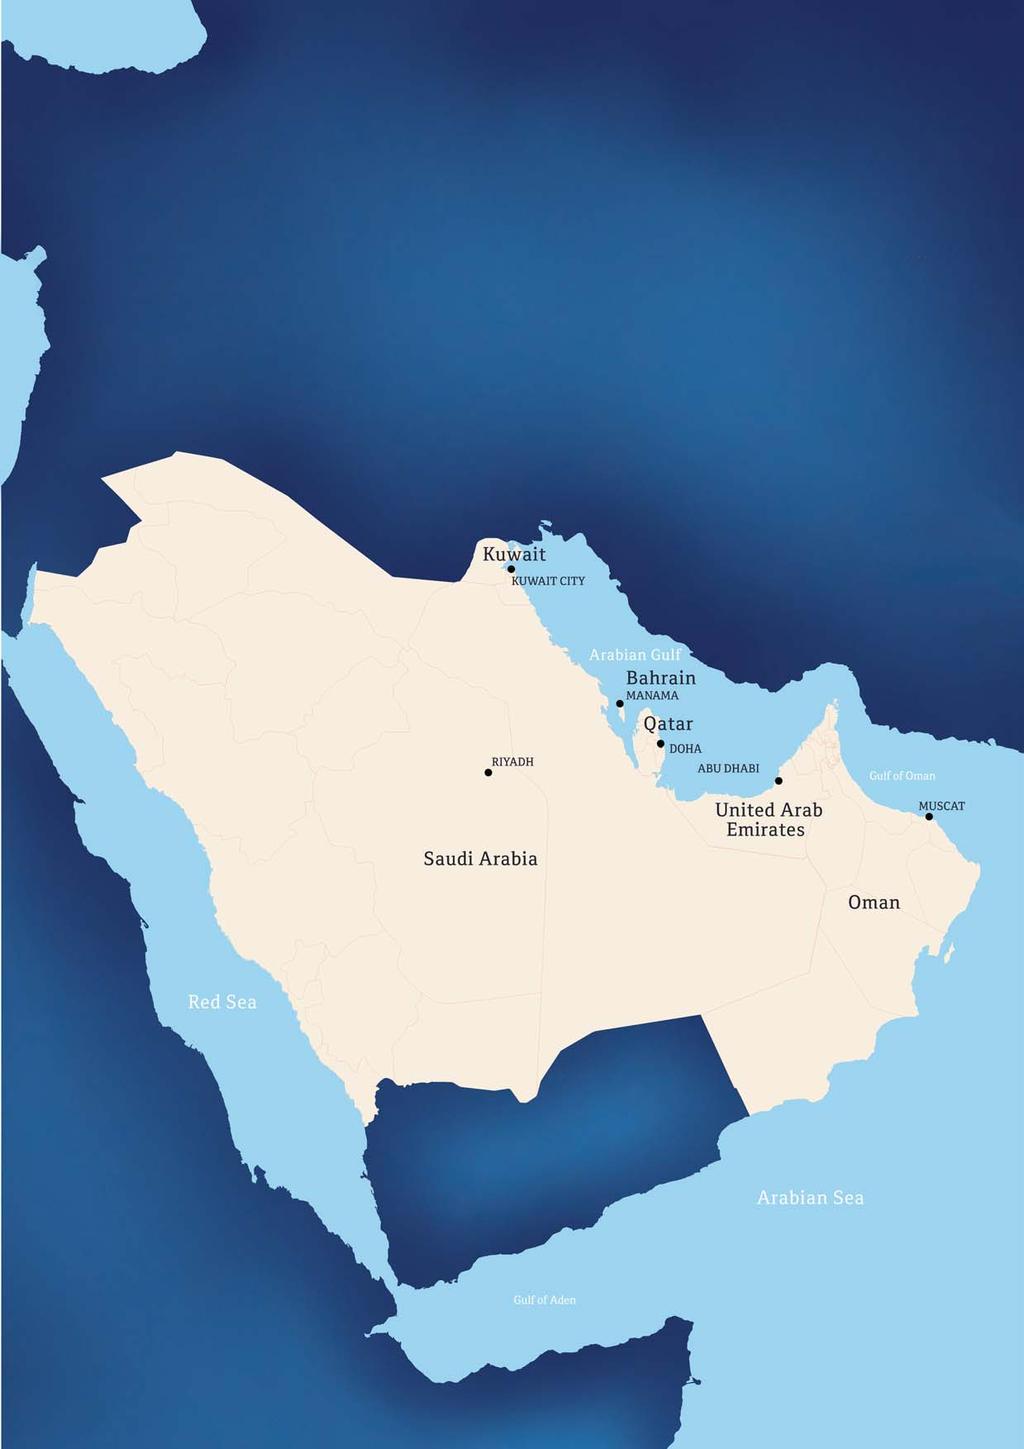
8 which accounted for an average of 50% of nominal GDP over the last five years. However, owing to the Kingdom s large population, GDP per capita is the lowest in the. The government uses revenue from oil exports to make major investments into basic and social infrastructure, education, health and heavy industry. These investments are aimed at encouraging development, distributing oil wealth and diversifying the economy away from the oil sector. 577 Fig 1.5: GDP in the (2011) (US$bn and % shares) 374 Total = US$1,383bn Burgan, the world s second largest oil field. It places a particular emphasis on moving up the oil value chain by oil refining and petrochemicals production, both domestically and through ventures abroad. It focuses on distributing fuel internationally and has a network of around 5,000 Q8 petrol stations throughout Europe. Oman s oil and gas resources are difficult to extract as they are spread widely and tend to be in difficult-to-access geological formations. Nonetheless, the share of the oil and gas sector in GDP is 52%. In recent years, Oman has been boosting its oil production through enhanced recovery techniques and utilising its gas for industrial projects and export. Oman is a major tourism destination and is also involved in the re-export trade. Nationals form about 65% of the population and have a greater role in the private sector than in most other countries. 42% Saudi 27% UAE % Qatar % Kuwait 70 5% Oman 26 Bahrain 2% Bahrain is the smallest but the most diversified economy in the with its non-oil sector, mainly services, accounting for 70% of GDP in It was one of the first countries to develop a modern economy partly because its hydrocarbons reserves are relatively limited. Bahrain s government has made a concerted effort to attract foreign businesses to the country, especially in the financial services sector, which accounted for 17.7% of GDP in 2011, the highest in the. Source: QNB Group estimates The UAE is a federation of seven emirates. Hydrocarbons wealth is concentrated within the Emirate of Abu Dhabi, which accounts for around 60% of the UAE s GDP. The nonoil sector accounted for 63% of GDP in 2011, making the UAE one of the most diversified economies. As hydrocarbons wealth is less predominant in the other Emirates, they followed development models distinct from the rest of the region. These have focused on creating attractive business environments to draw in foreign companies, particularly in the financial and services sectors, and on establishing the infrastructure and services to support large-scale trade. Consequently, the UAE, particularly Dubai which is 30% of UAE GDP, has become a major regional centre for businesses and trade. Qatar has experienced the most recent economic boom in the, as a result of the rapid development of the North Field, the world s largest non-associated gas field, over the last decade. Qatar is now the world s largest exporter of liquefied natural gas (LNG), accounting for a quarter of global exports, along with other gas, condensate and crude oil exports. The oil and gas sector dominates the economy with an estimated 56% of nominal GDP in Furthermore, the government is reinvesting hydrocarbons revenue to bolster infrastructure, heavy industry, education and scientific research. These investments are aimed at developing a sustainable economy and reducing dependence on the hydrocarbon sector. sovereign credit ratings are in line with the world s most advanced economies Table 1.1: Long-Term Ratings (2011) Sovereign S&P Moody s Fitch Qatar AA Aa2 N/R Kuwait AA Aa2 AA UAE Not Rated Aa2 Not Rated Saudi Arabia AA- Aa3 AA- Oman A A1 N/R Bahrain BBB Baa1 BBB Singapore AAA Aaa AAA Germany AAA Aaa AAA US AA+ Aaa AAA Japan AA- Aa3 AA Source: S&P, Moody s, Fitch, QNB Group analysis Kuwait is one of the most oil-dependent economies in the with oil and gas production accounting for an estimated 56% of GDP in Kuwait is the third largest oil producer in the region and has 7.3% of global reserves, much of it in 6 Overview and Demographics
9 Sovereign credit ratings 7 in the are in the upper tiers of investment grade and are on a par with most advanced economies. Qatar, Kuwait and UAE have the highest ratings (Table 1.1). The region s high credit ratings are primarily a consequence of strong macroeconomic fundamentals. Recent high oil prices have ensured that governments have had: Large fiscal surpluses, averaging 9.2% of GDP in Low levels of public debt, averaging 14.5% of GDP in With hydrocarbons reserves expected to last into the long term, these strong fundamentals are likely to persist. Additional factors supporting countries ratings include: Low external debt Large foreign exchange reserves Moderate inflation since peaking in 2008 Robust growth in non-hydrocarbon sectors US$111/b in 2011 and QNB Group is forecasting an average of US$108/b in B. Demographics Population The accounts for 0.7% of world population and 11% of MENA population The total population of the amounted to 47m at the end of This represents about 11% of Middle East and North Africa (MENA) population and 0.7% of world population. The s terrain is mainly arid, and therefore its population density is low. It is less than half the global average (Fig 1.6) and a sixth of the European Union (EU). 116 Fig 1.6: Population Density (2011) (Persons/km 2 ) Strong external positions imply limited risk of ratings downgrades economies achieve consistent surpluses in both their fiscal and current accounts. The excess hydrocarbon revenue that is not invested domestically accumulates as foreign exchange reserves or is passed on to sovereign wealth funds (SWFs). These funds aim to provide future generations with diversified sources of income and mainly invest internationally. Current high oil prices, which QNB Group expects to persist in , will lead to further expansion of the external net asset positions of governments. This will ease any concerns about external debt levels and make it likely that sovereign credit ratings will maintain their current levels in the short to medium term. However, the region remains exposed to oil and gas price fluctuations. If the oil price remains consistently below US$80 p/b, it could potentially lead to fiscal constraints in some countries, forcing them to cut back on spending or draw down from their SWFs to maintain expenditure levels in line with existing plans. The Institute of International Finance (IIF) estimates that the budget breakeven oil price in Saudi Arabia and the UAE was just over US$80/b in It is unlikely that oil prices will act as a fiscal constraint in the near future as they averaged 7 Credit ratings are assigned to countries, companies and financial instruments (referred to as issuers). It expresses an opinion about the ability and willingness of the issuer to meet their financial obligations. The ratings are usually classified into three broad categories: investment grade, speculative and default. There are a number of different rating agencies. The principal rating agencies are Standard and Poor s (S&P), Moody s and Fitch. EU 38 MENA 14.4 Source: National statistical authorities, IMF, QNB Group estimates Before the introduction of desalination technology, natural fresh water supplies put a limit on population growth. However, parts of the such as Bahrain, southwest Saudi Arabia and Oman s northern coastal strip have higher freshwater supplies, from rain or aquifers, and have supported denser populations. Today, the population density varies considerably by country. Oman has the lowest density, just ten people per km 2, and Saudi Arabia is only slightly higher because it has a similar distribution of habitable regions and cities surrounded by vast desert areas. The other countries have far higher densities because they have relatively small areas relative to their hydrocarbon resources, which fuel large-scale water desalination facilities and finance food imports needed to support dense populations. Bahrain has the highest density, with 1,678 people per km 2, because most of the island is urbanised. 34 US World 51 Overview and Demographics 7
10 The proportion of nationals in the population has fallen to 52% The discovery of massive hydrocarbon resources in the first half of the 20 th century led to the rapid development of the region, and hence population growth. Hydrocarbon revenue has been heavily invested in infrastructure, driving construction and real estate booms, and supporting the broader development of the services and manufacturing sectors. This has led to opportunities that have attracted a large inflow of expatriates to the region. In the last decade, the s expatriate population has grown at 7.4%. This has driven the overall growth rate for the same period to 4.5%, taking the population from 30m in 2001 to an estimated 47m in Population growth within the national population has also been high at 2.4%, which is double the global average. This can be attributed to high fertility rates in the region, a youthful population and a lengthening of life-spans supported by investments in healthcare. The rapid growth of the expatriate population has reduced the proportion of nationals (Fig 1.7) in the overall population. citizens, is the reason why the overall population is still predominantly national, albeit by a small margin. The different proportional sizes of the expatriate populations across the are explained by several factors, including: The relative size of each country s hydrocarbons reserves The current stage of country development The nature of its non-hydrocarbon economy The impact of particular policies Fig 1.8: Population Breakdown (2011) (m) Fig 1.7: Population ( ) (m, with % share and CAGR show) Expatriates Saudi UAE Kuwait Oman Qatar Bahrain Nationals % 47 48% Source: National statistical authorities, IMF, QNB Group estimates For example, in the UAE and Qatar, hydrocarbons endowments are high compared with the size of the populations. This has led to proportionally larger expatriate populations in the UAE and in Qatar. 36% 64% % 2011* Source: National statistical authorities, *QNB Group estimates In 2011, 52% of the population were nationals, down from 64% in There are significant differences between countries in the proportion of expatriates. The expatriate population has been further boosted by the federal structure of the UAE. This has encouraged the development of the non-oil economy in emirates with limited hydrocarbon reserves, particularly in Dubai, creating further opportunities for expatriate employment. Economic development in Kuwait and Bahrain began earlier than in the rest of the region. This has led to weaker demand today for expatriate labour to help build basic infrastructure. In Oman expatriates only account for 35% of the population. This is mainly due to its hydrocarbons endowment being low in relation to its local population, leading to fewer opportunities for expatriate employment. Saudi Arabians account for 80% of nationals Saudi Arabia has the largest population in the region (Fig 1.8), and its large population of nationals, who represent 80% of all 8 Overview and Demographics
11 The demographics are skewed by the high share of male expatriate population The majority of expatriates in the are male as regional labour policies generally favour male employment and as many of the opportunities are in male-dominated sectors, such as construction. Furthermore, the majority of expatriate workers are not accompanied by any family. This is skewing the regional population distribution, producing a sizable bulge in the demographic bands relating to young working males (Fig 1.9). Overall, males aged made up an estimated 31% of the population in However, in countries with large expatriate workforces compared with their national populations, the proportion of men in the age bracket is considerably higher. For example, in Qatar it is 52% and in the UAE it is 43%. The overall figure is kept lower by the large local population in Saudi Arabia where men aged account for 26% of the population. The demographic structure is also relatively young with 44% of the population under 25 years old as a consequence of high fertility rates within the national populations. This will support an accelerating rate of growth in the size of the local workforce. Fig 1.9: Population by Age and Gender (2010) (% of total population) % Males = 61% Females = 39% Source: National statistical authorities and QNB Group estimates Labour force 45% of the labour force is in Saudi Arabia and the private sector is the main driver of job growth QNB Group estimates that the total labour force in the was 18.8m in 2011 (Fig 1.10), or 40% of the total population. The largest share of the labour force is located in Saudi Arabia, with 8.4m workers, or 45% of the total. Fig 1.10: Labour Force by Country ( ) (m with CAGRs shown) Source: National statistical authorities and QNB Group estimates The labour force grew at an estimated rate of 7.9% from , compared with growth of 4.3% for the total population. This faster rate is mainly a consequence of the strong inflows of expatriate workers who now constitute a larger share of the workforce than nationals. The IMF expects the to add 6m new jobs in , which would equate to an annual growth in the labour force of about 6.1%. Unemployment Unemployment among nationals is low versus prevailing global levels Official estimates put unemployment amongst nationals in 2010 at: 6.1% Saudi 11.6% UAE % in Saudi Arabia 6.3% in UAE 4.1% in Qatar less than 4% in Bahrain 3% in Kuwait Labour Force (2011) = 18.8m 7.0% Kuwait 11.2% Qatar % 6.9% Oman 2011 Bahrain Overview and Demographics 9
12 There is little data on unemployment amongst expatriates as, unless they are under the sponsorship of a working relative, most will depart the region if they do not have a job. Unemployment amongst nationals is most likely caused by a combination of factors, including: Lack of suitable skills for the labour market, although the level of skills and knowledge should continue to improve given the current emphasis on education Preference for public sector employment where there is a shortage of available jobs while the private sector fails to meet their expectations for roles and remuneration For many years, most countries have had programmes in place aimed at increasing employment of nationals in the private sector, including quotas, training, placement services, subsidies, and other incentives. To increase private sector employment opportunities for nationals, governments need to enhance higher education to better meet private sector needs. The terms of employment, such as pay and benefits, in the private sector will also need to be improved relative to the public sector. It will be a challenge to promote employment of nationals without imposing undue costs on doing business in the private sector that would erode competitiveness and potentially reduce growth. 10 Overview and Demographics
13 2. GDP A. Nominal GDP Rising oil prices have been a major driver for nominal GDP growth over the last decade The has been undergoing a period of rapid economic growth, resulting in a near quadrupling of its nominal GDP over the last decade at a rate of 14.2% from The key contributor to this growth has been rising oil prices 8 (Fig 2.1), which, barring a contraction in 2009, have increased in every year from 2001 to 2011, growing at a rate of 16.3% a year. The resulting boom in government oil revenue has driven expansion across the whole economy, further boosting nominal GDP. Fig 2.1: Nominal GDP and Oil Prices ( ) The global downturn had various impacts across the : The most oil-dependant economies Kuwait, Oman and Saudi Arabia were the worst affected, with their nominal GDP contracting by 28%, 23% and 21% respectively in 2009 The increase in gas production in Qatar offset some of the impact due to the reduction in oil prices, and GDP only declined by 15% In Bahrain and the UAE, the contractions were smaller at 11.4% and 14.1% respectively in 2009, as their hydrocarbons only comprise a third of GDP, or less The global economy began to recover in 2010, leading to an increase in energy demand and a rebound in oil prices and the economy. Nominal GDP in the grew by 17.7% in 2010 and an estimated 28% in 2011 to reach a new record of US$1.4trn Nominal GDP (US$trn, left axis) Oil price (US$ /barrel, right axis) The global recovery faltered slightly in the last quarter of 2011, mainly due to the Eurozone crisis. However, geopolitical risks and reductions in oil production in Libya kept oil prices high. The average price in 2011 (US$109/b) was above the previous high set in 2008 (US$95/b) * * Assuming average oil prices of US$106/b in we forecast nominal GDP growth of 4% QNB Group forecasts that nominal GDP will increase by 1.1% in 2012 and by 7.4% in 2013, equating to 4.0% in Relatively flat average oil prices in will lead to overall hydrocarbons sector growth of 1.0%. We assume that oil prices will be slightly lower in 2012 than they were in 2011, averaging US$103/b. Consequently, nominal GDP growth will be moderate with only Qatar and Oman seeing growth in hydrocarbons GDP as a result of increased production. Source: National statistical authorities, *QNB Group estimates and forecasts The economy has recovered rapidly from the 2009 global downturn The economy experienced a golden period during , when GDP expanded at 19.9%. This was a result of rising demand for energy sources as a consequence of robust global expansion, particularly in Developing Asia. The global financial crisis and economic slowdown which started towards the end of 2008 temporarily drove down energy demand and prices. Average oil prices fell by 33% in 2009, which contributed to the 19.3% decline in the s nominal GDP. Fig 2.2: Nominal GDP Forecasts ( ) (US$bn and two-year CAGRs shown) 3.6% % % GDP CAGR = 4.0% % % 3.6% Saudi UAE Qatar Kuwait Oman Bahrain 8 average oil export price. Source: QNB Group estimates and forecasts GDP 11
14 For 2013, QNB Group assumes that oil prices will pick up slightly to an average of US$109/b leading to strong GDP growth in Saudi Arabia and Qatar. We expect Qatar to be the fastest growing economy at 5.6% in (Fig 2.2) as it experiences its first full year at its new capacity production for LNG and gas-to-liquids (GTLs). Growth of 6.8% in the non-oil sector will support an overall increase in nominal GDP in Contributing to this growth is the UAE which has a large non-oil sector that is growing relatively fast. Growth in Kuwait will be slower, as it is relatively oil dependent. Despite its declining share, the nominal growth in the non-oil 9 sector over the last decade has been an impressive 11.3%. This shows that much of the surplus revenue from the oil boom has been re-invested in the non-hydrocarbon economy, something that did not happen to the same extent during the oil booms of the 1970s. Fig 2.4: Breakdown of Nominal GDP by Country ( ) (average % shares of GDP) Oil and gas Non-oil B. Economic Structure The prominence of the oil and gas sector is increasing The share of the oil and gas sector in nominal GDP has increased in recent years, mainly due to higher energy prices. It averaged 45% of GDP in (Fig 2.3), up from 40% in Kuwait 54% Qatar 52% Saudi 50% Oman 47% 46% 48% 50% 53% Fig 2.3: Nominal GDP by Main Economic Sectors ( ) (Totals in US$trn, CAGR shown) UAE 34% 66% Non-oil and gas Oil and gas 8.9% Bahrain 26% 45% 74% % 45% % 49% % 39% % 43% * 2012* Source: National statistical authorities, *QNB Group estimates and forecasts Kuwait, Qatar and Saudi Arabia all have hydrocarbons sectors accounting for half of the economy or more (Fig 2.4). In the UAE, the share of hydrocarbons is lower at an average of 34% in as a result of the rapid development of non-oil sectors, particularly in Dubai. Similarly, Bahrain has a relatively small hydrocarbons sector, which only accounts for 26% of its overall GDP, mainly owing to its large services sector. 51% 49% 46% 54% 46% 54% 2013* Source: National statistical authorities After hydrocarbons, the services sector 10 is the next largest component of regional GDP, comprising 34% in Non-oil Industry 11 has a 16% share and agriculture comprises just 1.2%, less than half its share a decade ago. These shares have fallen from 2010 as oil prices increased sharply in The services sector accounts for 67% of non-oil GDP The services sector dominates non-oil GDP, accounting for 67% in It is further split down into four main sub sectors, among which, government services forms the largest component, accounting for 23% of non-oil GDP in 2011 (Fig 2.5), and grew at a rapid rate of 11.6% in This has been primarily driven by increased government spending. Financial services, including real estate, was the largest subsector until 2009, but fell to a 19.8% share of non-oil GDP in 9 Non-oil is commonly used in the region, and hereafter, as a shorthand for nonoil and gas. 10 The services sector consists of government and social services, financial services, trade and hospitality, transport and communications, and agriculture. 11 The industry sector (non-oil and gas) consists of manufacturing, construction, and utilities. 12 GDP
15 2011, due to the impact of the global financial crisis and weakness in the real estate sector in some countries. The manufacturing sub-sector is the next largest component of non-oil GDP, accounting for 17.8%. It grew rapidly from at a rate of 12.0% as a result of the expansion in projects in the region related to oil refining, gas to liquids (GTL), petrochemicals, fertilisers and metals. Government Services Fig 2.5: Non-Oil GDP by Sector (2011) (% share) Financial Services Trade & Hospitality Logistics Services 23% 20% 67% 14% 10% Fig 2.6: World Real GDP Growth ( ) (% CAGR) 8.8 Developing Asia MENA 0.7 Advanced Economies Source: Statistical Authorities, IMF, QNB Group estimates 0.6 EU World 3.3 Manufacturing Construction Utilities Non-Oil Industry Agriculture Total Non-Oil 100% 18% Source: National statistical authorities, QNB Group estimates 31% 11% 2% 2% OPEC production targets have restrained oil production growth but gas production has risen The real growth in the oil and gas sector has remained subdued, growing by only 2.7% from , owing to a cut in oil production targets put in place by OPEC 12 in the last quarter of The reason for OPEC s action was weaker global demand for oil in the aftermath of the 2008 financial crisis, which pushed oil prices down to an average of US$40/b in December Fig 2.7: Real GDP Growth ( ) (% CAGR) C. Real GDP The is among the fastest growing regions in the world The is one of the fastest growing regions in the world with a real GDP growth rate of 4.6% during (Fig 2.6) The strong performance of the oil and gas sector has had a positive impact on the non-oil sector. The revenue from oil and gas and their by-products are being dispersed throughout the economy via governments, financial systems and hydrocarbonlinked elements of the private sectors, providing an enormous boost to the rest of the economy. The government has a particularly strong role in this process. Government revenue, derived largely from oil and gas exports, has been disbursed across the economy, with government spending in the averaging 33% of GDP in This has triggered increased activity in the non-oil sector, which grew at a rate of 6.0% during this period in real terms. Qatar Oman Saudi Bahrain UAE Source: National sources, QNB Group estimates Kuwait The exception to the subdued growth in the oil and gas sector has been Qatar s 15.2% growth rate in this sector from The significant increase has come primarily from natural gas production in Qatar, which has more than doubled. Qatar s 12 The Organisation of the Petroleum Exporting Countries (OPEC) is a grouping of 12 oil-exporting countries, which aims to coordinate policies between its member states in order to stabilise oil markets and ensure: a steady income for oilproducing nations; secure supply to oil-consuming countries; and a fair return for investors in the oil sector. OPEC accounts for over 40% of world oil production and is therefore able to influence global oil markets by coordinating production adjustments and setting production targets for its members. GDP 13
16 non-oil and gas sector grew at 16.1% in , more than twice the rate of the next fastest growing country. Overall, this has made Qatar the fastest growing economy in the in (Fig 2.7) and in the world. Real growth in the in is forecast to be high compared to most other regions Looking forward, QNB Group expects the to continue its strong growth trajectory in (Fig 2.8). Fig 2.8: World Real GDP Forecasts ( ) (% change) Government investment in development projects will provide a boost to the construction sector. The manufacturing sector (including sub-sectors such as, fertilisers and metals production) will be a key beneficiary of initiatives to diversify economies away from oil and gas dependence. These sectors are expected to drive real GDP growth in the non-oil sector at a forecast rate of 7.3% during and this will lead to overall real growth for the of 4.6% during the same period. Activity in oil and gas sectors will continue to underpin growth in the broader economy Our forecasts for real GDP growth (Fig 2.9) are predominantly driven by the expected impact of oil prices on production and inflows of revenue into the broader non-oil economy. Fig 2.9: Real GDP Forecasts ( ) (% change) CAGR Developing Asia World MENA Advanced Economies -0.1 EU Source: IMF WEO January 2012, QNB Group forecasts for the QNB Group expects oil and gas production to stabilise. Oil production should continue to be constrained by OPEC production targets, which have been close to current production levels since December Additional increases in production targets are unlikely unless there is a major oil price spike. Overall, oil production is expected to grow at 0.5% during Gas production is predicted to increase more rapidly, at a rate of 4.9% a year in , mainly owing to gas-related projects reaching full capacity in Qatar and to production increases in Saudi Arabia. Overall, oil and gas real GDP is expected to expand at a CAGR of 0.8% in QNB Group forecasts that growth in the non-oil sector will be stronger than in the oil sector We expect growth in the non-hydrocarbons sector will drive the economy in the next two years. This will be led by the services sector, particularly public services, as government expenditure is supported by strong hydrocarbons revenue, based on an average oil price forecast of US$106/barrel in Financial services will also be a key growth sector as it benefits from strong economic activity and investment throughout the economy. Qatar Saudi Kuwait Source: QNB Group forecasts UAE Bahrain Oman We assume a slight drop in oil prices in 2012 versus 2011, which will lead to a small slowdown in real GDP growth, particularly in the more oil-driven economies, such as Saudi Arabia, Kuwait and the UAE. Qatar will be spared the slowdown in 2012 as it benefits from its first full year at new capacity production in the gas sector. Oil production in Oman has been rising due to its efforts to develop its oil fields and there are targets for further production increases in 2012, which will support growth. Growth in Bahrain will be steadier, as it is more reliant on less volatile non-oil sectors, particularly services. In Bahrain, we are expecting a bounce back from a low growth of 1.2% in 2011, which was the result of political unrest. In 2013, we are assuming a small increase in oil prices. This will reverse the 2012 trend, boosting growth, particularly in the heavily oil-driven economies. Qatar will begin to face capacity constraints and growth should stabilise. Oman s oil field development plans will lead to similar growth as in Growth in Bahrain is expected to pick up further, as the services sector gains momentum. 14 GDP
17 3. GDP by Sector Oil and gas (Section A) was the largest sector in the in 2011, accounting for 49% of total GDP (Fig 3.1). This was slightly higher than its average share of 45% in Services (Section B) accounted for 34% of GDP in Government services (public administration, defence, health, education, welfare etc.) and financial services form around 65% among the sub-sectors, followed by trade and hospitality and transport and communications. This sector is a key focus of government spending and policy, which has also benefited the growth in the financial services. Non-oil Industry (Section C) formed 16% of GDP in It consists of manufacturing, construction and utilities, in order of their size. The manufacturing sector leverages the region s hydrocarbon reserves through oil refining, GTLs, petrochemicals and metals production. The construction sector has been strong given on-going projects in countries to further develop their infrastructure. Utilities have been expanding in response to a rapidly growing population. Agriculture is a small sector of the economy given the limited availability of arable land. It accounted for only 1.2% of GDP in Fig 3.1: GDP by Economic Sectors (2011) (US$bn and % share shown) Oil & Gas Government Services Financial Services Trade & Hospitality 49% 12% 10% Manufacturing 9% Construction 5% Logistics 5% Agriculture Services (34%) 1% Non-oil Utilities industry (16%) 1% TotalGDP US$1,383bn (100%) 7% A. Oil and Gas Oil The holds 36% of global oil reserves but accounts for only 22% of production The holds 36% of the world s proven oil reserves but only has a 22% share of global production (Fig 3.2). Fig 3.2: World Proven Oil Reserves and Oil Production (2010) (reserves in bn barrels and production in m b/d) Others North America Europe & Eurasia South & Central America Non- MENA 1, Reserves Source: BP Statistical Review of World Energy and QNB Group analysis It has a larger share of global oil exports, because domestic consumption is lower than in many other oil producing states. oil production is constrained by OPEC production targets, which are aimed at stabilising global oil markets. The development of the oil reserves is also at a relatively early stage compared with other regions. Therefore, enhanced recovery techniques have been more widely employed in regions outside the to maximise production from older fields. Higher energy consumption in other regions has also provided an incentive to maximise production Production Source: National statistical authorities, QNB Group estimates Long lifespans of oil fields are expected given low production and high reserves The positive outcome of low production and high reserves in the is longer oil field lifespans than in many other regions of the world. Reserves-to-production (R/P) ratios for the indicate that, at 2010 production levels, reserves are expected to last for another 76 years (Fig 3.3). GDP by Sector 15
18 Fig 3.3: World Oil Reserves-to-Production Ratios (2010) (years of production at prevailing levels) Saudi Arabia expanded production in 2011 as it led OPEC in boosting output to combat high oil prices during the first half of the year. This increased the overall oil output by 7.7% in 2011 compared with production growth of 1.4% during There were also sharp increases in production in the UAE (7.0%) and in Kuwait (4.7%) in 2011, to maintain price stability in oil markets Qatar s oil production increased by 13.2% in 2011, mainly due to condensates, a high-quality liquid by-product of gas production that now accounts for over half of Qatar s oil production. The increase in condensates extracted was proportional to the increase in gas production. Condensates are not included in the production quotas of OPEC members. South & Central America Non- MENA Source: BP Statistical Review of World Energy and QNB Group analysis The only region with a higher R/P ratio is South and Central America where production is yet to commence from new Venezuelan discoveries. When production does begin, probably in 2013, the R/P ratio will begin to drop. Saudi Arabia accounts for over half of the reserves and production in the Over half of oil production is in Saudi Arabia (Fig 3.4). Fig 3.4: Proven Oil Reserves and Production 13 (2011) (reserves in bn barrels and production in m b/d, % share shown for top 3) Oil Reserves Total = 495bn barrels 0.0% 1.1% 5.2% Sub-Saharan Africa Bahrain Oman Qatar Europe & Eurasia Asia Pacific North America Oil Production Total = 19.4m b/d 1.0% 4.6% 9.3% Sustained global demand for oil is expected to keep production at current levels OPEC crude oil production was 30m b/d in 2011, according to the International Energy Agency (IEA). This is in line with OPEC s production target, announced in December The IEA does not expect any increase in demand for OPEC oil in 2012, as per its February 2012 oil market report. This suggests that oil production in OPEC will remain flat. Four of the six countries (excluding Bahrain and Oman) are OPEC members, implying that oil production in the is also likely to remain flat. Additionally, we are forecasting that oil prices will fall slightly in 2012 and then rise marginally in Oil production in the has a high correlation with prices as production cuts are intended to support falling prices and, conversely, there is an incentive to increase the volume produced when prices are higher. Leading producer, Saudi Arabia, cut production by 8.8% in 2009 when average oil prices fell sharply and then increased production in 2010 and 2011 by 1.2% and 8.4% respectively, as prices rose. We therefore expect its production to rise and fall in line with our price forecasts in The IEA currently puts Saudi Arabia s spare production capacity at 2m b/d, leaving room for significant production increases. We are expecting oil production to be flat in 2012 as falling production in Saudi Arabia and the UAE is compensated for by programmes to increase output in Kuwait and Oman. Rising production across all countries in 2013 is expected to lead to an overall output increase of 1.4%. 19.7% 20.5% UAE Kuwait 15.5% 13.4% The should be able to further extend its current implied oil field lifespan 53.4% Saudi 55.7% Source: BP Statistical Review of World Energy, QNB Group estimates and analysis 13 Bahrain s small official reserves do not include its share with Saudi Arabia in the offshore Abu Safah which has around 5bn barrels of oil, although most of its production comes from this field. With this included, Bahrain s share or regional reserves increase to about 0.5% The s characteristic of large reserves and comparatively low production is particularly evident in Kuwait, which could produce at current rates for 106 years, based on proven reserves (Fig 3.5). proven oil reserves have been broadly stable for the last decade, despite rising production. New oil discoveries, enhanced oil recovery (EOR) techniques, and growing condensates production suggest that states will be able to 16 GDP by Sector
Saudi Arabia - Economic Insight. June 2011
 Saudi Arabia - Economic Insight June 211 Outlook summary for 211 and 212 The Kingdom of Saudi Arabia has a population of 27.1m, of whom 31% are expatriates. The national population has a relatively high
OIL-EXPORTING COUNTRIES: KEY STRUCTURAL FEATURES, ECONOMIC DEVELOPMENTS AND OIL REVENUE RECYCLING
 OIL-EXPORTING COUNTRIES: KEY STRUCTURAL FEATURES, ECONOMIC DEVELOPMENTS AND OIL REVENUE RECYCLING This article reviews key structural features and recent economic developments in ten major oilexporting
Investor Relations Presentation December 2012
 Investor Relations Presentation December 2012 Contents 1. QNB at a Glance 2. QNB Comparative Positioning Qatar and MENA 3. Financial Highlights December 2012 4. Economic Overview 2 QNB at a Glance QNB
Nigeria Economic Update QNB Group. September 2014
 Nigeria Economic Update QNB Group September 21 Nigeria Overview A rebasing of GDP in 213 has made Nigeria the biggest economy in Africa with the largest population; the economy is growing rapidly but remains
Investor Relations Presentation April 2012
 Investor Relations Presentation April 2012 Contents 1. QNB at a Glance 2. Qatar Banking Sector 3. Financial Highlights March 2012 4. Economic Overview 2 QNB at a Glance QNB at a Glance: Overview Overview
Economic ProjEctions for
 Economic Projections for 2016-2018 ECONOMIC PROJECTIONS FOR 2016-2018 Outlook for the Maltese economy 1 Economic growth is expected to ease Following three years of strong expansion, the Bank s latest
Oil price volatility: Focus on the fundamentals to navigate your way to long-term rewards
 Oil price volatility: Focus on the fundamentals to navigate your way to long-term rewards December 2014 Oliver Bell, Portfolio Manager, Middle East & Africa; Global Frontier Markets Equities Strategy EXECUTIVE
Indonesia Economic Update QNB Group. October 2014
 Indonesia Economic Update QNB Group October 214 Indonesia Overview The economy has enormous long-term potential based on a rich endowment of natural resources and a large population; the new Jokowi administration
Investor Relations Presentation December 2013
 Investor Relations Presentation December 2013 Contents 1. QNB at a Glance 2. QNB Comparative Positioning Qatar and MENA 3. Financial Highlights as at 31 December 2013 4. Economic Overview Notes: These
Switzerland Economic Update QNB Group. September 2014
 Switzerland Economic Update QNB Group September 14 Switzerland Overview Switzerland s efficient capital markets, highly skilled human capital and low corporate tax rates make it the world's most competitive
Lazard Insights. MENA Equities: An Overlooked Dimension within Emerging Markets. Summary. Structural Advantages
 Lazard Insights MENA Equities: An Overlooked Dimension within Emerging Markets Walid Mourad, Portfolio Manager/Analyst, Middle East North African Equity team Summary MENA governments are committing a large
Saudi Arabia s 2011 budget
 (SR billion) 23 2 December 28 21 Saudi Arabia s 211 budget The government s budget for the 211 fiscal year (31 December 21 to 3 December 211) was endorsed by the Council of Ministers on December 2. It
Svein Gjedrem: The outlook for the Norwegian economy
 Svein Gjedrem: The outlook for the Norwegian economy Address by Mr Svein Gjedrem, Governor of Norges Bank (Central Bank of Norway), at the Bergen Chamber of Commerce and Industry, Bergen, 11 April 2007.
Jan F Qvigstad: Outlook for the Norwegian economy
 Jan F Qvigstad: Outlook for the Norwegian economy Address by Mr Jan F Qvigstad, Deputy Governor of Norges Bank (Central Bank of Norway), at Sparebank 1 Fredrikstad, 4 November 2009. The text below may
Saudi Arabia s 2014 budget
 23 December 213 Saudi Arabia s 214 budget The government s budget for the 214 fiscal year (31 December 213 to 3 December 214) was endorsed by the Council of Ministers on December 23. It was another expansionary
Structural Changes in the Maltese Economy
 Structural Changes in the Maltese Economy Dr. Aaron George Grech Modelling and Research Department, Central Bank of Malta, Castille Place, Valletta, Malta Email: grechga@centralbankmalta.org Doi:10.5901/mjss.2015.v6n5p423
UAE: Update November 2015
 Report Series UAE: Update Executive Summary Economics Department Samba Financial Group P.O. Box 833, Riyadh 11241 Saudi Arabia ChiefEconomist@samba.com +44 207659-8200 (London) This and other publications
Svein Gjedrem: Interest rates, the exchange rate and the outlook for the Norwegian economy
 Svein Gjedrem: Interest rates, the exchange rate and the outlook for the Norwegian economy Speech by Mr Svein Gjedrem, Governor of Norges Bank (Central Bank of Norway), to the Mid-Norway Chamber of Commerce
Øystein Olsen: The economic outlook
 Øystein Olsen: The economic outlook Address by Mr Øystein Olsen, Governor of Norges Bank (Central Bank of Norway), to invited foreign embassy representatives, Oslo, 29 March 2011. The address is based
Global analysis of health insurance in The Gulf Region
 Global analysis of health insurance in The Gulf Region The prospects for health care insurance in the GCC states The sharp sell-off in global oil prices that began in mid-214 triggered an economic slowdown
In this report we discuss three important areas of the economy that have received a great deal of attention recently, namely:
 March 26, 218 Executive Summary George Mokrzan, PH.D., Director of Economics In this report we discuss three important areas of the economy that have received a great deal of attention recently, namely:
Evolution of the Middle East Trading Ecosystem. May 2013
 Evolution of the Middle East Trading Ecosystem May 2013 Contents Changing Supply/Demand Dynamics Changes Drive Trading Ecosystem Oman: Key to Crude Oil Markets Conclusion Dubai Mercantile Exchange 2 DME
I. ECONOMIC ENVIRONMENT (1) MAJOR FEATURES OF THE ECONOMY
 MAJOR FEATURES OF THE ECONOMY") Oman WT/TPR/S/201 Page 1 I. ECONOMIC ENVIRONMENT (1) MAJOR FEATURES OF THE ECONOMY 1. The Sultanate of Oman borders Saudi Arabia to the west, the United Arab Emirates (UAE) to the north west, and Yemen
Oman WT/TPR/S/201 Page 1 I. ECONOMIC ENVIRONMENT (1) MAJOR FEATURES OF THE ECONOMY 1. The Sultanate of Oman borders Saudi Arabia to the west, the United Arab Emirates (UAE) to the north west, and Yemen
Economic Projections :1
 Economic Projections 2017-2020 2018:1 Outlook for the Maltese economy Economic projections 2017-2020 The Central Bank s latest economic projections foresee economic growth over the coming three years to
Slovenia. Eurozone rebalancing. EY Eurozone Forecast June Portugal Slovakia Slovenia Spain. Latvia Lithuania Luxembourg Malta Netherlands
 EY Forecast June 215 rebalancing recovery Outlook for Activity to remain solid this year, after growing 2.4% in 214 Published in collaboration with Highlights n GDP grew by 2.4% in 214 and 3% in Q1 215,
Market Update. 14 May 2015 BANK MUSCAT ASSET MANAGEMENT
 Market Update 14 May 2015 BANK MUSCAT ASSET MANAGEMENT GCC Equity Markets Most of the regional markets have witnessed negative performance so far this month, except Qatar, Oman, and Bahrain up 2.9%, 0.6%,
Economic Projections :2
 Economic Projections 2018-2020 2018:2 Outlook for the Maltese economy Economic projections 2018-2020 The Central Bank s latest economic projections foresee economic growth over the coming three years to
France Economic Update QNB Group. September 2014
 France Economic Update QNB Group September 2014 France Overview France is the ninth largest economy in the world on a purchasing power parity basis and service-oriented; high indebtedness and lack of reforms
Regulatory Announcement RNS Number: RNS to insert number here Québec 27 November, 2017
 ISSN 1718-836 Regulatory Announcement RNS Number: RNS to insert number here Québec 27 November, 2017 Re: Québec Excerpts from The Quebec Economic Plan November 2017 Update, Québec Public Accounts 2016-2017
Jarle Bergo: Monetary policy and the cyclical situation
 Jarle Bergo: Monetary policy and the cyclical situation Speech by Mr Jarle Bergo, Deputy Governor of Norges Bank (Central Bank of Norway), at a meeting with local authorities and the business community,
SME Monitor Q aldermore.co.uk
 SME Monitor Q1 2014 aldermore.co.uk aldermore.co.uk Contents Executive summary UK economic overview SME inflation index one year review SME cost inflation trends SME business confidence SME credit conditions
Emirates NBD Research UAE Sector Chart Pack
 Emirates NBD Research UAE Sector Chart Pack Thanos Tsetsonis athanasiost@emiratesnbd.com May 218 1 mn b/d USD / b UAE: Downside risks to 218 growth forecast due to lower oil production estimates Highlights
World Economic outlook
 Frontier s Strategy Note: 01/23/2014 World Economic outlook IMF has just released the World Economic Update on the 21st January 2015 and we are displaying the main points here. Even with the sharp oil
Economic projections
 Economic projections 2017-2020 December 2017 Outlook for the Maltese economy Economic projections 2017-2020 The pace of economic activity in Malta has picked up in 2017. The Central Bank s latest economic
BBB3633 Malaysian Economics
 BBB3633 Malaysian Economics Prepared by Dr Khairul Anuar L1: Economic Growth and Economic Policies www.lecturenotes638.wordpress.com Content 1. Introduction 2. Malaysian Business Cycles: 1972-2012 3. Structural
Minutes of the Monetary Policy Committee meeting November 2010
 The Monetary Policy Committee of the Central Bank of Iceland Minutes of the Monetary Policy Committee meeting November 2010 Published: 17 November 2010 The Act on the Central Bank of Iceland stipulates
Algeria's GDP growth is expected to stand at 3.5%, inflation at 7.5% for 2018.
 Public Disclosure Authorized Public Disclosure Authorized Public Disclosure Authorized Public Disclosure Authorized Key Messages: MENA Economic Monitor- April 2018 Economic growth in MENA is projected
The Economic Outlook of Taiwan
 The Economic Outlook of Taiwan by Ray Yeutien Chou and An-Chi Wu The Institute of Economics, Academia Sinica, Taipei October 2017 1 Prepared for Project LINK 2017 Fall Meeting, Geneva, Oct. 3-5, 2017 2
BBB3633 Malaysian Economics
 BBB3633 Malaysian Economics Prepared by Dr Khairul Anuar L1: Economic Growth and Economic Policies www.notes638.wordpress.com Assessment Two assignments Assignment 1 -individual 30% Assignment 2 group
Economic Projections :3
 Economic Projections 2018-2020 2018:3 Outlook for the Maltese economy Economic projections 2018-2020 The Central Bank s latest projections foresee economic growth over the coming three years to remain
Iran the rocky road to sweeping economic renewal
 Iran the rocky road to sweeping economic renewal No., March Author: Dr Martin Raschen, phone +9 9 7-, research@kfw.de Economic situation Real growth Private consumption (y-o-y) Inflation rate Growth financing
Structural changes in the Maltese economy
 Structural changes in the Maltese economy Article published in the Annual Report 2014, pp. 72-76 BOX 4: STRUCTURAL CHANGES IN THE MALTESE ECONOMY 1 Since the global recession that took hold around the
Market volatility to continue
 How much more? Renewed speculation that financial institutions may report increased US subprime-related losses has sent equity markets tumbling. How much more bad news can investors expect going forward?
SAUDI ARABIA'S ECONOMY AND THE EXPECTED DEMAND FOR STEEL IN Dec 2015 Abdullah S. Al-Zahrani Business Analyst -Strategy Metal SBU
 SAUDI ARABIA'S ECONOMY AND THE EXPECTED DEMAND FOR STEEL IN 225 15 Dec 215 Abdullah S. Al-Zahrani Business Analyst -Strategy Metal SBU CONTENT 1. Overview of SABIC 2. Overview of the KSA Economy o Non-Oil
Saudi Economy: still shining
 Saudi Economy: still shining - - - For comments and queries please contact the author: Fahad Alturki Senior Economist falturki@jadwa.com Real GDP growth 199 1 F Saudi Arabia World Advanced economies Head
The expansion of the U.S. economy continued for the fourth consecutive
 Overview The expansion of the U.S. economy continued for the fourth consecutive year in 2005. The President has laid out an agenda to maintain the economy's momentum, foster job creation, and ensure that
GCC/ MENA macro outlook. Khatija Haque, Head of MENA Research March 2018
 GCC/ MENA macro outlook Khatija Haque, Head of MENA Research March 18 1 % y/y GCC: Is the worst behind us? Average GCC GDP growth 1 and 17 have been challenging on a number of fronts for the GCC. Lower
HONDURAS. 1. General trends
 Economic Survey of Latin America and the Caribbean 2016 1 HONDURAS 1. General trends Economic growth in Honduras picked up in 2015, reaching 3.6%, compared with 3.1% in 2014. This performance was mainly
5. Bulgarian National Bank Forecast of Key
 5. Bulgarian National Bank Forecast of Key Macroeconomic Indicators for 2018 2020 The BNB forecast of key macroeconomic indicators is based on data published as of 15 June 2018. ECB, EC and IMF assumptions
Results of non-financial corporations in the first half of 2018
 Results of non-financial corporations in the first half of 218 ECONOMIC BULLETIN 3/218 ANALYTICAL ARTICLES Álvaro Menéndez and Maristela Mulino 2 September 218 According to data from the Central Balance
The Province of Prince Edward Island Employment Trends and Data Poverty Reduction Action Plan Backgrounder
 The Province of Prince Edward Island Employment Trends and Data Poverty Reduction Action Plan Backgrounder 5/17/2018 www.princeedwardisland.ca/poverty-reduction $000's Poverty Reduction Action Plan Backgrounder:
KBC INVESTMENT STRATEGY PRESENTATION. Defensive August 2017
 KBC INVESTMENT STRATEGY PRESENTATION August 2017 Investment climate Key rate trends and outlook 2,0 2,0 1,5 VS EMU 1,5 0,5 0,5 0,0 0,0-0,5-0,5 - - 07-2012 07-2013 07-2014 07-2015 07-2016 07-2017 07-2018
Viet Nam GDP growth by sector Crude oil output Million metric tons 20
 Viet Nam This economy is weathering the global economic crisis relatively well due largely to swift and strong policy responses. The GDP growth forecast for 29 is revised up from that made in March and
HSBC Trade Connections: Trade Forecast Quarterly Update October 2011
 HSBC Trade Connections: Trade Forecast Quarterly Update October 2011 New quarterly forecast exploring the future of world trade and the opportunities for international businesses World trade will grow
Finland falling further behind euro area growth
 BANK OF FINLAND FORECAST Finland falling further behind euro area growth 30 JUN 2015 2:00 PM BANK OF FINLAND BULLETIN 3/2015 ECONOMIC OUTLOOK Economic growth in Finland has been slow for a prolonged period,
Financial Crises & New Economic Geography: Emerging Alternative Finance
 Financial Crises & New Economic Geography: Emerging Alternative Finance Dr. Nasser Saidi The Annual Falcon Group Trade and Corporate Finance Forum 2 March 2014 Agenda ü Shifting Global Economic Geography
Middle East and North Africa Regional Economic Outlook Oil, Conflicts, and Transitions
 Middle East and North Africa Regional Economic Outlook Oil, Conflicts, and Transitions May 5, 2015 Agenda Global Environment MENAP Oil Exporters MENAP Oil Importers Global growth remains moderate and uneven
Eurozone. EY Eurozone Forecast September 2014
 Eurozone EY Eurozone Forecast September 2014 Austria Belgium Cyprus Estonia Finland France Germany Greece Ireland Italy Latvia Luxembourg Netherlands Portugal Slovakia Slovenia Spain Outlook for Stronger
Recent developments in the Global and South African economies
 Day Month Year Recent developments in the Global and South African economies Presented by: Nico Kelder Senior Economist Industrial Development Corporation of South Africa 2010 Growth, Development and Investment
MACROECONOMIC FORECAST
 MACROECONOMIC FORECAST Autumn 2017 Ministry of Finance of the Republic of Bulgaria The Autumn macroeconomic forecast of the Ministry of Finance takes into account better performance of the Bulgarian economy
KMEFIC Research Kuwait Economic Report
 K Kuwait Economic Report September 2013 Department شركة الكويت والشرق األوسط لإلستثمارالمالي ش.م.ك.م Kuwait and Middle East Financial Investment Company K.S.C.C September 2013 TABLE OF CONTENTS INTRODUCTION...
The real change in private inventories added 0.22 percentage points to the second quarter GDP growth, after subtracting 0.65% in the first quarter.
 QIRGRETA Monthly Macroeconomic Commentary United States The U.S. economy bounced back in the second quarter of 2007, growing at the fastest pace in more than a year. According the final estimates released
BCC UK Economic Forecast Q4 2015
 BCC UK Economic Forecast Q4 2015 David Kern, Chief Economist at the BCC The main purpose of the BCC Economic Forecast is to articulate a BCC view on economic topics that are relevant to our members, and
The Rise of the Middle East Sovereign Wealth Funds: Causes, Consequences and Policies
 Journal of Middle Eastern and Islamic Studies (in Asia) Vol.9, No. 2, 2015 The Rise of the Middle East Sovereign Wealth Funds: Causes, Consequences and Policies YANG Li 1 (Shanghai International Studies
Economic Survey December 2006 English Summary
 Economic Survey December English Summary. Short term outlook Reaching an annualized growth rate of.5 per cent in the first half of, GDP growth in Denmark has turned out considerably stronger than expected
Invest in the World s Leading Energy Region FMG MENA FUND
 Invest in the World s Leading Energy Region 2019 The Opportunity The value of proven oil reserves in the Middle East & North Africa (MENA) region exceeds the market capitalization of the world s publicly
Economic Update 4 July 2017
 Economic Update July 17 Macroeconomic outlook UAE: Growth set to moderate slightly in 17 amid crude oil cuts > Dana Al-Fakir Economist +9 9 373, danafakir@nbk.com > Nemr Kanafani Senior Economist +9 9
Outlook for Economic Activity and Prices
 Not to be released until : p.m. Japan Standard Time on Saturday, October 31, 15. October 31, 15 Bank of Japan Outlook for Economic Activity and Prices October 15 (English translation prepared by the Bank's
GLOBAL INVESTMENT IN INFRASTRUCTURE: THE ROLE OF OIL EXPORTERS
 GLOBAL INVESTMENT IN INFRASTRUCTURE: THE ROLE OF OIL EXPORTERS Shahrokh Fardoust, Ph.D. Research Professor, College of William and Mary President, International Economic Consultants, LLC SFardoust@InternationalEconConsult.com
SAIBOR eases marginally. Crude oil slips
 Research Department ARC Research Team Tel 966 11 211 9370, research@alrajhi-capital.com Saudi Arabian Economy - Liquidity easing Saudi Arabian economy Liquidity improving owing to the government initiatives
The Economic Outlook of Taiwan
 The Economic Outlook of Taiwan by Ray Yeutien Chou and Shou-Yung Yin The Institute of Economics, Academia Sinica, Taipei October 2016 Prepared for Project LINK 2016 Fall Meeting, Toronto City, Oct. 19-21,
Some Further MENA Issues
 APICORP at DIFC-OECD EmNet Meeting Dubai, 12 December 2011 Some Further MENA Issues Medium-term Microeconomic Challenges; Long-term Macroeconomic Threats By Ali Aissaoui, Senior Consultant Arab Petroleum
Eurozone. EY Eurozone Forecast March 2015
 Eurozone EY Eurozone Forecast March 2015 Austria Belgium Cyprus Estonia Finland France Germany Greece Ireland Italy Latvia Lithuania Luxembourg Malta Netherlands Slovakia Slovenia Spain Outlook for Modest
Economic Projections for
 Economic Projections for 2015-2017 Article published in the Quarterly Review 2015:3, pp. 86-91 7. ECONOMIC PROJECTIONS FOR 2015-2017 Outlook for the Maltese economy 1 The Bank s latest macroeconomic projections
Indonesia s Economic Outlook, Economic Challenges & Policy Responses
 Indonesia s Economic Outlook, Economic Challenges & Policy Responses Muliaman D. Hadad, Ph.D Chairman, The Indonesian Financial Services Authority Prepared for Indonesia-Australia Business Week Financial
Executive Directors welcomed the continued
 ANNEX IMF EXECUTIVE BOARD DISCUSSION OF THE OUTLOOK, AUGUST 2006 The following remarks by the Acting Chair were made at the conclusion of the Executive Board s discussion of the World Economic Outlook
ANNUAL ECONOMIC REPORT AJMAN 2015
 ANNUAL ECONOMIC REPORT AJMAN C O N T E N T S Introduction Growth of the Global Economy Economic Growth in the United Arab Emirates Macro - Economic Growth in the Emirate of Ajman Gross Domestic Product
South African Reserve Bank STATEMENT OF THE MONETARY POLICY COMMITTEE. Issued by Lesetja Kganyago, Governor of the South African Reserve Bank
 South African Reserve Bank PRESS STATEMENT EMBARGO DELIVERY 23 November 2017 STATEMENT OF THE MONETARY POLICY COMMITTEE Issued by Lesetja Kganyago, Governor of the South African Reserve Bank Since the
Quarterly Economic Monitor
 Overview of Quarterly Economic Monitor December 214 Queenstown s economy boomed during 214, with ' provisional estimate of GDP showing that the Queenstown-Lakes District economy grew by 4.5% over the year
Saudi Arabian economy
 Research Department ARC Research Team Tel 966 11 211 9370, research@alrajhi-capital.com Saudi Arabian economy Saudi Arabian Economy The IMF executive board maintained the Kingdom s real GDP growth outlook
Greece. Eurozone rebalancing. EY Eurozone Forecast June Portugal Slovakia Slovenia Spain. Latvia Lithuania Luxembourg Malta Netherlands
 EY Forecast June 215 rebalancing recovery Outlook for Delay in agreeing reform agenda has undermined the recovery Published in collaboration with Highlights The immediate economic outlook for continues
YEREVAN 2014 MACROECONOMIC OVERVIEW OF ARMENIA
 YEREVAN 2014 MACROECONOMIC OVERVIEW OF ARMENIA MACROECONOMIC OVERVIEW In the early 1990s, a sharp boost of unemployment, reduction of real wages, shrinkage of tax-base, persistent cash shortages of GoA
Eurozone. EY Eurozone Forecast September 2014
 Eurozone EY Eurozone Forecast September 2014 Austria Belgium Cyprus Estonia Finland France Germany Greece Ireland Italy Latvia Luxembourg Malta Netherlands Portugal Slovakia Slovenia Spain Outlook for
Exploring the rise of self-employment in the modern economy
 Exploring the rise of self-employment in the modern economy A guide to demographics and other trends in the UK s self-employed workforce in 2017 1 About IPSE IPSE is the largest association of independent
Monthly Report of Prospects for Japan's Economy
 Monthly Report of Prospects for Japan's Economy March 15 Macro Economic Research Centre Economics Department http://www.jri.co.jp/english/periodical/ This report is the revised English version of the February
UAE Economic Insight 2013
 UAE Economic Insight 21 Contents Executive Summary Background 2 Recent Developments Macroeconomic Outlook 5 Key Macroeconomic Indicators 7 Economics Team economics@qnb.com.qa Mohamad Moabi Assistant General
Monthly Bulletin. Feature: Oil in retreat
 Monthly Bulletin Feature: Oil in retreat Oil price Oil prices slumped over the past month, as the cumulative effect of slowing demand growth and greater supply made the continued run up in oil prices unsustainable.
Saudi Arabia s 2013 budget
 23 29 December 8 212 Saudi Arabia s 213 budget 9 7 4 3 For comments and queries please contact the author: Fahad Alturki Senior Economist falturk@jadwa.com Government budget 3 7 9 211 213 Revenue Expenditure
Outlook for Economic Activity and Prices (April 2010)
") April 30, 2010 Bank of Japan Outlook for Economic Activity and Prices (April 2010) The Bank's View 1 The global economy has emerged from the sharp deterioration triggered by the financial crisis and has
April 30, 2010 Bank of Japan Outlook for Economic Activity and Prices (April 2010) The Bank's View 1 The global economy has emerged from the sharp deterioration triggered by the financial crisis and has
Meeting with Analysts
 CNB s New Forecast (Inflation Report III/2018) Meeting with Analysts Karel Musil Prague, 3 August 2018 Outline 1. Assumptions of the forecast 2. The new macroeconomic forecast 3. Comparison with the previous
Unprecedented Change. Investment opportunities in an ageing world JUNE 2010 FOR PROFESSIONAL ADVISERS ONLY
 Unprecedented Change Investment opportunities in an ageing world Baring Asset Management Limited 155 Bishopsgate London EC2M 2XY Tel: +44 (0)20 7628 6000 Fax: +44 (0)20 7638 7928 www.barings.com JUNE 2010
Weekly Economic Update
 Weekly Economic Update Sunday, 29 January 2012 1 Weekly Economic Update % 2008-Q1 2008-Q2 2008-Q3 2008-Q4 2009-Q1 2009-Q2 2009-Q3 2009-Q4 2010-Q1 2010-Q2 2010-Q3 2010-Q4 2011-Q1 2011-Q2 2011-Q3 2011-Q4
Rising Middle East Stock Markets
 Rising Middle East Stock Markets Index, January 2002 = 100 1400 1200 1000 800 600 400 200 Egypt Israel Jordan Kuwait Saudi Arabia U.A.E. 0 2003 2004 2005 2006 Source: Bloomberg Capital Access Index 2006
Saudi Arabian economy Moderation in 2013 and rebound in 2014
 Research Department Md. Rahmatullah Khan, Economic analyst Tel: +966 1 211 9319, khanmr@alrajhi-capital.com Saudi Arabian economy Saudi Arabian economy Moderation in 2013 and rebound in 2014 Saudi Arabian
Part 1: Country Report
 The 20 th ASIA CONSTRUCT CONFERENCE 13-14th November 2014 Part 1: Country Report Economy and Construction Industry in Korea Prepared By Bae, Yujin 254 Simindea-ro, Dongan-Gu Anyang-Shi, Kyounggi-Do 431-712,
Economic Research March 2014
 Saudi Arabian economy Economic Research March 214 Research Department Md. Rahmatullah Khan, Economic analyst Tel: +966 11 211 9319, khanmr@alrajhi-capital.com Saudi Arabian Economy Saudi Arabia s sovereign
Antonio Fazio: Overview of global economic and financial developments in first half 2004
 Antonio Fazio: Overview of global economic and financial developments in first half 2004 Address by Mr Antonio Fazio, Governor of the Bank of Italy, to the ACRI (Association of Italian Savings Banks),
Middle East and North Africa Regional Economic Outlook
 Regional Economic Outlook Morocco Algeria Tunisia Libya Lebanon Egypt Syria Iraq Iran Jordan Saudi Kuwait Arabia Bahrain Afghanistan Pakistan Mauritania Sudan Djibouti Qatar Yemen Oman United Arab Emirates
South African Reserve Bank STATEMENT OF THE MONETARY POLICY COMMITTEE. Issued by Lesetja Kganyago, Governor of the South African Reserve Bank
 South African Reserve Bank PRESS STATEMENT EMBARGO DELIVERY 20 November 2014 STATEMENT OF THE MONETARY POLICY COMMITTEE Issued by Lesetja Kganyago, Governor of the South African Reserve Bank Since the
STRUCTURAL CHALLENGES FACING THE SINGAPORE ECONOMY
 STRUCTURAL CHALLENGES FACING THE SINGAPORE ECONOMY Presentation to The Singapore Economic Policy Forum 21 st October 2011 Manu Bhaskaran Vice-President Economic Society of Singapore KEY TAKEAWAYS Structural