UAE Economic Insight 2013
|
|
|
- Brice Pierce
- 6 years ago
- Views:
Transcription


1 UAE Economic Insight 21


2
3 Contents Executive Summary Background 2 Recent Developments Macroeconomic Outlook 5 Key Macroeconomic Indicators 7 Economics Team economics@qnb.com.qa Mohamad Moabi Assistant General Manager mohamad.moabi@qnb.com.qa Joannes Mongardini Head of Economics joannes.mongardini@qnb.com.qa Justin Alexander Senior Economist justin.alexander@qnb.com.qa Roy Thomas Senior Economist roy.thomas@qnb.com.qa Rory Fyfe Economist rory.fyfe@qnb.com.qa Ehsan Khoman Economist Ehsan.Khoman@qnb.com.qa Hamda Al-Thani Economist hamda.althani@qnb.com.qa Editorial closing, 15th July 21 A. Recent Macroeconomic Developments (212) Real GDP registered the strongest growth (4.4%) since 2. This was driven by an expansion in oil and gas (.%) and a recovery in the non-oil sector (.5%), particularly in real estate and business services (.%). On the demand side, there was particular strength in private consumption (9.4%) and investment (12.5%). Inflation was subdued at.7%, kept low by a third year of falling rents. The 212 fiscal outturn is not yet available, but we estimate that a significant consolidation (% of GDP) has taken place in capital expenditures. This, together with stronger oil exports, is estimated to have boosted the consolidated national surplus to 5.9% of GDP. The current account surplus rose to 17.% of GDP, given higher oil and non-oil exports. The banking sector witnessed deposits growing at their strongest pace since 28 (8.%). However, lending growth was more muted (.4%) and the non-performing loans ratio rose to 8.4% at end-212, reflecting the lingering effects of the real estate crisis of B. Macroeconomic Outlook (21-14) We forecast real GDP growth will slow to 4.% in 21 and.8% in 214 as further strengthening in the non-oil sector is offset by a slowdown in oil and gas. Oil production growth is expected to slow because of delays in issuing contracts and uncertainty over the 214 expiration of the 5yr concession on Abu Dhabi s onshore oil fields. The non-oil sector will be buoyed by continued strong private sector consumption growth (averaging.%) and large construction projects more than offsetting a slowdown in government expenditure. This will help raise non-oil growth to an average of 4.7% in Downside risks to this scenario include lower global economic activity and further declines in oil prices. Inflation is expected to remain moderate over the medium term. Lower oil revenues will also lead to a narrowing of the national fiscal surplus to 5.% in 21 and.5% of GDP in 214. The current account surplus is expected to narrow slightly in (to an average 14.7% of GDP), owing to lower oil prices and import growth, linked to rising domestic demand. The banking sector is expected to see stronger lending growth than in recent years, particularly in the construction sector. Lending to the public sector will be impacted by a final decision by the central bank on new lending limits to Government-Owned Enterprises (GREs). On the deposit side, banks are likely to focus increasingly on higher net-worth depositors. 1
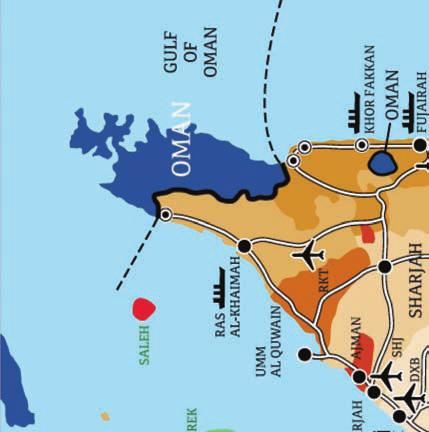
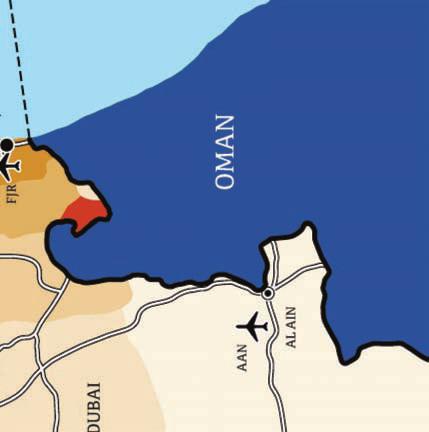
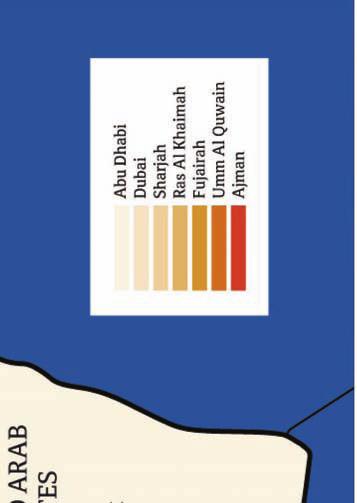
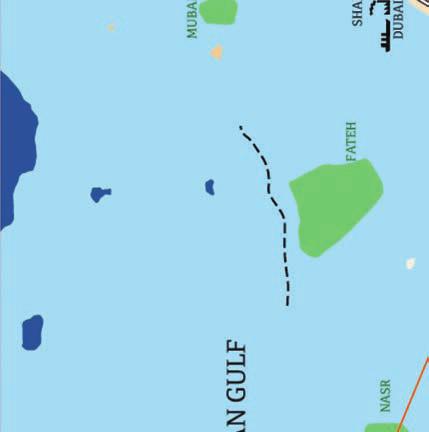
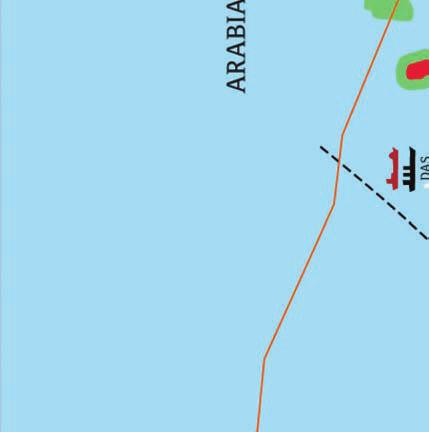
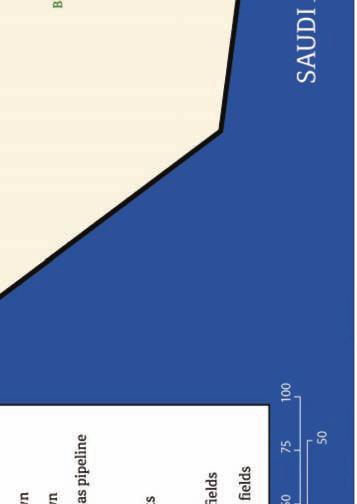
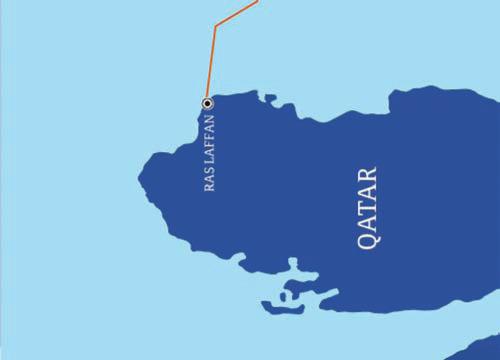
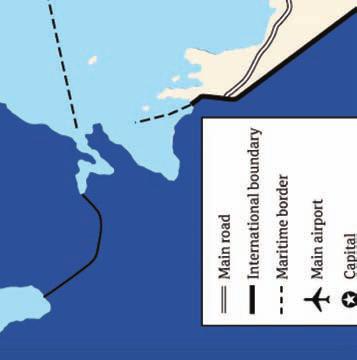
4 Qatar Abu Dhabi Kuwait UAE Dubai Oman Saudi Arabia Bahrain 5 northern emirates Background Abu Dhabi is pre-eminent among the emirates because of its oil reserves and size Uniquely amongst the Gulf Cooperation Council (GCC) states, the United Arab Emirates (UAE) is a federation of seven largely autonomous emirates who joined together in 1971 after independence. They vary significantly in size, population, economic structure and hydrocarbon resources. Abu Dhabi has a dominant role as it holds most of the UAE s oil and gas reserves, as well as 87% of the land area and 4% of nationals. Abu Dhabi s hydrocarbon revenue per national is US$22,, the highest in the GCC. As a result, Abu Dhabi has a per capita GDP of US$82,, more than double the UAE average. Dubai has become a regional trade, manufacturing and services hub Dubai still has significant hydrocarbon reserves and revenue, relative to its population, but its production has declined since the late 199s. In response to this decline, Dubai has invested heavily in infrastructure development to diversify its economy. It drew on a long tradition of international commerce to create an unrivalled regional hub for trade and manufacturing, now focused on the Jebel Ali port and free zone, as well as a broader services economy. As a result, it has achieved a similar level of development to Abu Dhabi and a per capita GDP more than twice as high as the five northern emirates. Although it was weakened by a debt and real estate crisis in 29, its economy is now recovering. Sharjah and Ajman serve as residences for workers in Dubai; other emirates rely on federal funding Sharjah is the third largest emirate and has some oil and gas reserves, although production is down sharply from the peak. It is situated next to Dubai and, along with Ajman, the smallest but most densely populated emirate, forms part of a continuous coastal metropolis. Cheaper rents in these emirates mean that hundreds of thousands of workers commute from them into Dubai daily. The other three emirates have smaller expatriate populations. They are subsidized by revenue transfers from the federal government. Umm al-quain, the smallest emirate, has recently begun producing gas from a small offshore field. Ras al-khaimah, at the UAE s northern tip, is the fourth largest emirate, with a little offshore gas, although its Saleh field has been largely depleted. Finally, Fujairah is the only emirate situated on the east coast. It is rising in importance as the terminus of a strategic new pipeline bypassing the Straits of Hormuz, and associated downstream industries. Oil and Gas Wealth Per National (212) Hydrocarbon revenue (US$k / national) Source: BP and QNB Group estimates; excludes emirates with little oil or gas. 94% Dubai Qatar 724 Abu Dhabi UAE Kuwait Dubai Sharjah Saudi Bahrain Oman GDP Per Capita (212) (US$k) Hydrocarbon reserves (k boe / national) Source: National and emirate sources and QNB Group estimates Population by Emirate and Nationality (212) (m, % share shown) % Abu Dhabi % Sharjah 4.4 9% Ajman Source: QNB Group estimates based on National Bureau of Statistics (NBS) data Nationals.4 75% RAK Emirates GCC states Emirates GCC states % Fujaira GCC av Expatriates Total = 8.8m 1.m 7.8m (89%.1 81% Umm al Quain 2
5 Recent Developments (212) The private sector took the lead in the recovery in Real GDP registered the highest growth since 2 (4.4%) as the oil sector saw a second year of strong expansion (.%) and the non-oil sector grew by.5%, the strongest rate since 28. Oil production reached a new record of.4m barrels/day (including crude, condensates and NGLs), according to BP data, although this only represented a 1.8% rise compared with 211. In addition, marketable gas production actually declined slightly. On the demand side, the private sector showed a marked uptick after a period of weak performance. On top of very strong private consumption growth (9.4%), the surge in investment (12.5%) was driven by the private sector, more than offsetting a contraction in government investment. Real GDP Growth with Selected Components (28-12) (% change) Total Oil Non-oil -4.8 Government Consumption Private Consumption Investment Source: NBS and QNB Group analysis boosted by a turnaround in the real estate sector The real estate sector (combined with business services) grew at its strongest rate in five years (.%), providing the largest contribution (28%) to non-oil growth. This real estate recovery was most evident in Dubai which was ranked as the world s second hottest real estate market of 212 in Knight Frank s global house price index, with average residential prices up 19% over the year. Price rises have fed into Dubai rents which bottomed out in late 212, after four years of decline. Average UAE rental inflation was still -2.% on average over 212, keeping overall inflation at a muted.7%. Government and financial services also provided a significant contribution to growth in 212. Less positively, domestic trade, the largest non-oil sector, grew by just.%. The construction sector stabilized (.1%) following two years of contraction. Sector Contributions to Non-Oil Real Growth (212) (length of bars is % change, area of bars is share in non-oil real GDP growth) Real Estate & Business Services Government Services Transport & Comms Trade Hospitality. Domestic Services. Construction.1 Agriculture Financial services 18%. Social services Utilities Manufacturing % %. 5.9 Source: NBS and QNB Group analysis Services Industry Agriculture Expenditure consolidation boosts the fiscal surplus The 212 fiscal outturn is not yet available, but we estimate that expenditure consolidation (% of GDP) led to a significant increase in the fiscal surplus. The expenditure consolidation was concentrated in capital expenditures, where project implementation and the start of new projects were delayed. Overall current expenditure is estimated to have grown in line with GDP, notwithstanding a significant hike in federal wages. Oil and other revenue remained broadly unchanged in percent of GDP. As a result, the overall fiscal surplus is estimated to have increased to 5.9% of GDP, the highest in the last four years Consolidated Fiscal Outturn (28-12) (% of GDP, balance shown at top/bottom of columns) Other revenues Oil and gas revenues Current expenditure Capital expenditure 211 Source: IMF and QNB Group analysis e
6 The economic recovery led to reduced CDS spreads The economic recovery, together with a broader repricing of emerging market debt, helped reduce bond yields and credit default swap (CDS) spreads to historic lows in Abu Dhabi and by over a half in Dubai. Concerns remain about the debt of Government- Related Enterprises (GREs) and the Dubai government, but the market seems to expect that the sizable tranches of debt coming due in the next few years, including a key US$2bn bailout loan from Abu Dhabi and the central bank to Dubai, will be rolled over successfully Dubai CDS Spread (Jan 212 Jun 21) (basis points above US Treasuries for a 5yr bond) 2 Jan-12 Mar-12 Jun-12 Sep-12 Dec-12 Mar-1 Jun-1 A record trade surplus swelled the current account surplus The current account surplus rose to the highest level (17.% of GDP) since 2. Higher oil and non-oil exports delivered a record trade surplus (.4% of GDP), despite strong import growth (1.5%). The other components of the current account (services, income and transfers) remained stable in relative terms. In the capital and financial account, foreign direct investments picked up significantly. Portfolio investment data is only available in net terms and showed only a small increase (US$1bn) making it hard to identify the reported US$8bn of safe haven capital inflows that were received in 212 in response to regional instability. The overall balance of payments surplus boosted reserves to US$45.8bn at end-212, equivalent to 4.4 months of domestic import cover (the IMF recommends a minimum of three month cover for pegged exchange rate regimes like the UAE). Bank deposits rose but lending remained muted The banking sector witnessed deposits growing at their strongest rate (8.%) since 28, partly due to safe haven capital inflows from countries in the region with political instability. This provided a boost to liquidity and eased interbank lending rates (three month rates fell to 1.% by end-212). Lending grew more gradually (.4%), and new lending was concentrated mainly in the government and construction sectors. The 29 real estate and debt crisis has contributed to this moderation in lending and rising non-performing loans levels (8.4% at end-212). New central bank rules, increasing liquid asset coverage requirements, may have reduced the pool of loanable funds. All but one of the local banks saw a rise in profits in 212, and their aggregate profit growth was 17.4%, despite pressure on margins. Contributions to the uptick included lower growth in provisioning and greater fee income, including from trade financing Source: Bloomberg and QNB Group analysis Balance of Payments (28-12) (% of GDP, overall balance shown at top/bottom of columns) Current account Capital & financial account Source: Central Bank and QNB Group analysis Bank Loan and Deposit Growth (29-212) (% change on LHS, loans as % of deposits on RHS) Loans Deposits.7 Source: Central Bank and QNB Group analysis Errors & omissions Loan/Deposit ratio (RHS)
7 Macroeconomic Outlook (21-14) Growth momentum shifts from oil to non-oil We forecast that the UAE will continue its recent trend of steady expansion, although the rate of growth will ease slightly in 21 (4.%) and 214 (.8%). This reflects a slowdown in the oil & gas sector owing to delays in issuing contracts and uncertainty over the expiration, in 214, of the 5 year concession on Abu Dhabi s onshore oil fields. However, the non-oil sector will continue to gather momentum, buoyed by continued strong private sector consumption growth (averaging.%), more than offsetting a slowdown in government consumption. Private demand will feed particularly into the hospitality, entertainment and financial sectors, which will lead the services sector s growth. Evidence of this growth is already visible in leading indicators such as hotel occupancy. Construction is expected to return to solid growth (averaging 5.5%). The sector will be supported by housing projects, including a state plan to build over 12, units in Abu Dhabi. There are also major infrastructure projects underway, such as railways and two nuclear plants, and new megaprojects planned including Mohammad Bin Rashid City in Dubai. If Dubai wins the bid to host World Expo 22 (decision due in November 21), this will provide a further boost. Manufacturing is also picking up. The Markit Manufacturing Purchasing Managers Index (PMI) averaged 54.9 in H1-21, up from 5.4 in 212. Inflation will remain muted despite rising rents The official consumer price index (CPI) rose on average by.7% in the 12 months to May 21. The principal trend relates to housing rents, which have stabilized in Abu Dhabi and begun to increase in Dubai. We estimate that rental inflation has already turned positive nationwide and will average 1.2% over 21, picking up to 2.2% in 214. This shift will drive up inflation, but only moderately (2.% in 214), given an easing in other parts of the CPI, particularly food as a result of falling global commodity prices. Oil prices are expected to fall to US$97/barrel in 214. As a result, nominal GDP growth will average just 2.9%, bringing total GDP to US$47bn in 214. Real GDP Growth by Sector and Demand (212-14) (% change, selected components) Total Oil and gas Private Consumption 4. 21f Government Consumption 4. Industry Services 214f f 214f Source: NBS and QNB Group forecasts Inflation (212-14) (% change, sector weights in consumer price index shown) Investment Total Total Food (14%) Housing (29%) Transport & Comms (17%).7 May-1* 1. 21f Other (%) f Source: NBS and QNB Group forecasts; *average of prior 12 months The fiscal surplus will narrow Lower oil revenues will also lead to a narrowing of the consolidated national fiscal surplus to around % of GDP in 214. Non-oil revenue is expected to pick up slightly, mainly due to higher tax and fee receipts in Dubai as its economy gathers pace. Current and capital expenditure will both ease moderately relative to GDP, as continued fiscal prudence will result in only small nominal increases in government outlays Consolidated Fiscal Outturn (212-14) (% of GDP, balance shown at top of columns) e f f Source: QNB Group estimates and forecasts Other revenues Oil and gas revenues Current expenditure Capital expenditure 5
8 Debt levels are expected to fall to sustainable levels Public debt levels are expected to continue to fall to below percent of GDP by 214. The consolidated stock of public debt, including GRE borrowing, is expected to remain roughly constant in nominal terms in the coming years. Some of the maturing Dubai GRE debt will be paid off through asset disposals, and some stronger GREs will issue additional debt, but the balance of debt is unlikely to change significantly. This means that the level of debt will fall relative to GDP to about 57% of GDP by 214. Yields have increased since the US Federal Reserve began discussing a tapering of quantitative easing in June, in particular the yields on benchmark Dubai bonds and sukuk are up over 1bps. This will increase the cost of refinancing. We expect that higher yields will remain manageable as they are at par with mid-212 levels. 81 Public Debt (21-14) (% of GDP) f Source: IMF and QNB Group forecasts f The balance of payments surplus will continue to register a significant surplus A small narrowing in the current surplus is forecast to be offset by similar reductions in financial outflows over the next two years, maintaining a relatively steady balance of payments surplus (averaging 2.2% of GDP). This will boost international reserves to around US$4bn, equivalent to just over 5 months of domestic import cover (excluding imports destined for re-export). The narrowing of the current surplus (to an average of 14.7% of GDP) will mainly be driven by rising imports of both consumer and capital goods, drawn in by strong growth in private consumption and investment. Lower oil prices are expected to reduce hydrocarbon exports. The banking sector will continue to expand in line with the growth in the deposit base The growth in the banking sector will continue to be driven by its deposit base. Loan and advances growth has been picking up to 5.2% y-o-y in May 21. It is expected to accelerate further during New central bank s restrictions on lending to GREs are on hold as further consultations are underway with the banking sector. Their final form will significantly affect lending trends to the public sector. Deposits are growing faster than loans (1.8% in May 21). As a result, the loan/deposit rate has been declining steadily. This provides banks with room to increase their lending portfolios, such as in construction (up 9.1% in March 21). Growth in this sector is likely to pick up further, given the increase in ongoing projects. Personal loans are also growing strongly on the back of rising private consumption. In terms of deposits, banks are likely to focus on higher networth depositors as they face some competition from shadow banking in lower income segments Current Account Balance (212-14) (% of GDP, overall balance shown at top of columns) Source: Central Bank and QNB Group forecasts; *re-export trade excluded f f Bank Loan and Deposit Growth (Jan 12-May 1) (% change YoY) Jan-12-5 Apr-12 Source: Central Bank; Loan by sector data only available until Mar Loans & advances (total) Loans (construction) Jul-12 Oct-12 Income balance Other exports* Hydrocarbon exports Domestic imports* Services balance Transfers balance Jan-1 Deposits Apr-1
9 Key Macroeconomic Indicators f 214f Real sector indicators Real GDP growth (%) Oil & gas sector Non-oil sector Government consumption Private consumption Fixed investment Net exports Nominal GDP (US$ bn) Growth (%) Oil & gas sector (% of GDP) Consumer price inflation (%) Food Housing Budget balance (% of GDP) Revenue (oil) Revenue (non-oil) Expenditure Public debt External sector (% of GDP) Current account balance Trade balance Exports Imports Services balance Income balance Current transfers balance Capital account balance International reserves External debt Monetary indicators Interbank interest (%, months) Exchange rate US$:AED (av) Banking sector indicators (%) Average return on assets Average non-performing loans ratio Deposit growth Credit growth Memorandum items Population (m) Growth (%) Oil production (' bpd) 2,572 2,242 2,24 2,55 2,57 2,75 2,78 UAE crude price (US$/barrel) Gas production (m cu ft/day) Source: NBS, Central Bank, IMF and QNB Group estimates and forecasts; Data as at 15th July 21 7


 SA, +41 22 97 77, Info@qnb.com.qa Syria: QNB Syria, +9 11 229 1, QNBSyria@qnb.com.qa Tunisia: QNB Tunisia, +21 71 75, www.")

10 Publications and QNB Group s International Network Recent Economic Insight Reports Kuwait 21 Qatar 21 Oman 21 Jordan 212 Qatar reports Qatar Monthly Monitor Recent Weekly Economic Commentaries GCC inflation has accelerated but should stabilize QE tapering in the US could act as a brake on global growth Emerging Markets Enter a Difficult Period of Weaker Growth, Capital Flight, and Tighter Monetary Policy Credit Squeeze May Dampen Economic Growth in China, According to QNB Group QNB Group Branches France: , QNBParis@qnb.com.qa Kuwait: , QNBKuwait@qnb.com.qa Lebanon: , QNBLebanon@qnb.com.qa Mauritania: , QNBMauritania@qnb.com.qa Oman: , QNBOman@qnb.com.qa Singapore: , QNBSingapore@qnb.com.qa South Sudan: QNBSouthSudan@qnb.com.qa Sudan: , QNBSudan@qnb.com.qa UK: , QNBLondon@qnb.com.qa Yemen: , QNBYemen@qnb.com.qa QNB Group Subsidiaries Egypt: NSGB, , Info.nsgb@nsgb.com.eg India: QNB (India) Private, launching Q-21 Indonesia: QNB Kesawan, , Iraq: Mansour Bank, , Switzerland: QNB Banque Privée (Suisse) SA, , Info@qnb.com.qa Syria: QNB Syria, , QNBSyria@qnb.com.qa Tunisia: QNB Tunisia, , QNB Group Associates Jordan: The Housing Bank for Trade and Finance, , Libya: Bank of Commerce and Development, , UAE: Commercial Bank International, , Disclaimer and Copyright Notice All the information in this report has been carefully collated and verified. However, QNB Group accepts no liability whatsoever for any direct or consequential losses arising from its use. Where an opinion is expressed, unless otherwise cited, it is that of the authors which does not coincide with that of any other party, and such opinions may not be attributed to any other party. The report is distributed on a complimentary basis to valued business partners of QNB Group. It may not be reproduced in whole or in part without permission 8
Nigeria Economic Update QNB Group. September 2014
 Nigeria Economic Update QNB Group September 21 Nigeria Overview A rebasing of GDP in 213 has made Nigeria the biggest economy in Africa with the largest population; the economy is growing rapidly but remains
Switzerland Economic Update QNB Group. September 2014
 Switzerland Economic Update QNB Group September 14 Switzerland Overview Switzerland s efficient capital markets, highly skilled human capital and low corporate tax rates make it the world's most competitive
France Economic Update QNB Group. September 2014
 France Economic Update QNB Group September 2014 France Overview France is the ninth largest economy in the world on a purchasing power parity basis and service-oriented; high indebtedness and lack of reforms
Indonesia Economic Update QNB Group. October 2014
 Indonesia Economic Update QNB Group October 214 Indonesia Overview The economy has enormous long-term potential based on a rich endowment of natural resources and a large population; the new Jokowi administration
Investor Relations Presentation December 2013
 Investor Relations Presentation December 2013 Contents 1. QNB at a Glance 2. QNB Comparative Positioning Qatar and MENA 3. Financial Highlights as at 31 December 2013 4. Economic Overview Notes: These
Global Markets Update QNB Economics 19 June 2016
 Global Markets Update QNB Economics 19 June 16 Executive Summary Key Takeaways Most advanced economy sovereign bond yields fell on heightened risk aversion due to a worse US outlook and data and rising
Global Markets Update QNB Economics 12 March 2017
 Global Markets Update QNB Economics 12 March 2017 Executive Summary Key Takeaways US yields rose on a highly likely Fed rate hike this week; Eurozone yields rose after the ECB president lowered expectations
Investor Relations Presentation December 2012
 Investor Relations Presentation December 2012 Contents 1. QNB at a Glance 2. QNB Comparative Positioning Qatar and MENA 3. Financial Highlights December 2012 4. Economic Overview 2 QNB at a Glance QNB
Global Markets Update QNB Economics 03 July 2016
 Global Markets Update QNB Economics 03 July 2016 Executive Summary Key Takeaways Sovereign bond yields fell globally as the continued fallout from Brexit raised expectations for widespread monetary easing
Global Markets Update QNB Economics 7 August 2016
 Global Markets Update QNB Economics 7 August 2016 Executive Summary Key Takeaways US yields rose on strong jobs data, raising expectations of possible Federal Reserve action; Saudi rates increased on concerns
Global Markets Update QNB Economics 30 October 2016
 Global Markets Update QNB Economics 30 October 2016 Executive Summary Key Takeaways Global bond yields jumped on stronger than expected global activity data No major movements in global currencies Japanese
Global Markets Update QNB Economics 19 February 2017
 Global Markets Update QNB Economics 19 February 2017 Executive Summary Key Takeaways Yields in advanced economies were stable while local factors dominated emerging market performance The Egyptian pound
Global Markets Update QNB Economics 12 November 2017
 Global Markets Update QNB Economics 12 November 2017 Executive Summary Key Takeaways Advanced economy 10-year yields rose on expectations of reduced quantitative easing; Saudi Arabia s corruption probe
Global Markets Update QNB Economics 01 May 2016
 Global Markets Update QNB Economics 1 May 16 Executive Summary Key Takeaways Weaker than expected US GDP led to lower US sovereign bond yields while better than expected Eurozone GDP led to higher European
Global Markets Update QNB Economics 28 August 2016
 Global Markets Update QNB Economics 28 August 2016 Executive Summary Key Takeaways Yields rose in Brazil and South Africa on political concerns; Indonesian rates jumped on worries about the cost of cleaning
Economic Update 4 July 2017
 Economic Update July 17 Macroeconomic outlook UAE: Growth set to moderate slightly in 17 amid crude oil cuts > Dana Al-Fakir Economist +9 9 373, danafakir@nbk.com > Nemr Kanafani Senior Economist +9 9
Emirates NBD Research UAE Sector Chart Pack
 Emirates NBD Research UAE Sector Chart Pack Thanos Tsetsonis athanasiost@emiratesnbd.com May 218 1 mn b/d USD / b UAE: Downside risks to 218 growth forecast due to lower oil production estimates Highlights
Global Markets Update QNB Economics 01 October 2017
 Global Markets Update QNB Economics 01 October 2017 Executive Summary Key Takeaways US yields continued to rise on prospects of a third rate hike this year as well renewed optimism around potential tax
Global Markets Update QNB Economics 29 October 2017
 Global Markets Update QNB Economics 29 October 2017 Executive Summary Key Takeaways US yields rose due to strong Q3 GDP and durable goods data The Euro slid after the ECB announced that it would reduce
Economic activity gathers pace
 Produced by the Economic Research Unit October 2014 A quarterly analysis of trends in the Irish economy Economic activity gathers pace Positive data flow Recovery broadening out GDP growth revised up to
Global Markets Update QNB Economics 15 October 2017
 Global Markets Update QNB Economics 15 October 2017 Executive Summary Key Takeaways US yields fell after inflation came in lower-than-expected; Turkish rates rose after a diplomatic dispute with the US
Investor Relations Presentation September 2014
 Investor Relations Presentation September 2014 Contents 1. QNB at a Glance 2. QNB Comparative Positioning Qatar and MENA 3. Financial Highlights as at 30 September 2014 4. Economic Overview Notes: These
UAE: Update November 2015
 Report Series UAE: Update Executive Summary Economics Department Samba Financial Group P.O. Box 833, Riyadh 11241 Saudi Arabia ChiefEconomist@samba.com +44 207659-8200 (London) This and other publications
Saudi Chartbook. Summary. December 2014
 December 1 Saudi Chartbook Summary Real Economy: Economic data for October showed signs of cooling. The non-oil PMI fell following a 39-month peak in the previous month. Data on consumer spending showed
Algeria's GDP growth is expected to stand at 3.5%, inflation at 7.5% for 2018.
 Public Disclosure Authorized Public Disclosure Authorized Public Disclosure Authorized Public Disclosure Authorized Key Messages: MENA Economic Monitor- April 2018 Economic growth in MENA is projected
Introduction to KUWAIT
 Introduction to KUWAIT Kuwait is the world s 10th largest producer of oil. Total oil production, which is equivalent to half the country s GDP, was estimated at 2.9 million barrels per day in 2016. Oil
Investor Relations Presentation April 2012
 Investor Relations Presentation April 2012 Contents 1. QNB at a Glance 2. Qatar Banking Sector 3. Financial Highlights March 2012 4. Economic Overview 2 QNB at a Glance QNB at a Glance: Overview Overview
Dr. Raja M. Almarzoqi Albqami Institute of Diplomatic Studies
 Dr. Raja M. Almarzoqi Albqami Institute of Diplomatic Studies Rmarzoqi@gmail.com 3 nd Meeting of OECD-MENA Senior Budget Officials Network Dubai, United Arab Emirates, 31 October-1 November 2010 Oil Exporters
Qatar Update: A Bright Economic Outlook
 December 29 Report Series Qatar Update: A Bright Economic Outlook Executive Summary Bolstered by rising production of LNG and associated natural gas liquids, the Qatari economy has been able to ride out
Introduction to SAUDI ARABIA
 Introduction to SAUDI ARABIA Saudi Arabia is the world s largest oil producer and exporter with almost one-fifth of the word s proven oil reserves. Benefiting from abundant and cheap energy, the industrial
The real change in private inventories added 0.22 percentage points to the second quarter GDP growth, after subtracting 0.65% in the first quarter.
 QIRGRETA Monthly Macroeconomic Commentary United States The U.S. economy bounced back in the second quarter of 2007, growing at the fastest pace in more than a year. According the final estimates released
ANNUAL ECONOMIC REPORT AJMAN 2015
 ANNUAL ECONOMIC REPORT AJMAN C O N T E N T S Introduction Growth of the Global Economy Economic Growth in the United Arab Emirates Macro - Economic Growth in the Emirate of Ajman Gross Domestic Product
MENAP Oil-Importing Countries: Risks to the Recovery Persist
 MENAP Oil-Importing Countries: Risks to the Recovery Persist The growth recovery in the Middle East, North Africa, Afghanistan, and Pakistan (MENAP) oil-importing countries is set to continue in 18, lifted
The real change in private inventories added 0.15 percentage points to the second quarter GDP growth, after subtracting 0.65% in the first quarter.
 QIRGRETA Monthly Macroeconomic Commentary United States The U.S. economy rebounded in the second quarter of 2007, growing at an annual rate of 3.4% Q/Q (+1.8% Y/Y), according to the GDP advance estimates
GCC/ MENA macro outlook. Khatija Haque, Head of MENA Research March 2018
 GCC/ MENA macro outlook Khatija Haque, Head of MENA Research March 18 1 % y/y GCC: Is the worst behind us? Average GCC GDP growth 1 and 17 have been challenging on a number of fronts for the GCC. Lower
OIL-EXPORTING COUNTRIES: KEY STRUCTURAL FEATURES, ECONOMIC DEVELOPMENTS AND OIL REVENUE RECYCLING
 OIL-EXPORTING COUNTRIES: KEY STRUCTURAL FEATURES, ECONOMIC DEVELOPMENTS AND OIL REVENUE RECYCLING This article reviews key structural features and recent economic developments in ten major oilexporting
Monthly Monitor. CPI Inflation QNB Economics recently published Will global trade finally recover in 2017?
 12 June217 Executive Summary Inflation fell to.7% year on year in April Brent crude prices fell to USD5.3/b in May Qatar s population rose to 2.7m in May from 2.68m the previous month The trade surplus
Middle East and North Africa Regional Economic Outlook
 Regional Economic Outlook Morocco Algeria Tunisia Libya Lebanon Egypt Syria Iraq Iran Jordan Saudi Kuwait Arabia Bahrain Afghanistan Pakistan Mauritania Sudan Djibouti Qatar Yemen Oman United Arab Emirates
Middle East and North Africa Regional Economic Outlook Oil, Conflicts, and Transitions
 Middle East and North Africa Regional Economic Outlook Oil, Conflicts, and Transitions May 5, 2015 Agenda Global Environment MENAP Oil Exporters MENAP Oil Importers Global growth remains moderate and uneven
Saudi Chartbook. Summary. November Real Economy: Economic data for September showed a downward trend in economic activity.
 Saudi Chartbook Summary Real Economy: Economic data for September showed a downward trend in economic activity. Government Finance: The net monthly change in government accounts with SAMA remained negative
Indonesia Economic Outlook and Policy Challenges
 Indonesia Economic Outlook and Policy Challenges Daniel A. Citrin Asia and Pacific Department, IMF April 3, 28 Global Financial Stability Map: risks have risen; conditions have deteriorated October 27
Saudi Arabian Economy
 Saudi Arabian Economy Research Department ARC Research Team, Tel. +966 11 211 9370, devassyp@alrajhi-capital.com Saudi Arabian economy continued to expand in Q3 Saudi Arabian economy has continued to expand
Investor Relations Presentation. February 2012
 Investor Relations Presentation February 2012 I. QNB At a Glance P. 3 II. QNB Operating Environment P. 7 III. QNB Financial Results IV. Qatar s Economy P. 14 P. 25 QNB at a Glance: Overview Overview Credit
GCC Quarterly. Quarterly. 4 April GCC oil production and OPEC reference price
 USD per barrel mn barrels per day GCC Quarterly Higher than expected oil prices in Q1 will benefit the GCC in the short term, boosting budget revenues and accumulated reserves. However, in the absence
THE LEBANESE ECONOMY IN 2016 BYBLOS BANK ECONOMIC RESEARCH AND ANALYSIS DEPARTMENT
 THE LEBANESE ECONOMY IN 2016 BYBLOS BANK ECONOMIC RESEARCH AND ANALYSIS DEPARTMENT ECONOMIC ACTIVITY Economic activity in Lebanon remained below potential in 2016, in line with the previous five years.
Saudi Business & Economic Report
 Saudi Business & Economic Report Summary In H15 1, the global economy was sluggish, owing to an unexpected output contraction in the US in Q15 1 and weakening domestic demand in emerging economies. The
SEPTEMBER Overview
 Overview SEPTEMBER 214 Global growth. Global growth has been weaker than expected so far this year, as economic activity disappointed in a number of major countries in the first six months (Figure 1).
GCC Quarterly. Quarterly. 18 April GCC oil production and price
 USD per barrel mn barrels per day GCC Quarterly Oil production in the GCC declined by more than 4% in Q1 213, according to Bloomberg estimates, on the back of weaker global demand. Although we retain our
Monthly Monitor. New Data Balance of payments The balance of payments (BoP) deficit narrowed for the third consecutive quarter, reaching a deficit of
 deficit narrowed for the third consecutive quarter, reaching a deficit of") 5 January 217 Executive Summary The balance of payments deficit narrowed to near balance in Q3 216 Crude oil prices rallied as more non-opec members agreed to join the production cuts Inflation decelerated
5 January 217 Executive Summary The balance of payments deficit narrowed to near balance in Q3 216 Crude oil prices rallied as more non-opec members agreed to join the production cuts Inflation decelerated
Global Economic Outlook
 Global Economic Outlook Will the growth continue and at what pace? Latin American Conference São Paulo August 2018 Lasse Sinikallas Director, Macroeconomics Copyright 2018 RISI, Inc. Proprietary Information
Emerging Markets Debt: Outlook for the Asset Class
 Emerging Markets Debt: Outlook for the Asset Class By Steffen Reichold Emerging Markets Economist May 2, 211 Emerging market debt has been one of the best performing asset classes in recent years due to
Economic Outlook. December Dan McLaughlin. Chief Economist
 Economic Outlook December 211 Chief Economist Dan McLaughlin 11q3(e) 11q1 1q3 Global growth has slowed this year... Global Growth (%) 6 4 2-2 -4-6 1q1 9q3 9q1 8q3 8q1 7q3 7q1 World US Euro And OECD expects
Sri Lanka: Recent Economic Trends. January 2018
 Sri Lanka: Recent Economic Trends January 2018 1 Agenda Summary Economic Growth Inflation and Monetary Policy External Account Fiscal Scenario of Government of Sri Lanka ICRA Lanka Limited 2 2 Agenda Summary
2,864. P/E Multiple (x) 2,829 2,795 2,761 2,727. UAE equity markets ended higher yesterday, lifted by gains in industrial and banking sector stocks.
 2,829 2,795 2,761 2,727. UAE equity markets ended higher yesterday, lifted by gains in industrial and banking sector stocks.") 19-Aug 27-Aug 29-Aug 2-Sep 4-Sep 6-Sep 1-Sep 12-Sep 17-Sep 19-Sep 23-Sep 25-Sep 26 September 218 Daman Morning Call GCC MarketWatch UAE Indices Last Close 1D 1D % YTD% 1M % 1Y % P/E Multiple (x) 2,864
19-Aug 27-Aug 29-Aug 2-Sep 4-Sep 6-Sep 1-Sep 12-Sep 17-Sep 19-Sep 23-Sep 25-Sep 26 September 218 Daman Morning Call GCC MarketWatch UAE Indices Last Close 1D 1D % YTD% 1M % 1Y % P/E Multiple (x) 2,864
3,066. P/E Multiple (x) 3,000 2,934 2,867 2,801
 3,000 2,934 2,867 2,801") 12-Jun 14-Jun 19-Jun 21-Jun 25-Jun 27-Jun 1-Jul 3-Jul 5-Jul 9-Jul 11-Jul 15-Jul 16 July 218 Daman Morning Call GCC MarketWatch UAE Indices Last Close 1D 1D % YTD% 1M % 1Y % P/E Multiple (x) 3,66 4,738
12-Jun 14-Jun 19-Jun 21-Jun 25-Jun 27-Jun 1-Jul 3-Jul 5-Jul 9-Jul 11-Jul 15-Jul 16 July 218 Daman Morning Call GCC MarketWatch UAE Indices Last Close 1D 1D % YTD% 1M % 1Y % P/E Multiple (x) 3,66 4,738
U.S. Economic Update and Outlook. Laurel Graefe, REIN Director Federal Reserve Bank of Atlanta October 2, 2013
 1 U.S. Economic Update and Outlook Laurel Graefe, REIN Director Federal Reserve Bank of Atlanta October 2, 213 Following the deepest recession since the 193s, the economic recovery is well under way, though
READY TO START SAUDI 2017 BUDGET, LUNCHING TRANSFORMATION PHASE
 December 30, 2016 [ B U D G E T C O M M E N TA R Y - 2 0 1 7 A N D E C O N O M I C P E R F O R M A N C E 2 0 1 6 ] READY TO START SAUDI 2017 BUDGET, LUNCHING TRANSFORMATION PHASE» On the 22nd of December,
2,744. P/E Multiple (x) 2,698 2,652 2,607 2,561
 2,698 2,652 2,607 2,561") 3-Mar 5-Mar 7-Mar 11-Mar 13-Mar 17-Mar 19-Mar 21-Mar 25-Mar 27-Mar 31-Mar 2-Apr 3 April 219 Daman Morning Call GCC MarketWatch UAE Indices Last Close 1D 1D % YTD% 1M % 1Y % P/E Multiple (x) 2,744 5,153
3-Mar 5-Mar 7-Mar 11-Mar 13-Mar 17-Mar 19-Mar 21-Mar 25-Mar 27-Mar 31-Mar 2-Apr 3 April 219 Daman Morning Call GCC MarketWatch UAE Indices Last Close 1D 1D % YTD% 1M % 1Y % P/E Multiple (x) 2,744 5,153
Mauritius Economy Update January 2015
 January 19, 2015 Economics Mauritius Economy Update January 2015 Overview - Mauritian economy has been witnessing a persistent moderation in growth since 2010 due to weak economic activity in Euro Zone,
United Arab Emirates Outlook
 Report Series United Arab Emirates Outlook 2014-15 Executive Summary Economics Department Samba Financial Group P.O. Box 833, Riyadh 11241 Saudi Arabia ChiefEconomist@samba.com +44 207659-8200 (London)
Zenith Monthly Economic Report October 2011
 Zenith Monthly Economic Report October 211 ECONOMIC STATISTICS SUMMARY Cash Rate Inflation Rate (%) Unemployment Rate (%) GDP Annual Growth (%) Country Latest Last Change Latest Change Latest Change Past
Middle East and North Africa Regional Economic Outlook. November 12, 2013
 Middle East and North Africa Regional Economic Outlook November 12, 213 Outline Global Outlook MENAP: Recent Developments, Outlook, and Risks Oil Exporters Oil Importers Key Takeaways 2 Global Outlook
Review of the Economy. E.1 Global trends. January 2014
 Export performance was robust during the third quarter, partly on account of the sharp depreciation in the exchange rate of the rupee and partly on account of a modest recovery in major advanced economies.
GDP growth above trend, while inflation pressures remain muted
 NZ Economy - Overview 1 GDP growth above trend, while inflation pressures remain muted Leading indicators suggest a near-term annual GDP growth rate around a robust 3.-3.% YoY level Current supportive
Eurozone Economic Watch. July 2018
 Eurozone Economic Watch July 2018 Eurozone: A shift to more moderate growth with increased downward risks BBVA Research - Eurozone Economic Watch July 2018 / 2 Hard data improved in May but failed to recover
Global Markets Weekly Report 17 th December Ehsan Khoman Head of MENA Research and Strategy
 Global Markets Weekly Report 17 th December 218 Ehsan Khoman Head of MENA Research and Strategy ehsan.khoman@ae.mufg.jp 1 8 6 4 2-2 -6-8 -1 Global Bond Yields Global bond yields were mixed as first a risk-on
2,864. P/E Multiple (x) 2,830 2,795 2,761 2,727
 2,830 2,795 2,761 2,727") 29-Aug 2-Sep 4-Sep 6-Sep 1-Sep 12-Sep 17-Sep 19-Sep 23-Sep 25-Sep 27-Sep 1-Oct 2 October 218 Daman Morning Call GCC MarketWatch UAE Indices Last Close 1D 1D % YTD% 1M % 1Y % P/E Multiple (x) 2,864 5,18
29-Aug 2-Sep 4-Sep 6-Sep 1-Sep 12-Sep 17-Sep 19-Sep 23-Sep 25-Sep 27-Sep 1-Oct 2 October 218 Daman Morning Call GCC MarketWatch UAE Indices Last Close 1D 1D % YTD% 1M % 1Y % P/E Multiple (x) 2,864 5,18
Introduction to MOROCCO
 Introduction to MOROCCO With a GDP of USD 101bn in 2015, Morocco is a medium-sized economy. Sound macroeconomic fundamentals, a resilient and sophisticated banking sector and the implementation of structural
2,697. P/E Multiple (x) 2,663 2,629 2,595 2,561
 2,663 2,629 2,595 2,561") 2-Feb 24-Feb 26-Feb 28-Feb 4-Mar 6-Mar 1-Mar 12-Mar 14-Mar 18-Mar 2-Mar 24-Mar 25 March 219 Daman Morning Call GCC MarketWatch UAE Indices Last Close 1D 1D % YTD% 1M % 1Y % P/E Multiple (x) 2,697 5,178
2-Feb 24-Feb 26-Feb 28-Feb 4-Mar 6-Mar 1-Mar 12-Mar 14-Mar 18-Mar 2-Mar 24-Mar 25 March 219 Daman Morning Call GCC MarketWatch UAE Indices Last Close 1D 1D % YTD% 1M % 1Y % P/E Multiple (x) 2,697 5,178
Emerging Markets Weekly Economic Briefing
 Emerging Markets Weekly Economic Briefing The risks of renewed capital flight from emerging markets Recent episodes of capital flight from emerging markets have highlighted the vulnerability of a number
Global and MENA Economies
 This review contains extracts from APICORP s 2014 Review of Energy Investments in the Arab World, which forms part of the Corporation s extensive research and analysis of the Arab hydrocarbon and energy
2,947. P/E Multiple (x) 2,910 2,874 2,837 2,801
 2,910 2,874 2,837 2,801") 2-Jun 24-Jun 26-Jun 28-Jun 2-Jul 4-Jul 8-Jul 1-Jul 12-Jul 16-Jul 18-Jul 22-Jul 23 July 218 Daman Morning Call GCC MarketWatch UAE Indices Last Close 1D 1D % YTD% 1M % 1Y % P/E Multiple (x) 2,947 4,795
2-Jun 24-Jun 26-Jun 28-Jun 2-Jul 4-Jul 8-Jul 1-Jul 12-Jul 16-Jul 18-Jul 22-Jul 23 July 218 Daman Morning Call GCC MarketWatch UAE Indices Last Close 1D 1D % YTD% 1M % 1Y % P/E Multiple (x) 2,947 4,795
Global Data Watch May 14 May 2018
 Economic Research The Week Ahead: Busy data week, further rate cut by Central Bank of Egypt Global: US retail sales and Japan 1Q GDP data Fed vice chair nominee Richard Clarida and Fed governor nominee
MONTHLY REPORT D A N A R E K S A R E S E A R C H I N S T I T U T E. October October Outlook: Moderating Trade
 MONTHLY REPORT D A N A R E K S A R E S E A R C H I N S T I T U T E /132/to/217 October 217 TRADE OUTLOOK October Outlook: Moderating Trade Indonesia posted its largest trade surplus for the year in August,
World Economic Situation and Prospects asdf
 World Economic Situation and Prospects 2019 asdf United Nations New York, 2019 Western Asia 148 World Economic Situation and Prospects 2019 GDP Growth 4.0% 3.1 2.5 total 3.4 3.0 2.4 1.7 2.0% 1.1 1.1 0.6
ECONOMY REPORT - CHINESE TAIPEI
 ECONOMY REPORT - CHINESE TAIPEI (Extracted from 2001 Economic Outlook) REAL GROSS DOMESTIC PRODUCT The Chinese Taipei economy grew strongly during the first three quarters of 2000, thanks largely to robust
Economic Outlook Economic Intelligence Center 27 th November 2015
 Economic Outlook 2016 Economic Intelligence Center 27 th November 2015 Global outlook Domestic outlook 2 In 2016, recovery pace in most regions are expected to pick up except for China Eurozone 2.0 1.5
2,584. P/E Multiple (x) 2,556 2,528 2,500 2,472
 2,556 2,528 2,500 2,472") 17-Jan 21-Jan 23-Jan 27-Jan 29-Jan 31-Jan 4-Feb 6-Feb 1-Feb 12-Feb 14-Feb 18-Feb 19 February 219 Daman Morning Call GCC MarketWatch UAE Indices Last Close 1D 1D % YTD% 1M % 1Y % P/E Multiple (x) 2,584
17-Jan 21-Jan 23-Jan 27-Jan 29-Jan 31-Jan 4-Feb 6-Feb 1-Feb 12-Feb 14-Feb 18-Feb 19 February 219 Daman Morning Call GCC MarketWatch UAE Indices Last Close 1D 1D % YTD% 1M % 1Y % P/E Multiple (x) 2,584
Economic Projections For 2014 And 2015
 Economic Projections For 2014 And 2015 Article published in the Quarterly Review 2014:3, pp. 77-81 7. ECONOMIC PROJECTIONS FOR 2014 AND 2015 Outlook for the Maltese economy 1 The Bank s latest macroeconomic
> Macro Investment Outlook
 > Macro Investment Outlook Dr Shane Oliver Head of Investment Strategy and Chief Economist October 214 The challenge for investors how to find better yield and returns as bank deposit rates stay low 9
The Thai economy is viewed to moderate from last assessment from the intensified impact of the euro area s crisis on merchandise exports, which, in
 1 I. Economic and inflation outlook II. Monetary policy stances going forward 2 I. Economic and inflation outlook II. Monetary policy stances going forward 3 The Thai economy is viewed to moderate from
3,486. P/E Multiple (x) 3,428 3,370 3,312 3,254
 3,428 3,370 3,312 3,254") 25-Jan 29-Jan 31-Jan 4-Feb 6-Feb 8-Feb 12-Feb 14-Feb 18-Feb 2-Feb 22-Feb 26-Feb 27 February 218 Daman Morning Call GCC MarketWatch UAE Indices Abu Dhabi Securities Market General Last Close 1D 1D % YTD%
25-Jan 29-Jan 31-Jan 4-Feb 6-Feb 8-Feb 12-Feb 14-Feb 18-Feb 2-Feb 22-Feb 26-Feb 27 February 218 Daman Morning Call GCC MarketWatch UAE Indices Abu Dhabi Securities Market General Last Close 1D 1D % YTD%
15. Appendix 8 VAT return format
 15. Appendix 8 VAT return format Value Added Tax Return Main Form Type Document Locator Tax Form Filing Type Submission Date Taxable Person details TRN Taxable Person Name (English) Taxable Person Name
2,864. P/E Multiple (x) 2,823 2,782 2,741 2,699
 2,823 2,782 2,741 2,699") 25-Sep 27-Sep 1-Oct 3-Oct 7-Oct 9-Oct 11-Oct 15-Oct 17-Oct 21-Oct 23-Oct 25-Oct 28 October 218 Daman Morning Call GCC MarketWatch UAE Indices Last Close 1D 1D % YTD% 1M % 1Y % P/E Multiple (x) 2,864 5,46
25-Sep 27-Sep 1-Oct 3-Oct 7-Oct 9-Oct 11-Oct 15-Oct 17-Oct 21-Oct 23-Oct 25-Oct 28 October 218 Daman Morning Call GCC MarketWatch UAE Indices Last Close 1D 1D % YTD% 1M % 1Y % P/E Multiple (x) 2,864 5,46
NIESR MONTHLY GDP TRACKER: July 2018
 Press Release NIESR MONTHLY GDP TRACKER: July 2018 GDP Tracker indicates growth of 0.4 per cent in 2018 Q2 and 0.5 per cent in 2018 Q3 Figure 1: UK GDP growth (3 months on previous 3 months, per cent)
Commercial Cards & Payments Leo Abruzzese October 2015 New York
 US, China and emerging markets: What s next for the global economy? Commercial Cards & Payments Leo Abruzzese October 2015 New York Overview Key points for 2015-16 Global economy struggling to gain traction
For personal use only
 AMYF SERIES QUARTERLY UPDATE 1 OCTOBER 2016 31 DECEMBER 2016 SUMMARY AUSTRALIAN MASTERS YIELD FUND SERIES (AMYF SERIES) HIGHLIGHTS AMYF Series announced the following quarterly dividends and capital returns:
Market Update. 14 May 2015 BANK MUSCAT ASSET MANAGEMENT
 Market Update 14 May 2015 BANK MUSCAT ASSET MANAGEMENT GCC Equity Markets Most of the regional markets have witnessed negative performance so far this month, except Qatar, Oman, and Bahrain up 2.9%, 0.6%,
Weekly Economic Update
 Weekly Economic Update Sunday, 13 May 2012 1 Jan-11 Mar-11 May-11 Jul-11 Sep-11 Nov-11 Jan-12 Mar-12 % US$ Bn Weekly Economic Update Jan-11 Mar-11 May-11 Jul-11 Sep-11 Nov-11 Jan-12 Mar-12 Sunday, 13 May
Finland falling further behind euro area growth
 BANK OF FINLAND FORECAST Finland falling further behind euro area growth 30 JUN 2015 2:00 PM BANK OF FINLAND BULLETIN 3/2015 ECONOMIC OUTLOOK Economic growth in Finland has been slow for a prolonged period,
Lebanon Weekly Report
 ECONOMY World Bank forecasts Lebanon real GDP growth at 2% in 2015 and 2.5% in 2016 The World Bank said that Lebanon s economic activity continues to tick along at a modest pace despite the political dysfunctionality.
3,744 3,709 3,675 3,640 3,606. UAE equity markets closed higher yesterday, lifted by gains in real estate and financial sector stocks.
 7 February 217 Daman Morning Call 1.19% 11.84 UAE DFM Index 3691.34 43.43 1.19% 4.54%.2% 21.53% 12.34 65.4.27.41%.28%.52% 15.4% 15.18 13.89 1.35.1% 6.59% 7.53% 1.54% 9.34 671.73 14.81.22% 16.59% 13.66%
Economic Update 18 September 2016
 Economic Update September Macroeconomic outlook Kuwait: Non-oil growth resilient on investment, as fiscal measures reassure > Nemr Kanafani Senior Economist +, nemrkanafani@nbk.com Overview and outlook
Monthly Economic and Financial Developments April 2006
 Release Date: 30 May Monthly Economic and Financial Developments April In an effort to provide the public with more frequent information on its economic surveillance activities, the Central Bank has decided
Global Data Watch 28 August 1 September 28 August 2017
 Economic Research The Week Ahead: Key US data releases and 2Q India GDP in focus US: Labour, personal spending and PCE data releases The US will see a number of important releases at the end of this week.
Investment Strategy Note 24 Nov 2015
 India: muddling through a difficult environment India remains a long term positive story based on its economic and demographic potential despite disappointments in the recent pace of recovery. The global
Update: Opening the Tadawul up to Foreign Investors. Overview. CMA draft proposals. April 2015
 Update: Opening the Tadawul up to Foreign Investors Overview Last week the Capital Markets Authority (CMA) confirmed that the region s largest, diverse and most mature capital market, the Saudi Stock Exchange
GCC Economic Insight 2012 Qatar National Bank SAQ P.O. Box 1000 Doha, Qatar Tel: (+974) Fax: (+974) qnb.com.qa
 Fax: (+974) qnb.com.qa") Economic Insight 2012 Contents Charts 2 2012-13 Outlook Summary 3 1. Overview and Demographics 4 2. GDP 11 3. GDP by Sector 15 4. External Sector 23 5. Money and Prices 31 6. Public Finance 35 7. Banking
Economic Insight 2012 Contents Charts 2 2012-13 Outlook Summary 3 1. Overview and Demographics 4 2. GDP 11 3. GDP by Sector 15 4. External Sector 23 5. Money and Prices 31 6. Public Finance 35 7. Banking
Saudi Arabian Economy
 Saudi Arabian Economy Economic Research Research Department ARC ResearchTeam, Tel. +966 1 211 9370, devassyp@alrajhi-capital.com IMF hikes Saudi Arabia s 2018 growth forecast The IMF raised Saudi Arabia
Evolution of the Middle East Trading Ecosystem. May 2013
 Evolution of the Middle East Trading Ecosystem May 2013 Contents Changing Supply/Demand Dynamics Changes Drive Trading Ecosystem Oman: Key to Crude Oil Markets Conclusion Dubai Mercantile Exchange 2 DME