Proprietary Research. Monthly Insights. February 2019
|
|
|
- Josephine Long
- 5 years ago
- Views:
Transcription
1 Proprietary Research February 2019
2 Monthly Commentary With the turn of the calendar, equity markets are off to a roaring start. Troubles from the 4th quarter are a distant memory as U.S. stocks have recovered nearly all their losses. Even more, bonds have staged a nice rally over the last few months, adding incremental return to balanced portfolios. However, even though markets are ignoring the trouble spots, it doesn t mean they don t exist. In fact, the U.S. faces a few critical challenges in the coming months. First, March 1st was supposed to be the deadline for the U.S. and China trade negotiations. Latest reports suggest progress is being made and an extension to the deadline is on the horizon. If a deal is not consummated (or an extension allowed), the U.S. will impose 25% tariffs on $200 billion of Chinese imports. This escalation in trade tariffs will most certainly bring further retaliation from China, increasing risk to future economic growth. On the other side, a new trade deal could spur economic activity, at a time when growth is slowing. Second, even though we have a new deal on the government budget, the next political hurdle is waiting in the wings - hitting the national debt ceiling. Based on estimates, the government will hit that ceiling at the end of March. The Treasury Department will then have a few months worth of emergency measures (i.e. raiding other government accounts) until the U.S. government faces default. All signs point to this being a contentious battle and past debt ceiling debates were just the opening act. Hopefully politicians will find some common ground without creating too much agita along the way. Once again, there are a few changes to the Allegiant Economic Dashboard this month. First, the good news: the S&P 500 versus its 20-month moving average has improved from red to yellow. January s strong market returns pushed the index back up. However, we are not out of the woods yet, as even a small sell-off would send markets back below our critical level. One very positive aspect of the recent market rally is the wide breadth associated with the gains. A vast majority of stocks are participating in the gains, instead of narrower leadership from only a small group of strong performers. This is welcome news and provides some support for continued strength. Also making a positive move this month: the 10-year/3-month interest rate spread moved from yellow to green. The yield curve has widened out a bit as the Federal Reserve backed off tightening rhetoric. This is one of our most important indicators and still remains on close watch. Any hawkish move from the Fed could easily push this into the trouble zone. Finally, the year-over-year change in consumer confidence turned from green to yellow. While consumer confidence remains at historically high levels, the rate of change is an important indicator for future activity. The Investment Research Team at Allegiant anticipated a slowdown in this indicator for a while, and we re seeing it now. While it is not overly worrisome yet, any shock to confidence could send this indicator into the trouble zone. In many respects, investment returns in the first part of the year would stand as above average - for the whole year. While much of this is a timing issue (the S&P 500 bottomed on December 24th), it does not go without notice that it took much heavy lifting to get markets to these levels. Once again, the Investment Research Team at Allegiant is examining risk levels and identifying potential areas to reduce risk, where appropriate. Benjamin W. Jones, CFP, AIF CERTIFIED FINANCIAL PLANNER President, Chief Investment Officer, Principal


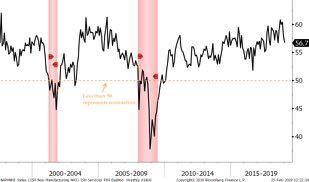
3 Job Openings ISM Service Leading Index Consumer Confidence Y-o-Y Change 10-Year/3-Month Treasury Spread S&P 500 & 20-Month Moving Average Positive Indicator Warning Indicator February 2019 Negative Indicator
4 Table of Contents Economy 6) U-3 & U-6 Unemployment 7) Labor Force Participation Rate 8) Long-Term & Short-Term Unemployment 9) Nonfarm Payrolls 10) Job Openings 11) Employment Statistics 12) Global GDP 13) U.S. Trade Statistics 14) U.S. Manufacturing PMI 15) Foreign Manufacturing PMI 16) U.S. Services PMI 17) Foreign Services PMI 18) Economic Activity 19) Housing Supply & Demand 20) Housing Prices 21) Household Finances 22) Consumer Default Rates 23) Consumer Spending & Saving 24) Consumer Confidence 25) Consumer Confidence Y-o-Y 26) Federal Government Finances 27) Yield Curve Spread Equities 29) Corporate Profits 30) S&P 500 & 20-month Moving Average 31) S&P 500 Earnings Yield & Baa Bond Yield 32) Corporate Finances 33) Global Earnings 34) Domestic Valuations 35) Foreign Valuations 36) Sector Valuations 37) Sector Valuations 38) Sector Valuations 39) Sector Valuations Fixed Income 41) Consumer Prices 42) Producer Prices 43) M2 Money Supply & Velocity 44) Global Central Bank Policy 45) 10-Year Treasury Yield 46) Global 10-Year Yields 47) I/G Corporate Bond Spreads 48) High Yield Spread 49) Muni/Treasury Ratio 50) State and Local Debt 51) Emerging Market Bond Spread 52) Mortgage Delinquency Rates Commodities 54) Energy 55) Industrial & Precious Metals 56) Agriculture 57) Foreign Exchange
5 Economy

6 U-6 & U-3 Unemployment Economy 6
7 U-3 Unemployment & Participation Rate Economy 7
8 Long-Term & Short-Term Unemployment Economy 8
9 Nonfarm Payrolls Economy 9
10 Job Openings Economy 10
11 Employment Statistics Wage Growth Employment Cost Index Average Weekly Hours Worked Total U.S. Productivity Economy 11

12 Global GDP Growth Economy 12

13 U.S. Current Account U.S. Trade Statistics Import/Export Growth Y-o-Y Import Prices ex-petroleum Import/Export Prices Economy 13
14 U.S. Manufacturing PMI Economy 14
15 Foreign Manufacturing PMI Euro Zone China Japan UK Economy 15
16 U.S. Services PMI Economy 16
17 Euro Zone Foreign Services PMI China Japan UK Economy 17
18 Light Vehicle Sales Economic Activity Durable Goods Orders Industrial Production Capacity Utilization Economy 18
19 Housing Supply & Demand Housing Starts & NAHB Index Existing & New Home Sales Housing Supply in Months Homeownership Rate Economy 19

20 Housing Prices Homebuyer Affordability Case-Shiller 20-City Home Price Index Economy 20


21 Household Debt Service Ratio Household Finances Household Net Worth Household Debt Y-o-Y Growth Household Net Worth Y-o-Y Growth Economy 21

22 Consumer Default Rates Economy 22
23 Consumer Spending & Saving Retail Sales Savings Rate Personal Income & Spending Energy Expenditures a % of PCE Economy 23
24 Consumer Confidence Economy 24
25 Consumer Confidence Y-o-Y Change Economy 25


26 Federal Government Finances Federal Budget Surplus/Deficit Federal Debt Average Maturity Total Public Debt to GDP Economy 26

27 10-year/3-month Treasury Spread Economy 27
28 Equities
29 U.S. Corporate Profits Equities 29
30 S&P 500 & 20-Month Moving Average Equities 30

31 S&P 500 Earnings Yield & Baa Bond Yield Equities 31
32 S&P 500 Debt/Equity Corporate Finances S&P 500 Operating Margin S&P 500 Current Assets/Total Assets S&P 500 Dividend Payout Ratio Equities 32

33 Global Earnings Equities 33
34 Domestic Valuations Equities 34
35 Foreign Valuations Equities 35
36 Health Care Sector Valuations Consumer Staples Utilities Equities 36
37 Consumer Discretionary Sector Valuations Technology Financials Equities 37
38 Energy Sector Valuations Materials Industrials Equities 38
39 MLP Sector Valuations REIT Equities 39
40 Fixed Income
41 Consumer Prices Fixed Income 41
42 Producer Prices Fixed Income 42
43 M2 Money Supply & Velocity Fixed Income 43
44 Global Central Bank Policy Fed Funds Rate European Reference Rate Bank of England Rate Japan Overnight Rate Fixed Income 44
45 10-year Treasury Yield Fixed Income 45

46 Global 10-year Government Bond Yields Fixed Income 46
47 Investment Grade Corporate Bond Spreads Fixed Income 47
48 High Yield Bond Spread Fixed Income 48
49 10-year AAA Muni/Treasury Ratio Fixed Income 49
50 State & Local Debt Y-o-Y Growth Fixed Income 50
51 Emerging Markets Bond Yield Spread Fixed Income 51
52 Mortgage Delinquency Rates Fixed Income 52
53 Commodities
54 WTI Crude Oil Energy Natural Gas Heating Oil Coal Commodities 54
55 Industrial & Precious Metals Gold Silver Copper Aluminum Commodities 55
56 Corn Agriculture Wheat Sugar Soy Beans Commodities 56
57 Dollar Index Foreign Exchange Euro/Dollar Dollar/Yen Pound/Dollar Commodities 57
58 Allegiant Private Advisors Wealth Management Martin Kossoff, CFP, AIF Principal Chairman Kristina Vorndran, CFP Paraplanner Melissa Walsh, CFA, CFP Wealth Advisor Carl Watkins, CFP, CDFA, AIF Principal Wealth Advisor Director Investment Management Paul Cantor, CFA, CFP, AIF Principal Chief Operating Officer Cameron Dees Research Assistant Benjamin Jones, CFP, AIF Principal President Chief Investment Officer Luke Nicholas, CFA, CFP Principal Portfolio Manager Client Services Maura Comerford Operations Specialist Kristina Eastmond Operations Manager Lynda Franklin Executive Assistant Helen Raymond Senior Operations Specialist Forward-looking statements are not guarantees of future performance and involve certain risks and uncertainties, which are difficult to predict. Past performance is no guarantee of future results. Indices are unmanaged and cannot be invested into directly. The Dow Jones Industrial Average is a price-weighted average of 30 actively traded blue-chip stocks. The S&P 500 Index is a broad-based measurement of changes in stock market conditions based on the average performance of 500 widely held common stocks. The Russell 3000 is a market capitalization weighted equity index encompassing the 3,000 largest U.S. stocks. The MSCI EAFE Index is a float-adjusted market capitalization index designed to measure developed market equity performance, excluding the U.S. and Canada. The Emerging Markets Index is a float-adjusted market capitalization index that consists of indices of 21 emerging economies. The CBOE Volatility Index is a key measure of market expectations of near-term volatility conveyed by S&P 500 stock index option prices. The Shanghai Composite Index is a stock market index of all stock (A shares and B shares) that are traded at the Shanghai Stock Exchange. The ISM Manufacturing Index is based on surveys of more than 300 manufacturing firms by the Institute of Supply Management. The Non-Manufacturing ISM Report on Business is a purchasing survey of the United States service economy, published by the Institute for Supply Management. Investments involve risk including possible loss of principal amount invested. Commodities investments may not be suitable for all investors, and there is no guarantee that any investment will be able to sell for a profit in the future. Advisory services offered through Commonwealth Financial Network, A Registered Investment Adviser.
59 Proprietary Research Visit AllegiantPA.com to Subscribe February 2019
Proprietary Research. Monthly Insights. December 2018
 Proprietary Research Monthly Insights December 2018 Monthly Commentary As the year draws to a close and we look back at 2018, it has turned into a very good year for the U.S. economy. Not only did overall
MAY 2018 Capital Markets Update
 MAY 2018 Market commentary U.S. ECONOMICS The U.S. added 223,000 jobs to payrolls in May, well above the consensus estimate of 180,000 and the expansion average of around 200,000. Sector job gains were
APRIL 18, 2019 Market Commentary by Scott J. Brown, Ph.D., Chief Economist
 APRIL 18, 2019 Market Commentary by Scott J. Brown, Ph.D., Chief Economist The economic data reports were mixed, but generally consistent with moderate growth in the near term. Retail sales rose 1.6% in
Index Return Monitor. January 11, 2017
 Index Return Monitor January 11, 2017 BRAD BROWN, CFA INVESTMENT STRATEGY GROUP See Legal Disclaimer and Important Disclosure Footnotes at the end of this report for disclosures, including potential conflicts
A recap of last week s top economic news and what s to come.
 AGF INVESTMENTS September 5, 2017 A recap of last week s top economic news and what s to come. WEEKLY MARKET REVIEW CANADA REPORTS STRONG GDP GROWTH Canada s economy closed out the second quarter growing
NOVEMBER 30, 2018 Market Commentary by Scott J. Brown, Ph.D., Chief Economist
 NOVEMBER 30, 2018 Market Commentary by Scott J. Brown, Ph.D., Chief Economist Fed Chairman Powell s comments to the Economic Club of New York were misinterpreted, but that s OK. Most likely, the stock
DECEMBER 2018 Capital Markets Update
 DECEMBER 2018 Market commentary U.S. ECONOMICS Nonfarm payrolls jumped by 312,000 in December, well above expectations for a 176,000 increase. The healthcare sector (+50,000) led job creation, while restaurants
DECEMBER 21, 2018 Market Commentary by Scott J. Brown, Ph.D., Chief Economist
 DECEMBER 21, 2018 Market Commentary by Scott J. Brown, Ph.D., Chief Economist Financial markets were expecting a dovish rate hike from the Fed an increase in short-term interest rates and an indication
A recap of last week s top economic news and what s to come.
 AGF INVESTMENTS September 11, 2017 A recap of last week s top economic news and what s to come. WEEKLY MARKET REVIEW BANK OF CANADA HIKES RATES ONCE AGAIN The Bank of Canada (BoC) held firm on its plans
SEPTEMBER 2018 Capital Markets Update
 SEPTEMBER 2018 Market commentary U.S. ECONOMICS Non-farm payrolls added 134,000 jobs in September, missing the consensus estimate of 185,000. However, net revisions to the two months prior totaled +87,000
DECEMBER 7, 2018 Market Commentary by Scott J. Brown, Ph.D., Chief Economist
 DECEMBER 7, 2018 Market Commentary by Scott J. Brown, Ph.D., Chief Economist Two key issues rattled stock market investors: trade policy and the yield curve. The weekend meeting between President Trump
JANUARY 4, 2019 Market Commentary by Scott J. Brown, Ph.D., Chief Economist
 JANUARY 4, 2019 Market Commentary by Scott J. Brown, Ph.D., Chief Economist Volatility remained elevated in the first few days of 2019, reflecting renewed concerns about China and the ongoing uncertainties
Economic and Financial Markets Monthly Review & Outlook Detailed Report January 2018
 Economic and Financial Markets Monthly Review & Outlook Detailed Report January 1 NOT FDIC INSURED NO BANK GUARANTEE MAY LOSE VALUE Overview of the Economy Business and economic confidence continue to
JANUARY 11, 2019 Market Commentary by Scott J. Brown, Ph.D., Chief Economist
 JANUARY 11, 2019 Market Commentary by Scott J. Brown, Ph.D., Chief Economist Fed Chairman Powell continued to signal that monetary policy will remain flexible and that muted inflation readings allow the
Market Outlook Considerations Week Beginning May 14, 2018
 Market Outlook Considerations Week Beginning May 14, 2018 DISCLAIMER-FOR-EDUCATIONAL-PURPOSES-ONLY Bobby Coats, Ph.D. Professor Economics Department of Agricultural Economics and Agribusiness University
OCTOBER 2018 Capital Markets Update
 OCTOBER 2018 Market commentary U.S. ECONOMICS U.S. real GDP grew at an annualized quarterly rate of 3.5% (3. YoY) in Q3, beating expectations of 3.4%. The economy was supported by the strongest consumer
WEEKLY MARKET FLASH DATA AS OF FEBRUARY 2, Index definitions available upon request. 1 of 5. Total Return (%)
") WEEKLY MARKET FLASH DATA AS OF FEBRUARY 2, 2018 U.S. Equity Index Level 1 Week MTD QTD YTD 1 Year Global Equity USD 1 Week MTD QTD YTD 1 Year S&P 500 2,762 (3.81) (2.16) 3.44 3.44 23.54 DJIA 25,521 (4.11)
WEEKLY MARKET FLASH DATA AS OF FEBRUARY 2, 2018 U.S. Equity Index Level 1 Week MTD QTD YTD 1 Year Global Equity USD 1 Week MTD QTD YTD 1 Year S&P 500 2,762 (3.81) (2.16) 3.44 3.44 23.54 DJIA 25,521 (4.11)
Market Outlook Considerations Week Beginning April 2, 2018
 Market Outlook Considerations Week Beginning April 2, 2018 DISCLAIMER-FOR-EDUCATIONAL-PURPOSES-ONLY Bobby Coats, Ph.D. Professor Economics Department of Agricultural Economics and Agribusiness University
Market Outlook Considerations Week Beginning March 26, 2018
 Market Outlook Considerations Week Beginning March 26, 2018 DISCLAIMER-FOR-EDUCATIONAL-PURPOSES-ONLY Bobby Coats, Ph.D. Professor Economics Department of Agricultural Economics and Agribusiness University
Appendix 1: Materials used by Mr. Kos
 Presentation Materials (PDF) Pages 192 to 203 of the Transcript Appendix 1: Materials used by Mr. Kos Page 1 Top panel Title: Current U.S. 3-Month Deposit Rates and Rates Implied by Traded Forward Rate
FEBRUARY 15, 2019 Market Commentary by Scott J. Brown, Ph.D., Chief Economist
 FEBRUARY 15, 2019 Market Commentary by Scott J. Brown, Ph.D., Chief Economist Negotiations on trade and the budget remained central, but the economic data also had some impact on the markets. Congress
Market Outlook Considerations Week Beginning April 30, 2018
 Market Outlook Considerations Week Beginning April 30, 2018 DISCLAIMER-FOR-EDUCATIONAL-PURPOSES-ONLY Bobby Coats, Ph.D. Professor Economics Department of Agricultural Economics and Agribusiness University
Market Outlook Considerations Week Beginning April 23, 2018
 Market Outlook Considerations Week Beginning April 23, 2018 DISCLAIMER-FOR-EDUCATIONAL-PURPOSES-ONLY Bobby Coats, Ph.D. Professor Economics Department of Agricultural Economics and Agribusiness University
Economic and Financial Markets Monthly Review & Outlook Detailed Report October 2017
 Economic and Financial Markets Monthly Review & Outlook Detailed Report October 17 NOT FDIC INSURED NO BANK GUARANTEE MAY LOSE VALUE Overview of the Economy Business and economic confidence indicators
Eric C. Elbell, CFA, CAIA Area Senior Vice President. Kyongdo Min, CPA, CFA Area Vice President. April 11, 2018
 Eric C. Elbell, CFA, CAIA Area Senior Vice President Kyongdo Min, CPA, CFA Area Vice President April 11, 2018 Agenda We will address three key topics: Headline events that impacted markets during the quarter
MARCH 2018 Capital Markets Update
 MARCH 2018 Market commentary ECONOMIC CLIMATE Hiring slowed from its fast pace last month the U.S. added 103,000 jobs to nonfarm payrolls in March, below the consensus estimate of 185,000. The U-3 unemployment
January Market Review Groundhog Day
 Larry Adam, CFA, CIMA CIO Americas & Chief Investment Strategist January Market Review Groundhog Day January 2016 Highlights of the Month: U.S. 4Q15 GDP Slows to Lowest YoY Growth Since 1Q14; ISM Manufacturing
November 2017 Monthly Commodity Market Overview Newsletter
 November 2017 Monthly Commodity Market Overview Newsletter By the ADMIS Research Team Stock Index Futures S&P 500, Dow Jones, NASDAQ and Russell 2000 futures registered new historical highs in November.
Chart 2: Long-term valuation metrics suggest US stocks to be highly valued.
 November 19th, 2018 1 This is provided for informational purposes only and should not be considered a recommendation to buy or sell a particular security. Past performance is no guarantee of future returns.
Fourth Quarter Market Outlook. Jason Bulinski, CFA Donald A. Powell, CFA Joseph Styrna, CFA
 Fourth Quarter 2018 Market Outlook Jason Bulinski, CFA Donald A. Powell, CFA Joseph Styrna, CFA Economic Outlook Growth: Strong 2018, But Expecting Slowdown in 2019 Growth & Jobs 2018 2017 2016 2015 2014
This chart shows the closes for the GBP; we are breaking out to new highs for this year and up over 5.5% since June 14.
 Daily Comment By Bill O Grady & Kaisa Stucke, CFA [Posted: June 23, 216 9:3 AM EDT] Global equity markets are higher this morning. The EuroStoxx 5 is trading higher by 1.9% from the last close. In Asia,
Five Forecasters: Few Warning Signs
 KEY TAKEAWAYS Five Forecasters: Few Warning Signs September 28, 2016 by Burt White of LPL Financial Our Five Forecasters are collectively sending mostly mid-cycle signals. The Leading Economic Index, yield
Impact of Potential Normalization of Interest Rates and Inflation on Global Sectors
 Impact of Potential Normalization of Interest Rates and Inflation on Global Sectors ANTONIO DOCAL, CFA Executive Vice President Portfolio Manager, Research Analyst Templeton Global Equity Group Templeton
June 2018 Monthly Commodity Market Overview Newsletter. Stock Index Futures. By the ADMIS Research Team
 June 2018 Monthly Commodity Market Overview Newsletter By the ADMIS Research Team Stock Index Futures Stock index futures performed well in spite of increased global trade tensions. In fact NASDAQ and
A Return to Normality: An Analysis of the Impact of Fed Tightening. September By: Luke Nicholas. Overview. The How, Not the When
 By: Luke Nicholas Overview In 2008 the U.S. economy was in dire condition, leading the Federal Reserve to implement unprecedented accommodative monetary policy. In an attempt to stimulate economic growth,
Market Watch. July Review Global economic outlook. Australia
 Market Watch Latest monthly commentary from the Investment Markets Research team at BT. Global economic outlook Australia Available data for the June quarter is consistent with a moderation in GDP growth
Chart 1: Market Cap to GDP (Buffett Indicator) - The US stock market is still highly valued despite the recent performance. 2
 - The US stock market is still highly valued despite the recent performance. 2") December 24th, 2018 1 Since our framework turned negative in October, we have suggested that being defensive was the proper posture. We continue to support that assertion given the current market environment.
December 24th, 2018 1 Since our framework turned negative in October, we have suggested that being defensive was the proper posture. We continue to support that assertion given the current market environment.
U.S. COMMERCIAL CRUDE OIL INVENTORIES. Sources: DOE, CIM
 Daily Comment By Bill O Grady & Kaisa Stucke, CFA [Posted: March 3, 2016 9:30 AM EST] Global equity markets are mixed this morning. The EuroStoxx 50 is trading lower by 0.6% from the last close. In Asia,
April Economic Report. Month ending April 30, McGladrey LLP. All Rights Reserved McGladrey LLP. All Rights Reserved.
 April Economic Report Month ending April 30, 2015 MARKET DASHBOARD Last Price Change % Chg. YTD % Last Price Change % Chg. YTD % S&P 500 2,108.29-19.85-0.94% 1.9% Russell Global EM 3,262.92-30.73-0.93%
Third Quarter Market Commentary
 7/12/2018 Volume 4, Issue 2 Third Quarter Market Commentary Overview: The Summer of Our Discontent Our last client correspondence took place earlier in the year after a shocking level of volatility rocked
Market Maps. Bob Dickey, Technical Strategist, Portfolio Advisory Group. April RBC Capital Markets, LLC / Portfolio Advisory Group
 Market Maps Bob Dickey, Technical Strategist, Portfolio Advisory Group RBC Capital Markets, LLC / Portfolio Advisory Group All values in U.S. dollars and priced as of March 29, 2018, unless otherwise noted
Market Outlook Considerations Week Beginning January 29, 2018
 Market Outlook Considerations Week Beginning January 29, 2018 DISCLAIMER-FOR-EDUCATIONAL-PURPOSES-ONLY Bobby Coats, Ph.D. Professor Economics Department of Agricultural Economics and Agribusiness University
U.S. wholesale prices eased in June as the cost of energy posted the biggest monthly drop in two years.
 18 JUL 2011 UNITED STATES Moody s Investors Service raised the pressure on U.S. lawmakers to increase the government s $14.3 trillion debt limit by placing the nation s credit rating under review for a
Market Outlook Considerations Week Beginning August 7, 2017
 Market Outlook Considerations Week Beginning August 7, 2017 DISCLAIMER-FOR-EDUCATIONAL-PURPOSES-ONLY Bobby Coats, Ph.D. Professor Economics Department of Agricultural Economics and Agribusiness University
MONTHLY MARKET MONITOR (M 3 ) December 2014
 December 2014") MONTHLY MARKET MONITOR (M 3 ) December 2014 January 5, 2014 THE LATEST MONTHLY MARKET RETURNS FROM THE RICHARDSON GMP TEAM GLOBAL MARKETS AT A GLANCE Americas Level 1mo 3mo 6mo 12mo YTD BRIC Level 1mo
MONTHLY MARKET MONITOR (M 3 ) December 2014 January 5, 2014 THE LATEST MONTHLY MARKET RETURNS FROM THE RICHARDSON GMP TEAM GLOBAL MARKETS AT A GLANCE Americas Level 1mo 3mo 6mo 12mo YTD BRIC Level 1mo
August 27, A recap of last week s top economic news and what s to come
 A recap of last week s top economic news and what s to come Fed Chairman stays the course U.S. Federal Reserve (Fed) Chairman Jerome Powell delivered a highly anticipated speech at the Jackson Hole symposium
Investment Perspectives. From the Global Investment Committee
 Investment Perspectives From the Global Investment Committee Introduction Domestic equities continued to race ahead during the fourth quarter of 2014 amid spikes in volatility, dramatic declines in oil
Market Month: April 2017
 Market Month: April 2017 The Markets (as of market close April 28, 2017) Equities continued their positive trend in April, spurred by favorable corporate earnings reports, proposed federal tax cuts, and
MACRO CHART BOOK Q2, 2016
 Adaptive Investing MACRO CHART BOOK Q2, 2016 Upside Participation Downside Management For Investment Advisors and Institutions Only Content Summary US Economy Market Snapshot Asset Class Performance Equity
MONTHLY MARKET MONITOR (M 3 ) December 2015
 December 2015") MONTHLY MARKET MONITOR (M 3 ) December 2015 January 4th, 2015 THE LATEST MONTHLY MARKET RETURNS FROM THE RICHARDSON GMP TEAM GLOBAL MARKETS AT A GLANCE Americas Level 1mo 3mo 6mo 12mo YTD BRIC Level 1mo
MONTHLY MARKET MONITOR (M 3 ) December 2015 January 4th, 2015 THE LATEST MONTHLY MARKET RETURNS FROM THE RICHARDSON GMP TEAM GLOBAL MARKETS AT A GLANCE Americas Level 1mo 3mo 6mo 12mo YTD BRIC Level 1mo
MONTHLY MARKET MONITOR (M 3 ) January 2016
 January 2016") MONTHLY MARKET MONITOR (M 3 ) January 2016 February 1st, 2016 THE LATEST MONTHLY MARKET RETURNS FROM THE RICHARDSON GMP TEAM GLOBAL MARKETS AT A GLANCE Americas Level 1mo 3mo 6mo 12mo YTD BRIC Level 1mo
MONTHLY MARKET MONITOR (M 3 ) January 2016 February 1st, 2016 THE LATEST MONTHLY MARKET RETURNS FROM THE RICHARDSON GMP TEAM GLOBAL MARKETS AT A GLANCE Americas Level 1mo 3mo 6mo 12mo YTD BRIC Level 1mo
Market Outlook Considerations Week Beginning November 13, 2017
 Market Outlook Considerations Week Beginning November 13, 2017 DISCLAIMER-FOR-EDUCATIONAL-PURPOSES-ONLY Bobby Coats, Ph.D. Professor Economics Department of Agricultural Economics and Agribusiness University
Table 1: Economic Growth Measures
 US Equities continued to advance in the second quarter, with the S&P 500 returning 5.2% for the quarter and 7.1% for the first half. Energy was by far the best performing sector in the quarter, returning
FIVE KEYS TO EMERGING MARKET OUTLOOK John Lynch Chief Investment Strategist, LPL Financial Jeffrey Buchbinder, CFA Equity Strategist, LPL Financial
 LPL RESEARCH WEEKLY MARKET COMMENTARY KEY TAKEAWAYS We favor emerging market and U.S. equities for tactical asset allocations based primarily on our outlooks for global economic growth and earnings. We
June 4, A recap of last week s top economic news and what s to come
 A recap of last week s top economic news and what s to come Canada responds with tariffs on U.S. goods Previously set exemptions on steel and aluminum tariffs against Canada, Mexico and the European Union
Asset Strategy Consultants. MARKET ENVIRONMENT Second Quarter 2016
 MARKET ENVIRONMENT Second Quarter 2016 Market Environment: U.S. Economy The 2nd quarter was reasonably uneventful and markets were relatively placid until June 23rd, when British voters narrowly approved
On Our Radar September 2015
 On Our Radar September 2015 The Dow Jones Industrial Average (DJIA), S&P 500 and NASDAQ Composite fell 6.56 percent, 6.25 percent, and 6.85 percent, respectively, in August, which was highlighted by a
Market Maps. Bob Dickey, Technical Strategist, Portfolio Advisory Group. December RBC Capital Markets, LLC / Portfolio Advisory Group
 Market Maps Bob Dickey, Technical Strategist, Portfolio Advisory Group RBC Capital Markets, LLC / Portfolio Advisory Group All values in U.S. dollars and priced as of market close, December 1, 2017, unless
Market Outlook Considerations Week Beginning November 27,2017
 Market Outlook Considerations Week Beginning November 27,2017 DISCLAIMER-FOR-EDUCATIONAL-PURPOSES-ONLY Bobby Coats, Ph.D. Professor Economics Department of Agricultural Economics and Agribusiness University
Economic and Capital Market Update November 2017
 Economic and Capital Market Update November 2017 Oct-69 Oct-73 Oct-77 Oct-81 Oct-85 Oct-89 Oct-93 Oct-97 Oct-01 Oct-05 Oct-09 Oct-13 Oct-17 November 30, 2017 Economic Perspective Economy Global economic
Summit Strategies Group 8182 Maryland Avenue, 6th Floor St. Louis, Missouri Monthly Economic & Capital Market Update
 Summit Strategies Group 8182 Maryland Avenue, 6th Floor St. Louis, Missouri 63105 314.727.7211 Monthly Economic & Capital Market Update July 2015 Yield to Maturity Monthly Change Jul-63 Jul-67 Jul-71 Jul-75
JANUARY 25, 2019 Market Commentary by Scott J. Brown, Ph.D., Chief Economist
 JANUARY 25, 2019 Market Commentary by Scott J. Brown, Ph.D., Chief Economist Investor sentiment continued to bounce between fear and hope. The week began with continued concerns about the global economy
Global Markets Update QNB Economics 01 October 2017
 Global Markets Update QNB Economics 01 October 2017 Executive Summary Key Takeaways US yields continued to rise on prospects of a third rate hike this year as well renewed optimism around potential tax
February 2018 Monthly Commodity Market Overview Newsletter. Stock Index Futures
 February 2018 Monthly Commodity Market Overview Newsletter By the ADMIS Research Team Stock Index Futures There was a severe decline in the first week of February with S&P 500 futures posting the biggest
Capital Market Outlook Q4 2017
 It amazes me how people are often more willing to act based on little or no data than to use data that is a challenge to assemble. - Robert Shiller Summary Capital Market Outlook Q4 207 The Yale Nobel
Current Yield Curves. High-Grade Municipal Bonds 5.00% 5.00% 0.00% % 4.00% 2.00%
 FCI ADVISORS YIELD ANALYSIS December 4, 2018 U.S. Treasury Treasury Yields Yields Municipal Muni Bond Yields Yields 1 U.S. Agency Agency Yields Yields - Active Bonds Coupon Maturity YTM Maturity YTM Tax-Equiv.
Quarterly Market Review: January - March 2018 The Markets (as of market close March 29, 2018)
") Quarterly Market Review: January - March 2018 The Markets (as of market close March 29, 2018) The first quarter of 2018 began as the fourth quarter of 2017 ended: with strong market gains. The Nasdaq led
Quarterly Market Review: January - March 2018 The Markets (as of market close March 29, 2018) The first quarter of 2018 began as the fourth quarter of 2017 ended: with strong market gains. The Nasdaq led
Market Commentary for Q2 2018
 Market Commentary for Q2 2018 Our Commitment to You: Periodically, it is helpful to the people we service, our clients, to re-affirm who we are at Crew Capital Mgmt. We don t just manage money. We help
Annual Market Review 2016
 Annual Market Review 2016 Overview The year 2016 likely will be remembered for the election of Donald Trump as the 45th president of the United States and the Brexit vote. This year also saw the Fed raise
JANUARY 18, 2019 Market Commentary by Scott J. Brown, Ph.D., Chief Economist
 JANUARY 18, 2019 Market Commentary by Scott J. Brown, Ph.D., Chief Economist Fear and hope. Market participants remained concerned about the partial government shutdown, which has a larger and broader
DECEMBER 14, 2018 Market Commentary by Scott J. Brown, Ph.D., Chief Economist
 DECEMBER 14, 2018 Market Commentary by Scott J. Brown, Ph.D., Chief Economist There was plenty of economic data, but investors remained focused on trade policy and Brexit uncertainty. Intraday volatility
Market Maps. Bob Dickey, Technical Strategist, Portfolio Advisory Group. January RBC Capital Markets, LLC / Portfolio Advisory Group
 Market Maps Bob Dickey, Technical Strategist, Portfolio Advisory Group RBC Capital Markets, LLC / Portfolio Advisory Group All values in U.S. dollars and priced as of December 31, 2018, unless otherwise
Chart 1: S&P 500 Death Crosses since 1923;
 December 10th, 2018 1 Last week we had a death cross in the S&P 500 and the 3 year minus 5 year Treasury yield curve went negative (inverted). These two events had talking heads claiming everything from
Brexit and Market Implications Special Commentary & Webinar
 Brexit and Market Implications Special Commentary & Webinar June 27, 2016 SR# 904360 Today s Speakers Envestnet PMC Zachary Karabell Head of Global Strategy, Envestnet As Head of Global Strategy, Mr. Karabell
Recessions are Unavoidable. WEEKLY GUIDANCE ON ECONOMIC AND GEOPOLITICAL EVENTS December 19, 2017 Recession Indicators Agree the Expansion Continues
 Austin Pickle, CFA Investment Strategy Analyst WEEKLY GUIDANCE ON ECONOMIC AND GEOPOLITICAL EVENTS December 19, 2017 Recession Indicators Agree the Expansion Continues Key Takeaways» There are several
WILSHIRE MUTUAL FUNDS
 WILSHIRE MUTUAL FUNDS SEMI-ANNUAL REPORT (Unaudited) LARGE COMPANY GROWTH PORTFOLIO LARGE COMPANY VALUE PORTFOLIO SMALL COMPANY GROWTH PORTFOLIO SMALL COMPANY VALUE PORTFOLIO WILSHIRE 5000 INDEX SM FUND
Axioma Research Paper No. 051
 Axioma Research Paper No. 051 April 30, 2014 Axioma s Macroeconomic Model: Insights into equity portfolios from a new perspective Melissa Brown, CFA Senior Director, Applied Research Axioma s recently
26, :30 AM EDT]
![26, :30 AM EDT]](/thumbs/86/94134947.jpg "26, :30 AM EDT]") Daily Comment By Bill O Grady & Kaisa Stucke, CFA [Posted: July 26, 2016 9:30 AM EDT] Global equity markets are mixed this morning. The EuroStoxx 50 is trading sideways from the last close. In Asia, the
Daily Comment By Bill O Grady & Kaisa Stucke, CFA [Posted: July 26, 2016 9:30 AM EDT] Global equity markets are mixed this morning. The EuroStoxx 50 is trading sideways from the last close. In Asia, the
Chart of the Week: Global Inflation at Two-Year High
 February 27 March 3, 2017 Recap The Trump Rally Extends to Sixth Week March 6, 2017 - U.S. stocks posted modest gains on Friday, resulting in a sixth weekly advance. The bulk of equity gains came on Wednesday,
Market Month: August 2017
 Market Month: August 2017 The Markets (as of market close August 31, 2017) Equities in August saw many peaks and valleys throughout the month, finally rallying at the end of the month. Strong second-quarter
November 27, A recap of last week s top economic news and what s to come
 A recap of last week s top economic news and what s to come Canadian retail sales disappoint Canadian retail sales disappointed in September. Retail sales rose 0.1% in September, after dropping 0.1% in
Market Pullback A Q&A with our Investment Team
 Market Pullback A Q&A with our Investment Team The Morningstar Investment Management group August 2015 Last week, stock markets fell globally in the toughest week of 2015 to date. Investors weighed concerns
Fourth Quarter Market Outlook. Kim Huebner, CFA Don Powell, CFA Joseph Styrna, CFA
 Fourth Quarter 2017 Market Outlook Kim Huebner, CFA Don Powell, CFA Joseph Styrna, CFA Economic Outlook Growth Increasing, Spending Modest, Low Unemployment 2017 2016 2015 2014 2013 2012 2011 GDP* Q3:
US Economic Outlook Improving
 Government Bonds Have Never Looked Less Attractive OUTLOOK Executive Summary Kenneth J. Taubes Chief Investment Officer, US Economic Outlook US GDP growth may lead growth among developed nations, at approximately
Q2 Quarterly Market Review Second Quarter 2015
 Q2 Quarterly Market Review Second Quarter 2015 Quarterly Market Review Second Quarter 2015 This report features world capital market performance and a timeline of events for the past quarter. It begins
17, :30 AM EDT]
![17, :30 AM EDT]](/thumbs/95/125044875.jpg "17, :30 AM EDT]") Daily Comment By Bill O Grady & Kaisa Stucke, CFA [Posted: August 17, 2016 9:30 AM EDT] Global equity markets are mixed this morning. The EuroStoxx 50 is trading down 0.8% from the last close. In Asia,
Daily Comment By Bill O Grady & Kaisa Stucke, CFA [Posted: August 17, 2016 9:30 AM EDT] Global equity markets are mixed this morning. The EuroStoxx 50 is trading down 0.8% from the last close. In Asia,
RAYMOND JAMES RAYMOND JAMES. -Technical Chart Book -
 Technical Strategy Team - Technical Chart Book RAYMOND JAMES -Technical Chart Book - Providing Investors with timely data and technical observations on a broad spectrum of asset classes. Portfolio & Technical
Risk assets are coming under pressure this morning as equities struggle. Here is what we are watching today:
 Daily Comment By Bill O Grady and Thomas Wash Looking for something to read? See our Reading List; these books, separated by category, are ones we find interesting and insightful. We will be adding to
WEEKLY CHANGES AGAINST THE USD MACRO & MARKETS COMMENTARY
 July 03, 2017 [ W E E K LY E C O N O M I C C O M M E N TA R Y ] WEEKLY ANALYSIS FOR THE MOST CRITICAL ECONOMIC AND FINANCIAL DEVELOPMENTS MACRO & MARKETS COMMENTARY» Central banker s comments dominated
Quarterly Market Review: July-September 2018 The Markets (as of market close September 28, 2018)
") Quarterly Market Review: July-September 2018 The Markets (as of market close September 28, 2018) The third quarter proved to be very strong for domestic stocks. July saw the major benchmark indexes listed
Quarterly Market Review: July-September 2018 The Markets (as of market close September 28, 2018) The third quarter proved to be very strong for domestic stocks. July saw the major benchmark indexes listed
Economic & Financial Market Outlook. James W. Paulsen, Ph.D. - Wednesday
 Economic & Financial Market Outlook James W. Paulsen, Ph.D. - Wednesday U.S. faces supply-side economic challenges!!! Annualized U.S. working age population growth by economic recovery Annualized U.S.
21, :30 AM EDT]
![21, :30 AM EDT]](/thumbs/88/116861477.jpg "21, :30 AM EDT]") Daily Comment By Bill O Grady & Kaisa Stucke, CFA [Posted: April 21, 216 9:3 AM EDT] Global equity markets are mixed this morning. The EuroStoxx 5 is trading down.2% from the last close. In Asia, the MSCI
Daily Comment By Bill O Grady & Kaisa Stucke, CFA [Posted: April 21, 216 9:3 AM EDT] Global equity markets are mixed this morning. The EuroStoxx 5 is trading down.2% from the last close. In Asia, the MSCI
Economic and Portfolio Outlook 4th Quarter 2014 (Released October 2014)
") Economic and Portfolio Outlook 4th Quarter 2014 (Released October 2014) Our economic outlook for the fourth quarter of 2014 for the U.S. is continued slow growth. We stated in our 3 rd quarter Economic
Economic and Portfolio Outlook 4th Quarter 2014 (Released October 2014) Our economic outlook for the fourth quarter of 2014 for the U.S. is continued slow growth. We stated in our 3 rd quarter Economic
Larbi Moumni, CFA October 19, 2018
 Jan-13 Jul-13 Jan-14 Jul-14 Jan-15 Jul-15 Jan-16 Jul-16 Jan-17 Jul-17 Jan-18 Jul-18 Weekly Trends Larbi Moumni, CFA October 19, 2018 Chart Pack This week we look at a series of charts to help us take the
2015 Market Review & Outlook. January 29, 2015
 2015 Market Review & Outlook January 29, 2015 Economic Outlook Jason O. Jackman, CFA President & Chief Investment Officer Percentage Interest Rates Unexpectedly Decline 4.5 10-Year Government Yield 4 3.5
ACG Market Review. Second Quarter Global Highlights: Economy Announced tariffs have so far failed to slow down economic activity
 ACG Market Review Second Quarter 2018 Global Highlights: Economy Announced tariffs have so far failed to slow down economic activity Equities U.S. equites turn positive for the year backed by strong corporate
January Economic Report. Month ending January 31, McGladrey LLP. All Rights Reserved McGladrey LLP. All Rights Reserved.
 January Economic Report Month ending January 31, 2015 MARKET DASHBOARD Last Price Change % Chg. YTD % Last Price Change % Chg. YTD % S&P 500 2,055.47 67.53 3.38% 0.2% Russell Global EM 3,051.86 55.85 1.86%
Diversification Pays While Low Inflation Stays
 Diversification Pays While Low Inflation Stays May 2, 2016 by Brad Tank of Neuberger Berman Neither rising rates nor rising defaults would spell the end of opportunistic, diversified fixed income. There
Provided to you by Lee McLain
 Provided to you by Lee McLain Lee McLain First Federal Bank of Kansas City 816.728.7700 lee.mclain@ffbkc.com NMLS:680316 Contents Weekly Review: week of October 22, 2018 Economic Calendar - week of October
Market Maps. Bob Dickey, Technical Strategist, Portfolio Advisory Group. March RBC Capital Markets, LLC / Portfolio Advisory Group
 Market Maps Bob Dickey, Technical Strategist, Portfolio Advisory Group RBC Capital Markets, LLC / Portfolio Advisory Group All values in U.S. dollars and priced as of February 28, 2019, unless otherwise