Key Figures for the Deufol Group
|
|
|
- Shanna Parker
- 5 years ago
- Views:
Transcription

1
2 Key Figures for the Deufol Group figures in million ± (%) Results of operations Revenue (total) Germany Rest of the World (.1) International revenue ratio (%) EBITDA (5.2) EBITA (9.7) EBIT (9.7) EBT (2.) (3.5) (3.) (14.6) (3.3) (1.2) (81.5) Income tax income (expenses) Income (loss) from continuing operations Income (loss) from discontinued operation Profit (loss) for the period of which noncontrolling interests of which shareholders of the parent company Earnings per share ( ) (97.).2.67 n/m (2.3) (.7) Balance sheet Noncurrent assets Current assets Balance sheet total Equity Equity ratio (%) Liabilities Net financial liabilities Cash flow / investments Cash flow from operating activities (76.8) Cash flow from investing activities (.4) (4.4) (91.7) Cash flow from financing activities (9.8) (13.5) (27.9) (1.6) 2,818 2, Investments in property, plant and equipment Employees Employees (average) Personnel costs
3 Packaging. Next Level.
4 Deufol OFFERS A UNIQUE RANGE OF SERVICES THAT ENCOMPASSES ALL ASPECTS OF THE PACKAGING PROCESS automated packag ing, promotional & display pack aging, export & industrial pack aging, data packaging And SUPPLEMENTARY services. AS A GLOB A L PREMIUM SERVICE PROVID ER WE DESIGN INTELLIGENT AND INNOVATIVE PACKAGING SOLUTIONS THAT ARE TAILORED TO ALL of our customers requirements.
5 We will package anything from the tiniest hearing aids to en tire industrial facilities in any style, from elegant to seawor thy. we see ourselves as a solu tion provider and deliver what ever our customers require, whether separate services or integrated solutions. this in cludes extensive pre- and postpackaging services as well as sourcing.
6 in export & industrial packag ing, our proprietary boxcad and vv (SHORT FOR GERMAN VER PACKUNG & VERSAND, OR PACK AGING & SHIPPING) software so lutions provide an appreciable level of efficiency and intelli gence. IN data packaging, WE HAVE STRATEGICALLY SUPPLEMENTED OUR automated packaging KNOW-HOW WITH HIGHLY EFFECTIVE data man agement services.
7 ON THREE CONTINENTS WE SUPPORT OUR CUSTOMERS THROUGH OUR EX TENSIVE RANGE OF SOLUTIONS AND SERVICES. In addition to the orig inal markets in Europe and the United States, our newest busi ness location IN CHINA repre sents a strategic move into the Asian market as well.
8 With our international net work, we can provide our ser vices irrespective of location, allowing our customers to ben efit from our extensive exper tise in the international arena as well as our ability to share knowledge across borders. WHEREVER YOU ARE, deufol IS THERE TOO.
9
10 Financial Calendar April Annual Financial Statements 211 May Interim Report I / 212 July Annual General Meeting August Semi-Annual Financial Report 212 November Interim Report III / 212 Key to Symbols Basis of Preparation Consolidated Cash Flow Statement Disclosures Scope of Consolidation Other Disclosures Consolidated Income Statement Disclosures Segment Information Consolidated Balance Sheet Disclosures Supplementary Disclosures
11 9 Table of Contents 11 To our Shareholders 12 Foreword by the Executive Board 16 Report of the Supervisory Board 2 The Share 23 Management Report 24 Business and Economic Environment 33 Corporate Governance 44 Results of Operations, Financial and Asset Position 55 Position of Deufol AG 57 Risk Report 62 Report on Dependence, Post-Balance-Sheet Date Events and Expected Developments Financial Statements Consolidated Income Statement Statement of Total Comprehensive Income Consolidated Balance Sheet Consolidated Cash Flow Statement Consolidated Statement of Changes in Equity Notes to THE Consolidated Financial Statements Scope of Consolidation Consolidated Income Statement Disclosures Consolidated Balance Sheet Disclosures Consolidated Cash Flow Statement Disclosures Other Disclosures Segment Information by Region and Service Supplementary Disclosures Auditors Report 74 General Information 127 Responsibility Statement by the Management 74 Basis of Preparation 129 FaCTS & Figures 13 Information on Deufol AG 13 Income Statement of Deufol AG 131 Balance Sheet of Deufol AG 132 Key Subsidiaries / Affiliates of Deufol AG 133 Glossary 134 Key Group Figures Five-Year Overview Operating Subsidiaries / Affiliates of Deufol AG Imprint U3 Image Brochure

12

13
14 12 To Our Shareholders Foreword by the Executive Board Foreword by the Executive Board Fiscal Year 211: The Beginnings of an Era of Renewal Dear shareholders and business partners, Deufol AG can look back on a challenging fiscal year 211 full of changes. In terms of public perception, the turnover of personnel at the level of the Company s management is certainly one of the most significant of these changes. This change was made due to the discovery of a breach of trust on the part of high-ranking executives who did not always act in the shareholders interests. However, new personnel have now been appointed to these management positions. Besides the new Executive Board, the Company s second management level features a strengthened team to continue along the path of an era of renewal which the Company embarked upon in the summer of 211. This process is well underway and remains intact. In many areas of the Company, changes have been initiated which broke with the old ways of doing things and called into question long-established processes, thus presenting every single employee with new experiences. This transformation represents an invaluable source of potential for our Company which we shall certainly draw upon. We are always mindful of our customers requirements and they have guided our process of change. We achieved an outstanding operating performance in the past year. Our goal is the continuous development and improvement of our premium services. While maintaining our high quality standards, we also intend to become even more rapid, efficient and economical in future. We have established Deufol as our new name through our renaming campaign. By integrating further operations under a single umbrella brand, we have taken another major step toward creating a uniform profile throughout the Group in 211. In particular, the integration of our industrial goods packaging locations in the overall Group while simultaneously strengthening our headquarters in Hofheim (Wallau) as a central management unit is an important measure within our comprehensive integration process. In 211, the Deufol Group realized a positive sales trend which was mainly driven by the German market, where sales rose by 7.7 %. In the Rest of Europe, we recorded slight growth of 2.2 %, while in the USA / Rest of the World sales decreased by 3.8 %, not least due to currency-related reasons. On the results side, in Germany Export & Industrial Packaging suffered due to rising wood prices and thus recorded lower results. In the USA, the volumes provided by battery packaging were lower, so that the expected results were not achieved. In the Rest of Europe, our Italian subsidiary and our Belgian companies exceeded expectations. In overall terms, the operating result from continuing operations was at 1.7 million lower than the revised figure for the previous year ( 11.9 million).

15 Foreword by the Executive Board To Our Shareholders 13 Dr. Tillmann Blaschke Dr. Tillmann Blaschke joined the Executive Board of Deufol AG in 211. He has a doctorate in economics and held the position of commercial director at the IT service provider PC-Ware Information Technologies AG, Leipzig, for three years. His previous positions included seven years in commercial management functions in the corporate group of the American chip manufacturer AMD Inc. At Deufol, Tillmann Blaschke is responsible for Finance, Human Resources Management, IT, Real Estate, Legal, Compliance and Communications. Detlef W. Hübner Detlef W. Hübner acquired Dönne + Hellwig GmbH from his grandfather in Following the company s stock market listing as D.Logistics AG in 1998, he developed it into the global premium service provider Deufol. Within the Group, he combines the advantages and values of a family company with his market expertise and industry knowledge and thus shapes its strategic focus. Detlef W. Hübner is also responsible for Operations, Business Development and Group Purchasing.
16 14 To Our Shareholders Foreword by the Executive Board Integration and Group-wide Transparency The integration of previously decentralized Group units is an important step along our path of renewal. While maintaining our on-site flexibility particularly in terms of cooperation with customers we are optimizing and standardizing our internal processes so as to realize a homogenous internal structure, on the basis of a Group-wide transfer of know-how, internationally and covering multiple business divisions. This requires a lasting change in our existing organizational structure which, not least, is facilitated by the reorganization of the Company s management level. The strengthening of our Company s headquarters in Hofheim (Wallau) as the key organizational unit in our Deufol Group which operates worldwide is a basic aspect of this integration. This involves the incorporation and bundling of local and regional administrative units. The decision to establish a strengthened central management system has provided for transparency and improved efficiency. The integration of several German locations personnel accounting and bookkeeping operations and the introduction of a uniform ERP system in Germany are important steps. This includes the strategic development of a central purchasing system as one of our responses to fluctuating prices, particularly for wood and additional materials. We have realized significant successes, especially through the optimized procurement process for our Export & Industrial Packaging locations. We have also initiated measures for the modernization and industrialization of our global manufacturing plants. They are a core element of our continuing operational optimization projects. We have also introduced far-reaching changes in the field of human resources. For the first time, managers receive a share of their remuneration which is based on performance and business success, subject to evaluation on the basis of predefined targets. This variable element motivates personnel and encourages improved performance while also ensuring a focus on the Company s strategic goals. International Success and Further Growth We are pursuing a clear growth strategy. Through the operation which we established last year in Charlotte, North Carolina, we are now also packaging export and industrial goods in the USA for the first time and will gradually develop this business division on the American market. We have also successfully continued with the development of our Data Packaging business in the USA and also intend to establish this promising service area in Europe. Through our strategic acquisition in Austria we have reinforced our presence in Central Europe and strengthened our bridge to the Eastern European market. After receiving our production license in China, in fiscal year 211 we generated our first sales in China, which will serve as a foundation for the gradual development of our Asian business. But in Germany, too, the success of our strategic business development is manifest. Through extensive tendering processes in the past year we once again convinced important customers such as VW and MAN of our quality, expertise and flexibility and established long-term relationships with them.
17 Foreword by the Executive Board To Our Shareholders 15 For continued national and international growth, we will continue with the targeted development of our existing business divisions, increased cooperation with our well-known clientele and the acquisition of new business partners. Operational Strength and an Outstanding Reputation In the midst of a comprehensive process of change and renewal we are supported by an awareness of the strengths which make us an international premium provider of packaging services. Our goal is our ongoing development and consolidation through a process of internal reorganization, so as to establish a high-performance and competitive market presence. Through our capacity for innovation we are continuously developing attractive new services which are tailored to our customers various requirements and we offer them comprehensive integrated solutions through our versatile range of services. Our goal is to be able to offer our customers every Deufol service at every location, and thus as an ideal business partner to contribute individually and optimally to the success of their projects and to support their strategy. Our customers appreciate our services and our operational strength. Companies which partner with Deufol know that they will receive reliable high-quality premium services. We are innovative, rapid and economical. An internalized service commitment and an outstanding level of delivery reliability are qualities which have made us a respected partner worldwide. We are successful and we are seeking to become even more successful, as an unequaled provider of packaging services. With this aim in mind, we will further improve our efficiency and productivity, bundle our overall administrative organization and continue to support and develop our employees strong commitment and operational expertise, leading to continuous national and international growth. We should like to thank our employees, our shareholders and our partners in particular for their support and confidence which has represented a significant factor in our Company s success. Especially in the context of our process of comprehensive internal change, we are extremely grateful for this confidence in our activities. In 212, we envisage the continuing strategic development of Deufol AG. This will entail considerable work, but we are ready for the challenge! Yours sincerely, Detlef W. Hübner Dr. Tillmann Blaschke
18 16 To Our Shareholders Report of the Supervisory Board Report of the Supervisory Board In the year under review, the Supervisory Board performed the duties assigned to it by law and the Articles of Association. It regularly advised the Executive Board on matters relating to the management of the Company, and monitored the management of the Company s business activities. The Supervisory Board was directly involved in all decisions of fundamental importance for the Company. This is based in particular on a detailed catalog of transactions requiring the prior approval of the Supervisory Board, which is contained in the by-laws for the Executive Board. This catalog is adjusted on an ongoing basis in accordance with the changing requirements. During the reporting period, the Executive Board informed the Supervisory Board, both verbally and in writing, of all relevant issues concerning the Company s position and material business transactions. The Supervisory Board receives a monthly report consisting of a current income statement for the Group and its three divisions as well as overviews of sales and operating results development at the individual subsidiaries together with target / actual comparisons and corresponding prior-period figures. The Supervisory Board regularly submits questions to the Executive Board on the basis of this data, which the Executive Board then answers accordingly. The Supervisory Board regularly and promptly receives the minutes of the Executive Board s meetings as well as up-to-date reports on trends not documented in special Executive Board minutes. There was frequently a comprehensive exchange of opinions between the Chairman of the Supervisory Board and the Executive Board on these issues. The Chairman informed the other members of the Supervisory Board about these discussions in detail. Meetings of the Supervisory Board The Supervisory Board discussed the reports of the Executive Board and other decision papers in a total of four meetings and also in frequent telephone conversations, and considered them in detail with the Executive Board. In five cases, resolutions were adopted outside meetings. These urgent decisions, that could not be delayed until a regular Supervisory Board meeting, were regularly preceded by an in-depth exchange of information by and / or telephone. With the exception of a single meeting, all Supervisory Board members attended all of its meetings, and none of its members thus attended less than half of them. Key Topics of Discussion In the period under review, in its discussions with the Executive Board the Supervisory Board focused on a detailed analysis of management structures, the earnings situation and the strategic orientation of Industrial Packaging and, as in the previous year, the operational consolidation and development of business in the USA. The Supervisory Board focused in particular on optimizing the Group s financing strategy and reporting. The organization of risk management, the internal control system and internal auditing were further key areas of deliberation. In addition, the Supervisory Board discussed improvement proposals with the Executive Board following a stocktaking process in the central areas of human resources management and IT.
19 Report of the Supervisory Board To Our Shareholders 17 Two meetings of the Supervisory Board focused on changes to the makeup of the Executive Board and an associated adjustment of the organizational chart. The Supervisory Board noted the economic planning for 211 at its meeting held on March 31, 211. Other Topics of Discussion The Supervisory Board also discussed and considered the initiation of various assessments in the Industrial Packaging sector which mainly related to general management issues. The declaration of conformity in accordance with section 161 of the German Stock Corporation Act was unanimously approved and submitted by the Executive Board and the Supervisory Board in February 211. Committees The Supervisory Board only consists of three members, so that it is not necessary to establish committees. Audit Pursuant to Section 17 (3) of the German Stock Corporation Act Since the Group has opted not to establish an audit committee, the members of the Supervisory Board are responsible for performing the checks laid down in section 17 (3) of the German Stock Corporation Act. The Supervisory Board already monitors the accounting process in its monthly reporting. The plausibility of the figures provided in income statements for the key business divisions is regularly verified and they are examined for possible discrepancies. Implausible data are promptly clarified with the Executive Board member with responsibility for Finance. In accordance with Deufol AG s holding structure, the discussions with the Executive Board and the auditors focus on the valuation of the financial assets, and the results of the annual impairment test in particular. The Group continued to develop its internal control system. This task is discharged by an internal compliance officer together with an external consultant. The Chairman of the Supervisory Board participated on a case-by-case basis in the preparatory discussions, while the project s current status was discussed at the Supervisory Board s meetings. In the key company areas / subsidiaries, a large number of control targets and possible controls were defined and are continuously subject to completeness and efficiency assessments. The internal auditing tasks were assigned to an external service provider which issues a regular interim report. The internal auditing is based on a large number of control matrixes which are completed by the affected organizational units. On their basis, auditing measures are implemented which are continuously revised and extended. The reports on the internal control and auditing systems are regularly submitted to the Supervisory Board, which incorporates them in its control function.
20 18 To Our Shareholders Report of the Supervisory Board Deufol AG has had a risk management system in place for some time now. The Supervisory Board was involved in the development of this system. The Supervisory Board regularly receives the quarterly risk assessments, and significant risks identified here are discussed at the Supervisory Board s meetings. The reports must be read in conjunction with the monthly reporting in order to understand their findings in the context of the current situation. Prior to the start of the audit, the auditor provided a statement confirming its independence. It does not provide any additional services. Audit of the Single-Entity and Consolidated Financial Statements In accordance with the resolution passed by the Annual General Meeting on June 29, 211 and the subsequent audit engagement issued by the Supervisory Board, the annual financial statements for the fiscal year from January 1 to December 31, 211 prepared by the Executive Board in accordance with the German Commercial Code, as well as the management report of Deufol AG, were audited by Warth & Klein Grant Thornton, Wirtschaftsprüfungsgesellschaft, Frankfurt am Main, and issued with an unqualified audit opinion. The consolidated financial statements of Deufol AG were prepared in accordance with the International Financial Reporting Standards as stipulated by section 315 a of the German Commercial Code. The auditors issued the consolidated financial statements and the Group management report with an unqualified audit opinion. All documents relating to the annual financial statements, including the management report and Group management report, the Executive Board s proposal for the appropriation of net profit and the audit reports issued by the auditors, were presented to the Supervisory Board. The Supervisory Board examined these documents and discussed them in the presence of the auditors. The Supervisory Board concurred with the results of the audit and, based on the results of its own examination, did not raise any objections. The Supervisory Board approved the annual financial statements of Deufol AG for 211 and the consolidated financial statements at its meeting held on April 17, 212. The annual financial statements were thereby adopted. The Supervisory Board also approved the Executive Board s proposal for the appropriation of net profit.
21 Report of the Supervisory Board To Our Shareholders 19 Report on Dependence The Executive Board has also compiled a report regarding the Company s relationships with associates and presented this to the Supervisory Board together with the audit report produced by the auditors. The auditors have issued the following audit opinion for the report: In accordance with our due audit and assessment, we confirm that 1. the factual information in the report is correct, 2. for the legal transactions stated in the report the Company s performance was not inappropriately high. Within the framework of its own audits of the report regarding the Company s relationship with associates, the Supervisory Board has determined that no objections are applicable and agrees with the auditors findings. Composition of the Executive Board and the Supervisory Board In the year under review, both committees underwent a series of changes. Dr. Tillmann Blaschke was appointed to serve on the Company s Executive Board with effect as of July 1, 211. In accordance with the resolution passed by the Supervisory Board on November 28, 211, Mr. Andreas Bargende left the Company with immediate effect. Mr. Tammo Fey resigned from the Executive Board upon expiry of his contract on December 31, 211. The Annual General Meeting appointed Prof. Dr. Wolfgang König to the Supervisory Board on June 29, 211 as a replacement for Prof. Dr. Kai Furmans who retired from the Supervisory Board. Mr. Georg Melzer resigned from the Supervisory Board on November 24, 211 at his own request. Mr. Wulf Matthias, whom the Annual General Meeting had appointed as a substitute member of the Supervisory Board on June 29, 211, became a regular member of the Supervisory Board with effect as of November 24, 211. The Supervisory Board would like to thank the management and all the employees of the Company for their commitment and dedication in fiscal year 211. Hofheim, April 17, 212 The Supervisory Board Helmut Olivier Chairman
22 2 To Our Shareholders The Share The Share Key information for the Deufol share Security code number International Securities Identification Number (ISIN) Stock exchange code Reuters Frankfurt Reuters Xetra Bloomberg Key figures for the share DE51155 LOI LOIG.F LOIG.DE LOI GY figures in Earnings per share from continuing operations.8.1 Earnings per share from discontinued operation (.7) (.3) Turbulent Share Year 211 The stock market year was influenced by a large number of external factors. Right at the start of the year, the Arab Spring caused turbulence on global stock markets. Even before the situation had entirely calmed, the serious earthquake in Japan and the subsequent accident at the Fukushima nuclear power station triggered further strong price losses on the stock markets. In the summer, the general public and investors increasingly focused on the sovereign debt crises in Europe and the USA. Prices on almost all of the major indexes fell strongly within brief periods of time, and the indexes were unable to make up for these losses by the end of the year. The US stock market was an exception, and leading equities here finished the year with a gain. The MSCI World Index fell almost 8 % in the past year. On the leading US stock exchange, quotations rose by more than 5 %, measured against the Dow Jones Index, while the NAS- DAQ technology exchange lost approx. 2 %. In Japan, prices fell by more than 17 %, relative to the Nikkei 225. European stock markets also lost considerable ground, and the EURO STOXX 5 was down by a good 17 %. In Germany, too, prices fell on a broad front in 211. Unlike in 21, blue chips and small chips recorded largely similar performances. The DAX fell 14.7 % and the SDAX dropped by 14.5 % over the course of the year. The CDAX, which maps the broad market, lost 14.8 %. Equity per share Equity ratio (%) Dividend n / a.3 Relative performance of the Deufol share indexed, as %, January 1 December 3, 211 Peak price Lowest price Closing price for the year Daily trading volume (Ø, units) 42,916 58,819 Number of shares 43,773,655 43,773,655 Market cap. ( million) Deufol AG CDAX Prime Logistics Jan Feb Mar Apr May Jun Jul Aug Sep Oct Nov Dec Highs and lows of the Deufol share figures in Price fluctuation in Monthly average Jan Feb Mar Apr May Jun Jul Aug Sep Oct Nov Dec Volume in million
23 The Share To Our Shareholders 21 Deufol Share Suffers Clear Loss of Value The Deufol share ended the year with a price loss of 35.9 %. Over the course of the year, it fluctuated in a corridor between.92 and It marked its highest closing price in early February at Following a subsequent temporary price dip, it regained this level in mid- April. This was followed by a downward movement which continued up to the end of the year, with fluctuations. The share reached its lowest closing price on December 19, at.93. The Deufol share closed the year at a price of.98. The sector index of logistics stocks (DAXsubsector Logistics) quoted in the Prime Standard which includes Deufol fell by 2. %. In Xetra and floor trading on German stock exchanges, approx. 11. million Deufol shares were traded in fiscal year 211 with a value of 15.4 million. This corresponds to an average daily trading volume of 42,916 shares. Subscribed Capital Unchanged The registered share capital remained constant in the past fiscal year and amounts to 43,773,665. It is divided up into the same number of no-par value shares made out to the bearer. The number of shares admitted to stock market trading remained constant as of December 31, 211 at 46,292,11 units. An amount of 2,, was available as Approved Capital as of December 31, 211 for the issuance of new shares in return for cash contributions or contributions in kind. This capital is available until June 15, 214. Deufol AG Financial Calendar Annual Financial Statements 211 April 2, 212 Interim Report I / 212 May 15, 212 Annual General Meeting July 4, 212 Semi-Annual Financial Report 212 August 14, 212 Interim Report III / 212 November 13, 212 Shareholder structure figures in % 52.9 % Detlef W. Hübner 47.1 % Other shareholders Shareholder Structure Executive Board Member Detlef W. Hübner has Majority Holding Deufol AG s ownership structure is crucially determined by the Company s founder and Executive Board member Detlef W. Hübner. The holdings attributed to him increased slightly in the past fiscal year to 52.9 % (previous year: 52.8 %). A further 5 % to 1 % of the shares are held by institutional investors while the remainder is divided up among approx. 22, private shareholders. Earnings per Share The earnings per share result from dividing the result due to the shareholders of Deufol AG by the weighted average number of shares in circulation. In fiscal year 211, on average 43,773,655 units (previous year: 43,773,655) were in circulation. The earnings per share from continuing operations on this basis were.77 (previous year:.95). Earnings per share from the discontinued operation amounted to.74 (previous year:.28).

24

25
26 24 Management Report Business and Economic Environment Organizational Structure and Business Fields Business and Economic Environment Organizational Structure and Business Fields Decentralized Structure of the Deufol Group In the 211 period under review, the Deufol Group had a decentralized organizational structure with Deufol AG as the ultimate holding company. In almost all cases, we have majority holdings in our investments. Please see the chapter Facts & Figures on page 136 for a summary of our operationally active investments and their corporate structure. As a management holding company, we do not have any client business ourselves and instead mainly perform management and control tasks. These include defining strategic business fields, appointments to management positions and control of the flow of capital within the Group. In addition, the holding company coordinates with risk management the implementation and development of our compliance program as an integral component of our management structure for all Group units. We manage and coordinate Group-wide projects such as Operational Excellence and Factory of the Future. In addition, in the past year we bundled local and regional administrative units in our headquarters as a main organizational unit, including major areas of the financial and personnel accounting operations of our German subsidiaries. The managing directors and site managers are responsible for on-site management of operational processes, with due consideration of regional specifics. Management is in the form of annual budget planning, individual target agreements and regular meetings. In addition, internal corporate governance guidelines specify consent requirements for specific types of transactions, e. g. investment schemes exceeding a specific volume. As a global premium service provider, in general we offer our services at all of our locations and benefit from extensive international experience. We have divided up our expertise into the following five service areas: Export & Industrial Packaging Automated Packaging Promotional & Display Packaging Data Packaging Supplementary Services Export & Industrial Packaging The Export & Industrial Packaging service group mainly comprises packaging activities for manufacturers in the mechanical and plant engineering sector. This includes computerbased construction of packaging, individual and serial crate production, export packaging logistics, sea freight, air freight and hazardous goods packaging, as well as the management of major industrial projects. Our proprietary IT solutions, our high-quality CAD crate design and our software support system for management of separate parts within the scope of the packaging process are key factors in our success. Within the framework of Export & Industrial Packaging, we also provide further industrial services such as disassembly services and spare parts warehousing. Automated Packaging and Promotional & Display Packaging Our Automated Packaging and Promotional & Display Packaging services comprise consumer goods packaging services. They include the entire spectrum from fully automated packaging of bulk commodities using high-tech machinery to manual stocking of exceptionally eye-catching
27 Business and Economic Environment Organizational Structure and Business Fields displays. We ensure the continuous development of our range of services as integrated services and provide support services for the packaging process such as labeling, repackaging, distribution logistics, and transport and document management. Data Packaging The Data Packaging service area comprises innovative packaging solutions, particularly for gift cards. Automated packaging of gift cards is supplemented with highly effective data management services and is offered with integrated, seamless data tracking. This area of competence also includes design and personalization of cards, specialty packs (enclosure of promotional articles) and multipacks of up to eight cards. Supplementary Services This comprises services such as warehouse planning and management, handling small volumes and samples, commissioning, contract logistics and value-added services. Business Development and Operational Responsibility Business Development comprises all activities associated with the development of our existing business operations globally and at all of our locations. Besides operational responsibility for ensuring the smooth handling of day-to-day business, the site managers are responsible for maintaining and developing local customer relationships as well as developing new ones. Each site manager works hand in hand with Business Development. Core Features of the Group The Deufol Group is a strong service partner for its customers, with finely-honed industry and methodological expertise. Its core features are as follows: Intelligent, flexible and innovative provider of solutions related to our core competence of packaging An international presence with a global orientation Sector-independent service provider with specific know-how, particularly for industrial goods packaging (mechanical and plant engineering, power station construction) and consumer goods (incl. automobile industry and consumer goods producers) Market leader in Germany for industrial export packaging Strong in-house IT expertise ensuring intelligent packaging and warehouse logistics Region-Oriented Segment Structure Notes 43, 44 Deufol AG was previously structured in line with the key services provided in its three business fields of Industrial Goods Packaging, Consumer Goods Packaging and Warehouse Logistics. The Deufol Group revised its segment reporting at the start of 211. Since this time, the segments of the Deufol Group have been based on the following geographical regions which are summarized for management purposes: Germany Rest of Europe USA / Rest of the World Management Report 25
28 26 Management Report Business and Economic Environment Locations of the Deufol Group Locations of the Deufol Group Globally Positioned with Locations in Nine Countries In connection with the business activities of the Deufol Group, the terms location and sales market are more or less synonymous. As a service provider, we mainly provide our services on a customer- and project-specific basis; as a rule, sales occur where the service is provided. In Germany, as of December 31, 211, we had 54 locations which account for a total of 55.1 % of Group sales. The Rest of Europe which accounts for around 27.6 % of business comprises 16 operational facilities in Belgium, France, Italy, Austria, the Slovak Republic and the Czech Republic. USA China Sales by region Assets by region Employees by region figures in million figures in million Deufol Group Germany 12.3 Germany 1,619 Germany 87.1 Rest of Europe 68.8 Rest of Europe 69 Rest of Europe 54.5 USA 35.2 USA 463 USA
29 Business and Economic Environment Locations of the Deufol Group In the USA / Rest of the World which contribute approx % of sales business is handled through our two locations in Charlotte and Sunman. Our location in Asia is situated in the eastern People s Republic of China, in Suzhou, in the vicinity of Shanghai. The Deufol Group s geographical presence is shown in the following diagram. Europe Number of locations Germany 54 Rest of Europe 16 USA / Rest of the World 3 Management Report 27
30 28 Management Report Business and Economic Environment Competition Environment Corporate Management, Goals and Strategy Competition Environment High Level of Customer Loyalty, Varying Levels of Competition The Deufol Group provides its services in a range of different competitive scenarios through its presence in various regions. In 211, Export & Industrial Packaging maintained its strong market position in Germany. This is a fragmented market, and as one of the key players Deufol is able to exploit economies of scale. The orientation of the Automated Packaging segment is mainly product-specific and in accordance with customer relationships. Due to the frequently strong level of integration with customers, this sector is only subject to limited competition. Competition is stronger in Promotional & Display Packaging due to the high volume of manual work. Multipack gift cards solutions a key Data Packaging service are provided on the basis of many years of know-how in Automated Packaging and strong IT expertise, which yields a competitive advantage over other providers. In this service area, we also gained important orders in the USA and Europe, enabling us to further strengthen our market position. For our Supplementary Services particularly warehouse logistics the intensity of competition varies since in-house outsourcing divisions are generally subject to a lower degree of competition due to their close relationship with customers. Where warehouse logistics is provided in so-called multi-user structures, i. e. multiple customers at a single warehouse, the Deufol Group does business in a highly competitive environment. Successful future performance here hinges on providing customer-specific additional services. Corporate Management, Goals and Strategy Internal Control System The Company s control instruments are intended to support the goal of a long-term increase in enterprise value and are oriented in accordance with profitable sales growth. Deufol AG controls its subsidiaries in accordance with their growth perspectives and individual income situations. For this purpose, in fiscal year 212 a performance-related remuneration system will be introduced for the first time at the level of site managers. This is based on a planning and budgeting process comprising both clear targets (topdown planning) and detailed planning for the individual units (bottom-up planning). The resulting targets are monitored by a monthly reporting system and deviations are rapidly analyzed. For the ongoing development of the Company s management, human resources were increased in the controlling division in the past fiscal year. Regular meetings between the Executive Board of Deufol AG and the management of the subsidiaries support this process and enable a prompt reaction in case of any discrepancies. Financial Goals Deufol s key financial goals are constant, profitable sales growth to be achieved both organically and through acquisitions. For the operating business segment, at Group level there is a medium-term EBITA margin (EBITA defined as the result for the period before taxes, financial income, financial expenses, shares of profits of companies accounted for using the at-equity method and amortization / impairment of goodwill) target of more than 5 % (211: 3.4 %).
31 Business and Economic Environment Corporate Management, Goals and Strategy Research and Development In the nonoperating segment, the aim is a further improvement in the financial result and optimization of tax expenditure. In terms of the level of debt, the goal is for the Deufol Group s equity ratio to exceed 4 % on a long-term basis (December 31, 211: 42.1 %). Operational Goals Our strategic orientation and our associated continuous evolution into a global packaging service provider have a central influence on the Company s operational development. Information technology and data management are increasingly significant here. A close relationship with our customers enables us to rapidly, efficiently and reliably implement these various tasks and processes. We are thus continuously developing our services in line with our customers requirements. Further optimization of our crate production system will be another core area of focus in the current fiscal year. We have increased human resources to handle these tasks. Both cross-border learning and knowledge sharing play an important role in the process of communicating to the overall Group the specific know-how of individual locations. Strategic Focus on Intelligent, Flexible and Innovative Services Deufol is a global premium service provider in the field of packaging and related services. Our services exceed the narrow scope of packaging. Besides executing projects, we offer our customers solutions which reinforce their strategies. These solutions are not tied to individual locations and undergo continuous development. Through this approach we grow together with our customers and expand beyond national borders. The latest examples are our location in China which we have established due to our rapid growth and a strong focus on the customer side and our newly established operation in Charlotte, North Carolina, where we are now packaging export and industrial goods in the USA for the first time. In the field of Data Packaging, we have significantly increased sales in the USA. In the past fiscal year, the Deufol Group extended this service area to include European customers for the first time. Research and Development No Conventional Research Expenditure A service provider such as the Deufol Group does not have any conventional R & D expenditure. Instead, we constantly develop new products and innovative services while preparing new projects or through close cooperation with our customers. Management Report 29
32 3 Management Report Business and Economic Environment Economic Outline Conditions Economic Outline Conditions Slower Global Economic Trend The global economic recovery faltered in 211. Following very strong growth of 5.1 % in 21, according to the Kiel Institute for the World Economy global output in the past year only increased by 3.8 %. The first half of the year recorded only moderate global gross domestic product growth. However, this was partly attributable to temporary factors. For instance, the strong rise in commodity prices had a negative impact and the earthquake in Japan had a noticeable effect on output, and not only in Japan. As these factors faded from the middle of the year onwards, prices of oil and other commodities fell significantly in some cases and production bottlenecks in Japan were rapidly overcome in the third quarter, global output once again realized very strong growth, at a substantial current annual rate of 4 %. Despite this, however, the economic trend generally remains negative. For example, this is borne out by the Kiel Institute s global economic activity indicator, which is based on sentiment indicators for 41 countries. This continued to point downward up to the end of the period and suggests only weak growth for the final quarter of the year. In the first half of the year, the economic downturn was particularly apparent in the advanced economies which only achieved weak growth in overall economic output. Here too, though, a particularly strong upward trend was evident in the third quarter. However, in the developing and emerging markets the pace of growth also fell considerably over the course of the year. This was due to a strongly declining export trend as well as weaker domestic economic impulses due to the winding-up of economic programs and a tightening of monetary policy. There was hardly any increase in industrial output in the emerging markets over the course of the year, and this even fell in Latin America. The slowdown was even more pronounced for exports: Global trade almost stagnated in overall terms in 211, which is mainly due to the fact that the developing and emerging markets failed to realize any further growth in trade, which had risen very rapidly since mid-29. Slight Slowdown in the Eurozone s Economy For 211 as a whole, according to Eurostat s estimates, GDP rose by 1.5 % in the Eurozone and by 1.6 % in the EU27, compared to % in both cases in 21. In 211, the Eurozone economy was strongly influenced by the worsening sovereign debt crisis and slowed significantly after getting off to a strong start. The domestic economy was paralyzed by an increasingly restrictive financial policy and the considerable uncertainty regarding the continuing European debt crisis. Germany and France saw stronger increases in their gross domestic product, while Spain s stagnated. In the past quarter, the uncertainty associated with the sovereign debt crisis noticeably dampened the economic performance of several core countries for the first time. Output fell in the Netherlands and Belgium. In the Eurozone excluding Germany, overall economic growth ground to a halt. The economic trend was dampened by government consumption and a declining investment trend. According to Eurostat, the average rate of inflation was 2.7 % (21: 1.6 %) in the Eurozone and 3.1 % (21: 2.1 %) in the EU27.
33 Business and Economic Environment Economic Outline Conditions Germany: Year-End Setback The upturn in the German economy suffered a minor setback at the end of 211. In the fourth quarter of 21, according to the German Federal Statistical Office the country s price-adjusted gross domestic product (GDP) was.2 % lower than the level in the previous quarter. In the first three quarters, growth rates of between.3 % and 1.3 % were achieved. Thus, in overall terms, German GDP in 211 grew by 3. % in price-adjusted terms relative to the previous year. This amounts to a slowdown in relation to the previous year, which recorded growth of 3.6 %. Growth impulses in 211 were mainly domestic in origin. In particular, consumer spending buoyed economic development: In price-adjusted terms, it realized its strongest growth in five years, at 1.4 %, and contributed 1.5 % to GDP growth. This trend was driven both by private consumer spending which rose by 1.5 % and by government consumption, which increased by 1.4 %. Gross fixed-capital investments an equally important pillar of the economy recorded a rise of 6.4 %, with plant and equipment investments increasing in particular (+ 7.6 %) while growth of construction investments was slightly weaker (+ 5.8 %). The current account balance i. e. the difference between exports and imports of goods and services also provided a significant contribution to growth. This was mainly due to significantly increased foreign demand combined with a disproportionately low rise in German industry s import propensity. In 211, German exports rose by 8.2 %, having grown by as much as 14.2 % in 21. At the same time, in price-adjusted terms, imports only rose by 7.4 % (previous year: 12.6 %). In 211, prices of all private consumer goods and services were on average 2.3 % higher than in the previous year. While only moderate levels of inflation were recorded in 21 and 29 (21: %, 29: +.4 %), 211 saw the strongest price rise on the previous year since 28. Management Report 31
34 32 Management Report Business and Economic Environment Overall Summary of Business Performance Overall Summary of Business Performance Deufol Group: Business Development in 211 Group figures 211 ± (%) Sales EBITA 1.7 (9.7) of 2.2 %, while in the USA / Rest of the World, sales decreased by 3.8 %, not least due to Net financial liabilities currency-related reasons. figures in million In 211, the Deufol Group realized a positive sales trend which was mainly driven by the German market, where sales rose by 7.7 %. In the Rest of Europe, we recorded slight growth On the results side, in Germany Export & Industrial Packaging suffered due to rising wood prices and thus recorded lower results. In the USA, the volumes provided by battery packaging were lower, so that the expected results were not achieved. In the Rest of Europe, our Italian subsidiary and our Belgian companies exceeded expectations. In overall terms, the operating result was at 1.7 million lower than in the previous year ( 11.9 million). In the organizational field, in 211 we made further progress toward creating a uniform profile throughout the Group. In particular, the integration of our industrial goods packaging locations in the overall Group while simultaneously strengthening our headquarters in Hofheim (Wallau) as a central management unit is an important measure within our comprehensive integration process. The integration of several German locations personnel accounting and bookkeeping operations and the introduction of a uniform ERP system in Germany are further important steps. This includes the strategic development of a central purchasing system as one of our responses to fluctuating prices, particularly for wood and additional materials. We reorganized our financing structures in Germany in late October. The Group has entered into a loan facility with a consortium of banks, with an initial volume of 45 million. This financing safeguards medium-term liquidity requirements and provides scope for growth for the Group. Revised Planning Targets Fulfilled Goal achievement 211 Sales EBITA Original planning Revised planning The operating result (EBITA) reached 1.7 million and thus fell within our revised plan ning corridor. The failure to realize our original planning targets was mainly due to increased figures in million Actual figures With an annual sales volume of 315 million we achieved our target and fell within our original corridor of 31 million to 325 million. material expenses due to higher purchasing prices for commodities, as well as lower volumes in our US packaging business. In the previous year, EBITA amounted to 11.9 million.
35 33 24 Business and Economic Environment 33 Corporate Governance 44 Results of Operations, Financial and Asset Position 55 Position of Deufol AG 57 Risk Report 62 Report on Dependence, Post-Balance-Sheet Date Events and Expected Developments
36 34 Management Report Corporate Governance Corporate Governance Statement Corporate Governance Corporate Governance Statement Responsible Corporate Management The term corporate governance stands for responsible corporate management and control that is geared towards long-term value creation. It primarily relates to the way in which the management bodies operate, cooperation between them, and monitoring of their actions. Key aspects of good corporate governance include respect for shareholder interests, efficient cooperation between the Executive Board and the Supervisory Board, ensuring that the interests of the Company are given priority in the case of conflicts of interest, and open and transparent corporate communication. Corporate governance forms an integral part of corporate management at Deufol, which is aimed at increasing enterprise value. The key provisions of the Code are documented in the Articles of Association and the by-laws of the Executive Board and the Supervisory Board, and are observed by the management when performing all business activities. Further information on the activities of the Supervisory Board and cooperation between the Executive Board and the Supervisory Board can also be found in the Report of the Supervisory Board starting on page 16. This section is followed by the report on the remuneration of the Executive Board and the Supervisory Board on page 38. Cooperation between the Executive Board and the Supervisory Board Deufol AG is a company incorporated under German law. A dual management system comprising an executive board and a supervisory board as separate organs each equipped with its own independent competences is a basic principle of German stock corporation law. The Executive Board and Supervisory Board of Deufol AG enjoy a close and trusting working relationship in their monitoring and control of the Company. The Executive Board of Deufol AG currently consists of two members. The by-laws specify the competences of the Executive Board. The areas of responsibility of the individual members of the Executive Board are defined in an organizational chart. The management structure of the Executive Board reflects the international orientation of the Company and its function as a management holding company. The members of the Executive Board are jointly responsible for managing the Company s business activities. The Executive Board determines the Group s business targets, fundamental strategic orientation, corporate policy and organizational structure. In particular, this includes the management of the Group and its financial resources, the development of its human resources strategy, appointments to management positions within the Group and the professional development of senior executives, as well as the presentation of the Group to the capital markets and the public as a whole. The Executive Board keeps the Supervisory Board promptly and comprehensively informed of planning, business trends and the Group s position. The Supervisory Board has three members. It monitors and advises the Executive Board in its management of the Company s business activities, and is responsible for business development, profit planning and further strategic development. It issues the audit engagement to the auditors and approves the single-entity and consolidated financial statements. It also appoints and dismisses the members of the Executive Board, working in conjunction with the latter to ensure long-term succession planning.
37 Corporate Governance Corporate Governance Statement Any transactions or measures resolved by the Executive Board that materially impact the asset ratios, financial ratios or results of operations of the Company require the prior approval of the Supervisory Board. These are listed in a catalog of transactions requiring approval, which is contained in the by-laws for the Executive Board of Deufol AG. In its report to the Annual General Meeting, the Supervisory Board describes any conflicts of interest and how they were treated. Material conflicts of interest relating to a member of the Supervisory Board that are not merely temporary should result in the termination of that person s membership of the Supervisory Board. In the year under review, there were no conflicts of interest relating to members of the Supervisory Board of Deufol AG. Makeup of the Supervisory Board The makeup of the Supervisory Board of Deufol AG generally reflects its members various technical profiles. The Supervisory Board thus meets the existing requirements in terms of industry expertise, special knowledge and experience in the fields of accounting and internal control procedures plus knowledge of the legal outline conditions as well as requirements relating to the Company s international focus and expertise. Moreover, the Supervisory Board s members are independent and are not exposed to any conflicts of interest. They do not include any previous Executive Board members and none of its members performs organ or advisory functions for the Group s competitors. The makeup of the Supervisory Board thus means that in overall terms its members have the knowledge, abilities and technical experience which are necessary for the due performance of its tasks. With regard to its future makeup, the Supervisory Board has resolved to maintain its balance of technical qualifications and to amplify its focus on the goal of diversity and due consideration of women. For instance, appropriate representation of women is a goal for future Supervisory Board appointments, subject to equal aptitude and availability. However, in view of the fact that the Supervisory Board only has three members it has opted to waive a fixed goal in terms of a percentage or time period in order to maintain the necessary level of flexibility in seeking suitable members. In the event that the Supervisory Board acquires more than its current three members, at least one of these members is to be female, subject to the above-mentioned conditions of equal aptitude and availability. Shareholders and Annual General Meeting Shareholders exercise their rights and vote at the Annual General Meeting. Each share of Deufol AG entitles the holder to one vote. There are no shares with multiple voting rights, preferential voting rights or maximum voting rights. The Annual General Meeting resolves a number of key issues, including the appropriation of net profit and approval of the actions of the members of the Executive Board and the Supervisory Board, the appointment of the auditors and the election of the members of the Supervisory Board. In addition, the Annual General Meeting resolves on amendments to the Articles of Association, corporate measures, and the authorization of certain intercompany agreements. Management Report 35
38 36 Management Report Corporate Governance Corporate Governance Statement Accounting and Auditing The consolidated financial statements of the Deufol Group are prepared in accordance with the International Financial Reporting Standards (IFRS). The single-entity financial statements of Deufol AG are prepared in accordance with the German Commercial Code. The auditors are elected by the Annual General Meeting in accordance with the relevant statutory provisions. The Supervisory Board prepares the proposal to the Annual General Meeting on the election of the auditors. To ensure their independence, the Supervisory Board must obtain from the auditors a declaration concerning any grounds for disqualification or partiality. In issuing the audit engagement to the auditors, it is agreed that the Chairman of the Supervisory Board will be informed immediately of any grounds for disqualification or partiality on the part of the auditors which arise during the performance of the audit, the auditors will report without delay on all facts and events of importance for the tasks of the Supervisory Board which arise during the performance of the audit, and the auditors will inform the Chairman of the Supervisory Board and / or note in the Auditors Report if, during the performance of the audit, they become aware of facts which show a misstatement in the declaration on the German Corporate Governance Code submitted by the Executive Board and the Supervisory Board. Risk Management in the Group Deufol has a risk management system that reflects the Company s global orientation. The risk management system forms part of the planning, control and reporting process, and is intended to ensure that the Company s management identifies material risks at an early stage and is able to take measures to counteract these risks. The Chairman of the Supervisory Board remains in regular contact with the Executive Board to discuss issues relating to risk management, as well as the strategy and business development of the Group. Transparency and Communications Deufol provides shareholders, financial analysts, shareholders associations, the media and other interested parties with regular information on the financial position of the Company and key developments in its business activities. Information is published in line with the principle of fair disclosure. Accordingly, Deufol AG makes new information available to all shareholders and other interested parties at the same time as this information is disseminated to financial analysts and institutional investors. To ensure that information is provided in a timely manner, Deufol uses the Internet and other means of communication. A Financial Calendar lists all the dates of key publications (e. g. the Annual Report, Interim Reports or the Annual General Meeting) well in advance. The Financial Calendar is printed before the Table of Contents of this Annual Report and is also available from our website In addition to its regular reporting, Deufol immediately publishes any new information that could have a significant effect on the Company s share price (ad-hoc disclosures).
39 Corporate Governance Corporate Governance Statement In accordance with statutory requirements, Deufol also issues a statement immediately after receiving notification that a shareholder s stake in the Company has reached, exceeded or fallen below the thresholds of 3 %, 5 %, 1 %, 25 %, 3 %, 5 % or 75 % of the voting rights in Deufol AG, whether by way of acquisition, disposal or otherwise. Furthermore, in accordance with statutory requirements, details of transactions in financial instruments of Deufol AG by members of the Executive Board or the Supervisory Board (and persons defined by the German Securities Trading Act as related parties) are published promptly. An overview of the transactions effected is also provided on the Company s website (www. deufol.com) under The share in the Investor & Public Relations section. Shareholdings of Members of the Executive Board and the Supervisory Board The Executive Board member Mr. Detlef W. Hübner holds 52.9 % of the share capital of Deufol AG (amounting to 23.2 million shares) directly as well as indirectly through Lion s Place GmbH. The remainder of the Executive Board holds 44.8 thousand shares. A detailed breakdown can be found under Supplementary Disclosures on page 124. The members of the Supervisory Board do not hold either shares or options to purchase shares in Deufol AG. Declaration of Conformity with the German Corporate Governance Code The declaration of conformity issued by the Executive Board and the Supervisory Board of Deufol AG in March 212 in accordance with section 161 of the German Stock Corporation Act is available on the Internet at In the declaration of conformity, the Executive Board and the Supervisory Board of Deufol AG state that the Company complies with most of the recommendations of the German Corporate Governance Code and has done so in the past. The Executive Board and the Supervisory Board of Deufol AG intend to continue to observe the recommendations of the German Corporate Governance Code in the version dated May 26, 21 in future. Only in the following cases does Deufol AG not comply with the recommendations of the Code: Makeup of the Executive Board (section of the Code) The Executive Board currently consists of two persons, which is why the Supervisory Board and the Executive Board have thus far refrained from appointing a chairman or selecting a spokesman. The Supervisory Board and the Executive Board will reconsider this issue in the event that the Executive Board in future comprises more than two persons. Executive Board remuneration (section of the Code) Due to tax requirements for the avoidance of a concealed dividend payment due to his position as the majority shareholder, the Executive Board member Detlef W. Hübner receives variable remuneration as a fixed percentage of the Group s income from ordinary activities. This bonus may not exceed a maximum of 25 % of the overall remuneration. To such extent due to tax provisions, the Supervisory Board does not see itself in a position to provide for variable compensation based on a multi-year assessment for the Executive Board member in question. Management Report 37
40 38 Management Report Corporate Governance Corporate Governance Statement Remuneration Report For the other Executive Board members, the Supervisory Board decides on their variable compensation on a discretionary basis, with particular consideration of the Company s result after taxes and third-party interests in the Company, taxes and third-party interests in the Group, medium- and long-term business development and the liquidity trend. Age limit for members of the Executive Board (section of the Code) and the Supervisory Board (section of the Code) No age limit has been specified for the members of these bodies, as their physical and mental capacity is given appropriate consideration as part of the selection process regardless of their age. Establishment of Supervisory Board committees (section 5.3 of the Code) The Supervisory Board has not established any committees. Since the Supervisory Board only has three members, the committee members would inevitably be the same persons as the Supervisory Board members. Remuneration of members of the Supervisory Board (section of the Code) The remuneration paid to members of the Supervisory Board currently only contains a fixed component. The exercise of Deputy Chair positions is not considered separately. Publication of consolidated financial statements within 9 days (section of the Code). Due to the large number of companies included in the consolidated financial statements, it was not possible to publish the statements within the required time after the end of the respective reporting periods. The Company will endeavor to comply with this recommendation in future. Remuneration Report The remuneration report also complies with disclosure requirements under commercial law pursuant to section 285 no. 9 and section 289 (2) no. 5, and section 314 (1) no. 6 and section 315 (4) no. 9 of the German Commercial Code. Supervisory Board Compensation Supervisory Board compensation is governed by section 15 of the Deufol AG Articles of Association. Supervisory Board members receive fixed compensation of 2 thousand for each full fiscal year of service on the Supervisory Board, remitted pro rata at the end of the quarter. The Chairman of the Supervisory Board receives twice this amount. Supervisory Board members sitting on the Supervisory Board for less than a full fiscal year receive pro rata compensation based on length of service on the Board. Supervisory Board members also enjoy full expenses reimbursement and reimbursement of any sales tax payable in connection with their compensation and expenses. In 211, Supervisory Board compensation totaled 8 thousand (previous year: 8 thousand). This amount was divided up as follows between the individual Supervisory Board members: Helmut Olivier (Chairman from November 24, 211) 22 thousand, Prof. Dr. Wolfgang König (from June 29, 211) 1 thousand, Mr. Wulf Matthias (from November 24, 211)
41 Corporate Governance Remuneration Report 2 thousand, Georg Melzer (Chairman to November 24, 211) 36 thousand, Prof. Dr. Kai Furmans (to June 29, 211) 1 thousand. In addition, the members of the Supervisory Board were reimbursed expenses of.2 thousand (previous year:.5 thousand). Executive Board Compensation All the Executive Board members of Deufol AG receive both fixed and variable compensation. The variable remuneration consists of a cash bonus. For two Executive Board members, in fiscal year 211 the Supervisory Board decided on a discretionary basis on the value of their cash bonuses. This may not exceed 25 % of the overall remuneration (basic salary and cash bonus). The cash bonus is determined on the basis of the personal performance of the Executive Board member and the business success which he has achieved for the Company, plus the following parameters in particular: Deufol AG s result after taxes, the result for the period after taxes and third-party interests in the Group, the Company s medium and long-term performance, and the Company s current liquidity position. Due to tax requirements for the avoidance of a concealed dividend payment due to his position as the majority shareholder, one other Executive Board member receives variable remuneration as a fixed percentage of the Group s income from ordinary activities. This bonus may not exceed a maximum of 25 % of the overall remuneration. A bonus of up to 18 thousand p. a. may be granted for a further Executive Board member. This target bonus consists of two components: An amount of up to 1 thousand p. a. is measured and assessed according to long-term criteria (3 years) (LTI), and an amount of up to 8 thousand p. a. is exclusively measured and assessed on the basis of the past fiscal year (STI). The Company s performance is key for the LTI calculation, including sales and income and its organizational, share price and business sector development. The Supervisory Board specifies appropriate criteria and standards for the assessment of goal achievement. The STI is determined on the basis of the personal performance of the Executive Board member and the business success which he has achieved for Deufol AG, plus the following parameters in particular: the result after taxes and third-party interests in Deufol AG, the result for the period, after taxes and third-party interests in the Group, and the Company s current liquidity position. The Executive Board members receive further non-performance-related compensation, consisting mainly of the use of a company car. Individual Executive Board members are responsible for paying tax on noncash benefits. No pension commitments exist with regard to Executive Board members as the Group does not as a rule provide pension plans. Management Report 39
42 4 Management Report Corporate Governance Remuneration Report As of the end of fiscal year 211, the Executive Board members of Deufol AG received the following overall remuneration: Executive Board Compensation Fixed salary figures in thousand Other Performance-based compensation components Total 211 Total 21 Detlef W. Hübner Dr. Tillmann Blaschke (since Jul. 1, 211) Tammo Fey (to Dec. 31, 211) Total , This does not include any components with a long-term incentive effect. An Executive Board member who resigned from this position during fiscal year 211 received the overall remuneration outlined below. Mr. Andreas Bargende served on the Executive Board of Deufol AG until November 28, 211. For his service in fiscal year 211, he received overall remuneration of 459 thousand (previous year: 551 thousand). In addition to his fixed salary of 44 thousand (previous year: 48 thousand), this included additional benefits in the amount of 19 thousand (previous year: 21 thousand). No further benefits are envisaged. Commitments to Executive Board Members in Case of Early Termination Upon early termination of the agency contract instigated by the Company, each Executive Board member is entitled to a severance package on the basis of his fixed salary plus average annual bonuses granted up to the date of the early termination and for the remaining duration of the contract, but not exceeding full remuneration for two years overall. This does not apply in the case of immediate termination for due cause. The relevant Executive Board member enjoys special termination rights with three calendar months notice in the event that the organizational structure of the Company should be altered in such a way as to compromise materially the competences of the member of the Executive Board. In this case, the severance package may not exceed three full annual salary installments. All settlement amounts are to be discounted at a rate of 6 %. The Executive Board member contracts provide for a one-year non-compete clause upon departure from the Company. Departing Executive Board members receive an indemnification equal to 1 % of basic salary. However, Deufol AG is entitled at any time to waive compliance with the non-compete clause, subject to three months notice, such that both Deufol AG and the relevant Executive Board member will be released from its provisions.
43 Corporate Governance Information on Acquisitions Information on Acquisitions The following section provides a statement on acquisitions pursuant to section 289 (4) and section 315 (4) of the German Commercial Code. Capital As of December 31, 211, the Subscribed Capital is 43,773,655 (previous year: 43,773,655) and is divided up into the same number of no-par value shares to bearer. Each share provides a single vote and there are no special membership rights or voting right restrictions. As of December 31, 211, Mr. Detlef W. Hübner, Executive Board member of Deufol AG, holds a capital share of 52.9 % (previous year: 52.8 %) directly as well as indirectly through Lion s Place GmbH, Hofheim am Taunus. An amount of 2,, remained unchanged as Approved Capital as of December 31, 211 for the issuance of new shares in return for cash contributions or contributions in kind (end of previous year: 2,,). In accordance with the resolution passed by the Annual General Meeting on June 16, 29, the Company has been authorized to increase the Company s share capital by up to 2,, by June 15, 214. In accordance with the resolution passed by the Annual General Meeting on June 22, 21, the Company has been authorized to purchase up to 4,377,365 of its own shares in the period from June 22, 21 to June 21, 215; this corresponds to approx. 1 % of the share capital as of June 21. Appointment and Dismissal of the Executive Board The appointment and dismissal of the Executive Board is regulated by section 84 in combination with section 85 of the German Stock Corporation Act; accordingly, the Supervisory Board appoints the members of the Executive Board for a maximum period of five years. Where several persons are appointed Executive Board members, the Supervisory Board may appoint one of these members as Chairman of the Executive Board. The Supervisory Board may cancel an Executive Board appointment or an appointment to the position of Chairman of the Executive Board for good cause. At Deufol AG, the appointment and makeup of the Executive Board is regulated in section 8 of the Articles of Association, in accordance with the relevant statutory provisions. Accordingly, the Executive Board has at least two members, who are appointed by the Supervisory Board. The Supervisory Board also specifies the number of Executive Board members and may appoint a Chairman and Deputy Chairman of the Executive Board. Management Report 41
44 42 Management Report Corporate Governance Information on Acquisitions Internal Control and Risk Management System Relating to the Accounting Process Changes to the Articles of Association Changes to the Articles of Association are regulated in accordance with section 179 and section 133 of the German Stock Corporation Act. Paragraph 1 of section 179 specifies that any change to the Articles of Association requires a vote by the Annual General Meeting. The Annual General Meeting may assign to the Supervisory Board the power to make changes pertaining to the version only. Paragraph 2 states that an Annual General Meeting resolution requires a majority of the share capital represented at the vote, at least three quarters. The Articles of Association may specify a different equity majority, but may only specify a larger equity majority for a change to the Company s purpose of business. It may also specify further requirements. The Articles of Association of Deufol AG do not stipulate any different equity majorities or other requirements. In the case of Deufol, section 14 of the Articles of Association authorizes the Supervisory Board to make changes pertaining to the version only. Further disclosures in accordance with section 289 (4) and section 315 (4) of the German Commercial Code are provided in the remuneration report. Please see the disclosures in the Notes regarding the details of direct and indirect capital shares which exceed 1 % of the voting rights. Internal Control and Risk Management System Relating to the Accounting Process The Deufol Group has an internal control and risk management system (ICS) for control and monitoring of its accounting process. This ICS is based on the recognized standards published by the COSO (Committee of Sponsoring Organizations of the Treadway Commission). Deufol AG s internal control system encompasses all the principles, procedures and measures required to safeguard effectiveness, profitability and orderly accounting as well as to ensure compliance with the key legal regulations. The Group s accounting guidelines and account schedule are drawn up by its controlling department and provide the conceptual framework for the preparation of its consolidated financial statements. They are applied for all the Group s units. New laws, accounting standards and other official statements are continuously analyzed in terms of their relevance and effects on the consolidated financial statements and the Group management report. Where necessary, our accounting guidelines and account schedule are revised accordingly. The conceptual and deadline requirements plus monitoring of their fulfillment are intended to reduce the risk of a failure to prepare or disclose the consolidated financial statements appropriately and within the required time limits. The various units accounting records serve as a basis for the financial information provided by Deufol AG and its subsidiaries which yields the data for preparation of the consolidated financial statements. The subsidiaries performed the accounting, but in future this will be increasingly centralized so as to achieve even more efficient bookkeeping and reporting. We employ the services of external specialists to value pension commitments assumed within the framework of transfers of enterprises within the Deufol Group as well as tax accruals.
45 Corporate Governance Internal Control and Risk Management System Relating to the Accounting Process The consolidation measures required for the preparation of the consolidated financial statements are subject to manual and technical controls at every level. The employees involved in the accounting process were assessed for their technical aptitude at the time of hiring and have undergone regular training. The dual-control principle is applied at every level of the preparation process and for the release of accounting-related information. Target / actual comparisons and analyses and reviews of monthly results together with the managers of the various business divisions serve as additional control mechanisms. In the accounting-related IT systems, access rules are defined in order to protect accounting-related data against unauthorized access and tampering. Guidelines have been drafted so as to guarantee data protection and integrity as well as the availability of the Group s IT systems. The activities performed by internal auditing provide a further element in our control system. Through continuous and Group-wide audits, internal auditing ensures compliance with guidelines as well as the reliability and functioning capacity of our control system and the appropriateness and effectiveness of our risk management system. Auditing regularly reports to the Executive and Supervisory Boards on its audit findings in the various audited divisions. As the parent company of the Deufol Group, Deufol AG is integrated in the Group-wide accounting-related internal control system outlined above. In principle, the above statements also apply for the single-entity financial statements of Deufol AG. Management Report 43
46 44 24 Business and Economic Environment 33 Corporate Governance 44 Results of Operations, Financial and Asset Position 55 Position of Deufol AG 57 Risk Report 62 Report on Dependence, Post-Balance-Sheet Date Events and Expected Developments
47 Results of Operations, Financial and Asset Position Management Report 45 Results of Operations Sales Results of Operations, Financial and Asset Position Results of Operations Rising Sales Notes 1, 44 In an economic environment showing a positive overall trend, in the reporting period sales from continuing operations increased by 4. % on the previous year to million. We have thus achieved our planning targets, which had envisaged sales in a corridor of between 31 million and 325 million. If the sales trend is adjusted for the acquisitions, this shows organic growth of 2.8 %. If one also takes into consideration the US dollar s depreciation against the euro of around 5 % on average, this represents adjusted growth of 3.6 %. Consolidated sales by segment Sales figures in million figures in million Abroad 54.9 % Germany Germany 27.6 % Rest of Europe % USA / Rest of the World % Holding company 1. % Total Germany is Deufol s Key Market Note 44 In the past year, Germany consolidated its role as the Deufol Group s most important sales market. With significantly increased sales (+ 7.7 % to million) in the past fiscal year, it provided 55.1 % (previous year: 53.2 %) of Group sales. The second-largest segment, Rest of Europe, provided 27.6 % (previous year: 28.1 %) of Group sales with a slight rise in the sales volume (+ 2.2 % to 87. million). However, this increase was unevenly distributed among the Group s regions, with 4.7 % in Belgium, + 2. % in Italy, and % in the Slovakia / Czech Republic / Austria region. This reflected the Group s acquisition of Richard Wolfsberger GmbH, without which sales growth in this region would have amounted to 6.9 %. In the USA / Rest of the World, sales fell by 3.8 % to 54.5 million. This means that this segment now represents around 17.3 % (previous year: 18.7 %) of Group activities. The Group s new operations in Charlotte (USA) and Suzhou (China) were consolidated in this segment for the first time. The dollar s depreciation was a negative factor in the USA; US sales remained unchanged in local-currency terms. Export & Industrial Packaging Accounts for an Increased Share of Sales Note 45 With a share of sales of approx % (previous year: 46.2 %), Export & Industrial Packaging is the Group s most important business segment. Sales realized in Consumer & Data Packaging decreased from 38.2 % to 34.9 %. Supplementary Services sales volume declined slightly, from 15.5 % to 15.1 % % % Consolidated sales by services figures in million Export & Industrial Packaging Share (%) Consumer & Data Packaging Share (%) Supplementary Services Share (%) Holding company Share (%) Total
48 46 Management Report Results of Operations, Financial and Asset Position Results of Operations Costs Income Operating Costs Ratio Increased on Balance Cost development Notes 2 6, trend. This is mainly due to the above-average increase in costs of materials (+ 2.2 %). as % of sales Higher personnel costs (+ 5.7 %) and higher rent and leasing expenses (+ 9.2 %) were fur- Selling expenses as % of sales figures in million Cost of sales General and administrative expenses as % of sales Other operating income as % of sales Other operating expenses as % of sales Total as % of sales of which personnel costs* as % of sales At 89.3 % (previous year: 87.2 %), the ratio of the cost of sales to sales recorded a rising ther adverse factors. Selling expenses fell.8 million to 5.1 million and accounted for 1.6 % of sales. General and administrative expenses increased slightly ( 2.7 million); the expense ratio amounted (4.4) (2.6) expenditure on purchased services (+ 24. %) and legal and consulting costs (+ 6.5 %). Items (1.4) (.8) with decreasing costs included other administrative expenses ( 12.2 %) and expenses for the to 6.6 % (previous year: 6.7 %). Cost increases resulted e. g. for personnel costs (+ 5.2 %), Annual General Meeting and financial reports ( 29.2 %). Other operating income was significantly higher. It rose by 1.8 million to 4.4 million, increasing the ratio to sales to 1.4 % (previous year:.8 %). In particular, insurance com pensation and other indemnification plus income from the release of accruals were higher here. In contrast, the total other operating expenses decreased ( 1.6 to 1.5 million), the quota amounted to.5 % (previous year: 1. %). In overall terms, the cost quota has thus increased from 96.1 % to 96.6 %. This corre- * Total personnel costs included in all cost items sponds to an EBITA margin of 3.4 % (previous year: 3.9 %). Income Development Income development 211 figures in million 21 gin thus amounted to 1.7 %, compared to 12.8 % in 21. Above all, the cost of materials Gross profit EBITDA 38.7 Earnings before interest, taxes, depreciation and amortization (EBITDA) were 19.5 million, compared to 2.6 million in the previous year. The EBITDA margin reached 6.2 %, Net income increased while purchased services in particular fell EBITA EBT In the past fiscal year, the gross profit decreased by 12.9 % to 33.7 million. The gross mar- 1.7 compared to 6.8 % in 21. Depreciation of property, plant and equipment was constant, at 7.5 million, and amortization of other intangible assets rose slightly, from 1.2 million to million. In the period under review, the operating result before goodwill amortization (EBITA) decreased by 9.7 % to 1.7 million and thus fell within the revised planning corridor ( 1 million to 12 million). The EBITA margin amounted to 3.4 % in 211, compared to 3.9 % in 21. The income trend is positive in the Rest of Europe, particularly in Belgium and Italy. In contrast, our predictions were not borne out in the USA and Germany. In the USA, factors such as lower volumes in the packaging business impacted on the result. In Germany, increased commodity prices (particularly wood) led to additional expenses. However, the continued slight easing of wood prices in the fourth quarter and the increasing factoring-in of the commodities price trend in our customer relationships give cause for optimism.
49 Results of Operations, Financial and Asset Position Management Report 47 Results of Operations Income Improved Financial Result Note 7 Margin development At 3.3 million, the financial result was less negative than in the previous year ( 4.3 mil- figures as % of sales lion). Financial expenses fell from 6.4 million to 6. million. Among other factors, the Gross margin lower expenses are attributable to a significant decrease in expenses resulting from the accu- EBITDA margin mulation of liabilities. Slightly lower average financial indebtedness ( 77. million, compared EBIT(A) margin to 78.6 million in 21) also led to declining interest expenses. Financial income increased EBT margin from 1.5 million to 2. million. This was mainly due to income from legal proceedings Net income margin.3.97 (.4 million). The profit provided by associates increased from.6 million to.7 million. Decreased Net Income Due to Discontinued Operation Notes 8 11 Earnings before taxes amounted to 7.4 million in the past year and were thus slightly below the level in 21 ( 7.5 million). On balance, overall tax expenditure in the past fiscal year amounted to 3.5 million, compared to 3. million in the previous year. Current tax expenditure for taxes on income decreased slightly and continued to amount to approx. 3.4 million. In relation to deferred taxes, the Group incurred marginal expenses (.1 million), compared to proceeds of.4 million in 21. Accordingly, there is income from continuing operations of 3.9 million (previous year: 4.5 million). Earnings per share from continuing operations were.77 in 211 (previous year:.95 ). The discontinued operation Carton Business in the USA led to a loss of 3.3 million (previous year: 1.2 million). This consists of a current loss of.8 million and a pension commitment of 2.5 million. This means a result for the period of.6 million (previous year: 3.3 million). The profit share for noncontrolling interests is.5 million (.4 million). Earnings attributable to the shareholders of Deufol AG amounted to.1 million in the period under review, compared to 2.9 million in the same period in the previous year. Earnings per share were.2 in 211 (previous year:.67).
50 48 Management Report Results of Operations, Financial and Asset Position Financial Position Financing Investments Financial Position Financing of the Deufol Group Notes 26, 42 In late October, the Deufol Group reorganized its financing structures in Germany. The Group has entered into a loan facility with a consortium of banks, with an initial volume of 45 million. This credit facility has a term of four years and includes an option for a one-year extension. This was almost entirely used for the repayment of existing loans but also increased the Group s credit facility by approx. 1 million. This financing safeguards medium-term liquidity requirements and provides scope for growth for the Group. Further significant financing groups exist in the USA (mainly operating credit line), Belgium (mainly real estate and plant and equipment) and Italy (mainly operating credit line). Credit lines of 54.1 million are available to the Group at various banks (previous year: 34.1 million). As of December 31, 211, 26.9 million (previous year: 23.8 million) of this had been utilized, subject to variable interest rates. The variable-interest loans carried in the balance sheet are subject to standard interest-rate risks; in some cases, these are limited through interest rate hedges. In fiscal year 211, the average weighted interest rate for short-term loans was 4.93 % (previous year: 4.16 %). The payable credit margins are partially dependent on achieving certain financial ratios (so-called covenants ). In the Executive Board s opinion, the Deufol Group s financial resources are sufficient to meet payment obligations at any time. Slight Increase in Financial Indebtedness Financial liabilities Notes 2, thereof current thereof noncurrent Finance leasing million at the end of the period under review. This was due to the decrease in cash held Other.5.5 ( 5.4 million) and lower financial receivables ( 1.8 million). The balance of liabilities to Total Germany Rest of Europe USA / Rest of the World Holding company Total figures in million Amounts due to banks Investments by segment figures in million In the past fiscal year, the financial liabilities of the Deufol Group increased slightly, from 78.2 million to 79.6 million. Net financial liabilities defined as the total financial liabilities less financial receivables and cash increased more strongly, by 8.6 million from 49.3 million on December 31, 21 to banks and call deposits at banks is 59.2 million (previous year: 52. million). Investments % Property, plant and equipment % Intangible assets % Financial assets figures in million 1. % Total
51 Results of Operations, Financial and Asset Position Management Report 49 Financial Position Investments Depreciation, amortization and impairment Cashflow / Liquidity Unchanged Volume of Investment Notes 13, 14 In the period under review, at 8.53 million, investments including leased assets were in overall terms slightly higher than in 21 ( 8.3 million). In the past fiscal year, investments in property, plant and equipment were 7.3 million (previous year: 8.1 million). The investment quota as a ratio of capital expenditure to sales was 2.3 % in 211 (previous year: 2.7 %). Technical equipment and machinery ( 2.5 million) is the largest capital expenditure item. This is followed by operating and office equipment ( 2.1 million), leased assets ( 1.7 million), land and buildings (.7 million) and assets under construction (.3 million). Investments in goodwill and investments in other intangible assets both accounted for.6 million (previous year: million and.5 million, respectively). Reduced Depreciation / Amortization Notes 13, 14 Depreciation of property, plant and equipment and amortization of intangible assets were marginally higher than in the previous year ( 8.8 million compared to 8.7 million). Depreciation of property, plant and equipment was unchanged at 7.5 million and amortization of other intangible assets amounted to 1.3 million (previous year: 1.2 million). Depreciation, amortization and impairment Depreciation, amortization and impairment by segment % Property. plant and equipment % Intangible assets % Financial assets figures in million 1. % Total Cash Flow Notes The operating cash flow amounted to 4.6 million in the period under review and was thus Germany Rest of Europe USA / Rest of the World Holding company.3.29 Total figures in million Net cash provided by operating activities figures in million 211 significantly lower than in the previous year ( 19.9 million). This decline is predominantly due to the cut-off date-related 1.9 million increase in trade receivables. In the previous year, trade receivables decreased by 6.4 million while increasing cash flow Net cash used in investing activities was.4 million (previous year: 4.4 million). Cash-based fixed assets investments were 6.2 million. On the other hand, the disposal of intangible assets and property, plant and equipment produced fund inflows in the amount of 1.7 million. Further proceeds resulted from interest and dividends received ( 2.5 million) and from the decrease in financial receivables ( 1.8 million). Fund outflows resulted from the acquisition of subsidiaries (.2 million). 4.6
52 5 Management Report Results of Operations, Financial and Asset Position Financial Position Cashflow / Liquidity Change in liquid funds figures in thousand Liquid funds Dec. 31, 21 Net cash provided by operating activities Net cash used in investing activities Net cash used in financing activities Changes in the scope of consolidation Liquid funds Dec. 31, ,416 Free cash flow: 4,259 4, ,768 16,811 Accordingly, the free cash flow which is made up of net cash provided by operating activities and net cash used in investing activities amounted to 4.3 million, compared to 15.5 million in the previous year. Net cash used in financing activities was 9.8 million (previous year: 13.5 million). Financial liabilities decreased in cash terms by a net amount of 1.9 million. Further outflows of funds resulted from paid interest ( 6.1 million), dividends ( 1.3 million) and the dividends paid to noncontrolling interests (.4 million). Cash and cash equivalents decreased by 5.4 million to 11.4 million as of December 31, 211.
53 Results of Operations, Financial and Asset Position Management Report 51 Asset Position Asset Position Increased Balance Sheet Total Notes In 211, the balance sheet total of the Deufol Group increased by 2.9 % to million. Balance sheet structure 211 share as % Assets On the asset side of the balance sheet, the noncurrent assets decreased by 2.3 % from 15.1 million as of the period-end in the previous year to million as of the reporting 21 Equity and liabilities 34 % 37 % Current assets date. This fall resulted from the decrease in property, plant and equipment ( 3.3 million to 48.2 million). Financial receivables also declined ( 1.4 million to 8.3 million). The asset depreciation ratio (ratio of accumulated depreciation to historical cost) decreased by.7 per- 66 % 63 % Noncurrent assets centage points on the previous year to 61.7 %, while the property, plant and equipment ratio 37 % 32 % Current liabilities 26 % Noncurrent liabilities 2 % 43 % 42 % Equity (i. e. the ratio of property, plant and equipment to the balance sheet total) decreased from 23 % to 21 %. Goodwill increased by.6 million to 68.6 million. The other noncurrent assets changed only slightly. Current assets increased from 76.8 million to 86.7 million. This is mainly due to increased trade receivables ( million to 49. million). The other receivables and other assets also rose (+ 2.8 million to 8.7 million). This also includes a property in Brookville (USA) for the first time, in the amount of 2. million. The disposal of this property is envisaged. Cash and cash equivalents decreased significantly ( 5.4 million to 11.4 million). Other current assets changed only slightly. The working capital the difference between current assets and current non-interest-yielding liabilities increased from 34.6 million to 39.4 million. Slight Decrease in Equity Notes 22 3 Net financial indebtedness and equity ratio At the end of fiscal year 211, the Deufol Group s equity was at 98.4 million.6 million figures in million lower than the previous year s level ( 99. million). Since the balance sheet total has simul- Equity ratio taneously risen, this means a reduction in the equity ratio from 43.6 % to 42.1 %. Equity increased due to the profit for the period (+.6 million) and the other comprehensive income (+.5 million). The dividend payout ( 1.3 million) and dividends paid to noncontrolling interests (.4 million) had a negative effect. Noncurrent assets rose from 44.7 million to 59.3 million. Within the framework of the syndicated loan, noncurrent financial liabilities increased in particular ( million to 49.3 million) due to an extension of the term for bank financing under this loan. Pension accruals also increased (+ 2.6 million to 3.9 million), while other liabilities fell (.8 million to 3.1 million). The other noncurrent liabilities hardly changed. The Asset cover ratio II the ratio of equity and noncurrent liabilities to fixed assets was %, compared to % at the end of 21. The current liabilities decreased by 7.5 million to 75.7 million. Current financial liabilities recorded the strongest decrease ( 1.8 million to 3.3 million). This was due to the above-mentioned change in the term of the loan financing. Other accruals also decreased (.7 million to 1.2 million) while other liabilities have increased (+.8 million to 13.5 million). Net financial indebtedness Dec % 57.9 Dec. 1 Dec % 4.3 %
54 52 Management Report Results of Operations, Financial and Asset Position Employees Employees Slight Decrease in Workforce Overview of employees Note Germany 1,619 1,637 1 employees or.4 % on the previous year. As of December 31, 211, the Group had 1,619 Rest of the World 1,153 1,145 employees in Germany (58.4 %) and 1,153 employees (41.6 %) elsewhere Male 1,969 1,991 Total 2,772 2,782 man shed employees ( 37), not least due to the discontinuation of its Carton Business, the Average 2,818 2,721 Group hired a total of 31 employees at its new locations in Charlotte and Suzhou (China). Deufol Group Female As of the end of 211, the Deufol Group had 2,772 employees. This represents a decrease of In Germany, the Group had 28 fewer employees while in the Rest of Europe the number of employees increased by 14, mainly due to the first-time consolidation of Deufol Austria GmbH. In the USA / Rest of the World, the workforce decreased by 6. While our US subsidiary in Sun- Personnel costs increased in the reporting period by 4.1 % to 92.5 million. The personnel cost ratio as a ratio of personnel expenses to revenue remained constant at 29.3 %. Thanks for Commitment The Executive Board would like to thank all the Company s employees for the dedication and flexibility they displayed in fiscal year 211. Employees by segment Personnel expense ratio figures as % ,61 1, % Rest of Europe % USA / Rest of the World Deufol Group 58.5 % Germany.3 % Holding company 1. % Total 9 9 2,772 2,782
55 Results of Operations, Financial and Asset Position Management Report 53 Development in the Segments Development in the Segments Germany Notes At million, consolidated sales in Germany in 211 exceeded sales in the previous year by 7.7 %. EBITA in this sector decreased by 31.7 %, from 7.3 million to 5.4 million. The EBITA Germany Sales Consolidated sales figures in million margin declined from 4.6 % to 3.1 %. The result has mainly been influenced by increased Gross profit commodity prices (wood) which led to additional expenditure. However, the continued slight EBITA = EBIT easing of wood prices in the fourth quarter and the increasing factoring-in of the commodi- EBITA margin (%) ties price trend in our customer relationships give cause for optimism. At the Euskirchen EBT location, lower volumes and a revised product mix adversely affected the result. In addition, reinforcement of central control and services led to temporarily higher administrative expenses since decentralized capacities can only be wound down with a time lag. Rest of Europe Notes In the Rest of Europe, we achieved consolidated sales of 87. million, an increase of 2.2 % Rest of Europe figures in million on the previous year. Adjusted for the acquisition of Deufol Austria GmbH (previously Rich- Sales ard Wolfsberger GmbH), sales were 2.3 % lower than in the previous year. Consolidated sales Gross profit However, this rise was unevenly distributed among the Group s regions, with 4.7 % in Belgium, + 2. % in Italy, and % in the Slovakia / Czech Republic / Austria region. This EBITA = EBIT reflected the Group s acquisition of Richard Wolfsberger GmbH, without which sales growth EBITA margin (%) in this region would have amounted to 6.9 %. EBT The operating result (EBITA) rose in the past year by 49.2 % from 5. million to 7.4 million. This increase is primarily due to improved results in Belgium. Favorable operating business was a factor in this country, which also benefited from the release of a liability to employees and from income from a legal dispute in the amount of.8 million. In Italy, results also went up despite the.4 million start-up losses associated with the new Roverbella site.
56 54 Management Report Results of Operations, Financial and Asset Position Development in the Segments Overall Summary of Economic Position USA / Rest of the World USA / Rest of the World Notes Sales Carton Business were at 54.5 million 3.8 % lower than in the previous year. This was Consolidated sales mainly due to lower battery packaging volumes, which increases in Data Packaging were Gross profit unable to compensate for. The new operations in Charlotte and Suzhou contributed sales EBITA = EBIT volumes in the low single-digit million range. If sales in the USA are adjusted for the depre- EBITA margin (%) ciation of the US dollar against the euro by 5. % on average, then sales were unchanged (1.4) (.7) figures in million EBT In the USA / Rest of the World segment, consolidated sales adjusted for the discontinued on the previous year. EBITA in this segment amounted to 1.1 million, compared to 2.1 million in the previous year. This was due to the lower rate of utilization of production capacities due to lower volumes in the packaging business and the associated decrease in the operating result. Deufol Packaging (Suzhou) Co., Ltd. and Deufol Charlotte LLC were consolidated for the first time this year and together realized a balanced result. Overall Summary of Economic Position At the time of preparing these consolidated financial statements, the Deufol Group s economic position is stable. The economic recovery has led to volume increases in many segments of the Deufol Group. In Germany in particular, on the results side this has thus far been offset by rising commodity (wood) prices. We have responded through measures such as the creation of a central purchasing system in order to cope better with price fluctuations in future. In the Rest of Europe, we have recorded significantly improved earnings. On the other hand, the USA has suffered due to weak volumes in the battery packaging business while Data Packaging has realized a highly favorable performance. Our financial and asset position remains solid.
57 Position of Deufol AG Management Report 55 Sales and Results of Operations Assets and Financial Position Position of Deufol AG Sales and Results of Operations In fiscal year 211, Deufol AG realized sales of 2,24 thousand (previous year: 2,15 thou- Deufol AG: Income statement sand) and other operating income of 498 thousand (previous year: 2,582 thousand). figures in thousand These sales mainly resulted from amounts billed to associates for services provided and rents. Outside Germany, sales amounted to 1,647 thousand (previous year: 1,535 thousand). Other operating income mainly consists of bonuses in connection with central material purchasing in the amount of 322 thousand (previous year: thousand), income from the Sales Other operating income Personnel costs ,24 2, ,582 (2,422) (2,3) (269) (258) reduction on item-by-item allowances amounting to 89 thousand (previous year: 5 thou- Depreciation, amortization and impairment sand) and income from passed-on expenses in the amount of 85 thousand (previous year: Other operating expenses (3,331) (4,42) 118 thousand). The income from the reduction on item-by-item allowances is income unre- Financial result 7,88 5,462 lated to the accounting period. Income / loss from ordinary activities 4,596 3, (194) 4,486 3,67 The other operating expenses ( 3,331 thousand compared to 4,42 thousand in the previous year) mainly comprise bad debt charges in the amount of 321 thousand (previous year: 1,457 thousand), legal fees and consulting expenses in the amount of 895 thousand (previous year: 625 thousand), external services in the amount of 717 thousand (previous year: 747 thousand), travel and vehicle expenses in the amount of 36 thousand (previous year: 261 thousand), space costs in the amount of 255 thousand (previous year: 251 thousand), advertising costs in the amount of 17 thousand (previous year: 152 thousand) and passedon expenses in the amount of 85 thousand (previous year: 117 thousand). The financial result increased from 5,462 thousand to 7,88 thousand in the past year. Net interest income decreased slightly, from thousand to thousand, while net income from investments rose from 5,246 thousand to 7,722 thousand. This was mainly due to higher income from profit transfer agreements in the amount of 5,14 thousand (previous year: 1,15 thousand). Income from investments decreased to 3,593 thousand (previous year: 4,231 thousand). Income from ordinary activities amounted to 4,596 thousand (previous year: 3,864 thousand). The net profit for the year under review amounted to 4,486 thousand (previous year: 3,67 thousand). Assets and Financial Position In the year under review, the balance sheet total of Deufol AG increased from 16.2 million to 12.5 million. Fixed assets rose slightly, from 13.7 million to 16. million, while current assets increased from 2.4 million to 13.8 million due to the strong increase in receivables from affiliated companies. Depreciation on property, plant and equipment and amortization on intangible assets amounted to 269 thousand (previous year: 258 thousand), investments to 224 thousand (previous year: 221 thousand). Investments in financial assets amounted to 1,264 thousand (previous year: 898 thousand). Taxes Annual net profit
58 56 Management Report Position of Deufol AG Sales and Results of Operations On the liabilities side, equity was affected by the dividend payment ( 1.3 million) and the Deufol AG: Balance sheet figures as % of the balance sheet total Fixed assets of which financial assets Current assets Balance sheet total Equity net profit for the year (+ 4.5 million) and increased from 78.2 million to 81.5 million. As of December 31, 211, the equity ratio had nonetheless decreased from 73.7 % to 67. %. Accruals increased to.9 million (previous year:.7 million). Liabilities rose from 27.2 million to 38.1 million, mainly due to the new financing structure and increased liabilities to affiliated companies Provisions.8.7 Liabilities Cash flow statement Deufol AG figures in thousand Annual net profit 4,486 3, (1,863) of which financial liabilities Balance sheet total The following cash flow statement shows the financial position of Deufol AG: Depreciation / appreciation (Gain) loss from disposal of property, plant and equipment Other noncash revenue / expenses Increase (decrease) in accruals 198 (767) Net changes in working capital (6,621) 7,969 Net cash provided by operating activities (1,291) 9,3 (224) (221) (1,263) (7,38) Purchase of intangible assets and property, plant and equipment Purchase of financial assets Proceeds from the sale of property, plant and equipment Net cash used in investing activities (1,462) (7,62) Proceeds from borrowings 24,5 2,427 (18,715) (4,443) (2,161) Proceeds from the sale of financial assets Repayment of borrowings Payments resulting from loans Noncash valuation adjustments on financial assets Dividend paid Net cash used in financing activities Change in cash Cash at the beginning of the period Cash at the end of the period 1,11 (1,313) 3,322 (2,16) 569 (48) The payments made for the acquisition of financial assets in the previous year include an amount of 7. million for the purchase of Deufol Tailleur GmbH.
59 57 24 Business and Economic Environment 33 Corporate Governance 44 Results of Operations, Financial and Asset Position 55 Position of Deufol AG 57 Risk Report 62 Report on Dependence, Post-Balance-Sheet Date Events and Expected Developments
60 58 Management Report Risk Report Risk Policy Risk Management Risk Controlling Risk Report Risk Policy The role of Deufol AG is to act as a management holding company for subsidiaries which provide services in Germany and elsewhere, focusing on packaging. As part of its holding tasks, Deufol AG provides the resources required for risk management and monitors implementation of risk-policy and risk-management procedures on an ongoing basis. Corporate management and control, corporate governance, the by-laws and the risk policy are coordinated within the Deufol Group. Exposure to risks is unavoidable in our efforts to achieve long-term success by taking advantage of opportunities in our services divisions and regions in an environment of constantly changing requirements and challenges. These are carefully examined and assessed on the basis of a risk / opportunity calculation. Our corporate and business strategy is to concentrate operational activities and the risks associated with them within separate legal entities in order to insulate the rest of the Group from possible negative influences. The core risks are monitored on an ongoing basis and suitable measures are implemented to reduce them. The core risks comprise, in particular, risks associated with the Company s current and future business situation. Risks include potential losses of customers due to relocations of packaging-related production locations or insufficiently rigorous development of market leadership in core business fields. Noncore and residual risks are accepted provided they can be specifically identified and mapped. Noncore risks are externalized (force majeure, liability to third parties for loss or damage, etc.). In particular, corporate governance guidelines (incl. the Deufol AG by-laws) and the active monitoring of subsidiaries as the parent company ensure that the deliberate acceptance of risks proceeds in a transparent and controlled fashion. The Executive Board of Deufol AG considers a highly-developed awareness of risk in all business divisions indispensable for the success of its risk policy. Awareness of existing and potential risks is an important element of business management. Due to the various risk areas and the different ways in which risks are applicable within the individual subsidiaries, this increased awareness is vital for successful implementation of risk policy. Risk Management All activities of subsidiary companies are supported by an integrated risk management system without exception. The purpose of risk management activities is firstly to ensure that statutory requirements are complied with, and secondly to promote value-oriented management of individual subsidiaries and thus of the Deufol Group as a whole. According to the December 31, 211 risk inventory, the system covers around 99.5 % (previous year: approx %) of subsidiary risks as measured against Group sales. The risk management system was audited in connection with the auditing of the annual financial statements. Risk Controlling Risks are identified by managing directors or site managers applying the following ten risk categories: strategy / planning, market / sales, procurement, service provision, finance, personnel, IT, contracts / legal, communication, and other. The managing directors and site managers receive regular training to help them identify risks.
61 Risk Report Risk Controlling Specific Risks The responsible managers document the risks identified in risk maps on a quarterly basis. Aggregation is subsequently implemented at Group level and the Executive Board receives a quarterly report. Risk measurement is standardized throughout the Group. Risks identified in risk maps are assessed by the companies local or site managers in terms of probability of occurrence and amount of potential loss, in the context of the gross risk level. Individual risks are assigned quantitative values requiring response upon reaching specific limits. The net risk level is subsequently evaluated following implementation of the measures. Measures taken to control identified risks are subject to regular on-site monitoring as to their effectiveness. The Executive Board additionally supervises risk identification procedures conducted by individual subsidiaries in the course of regular visits. Specific Risks Environment Risks For 212, we expect that the overall economic trend will be weaker than in the previous year. Detailed commentary on the outlook for the economy is provided on pages 63 ff. of the Report on Expected Developments. Raw materials prices, and oil prices in particular, may also pose a specific risk. A further rise would likely place a drag on the global economy. Increasing purchasing costs would result, potentially coupled with falling demand affecting sales in key markets for our Group such as our export-oriented mechanical and plant engineering business, which might then affect our business further down the line. Acquisition and Investment Risks Acquisition and investment decisions intrinsically involve complex risks as they tie up substantial capital on a long-term basis. Such decisions can only be made on the basis of specific, predefined terms governing responsibilities and approval requirements. Performance-Related Risks Sales and earnings of the subsidiaries are largely dependent on a relatively small number of business relationships with larger customers. Customers come from different industries (e. g. Procter & Gamble represents the consumer goods sector, VW the automotive industry and Siemens plant engineering), creating a certain risk diversification effect in addition to the fact that different, unrelated services are performed for one and the same customer. A primary objective of the Deufol Group is to promote customer loyalty, for example, through joint process and efficiency improvement projects with our customers, and while maintaining a high level of customer commitment. The acquisition of smaller customers is also important in order to broaden our customer base. The structuring of contracts with customers also poses certain risks, such as where amortization periods for investments exceed the initial contract term. Older contracts only allow limited reaction to quantitative or qualitative changes affecting our business. At the same time, price adjustment clauses are not always adequate for promptly passing on unexpected procurement price increases for raw materials (e. g. wood) to customers. Management Report 59
62 6 Management Report Risk Report Specific Risks Personnel Risks A major part of the business success of the Deufol Group rests upon the skills and qualifications of its employees and the motivation of the managerial staff of our corporate subsidiaries. For this reason, employees undergo regular training in order to ensure that the quality of the services provided meets customer requirements. Employees at all levels of the Company are being progressively sensitized to risk issues to ensure compliance with risk policy. Senior management remuneration packages have been systematically restructured to emphasize variable, performance-related components such as bonuses as an incentive for reaching targets. External contractors are utilized in some cases, particularly in view of the legal environment in certain countries. This allows managing phases of increased business activity without having to take on permanent employees, creating the potential for capacity underutilization later on. Nearly all subsidiaries are now run by managers with close ties to Deufol and an entrepreneurial attitude. The risk of loss of know-how through the departure of key personnel is limited through documentation of relevant know-how and its possession by multiple persons by virtue of the decision-making process structure. IT Risks In principle, possible IT risks may result from the failure of networks or the falsification or destruction of data through operating or programming errors. However, the IT infrastructure of the Deufol Group is in line with the Group s decentralized structure. There are therefore only isolated IT risks in the individual units and there are no Group-wide risks. The individual companies have extensive protection measures such as virus-protection concepts, firewalls and emergency and recovery plans as well as additional external back-up solutions in accordance with specific requirements. Financial Risks Various financing groups exist within the Deufol Group. In 211, the Deufol Group restructured significant elements of its financing. In Germany, it concluded a variable-interest syndicated financing arrangement with a volume of 45 million and a term of four years. This largely refinanced existing liabilities. In the USA, existing short-term financing agreements were replaced with a financing arrangement with a three-year term. Within the Group, credit agreements are mainly tied to compliance with financial ratios ( covenants ). A violation of the covenants provides the banks with a right to terminate an agreement but does not automatically trigger a repayment obligation. In addition, the agreed credit margin and thus the Group s financing costs may be increased in case of a deterioration in the ratios. Interest-rate-derivative contracts are still in place for managing and limiting interest rate risk in connection with medium-term financing. These are directly assigned to specific debt positions as cash flow hedges (see Other Disclosures, page 115).
63 Risk Report Specific Risks Overall Group Risk Position The risks resulting from exchange-rate fluctuations only apply within the scope of consolidation as a result of the conversion of the annual financial statements of companies outside the euro currency zone. Exchange rates have only a marginal effect on operating business. In the single-entity financial statements, currency risks exclusively apply for transactions with subsidiaries outside the euro currency zone. Please see the Financial Risk Management section (Note 42 on pages 114 ff.) for further information on financial risks. The Group has recognized goodwill in consequence of its expansion strategy. Impairment testing pursuant to IAS 36 may necessitate goodwill amortization / impairment. The impairment testing implemented in 211 did not identify any amortization / impairment requirement. Legal Risks The Deufol Group is exposed to general legal risks resulting from its business activities and from tax affairs. It is not possible to state with any certainty the outcome of currently pending or future proceedings, so that expenses may result due to judicial or official rulings or settlements such as are not covered or are not fully covered by insurance benefits and which may significantly affect our business operations and earnings. Please see the Contingencies and Contingent Liabilities section (Note 36 on page 113) for further information on legal risks. Overall Group Risk Position In summary, as in the previous year, no operational or financial risks are currently identifiable which potentially jeopardize the continued existence of the Group as a going concern. The Group structure entailing a wide range of services offered in a variety of sectors and regions under a management holding company has proven effective from a risk standpoint. Operating risks for individual subsidiaries are covered through appropriate insurance protection as far as possible. The risk management system is being continually upgraded and enhanced to allow risks to be identified at an early stage and appropriate countermeasures to be taken. Management Report 61
64 62 24 Business and Economic Environment 33 Corporate Governance 44 Results of Operations, Financial and Asset Position 55 Position of Deufol AG 57 Risk Report 62 Report on Dependence, Post-Balance-Sheet Date Events and Expected Developments
65 Report on Dependence, Post-Balance-Sheet Date Events and Expected Developments Planned Orientation and Strategic Opportunities for the Group Report on Dependence Since there is no control agreement with the majority shareholder, pursuant to section 312 of the German Stock Corporation Act the Executive Board of Deufol AG was obliged to prepare a report on Deufol AG s relationships with associates. This report covers the relationships with Lion s Place GmbH and its majority shareholder, Detlef W. Hübner, as well as the companies of the Deufol Group. The Executive Board declares pursuant to section 312 (3) of the German Stock Corporation Act: With regard to the legal transactions listed in the report on Deufol AG s relationships with associates, for each such transaction our Company has received an appropriate counterperformance in accordance with the known circumstances at the time of its execution. No disadvantageous events for the Company occurred during the fiscal year such as are subject to a reporting obligation. Report on Post-Balance-Sheet Date Events Deufol AG wishes to report the following significant events after the balance sheet date pursuant to IAS 1. On April 4, 212, the Executive and Supervisory Boards of Deufol AG, Hofheim, filed charges with the Frankfurt am Main public prosecutor s office versus persons including the former managing director of the subsidiary Deufol Tailleur GmbH and the former Chairman of the Executive Board of Deufol AG. The Frankfurt am Main public prosecutor s office has now initiated preliminary proceedings. Deufol AG already parted ways with these persons in late 211. In the period from 26 to 211, they are suspected of having acted in business dealings to the detriment of the Deufol Group. The damage is a low eight-figure euro amount. As well as the criminal proceedings which are now underway, Deufol AG will also assert compensation claims in a civil action. The Company is confident in its ability to enforce these compensation claims. Report on Expected Developments Planned Orientation and Strategic Opportunities for the Group The Deufol Group will maintain its structure as a management holding company for risk limitation purposes. In this way, we will also preserve our on-site flexibility and will be able to better satisfy the different requirements of various markets and regions. However, at the same time we are strengthening our Company s headquarters in Hofheim (Wallau) as the key organizational unit for overall control functions. By bringing together areas such as personnel and financial accounting, we are pooling resources in order to realize transparency and efficiency in our overall operations. This pooling enables our dispersed packaging locations to focus on core business and on purely operational activities. Management Report 63
66 64 Management Report Report on Dependence, Post-Balance-Sheet Date Events and Expected Developments Planned Orientation and Strategic Opportunities for the Group Economic Outline Conditions In particular, among the strategic opportunities which this offers for a corporate group is that we are able to exploit the advantages of our size as a significant market player. We have already initiated the development of a strategic central purchasing system with an optimized procurement process as a key measure. The process of working toward a single brand continues. As a global premium service provider in the field of packaging and related services, we offer our clients who are active worldwide holistic solutions which support their strategies. We are constantly expanding our business divisions to include additional services to complement packaging, as well as proprietary software solutions which intelligently round off the packaging process to provide a valuable range of services. We thus offer our customers real added value and meet their continuously increasing requirements. At the same time, we are consolidating our position as our customers increasingly focus on just a few core service providers. In the past year, through our multiple-location approach we have achieved significant progress in the continuing development of our business divisions. Our operations in Charlotte, USA, and Suzhou, China, are the starting-point for our plans to gradually develop Export & Industrial Packaging outside of Europe. Conversely, we are strengthening our Data Packaging business in the USA and also intend to establish this packaging concept in Europe. Economic Outline Conditions Slightly Stronger Global Economic Growth According to the Kiel Institute for the World Economy, the outlook for the world economy has stabilized since late 211. Confidence indicators have now regained equilibrium on a broad front, for both companies and consumers, and growth in important regions of the world economy is improving. However, there are some factors which hinder a strong upturn in the global economy. Besides the dampening effect of the consolidation of many countries budgets and the continued lowering of the private sector s debt burden in many advanced economies, the further rise in oil prices is a source of additional strain. In these circumstances, output growth in the advanced economies will be restrained in the first half of 212 and thereafter pick up only gradually. The Eurozone is likely to come out of recession in the course of this year but its economic recovery will initially lack buoyancy. In the United States, the increase in overall economic output remains moderate, with growth rates of around 2 % in the forecast period. In overall terms, the Kiel Institute for the World Economy predicts an increase of 1.2 % this year in the advanced economies gross domestic product, compared to 1.6 % last year. In 213, the output growth trend should improve slightly, but at 2 % it will still be moderate by historical standards. It is hardly likely to be enough to reduce unemployment. Economic activity in the emerging markets will remain curbed by the advanced economies weak economic growth in the forecast period. Over the next few months, these markets internal economic impetus will strengthen, however, supported by a more expansive monetary policy and diminishing uncertainty regarding the outlook for the advanced economies. Accordingly, gross domestic product growth rates should generally remain strong in 212 and improve almost everywhere in 213.
67 Report on Dependence, Post-Balance-Sheet Date Events and Expected Developments Economic Outline Conditions In the opinion of the Kiel Institute for the World Economy, in 212 global output should only grow by 3.4 %, compared to 3.8 % in the past year. For 213, a slightly stronger rise of 3.9 % is predicted. World trade should initially realize only weak further growth, before gradually improving over the course of this year and in 213. In 212, growth is expected to average 5 %, significantly below the medium-term average. For 213, the Kiel Institute for the World Economy predicts a rise of 6.5 %. Mild Recession in the Eurozone According to the Kiel Institute, at the beginning of this year the Eurozone economy is on a downward trend. However, the sentiment indicators point to a mild recession which should be over by the middle of the year. At the same time, the pace of economic recovery is likely to remain moderate, reflecting the dampening effect of the continuing consolidation of government finances and the unfavorable domestic economic climate. Assuming a gradual easing of the sovereign debt crisis over the course of the year, the Kiel Institute predicts for the Eurozone a slight fall in overall economic output of.2 % for the current year and a rise of 1.1 % for 213. In the Eurozone excluding Germany, the trend will likely be weaker and its gross domestic product is predicted to decline by.6 % in 212. In view of the weak economic trend this year, inflation should weaken over the course of the year and average 2.2 %, while in the coming year it should amount to 1.8 %. Unemployment is likely to once again rise in the forecast period. In 212, it will average approx. 1.9 % and is likely to increase to 11.2 % in 213. The Eurozone s budget deficit will this year probably fall to 3.4 % of its gross domestic product. In the Eurozone excluding Germany, it will remain significantly higher, at 4.4 %. In the coming year, this figure should fall to 2.7 % and in the Eurozone excluding Germany to 3.4 %. Germany Overcomes Economic Slowdown Last autumn, the German economy entered a weak phase which the Kiel Institute for the World Economy now considers it to have overcome. Sentiment indicators have pointed upward for four months now and industrial output has also recently improved. With only a slight decline in overall economic output of.7 % (annual rate), a clear collapse was avoided in the final quarter of the past year. For the first three months of this year, the researchers predict an improvement in economic performance of.6 %, which would mean that economic activity more or less stagnated during the autumn and winter. Due to the weak start to the year, in overall terms the Kiel Institute for the World Economy expects gross domestic product growth of.7 % for 212 (adjusted for the number of working days:.9 %). Next year, this growth rate should rise to 1.9 %. Management Report 65
68 66 Management Report Report on Dependence, Post-Balance-Sheet Date Events and Expected Developments Economic Outline Conditions Company-Specific Outlook In the reporting period, the German economy suffered due to the weak export situation in particular, on account of the recession in several other Eurozone countries, as well as the slowdown in growth in some emerging markets. In several countries, sentiment no longer deteriorated and even improved slightly in some cases. Over the course of the year, exports should gradually pick up. In terms of annual averages, growth will be weak at 2.2 % but may be close to the 5 % mark in the following year. Imports should grow slightly more strongly than exports, at 3.5 % (212) and 5.7 % (213), and foreign trade will thus provide a negative growth contribution in both years, corresponding to.5 percentage points (212) and.2 percentage points (213), respectively. Domestic demand is the key factor for the German economy in the forecast period. Besides the cyclical momentum the interest-rate level, which is extremely low for Germany, should provide the upturn in investments with additional impetus. Housing construction in particular will continue to grow strongly, not least due to the favorable financing terms. Stimulated by a highly robust labor market trend, private consumption should rise by.7 % this year and by 1.1 % next year. A clear increase in consumer prices is expected for this year and the next, amounting to 2.5 % and 2.4 %. While the rise in energy prices, which has already occurred, will continue to drive up prices, in the remainder of the forecast period price buoyancy will increasingly shift to domestic factors. With only a weak productivity trend, unit labor costs will rise by 3.4 % this year and by 2.4 % next year. The Kiel economists expect the consolidation of public finances to continue this year. The overall government deficit should shrink to.7 % of output, compared to 1 % in the past year. However, in the coming year the consolidation strategy will falter and hardly any progress will be made in reducing the deficit despite the favorable economic environment. Company-Specific Outlook Predicted Sales and Results of Operations In view of a weaker economic environment for the fiscal year 212, the Deufol Group plans sales in a corridor between 315 million and 33 million. The operating result (EBITA) should amount to between 12 million and 14 million. With regard to the sales trend, we predict a clear increase in the USA, driven by the growth of Data Packaging. In Germany and the Rest of Europe, we predict stable or slightly falling sales. In terms of our results forecast, we predict a significant improvement in business in the USA. In line with our sales planning, this will mainly be provided by our Data Packaging division. In Germany, we expect all of our services to report significantly improved results. For the Rest of Europe, we envisage stable or slightly falling results. For 213, if the economic recovery continues, we expect to see a positive sales and income trend. The proposal for payment of a dividend for fiscal year 212 will be decided on in accordance with the result of the single-entity financial statements.
69 Report on Dependence, Post-Balance-Sheet Date Events and Expected Developments Company-Specific Outlook Expected Financial Position At present, current business activities do not on balance require external financing. Our financial resources secure our existing liquidity requirements and provide room for organic growth. If our business performance matches our forecasts, we expect to see a significant decrease in our net financial indebtedness in the current fiscal year. In the current year, a good 1 million of investments in property, plant and equipment is planned; this corresponds to an investment quota (investments in property, plant and equipment in relation to sales) of approx. 3 % of sales. The planned investments are thus higher than those in fiscal year 211 ( 7.3 million). They will be financed through the net cash provided by operating activities. In the event of acquisitions, it may be necessary to borrow additional external funds. Executive Board s Overall Summary of the Group s Expected Development In the next few years, the Deufol Group will continue to develop its profile as a packaging services provider. This is also compatible with our clear brand profile among new and existing customers. We expect to reinforce our market position through our uniform profile under the DEUFOL brand. Our broad customer base and many years of business relationships, our specific know-how and our financial resources enable us to maintain a confident outlook regarding the Group s further development. This means that we expect a positive trend for the Group over the next few years. Management Report 67
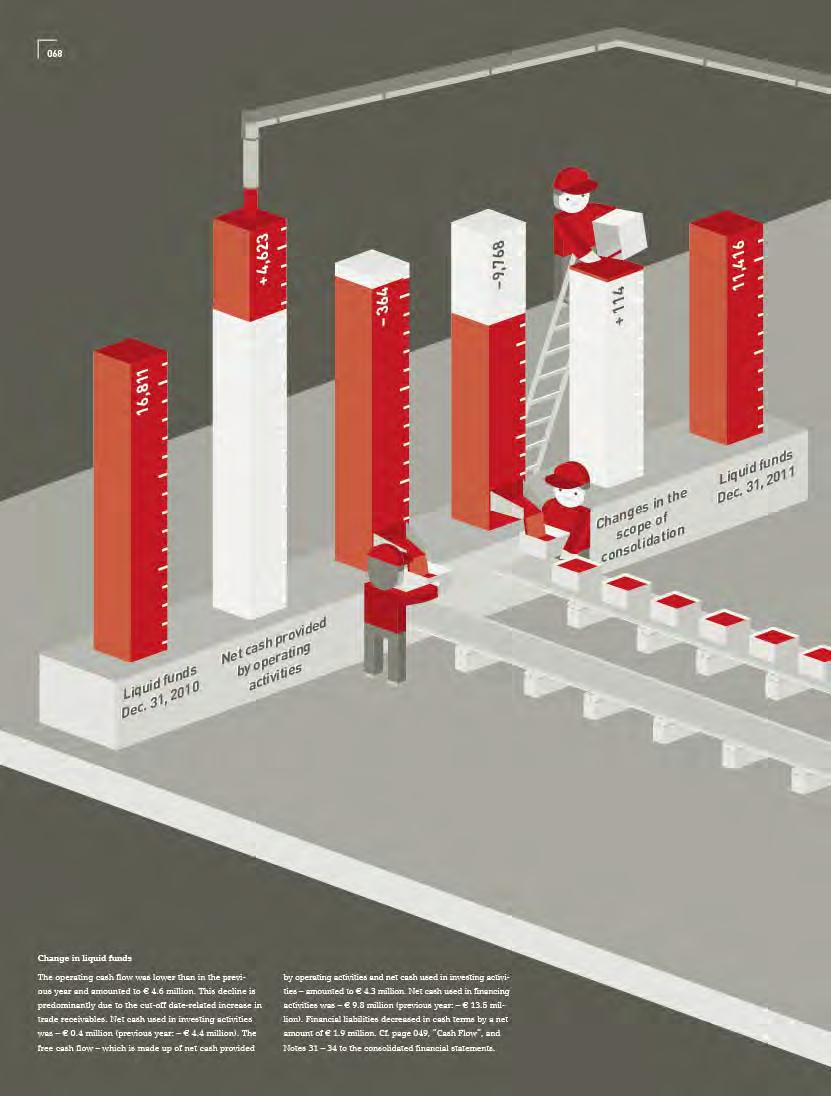
70

71
72 7 Consolidated Financial Statements Consolidated Income Statement Statement of Total Comprehensive Income Consolidated Financial Statements as of December 31, 211 Consolidated Income 211 Statement figures in thousand Sales 21 adjusted* Note / Page 1 / ,19 33,26 Cost of sales (281,538) (264,325) Gross profit 33,652 38,71 Selling expenses General and administrative expenses 2 / 92 (5,63) (5,97) 3 / 92 (2,747) (2,369) 4 / 93 Other operating income 4,36 2,568 5 / 93 Other operating expenses (1,489) (3,126) 6 / 93 Profit from operations (EBIT) 1,713 11,867 Financial income 2,14 1,496 7 / 94 (6,35) (6,434) 7 / / 94 7,382 7,532 (3,51) (2,998) 3,872 4,534 (3,261) (1,227) Income for the period 611 3,37 of which income attributable to noncontrolling interests ,927 Basic and diluted earnings per share, based on the profit (loss) attributable to common shareholders of Deufol AG.2.67 Basic and diluted earnings per share, based on the profit (loss) from continuing operations attributable to common shareholders of Deufol AG / Note / Page Income for the period 611 3,37 Other recognized income and expense 498 1, ,19 Finance costs Share of profit of associates Earnings before taxes (EBT) from continuing operations Income taxes Income from continuing operations Loss from discontinued operation (net of tax) of which income attributable to equity holders of parent 8 / 94 9 / 96 1 / 97 Earnings per share in 11 / 97 * Concerning the adjustment of the previous year s figures, see the explanation on page 96. Statement of Total Comprehensive Income figures in thousand Exchange rate differences on translation of foreign operations Before tax Tax After tax 253 1,19 Gain (loss) on cash flow hedges Before tax Tax After tax Total comprehensive income after tax (11) (81) ,19 4,68 of which attributable to noncontrolling interests of which attributable to equity holders of parent 587 4,228
73 Consolidated Balance Sheet Consolidated Balance Sheet Consolidated Financial Statements Assets Dec. 31, 211 Dec. 31, ,66 15,136 48,155 51, / / 98 68,612 67, / 98 Other intangible assets 2,778 2, / 98 At-equity-method-accounted investments 2,794 2,74 15 / 99 Financial receivables 8,339 9, / 12 Other financial assets ,237 3, / 12 Deferred tax assets 11,114 1,82 8 / 94 Current assets 86,689 76,746 Inventories 12,276 12, / 13 Trade receivables figures in thousand Noncurrent assets Property, plant and equipment Investment property Goodwill Other receivables and other assets Note / Page 49,37 37, / 13 Other receivables and other assets 8,664 5,93 17 / 12 Tax receivables 1,356 1,532 Financial receivables 1,953 2,31 16 / 12 11,416 16,811 2 / 14 1, / , ,882 Dec. 31, 211 Dec. 31, 21 Equity 98,336 98,976 Equity attributable to equity holders of Deufol AG 97,79 97,85 Cash and cash equivalents Assets classified as held for disposal Total assets Equity and Liabilities figures in thousand Subscribed Capital Note / Page 43,774 43, / 14 Capital reserves 17,24 17,24 23 / 15 Retained earnings (accumulated losses) (52,431) (51,27) Other recognized income and expense (1,54) (2,2) 1,257 1,171 Noncurrent liabilities 59,361 44,722 Financial liabilities 49,38 37,13 26 / 16 3,885 1, / / 11 Other liabilities 3,15 3, / 111 Deferred tax liabilities 2,643 2,56 8 / 94 Current liabilities 75,652 83,184 Trade payables 28,971 25,926 3 / 111 Financial liabilities 3,312 41,83 26 / 16 Other liabilities 13,519 12, / 111 Tax liabilities 1,673 1,615 Other provisions 1,177 1, , ,882 Equity attributable to noncontrolling interests Provisions for pensions Other provisions Total equity and liabilities 24 / / 11 71
74 72 Consolidated Financial Statements Consolidated Cash Flow Statement Consolidated Cash Flow Statement Income (loss) from operations (EBIT) from continuing operations 1,713 11,867 Income (loss) from discontinued operation (3,261) (1,227) Depreciation and amortization charges 9,156 9,391 13, 14 / 98 (Gain) loss from disposal of property, plant and equipment (319) (115) 5, 6 / 93 (118) figures in thousand Note / Page Adjustments to reconcile income (loss) to cash flows from operating activities (Gain) loss from sale of investments Other noncash expenses (revenue) Taxes paid 2,53 (3,137) (3,789) (1,863) 6, (793) (2,885) 43 Changes in assets and liabilities from operating activities Change in trade accounts receivable Change in inventories Change in other receivables and other assets Change in trade accounts payable 2,875 (64) 688 (589) Change in accrued expenses (829) (1,162) Change in other operating assets / liabilities (net) (144) (252) Net cash provided by (used in) operating activities 4,623 19,924 (6,173) (4,275) 1, Change in other liabilities Purchase of intangible assets and property, plant and equipment Proceeds from the sale of intangible assets and property, plant and equipment Dividends received (7,35) Payments for the purchase and the sale of subsidiaries (15) Net change in financial receivables 1,793 4,355 Interest received 1,991 1,474 (364) (4,419) Purchase of noncontrolling interests Net cash provided by (used in) investing activities Net change in borrowings 17 (2,294) Net change in other financial liabilities (1,987) (4,296) Interest paid (6,139) (6,547) Dividends paid (1,313) (436) (49) (9,768) (13,546) 114 (1) Dividends paid to noncontrolling interests Net cash provided by financing activities Effect of exchange rate changes and changes in the scope of consolidation on cash and cash equivalents Change in cash and cash equivalents (5,395) 1,958 Cash and cash equivalents at the beginning of the period 16,811 14,853 Cash and cash equivalents at the end of the period 11,416 16, / / / / / 112
75 Consolidated Statement of Changes in Equity Consolidated Financial Statements Consolidated Statement of Changes in Equity* 43,774 (2,57) (733) 93,857 1,27 Total equity Equity attributable to noncontrolling interests (53,854) Equity attributable to equity holders of Deufol AG 17,24 Reserve for cash flow hedges Cumulative translation adjustment Accumulated losses Balance at Dec. 31, 29 Capital reserves figures in thousand Subscribed Capital Other recognized income and expense 95,127 Income (loss) 2,927 2, ,37 Changes recognized directly in equity 1, ,382 1,382 Deferred taxes for valuation changes recognized directly in equity (81) (81) (81) Total recognized income and expense 2,927 1, , ,68 Purchase of noncontrolling interests (28) (28) (7) (35) Dividends (49) (49) 43,774 17,24 (51,27) (1,461) (541) 97,85 1,171 98,976 Balance at Dec. 31, 21 Income (loss) Changes recognized directly in equity Deferred taxes for valuation changes recognized directly in equity (11) (11) (11) Total recognized income and expense ,19 Dividends Balance at Dec. 31, 211 * Cf. Notes (22) (24) to the consolidated financial statements (1,313) (1,313) (436) (1,749) 43,774 17,24 (52,431) (1,28) (296) 97,79 1,257 98,336 73
76 74 Consolidated Financial Statements Notes to the Consolidated Financial Statements General Information Basis of Preparation Notes to the Consolidated Financial Statements For the fiscal year from January 1, 211 to December 31, 211 General Information Deufol Aktiengesellschaft, domiciled in Hofheim am Taunus, was established by way of a notarial instrument dated October 26, The Company was entered in the Frankfurt am Main commercial register under the number HRB on December 22, The Articles of Association were adopted on October 26, 1998 and last amended on November 15, 21. Deufol is a global premium service provider in the field of packaging and additional services. Please see the disclosures in the segment reporting for further details. The address of the Company s registered office is Johannes-Gutenberg-Strasse 3 5, Hofheim, Germany. The Company s shares are traded on the Regulated Market of the Frankfurt Stock Exchange. Lion s Place GmbH is the parent company which prepares the consolidated balance sheet for the largest group of companies. The Executive Board approved the IFRS consolidated financial statements on April 2, 212 so that they could then be forwarded to the Supervisory Board. Basis of Preparation Deufol AG prepares its consolidated financial statements in accordance with the International Financial Reporting Standards (IFRS) as mandatorily applicable in the European Union. In addition, the provisions of section 315a (1) of the German Commercial Code (HGB) are complied with and applied in the preparation of the consolidated financial statements. All IFRSs (IFRSs, IASs, IFRICs, SICs) as adopted by the European Union and mandatorily applicable as of the balance sheet date were applied. In principle, the consolidated financial statements are prepared using the historical cost concept. This excludes derivative financial instruments and financial assets available for sale, which are measured at fair value. Consolidation All subsidiaries over which Deufol AG has legal or practical control are included in the consolidated financial statements. In addition to Deufol AG, the consolidated financial statements include 23 (previous year: 25) fully consolidated subsidiaries in Germany and 14 (previous year: 12) in other countries (hereinafter referred to as the Deufol Group or the Group ). Joint ventures are included in the consolidated financial statements using the at-equity method in accordance with IAS 31 in combination with IAS 28. Other significant equity investments are accounted for using the at-equity method if the Deufol Group does not hold a controlling interest, but is able to exert a significant influence on the operating and financial policies of the investee. This is always the case if it holds between 2 % and 5 % of the voting rights ( associates ). On acquisition of an equity investment accounted for using the at-equity method, the difference between cost and proportionate equity is initially allocated to the assets and liabilities of this investment by making certain adjustments to the fair values. Any remaining excess of cost of acquisition over net assets acquired is recognized as goodwill, and is not amortized. If the recoverable amount of an investment in an associate (the higher of its value in use and its fair value less costs to sell) falls below the carrying amount, this will lead to a corresponding impairment. The impairment loss will be recognized in the income statement. The annual financial statements of consolidated companies are prepared as of the reporting date of the consolidated financial statements. Acquisition accounting is performed in accordance with the purchase method, whereby the cost of the acquired interests is eliminated against the parent s share of the revalued equity at the date of acquisition. Any resulting difference is allocated to the corresponding assets and liabilities of the subsidiary insofar as it is due to hidden reserves or hidden liabilities. Any remaining excess of cost of acquisition over net assets acquired is recognized as goodwill. In accordance with IFRS 3 (Business Combinations) in combination with IAS 36 (Impairment of Assets), goodwill is not amortized over the expected useful life, but instead tested at least annually to establish whether there is any need to recognize impairment losses.
77 Notes to the Consolidated Financial Statements Consolidated Financial Statements Basis of Preparation Noncontrolling interests represent the share of net profit / loss and net assets that is not attributable to the Group. They are reported separately in the consolidated income statement and the consolidated balance sheet. They are reported on the face of the consolidated balance sheet as a separate component of equity from the equity attributable to the shareholders of the parent company. Intercompany receivables and liabilities, revenue, expenses, income and profits are eliminated as part of consolidation. Currency Translation The consolidated financial statements are prepared in euros, the functional and presentation currency of the Deufol Group. Unless indicated otherwise, all amounts are given in thousands of euros. Each company within the Deufol Group determines its own functional currency. The annual financial statements of the foreign subsidiaries included in the consolidated financial statements whose functional currency is not the euro were converted into the Group currency (euro) on the balance sheet cut-off date pursuant to IAS 21 in accordance with the functional currency concept. Financial statements are translated using the modified-closing-rate method, i. e. balance sheets are translated from the functional currency to the reporting currency at the middle rate on the balance sheet date, while income statements are translated at the average rates for the year. The equity is translated at historical rates. Differences resulting from the translation of assets and liabilities compared with the translation of the previous year and translation differences between the income statement and the balance sheet are taken directly to equity and are reported under Other recognized income and expense. When a foreign operation is disposed of, the cumulative amount recognized in equity for this foreign operation is reversed to the income statement. Foreign-currency transactions are translated at the spot rate of the foreign currency to the functional currency prevailing at the transaction date. Foreign-currency monetary assets and liabilities are translated at the rate on the balance sheet date. The resulting foreign exchange differences are recognized in profit or loss for the period, with the exception of foreign exchange differences resulting from foreign-currency loans insofar as the loans are used to hedge a net investment in a foreign operation. These are recognized directly in equity until the net investment is disposed of and only recognized in profit or loss on the date of disposal. The exchange rates for the translation of key currencies that are not part of the European Monetary Union changed as follows: Foreign currency per US dollar Renminbi Czech crown Sales Recognition Middle rate as of the balance sheet date Average rate for the year Sales are primarily generated from services, products and rental agreements. Sales resulting from the provision of services and from third-party use of assets of the Company will only be recognized where it is sufficiently probable that the economic benefits associated with the transaction will flow to Deufol and the amount of income can be measured reliably. Sales resulting from selling of goods will be recognized where the key risks and opportunities associated with ownership of the sold merchandise and products have been transferred to the purchaser, Deufol does not retain any right or power of disposal for the sold merchandise and products, the amount of sales can be measured reliably, it is sufficiently probable that the economic benefits associated with the transaction will flow to Deufol and the costs resulting in connection with the sale can be measured reliably. Sales are recognized net of purchase price reductions such as cash and sales discounts and rebates. 75
78 76 Consolidated Financial Statements Notes to the Consolidated Financial Statements Basis of Preparation Cost of Sales The cost of sales comprises the costs of the products and services sold. As well as direct material and manufacturing costs, it also includes indirect overheads such as depreciation of manufacturing equipment, amortization of certain intangible assets and write-downs on inventories. The cost of sales is recognized in the income statement in accordance with the realization of sales. Earnings per Share Earnings per share (EPS) are calculated in accordance with IAS 33. Basic earnings per share are calculated by dividing the net profit / loss for the period attributable to the holders of common shares of the parent company by the weighted average number of common shares in circulation. Shares newly issued or repurchased during a period are included pro rata for the time they are in circulation. Diluted earnings per share are calculated by dividing the adjusted net profit / loss for the period attributable to the holders of common shares of the parent company by the weighted average number of common shares in circulation and the weighted average number of common shares that would be issued following the conversion of all potential common shares with a dilutive effect into common shares. Intangible Assets and Goodwill Purchased intangible assets with finite useful lives are recognized at cost and amortized on a straight-line basis over their economic lives. Capitalized software licenses are amortized over their expected useful life of three to eight years or over the term of the relevant agreement. The amortization recognized is allocated to the relevant functions in the income statement based on the asset s use. If there are indications of impairment and the recoverable amount is less than amortized cost, impairment losses are recognized on the intangible assets. If the reasons for impairment cease to apply, the impairment losses are reversed accordingly, up to the amortized cost. This does not apply to capitalized goodwill. Goodwill is recognized in accordance with IFRS 3 (Business Combinations) in conjunction with IAS 36 (Impairment of Assets). These standards require goodwill to be tested annually for impairment rather than amortized. The accounting principles for intangible assets are as follows: Amortization method used Useful life Remaining useful life Customer relationships Licenses and software Straight-line Straight-line 5 years 3 8 years 1 4 years up to 8 years Amortization of intangible assets is included in the cost of sales as well as the general and administrative expenses and the selling expenses. Property, Plant and Equipment Property, plant and equipment is carried at cost less straight-line depreciation recognized over the economic life of the respective item. Assets are removed from the balance sheet on disposal or scrapping; any disposal gains or losses are recognized in income.
79 Notes to the Consolidated Financial Statements Consolidated Financial Statements Basis of Preparation The following useful lives are used for depreciation: Useful lives of property, plant and equipment Factory and office buildings 1 5 years Operating and office equipment 3 1 years Machinery and equipment 6 2 years Vehicle fleet 5 7 years If there are indications of impairment and the recoverable amount is less than amortized cost, impairment losses are recognized on the items of property, plant and equipment. If the reasons for impairment cease to apply, the impairment losses are reversed accordingly, up to the amortized cost. More complex items of property, plant and equipment consisting of clearly separable components with different useful lives are split into these components for the purposes of calculating depreciation. Depreciation is calculated using the useful lives of the individual components. Investment Property Investment property as defined by IAS 4 is carried at depreciated cost and, if applicable, depreciated on a straight-line basis over the same useful lives used for items of property, plant and equipment of the same type. The fair value of investment property is determined using recognized valuation techniques or on the basis of the current market price of comparable properties and disclosed in the Notes. Leases The process of determining whether an arrangement contains a lease is performed on the basis of the substance of the arrangement at the date on which it is entered into, and requires a judgment on whether meeting the respective contractual obligations is dependent on the use of one or more specific assets and whether the arrangement transfers the right to use those assets. Group as Lessee Finance leases that transfer substantially all the risks and rewards incident to ownership of an asset to the Group result in the leased asset and the corresponding liability being recognized at the inception of the lease at the lower of the fair value of the asset or the present value of the minimum lease payments. If there is no reasonable certainty that the Deufol Group will obtain ownership at the end of the lease term, recognized leased assets are depreciated on a straight-line basis over the shorter of the lease term or the useful life of the asset. Lease payments are apportioned between the finance costs and the repayment of the outstanding liability so as to produce a constant rate of interest on the remaining balance of the liability. Finance costs are recognized immediately as expenses in the financial results. Leases that do not transfer substantially all the risks and rewards associated with the leased item to the Group are classified as operating leases. Lease payments under operating leases are expensed on a straight-line basis over the term of the lease. Group as Lessor Leases that do not transfer substantially all the risks and rewards incident to ownership of an asset from the Group to the lessee are classified as operating leases. Initial direct costs incurred in negotiating and arranging an operating lease are added to the carrying amount of the leased asset and expensed over the lease term in proportion to the recognition of rental income. Contingent rent is recognized in the period in which it is generated. 77
80 78 Consolidated Financial Statements Notes to the Consolidated Financial Statements Basis of Preparation Leases that transfer substantially all the risks and rewards incident to ownership of an asset from the Group to the lessee are classified as finance leases with the Group as lessor. Lease payments are divided up into finance income and repayment of lease receivables. Sale and Lease-Back Transactions Leases resulting from sale and lease-back transactions are classified in accordance with the general leasing criteria and are treated either as finance or operating leases. In the case of a finance lease, the carrying amount of the capital good continues to be amortized as before. Any disposal gain is recognized and reversed in the income statement against the applicable finance expenditure over the term of the agreement. Joint Ventures and Associates Investments in joint ventures and associates are accounted for using the at-equity method. The cost of atequity-method accounted investments is increased or decreased annually by changes in equity insofar as these are attributable to the Deufol Group. Nonderivative Financial Assets Under the provisions of IAS 39, these financial instruments are classified as financial assets at fair value through profit or loss, loans and receivables, held-to-maturity investments or available-for-sale financial assets. Financial assets are recognized for the first time at fair value plus any transaction costs (excl. financial instruments held for trading and financial assets at fair value through profit or loss). Financial assets at fair value through profit or loss are carried at fair value, with fair-value changes recognized in the income statement. This includes financial assets held for trading. Loans and receivables are measured at amortized cost with application of the effective-interest method and less impairments. Income / losses are recorded in the income (loss) for the period. Held-to-maturity investments are carried at amortized cost using the effective-interest method. Available-for-sale financial assets are carried at fair value, with fair-value changes less income tax expense recognized as gains or losses from the fair-value measurement of financial instruments and presented as a portion of the accumulated changes recognized directly in equity. The Company s management classifies financial assets on acquisition and checks their classification at each balance sheet date. All standard market purchases and sales of financial assets are recorded in the balance sheet on the transaction date, i. e. the date on which the Company entered into the obligation to purchase the asset. In case of objective indications of an impairment of assets accounted for at amortized cost, the impairment loss is the difference between the carrying amount of the asset and the present value of the expected future cash flows (with the exception of expected future loan losses which have yet to occur), discounted at the original effective interest rate for the financial asset, i. e. the effective interest rate determined at the initial valuation. The carrying amount for the asset is reduced with use of a valuation account. The impairment loss is recognized in the income statement. In case of a decrease in the valuation adjustment in the following reporting periods, where this decrease is objectively attributable to circumstances occurring after recording of the valuation adjustment, the previously recorded valuation adjustment will be canceled. However, the new carrying amount of the asset may not exceed the amortized cost at the reinstatement of the original value. The reinstatement of the original value will be recognized in income.
81 Notes to the Consolidated Financial Statements Consolidated Financial Statements Basis of Preparation In case of objective indications for trade receivables that amounts due will not all be received in accordance with the originally agreed invoice terms (e. g. the probability of an insolvency or significant financial difficulties for the debtor), an impairment will occur with use of a valuation account. Receivables are closed out once they are classified as uncollectible. A financial asset (or a portion of a financial asset or a portion of a group of similar financial assets) will be closed out subject to one of the three following conditions: The contractual rights to receive cash flows resulting from a financial asset have expired. The Group will retain the rights to receive cash flows resulting from financial assets but assumes a contractual obligation of immediate payment of the cash flows to a third party under an agreement fulfilling the conditions laid down in IAS (Pass-through arrangement). The Group has transferred its contractual rights to receive cash flows resulting from a financial asset, thereby either (a) substantially transferring all risks and opportunities associated with ownership of the financial asset or (b) not having substantially transferred or retained all risks and opportunities associated with ownership of the financial asset, but having transferred the power of control over the asset. Derivative Financial Instruments Derivative financial instruments are exclusively used by the Group to hedge interest-rate fluctuation risks. The Group s cash flow hedges are for fluctuations in the value of cash flows resulting from variable-interest loans. The Group applies the hedge accounting rules pursuant to IAS 39 in the course of its accounting. The effective portion of the profit or loss resulting from a cash flow hedge is recorded directly in equity as a portion of the accumulated changes recognized directly in equity, including deferred taxes, while the ineffective portion is immediately recognized in income. Derivatives are measured according to recognized methods and in consideration of current market parameters. The critical-term-match method is used to determine effectiveness. The financial instruments in their entirety are explained in Note (42). Where a fixed obligation not shown in the balance sheet is classified as an underlying transaction, the following accumulated change in the fair value of the fixed obligation attributable to the hedged risk will be recognized in the result for the period as an asset or liability with a corresponding profit or loss. The changes in the fair value of the hedging tool will also be recognized in the period result. Cash Flow Hedges The amounts recognized in equity will be reclassified in the income statement in the period in which the hedged transaction affects the period result, e. g. if hedged financial income or expenses are recognized or if an expected sale is executed. Where a hedge leads to the reporting of a nonfinancial asset or a nonfinancial liability, the amounts recognized in equity will form part of the costs of acquisition at the time of the addition of the nonfinancial asset or nonfinancial liability. Where the stipulated transaction or fixed obligation is no longer expected to be realized, the amounts previously recognized in equity will be reclassified to the income statement. In case of the expiry or sale, termination or exercise of the hedging tool without a replacement or the rollover of the hedging tool into another hedging tool, the amounts previously recognized in equity will remain a separate equity item until the envisaged transaction or fixed obligation has been realized. 79
82 8 Consolidated Financial Statements Notes to the Consolidated Financial Statements Basis of Preparation Cash and Cash Equivalents Cash and cash equivalents on the face of the balance sheet comprise cash on hand, checks, bank balances and short-term deposits with an original maturity of up to three months. Inventories Inventories are carried at the lower of cost and net realizable value. As a rule, carrying amounts are calculated using the weighted-average-cost method; for certain inventories, the FIFO method is used. Cost comprises all production-related costs, calculated on the basis of normal employment. As well as direct costs (such as direct material and manufacturing costs), it also includes fixed and variable material and manufacturing overheads relating to the production process and appropriate portions of depreciation of manufacturing equipment. Deferred Taxes Deferred taxes are calculated using the balance sheet liability method in accordance with IAS 12. This standard requires deferred taxes to be recognized for all temporary differences between the tax bases of the individual companies and the carrying amounts according to IFRSs, and on consolidation adjustments. Deferred tax assets are also recognized for future benefits expected to arise from tax loss carryforwards. However, deferred tax assets have only been recognized for accounting differences and for tax loss carryforwards to the extent that it is probable that the asset will be realized. Deferred tax assets are measured at the applicable national rates of income tax. In Germany, deferred tax assets were calculated using a tax rate of % (previous year: %). This includes corporation tax at 15 %, the solidarity surcharge of 5.5 % on the corporation tax and the average rate of trade tax within the Group. The increase in the tax rate on the previous year is due to changes in the average rate of trade tax. Deferred tax assets and liabilities are measured at the tax rates that are expected to apply to the period when an asset is realized or a liability is settled. Deferred taxes for items recognized directly in equity will also be recognized directly in equity. Deferred tax liabilities are not recognized in case of taxable temporary differences associated with investments in subsidiaries and associates where the timeframe for the reversal of the temporary differences may be controlled and a reversal of the temporary differences is not probable in the foreseeable future. Other Recognized Income and Expense Items taken directly to equity are reported under this item, unless they result from capital transactions with shareholders, such as capital increases or dividend payments. This item includes the cumulative translation adjustment and unrealized gains or losses from the fair-value measurement of financial instruments, and derivatives used in cash flow hedges. They are recognized including deferred taxes, where applicable. Provisions for Pensions and Similar Obligations The actuarial valuation of pension provisions for defined-benefit plans is based on the projected-unitcredit method prescribed in IAS 19. The interest element of pension expenses is shown as a finance cost. Prior-period actuarial gains and losses that exceed 1 % of the greater of the defined-benefit obligation or the fair value of the plan assets are recognized immediately as income or expense. In the case of defined-contribution pension plans (e. g. direct insurance schemes), the contributions payable are recognized immediately as an expense. Provisions are not recognized for defined-contribution plans, as in these cases the Group has no other obligation above and beyond its obligation to pay premiums.
83 Notes to the Consolidated Financial Statements Consolidated Financial Statements Basis of Preparation Other Provisions Other provisions are recognized where a present obligation exists to third parties as a result of a past event, an outflow of resources is expected and the amount can be reliably measured. They are uncertain obligations that are recognized in the amount of the best estimate. Provisions with a remaining maturity of more than one year are discounted at market interest rates reflecting the risk specific to the liability and the period of time until the settlement date. Nonderivative Financial Liabilities and Other Liabilities Financial liabilities are carried at amortized cost. Differences between historical cost and the repayment amount and transaction costs are accounted for using the effective-interest method. Other liabilities are carried at their nominal value or the repayment amount. Noncurrent other liabilities bearing no interest are accounted for at their present value. A financial liability will be closed out in case of the fulfillment, cancellation or expiry of the underlying obligation for this liability. Where an existing financial liability is replaced by another financial liability of the same lender subject to substantially different contract terms or where the terms of an existing liability are subject to substantial change, this replacement or change will be treated as a closing-out of the original liability and a valuation for a new liability. The difference between the respective carrying amounts will be recognized in income. Treasury Stock Where the Group acquires treasury stock, this is recognized at cost on acquisition and deducted from equity. The purchase, sale, issue or withdrawal of treasury stock is not recognized in income. Differences between the net carrying amount and the counterperformance are recorded in the capital reserves. Cash Flow Statement The cash flow statement is prepared in accordance with the provisions of IAS 7 and shows the changes in the Group s cash and cash equivalents in the course of the year under review as a result of cash inflows and outflows. A distinction is made between cash flows from operating activities, investing activities and financing activities. Cash flows from operating activities are presented using the indirect method. Segment Reporting Segment reporting is performed in accordance with IFRS 8 (Operating Segments). The segments correspond to those of the internal reporting structure. Segmentation aims to make transparent the assets and financial position and results of operations of the Group s individual activities and its various regions. Borrowing Costs All borrowing costs are expensed in the period in which they are incurred. The Group does not have any qualified assets requiring mandatory inclusion of borrowing costs in their historical costs. Government Grants Deufol has received government grants relating to its investment projects. Pursuant to IAS 2, these are deducted when determining the carrying amount of the respective asset and recognized as income over the asset s useful life by means of a reduction in depreciation or, in case of performance-related grants, deducted from the corresponding expenses in the income statement. Government grants are recognized if there is reasonable assurance that the grants will be received and the Company meets the conditions attached to the grants. 81
84 82 Consolidated Financial Statements Notes to the Consolidated Financial Statements Basis of Preparation Management Judgments The preparation of the consolidated financial statements in accordance with IFRSs sometimes requires the and Key Sources of Estimation Executive Board to make estimates or assumptions that can affect the reported amounts of assets, liabilities Uncertainty and financial liabilities as of the balance sheet date, and the income and expenses for the reporting period. Actual amounts and changes may differ from these estimates and assumptions. The significant judgments and estimates applied are described in the following section: A significant portion of the valuation adjustment for doubtful accounts receivable relates to assessments and judgments regarding individual receivables which are based on the credit worthiness of the relevant customer, current economic trends and an analysis of historical losses of receivables outstanding on a portfolio basis. Recognition and measurement of other provisions are based on an estimate of the probability of the future outflow of benefits, supplemented by past experience and the circumstances known at the balance sheet date. As such, the actual outflow of benefits may differ from the amount recognized under other provisions. Please see Note (28) for further disclosures. Deferred tax assets from tax loss carryforwards are recognized on the basis of an estimate of the future recoverability of the corresponding tax benefits, i. e. if there is expected to be sufficient taxable income or reduced tax expense in future. The next five years is assumed as the assessment timeframe for this. The actual taxable income situation in future periods, and hence the extent to which tax loss carryforwards can actually be utilized, may differ from the estimate performed at the date on which the deferred taxes are recognized. Please see Note (8) for further disclosures. Significant forward-looking estimates and assumptions are made in the context of the impairment tests performed on goodwill, because the discounted-cash-flow method used for these tests requires the calculation of future cash flows, an appropriate rate of interest and long-term future growth rates. Any change in these factors may affect the results of such impairment tests. Please see Note (14) for further disclosures. Measurement of property, plant and equipment and intangible assets with a limited useful life requires the use of estimates for calculation of the fair value at the time of acquisition, particularly for assets acquired in connection with a business combination. In addition, these assets expected useful life is to be determined. Calculation of the fair values of the assets and their useful life and the impairment testing in case of indications of impairment are based on judgments made by the management. Please see Notes (13) and (14) for further disclosures. Where an agreement regarding a business combination stipulates an adjustment of the costs of acquisition for the combination such as is dependent on future events, the amount of this adjustment will be incorporated in the costs of acquisition for the combination at the time of acquisition if the adjustment is probable and can be reliably measured. Further judgments may be required for the classification of leases. Discontinued Operation Deufol has applied IFRS 5 Non-Current Assets Held for Sale and Discontinued Operations in these financial statements. IFRS 5 requires the presentation and disclosure of information that enables readers of the financial statements to assess the financial impact of discontinued operations and noncurrent assets held for sale (or disposal groups). A discontinued operation is defined as a group of assets including allocable liabilities which are to be jointly disposed of by means of a sale or otherwise. In 211, Deufol has reported the Cartons business field of Deufol Sunman Inc. (Sunman, Indiana) as a discontinued operation.
85 Notes to the Consolidated Financial Statements Consolidated Financial Statements Basis of Preparation The earnings contributions of discontinued business divisions are reported separately in the income statement under the item Income (loss) from discontinued operation (net of tax), subject to corresponding adjustments for the same period in the previous year. Unless otherwise noted, all disclosures concerning the income statement in the Notes exclusively relate to continuing operations. Changed Accounting and Valuation Methods In principle, the balancing and valuation methods used are the same as those used in the previous year, with the exception of the following IFRS standards and interpretations (New Accounting Standards) used for the first time in the fiscal year. New Accounting Standards The following new accounting standards published in previous years by the IASB and IFRIC were newly applicable for fiscal year 211 due to their recognition through the EU s endorsement process: Amendment to IFRS 1 First-Time Adoption of International Financial Reporting Standards, IFRS 7 Financial Instruments: Disclosures This amendment temporarily exempts first-time adopters of IFRSs from the comparative disclosures required under IFRS 7 for fair-value measurements and for the liquidity risk. It is not relevant for the consolidated financial statements of Deufol AG. Amendment to IAS 32 Financial Instruments: Presentation This amendment to IAS 32 clarifies how the rules defining equity and debt are to be applied to subscription rights which are not denominated in the issuer s functional currency. This amendment is not relevant for the consolidated financial statements of Deufol AG. Amendment to IAS 24 Related Party Disclosures The revised standard IAS 24 was published in November 29 and is first applicable in a fiscal year beginning on or after January 1, 211. It revises the definition of a related party to simplify the identification of related-party relationships and includes a partial exemption from the disclosures for government-related entities. This standard is applied retrospectively. The application of this standard did not have any effect on the Group s assets ratios, financial ratios or results of operations. IFRIC 19 Extinguishing Financial Liabilities with Equity Instruments This interpretation clarifies that at the issuance of equity instruments to creditors for the extinction of a financial liability, these equity instruments are to be classified as a consideration paid pursuant to IAS The issued equity instruments will be carried at fair value. If it is not possible to reliably determine this, they are to be measured at the fair value of the extinguished liability. Any gain or loss is recognized immediately in profit or loss. This amendment is applied retrospectively. This amendment does not apply to the Group and therefore has no effect on its net assets, financial position or results of operations. Amendment to IFRIC 14 Prepayments of a Minimum Funding Requirement This interpretation regulates the treatment of prepayments of minimum funding requirements in case of defined-benefit plans. It enables the benefit resulting from this form of contribution prepayment to be reported as an asset. This interpretation is not relevant for the consolidated financial statements of Deufol AG. 83
86 84 Consolidated Financial Statements Notes to the Consolidated Financial Statements Basis of Preparation The IASB has published the following standards and interpretations which were not yet bindingly applicable in fiscal year 211. The Group opted to waive early application of these standards and interpretations. In November 29, the IASB issued IFRS 9 Financial Instruments. The European Union has not yet endorsed the amendments. The standard is the result of the first of three phases of the project to replace IAS 39 Financial Instruments: Recognition and Measurement with IFRS 9. IFRS 9 governs the classification and measurement of financial assets. The rules for impairment of financial instruments and hedge accounting are currently being revised by the IASB. IFRS 9 requires financial assets to be assigned to one of the following two measurement categories: at amortized cost or at fair value. IFRS 9 also grants a fair-value option which allows financial assets that would normally be assigned to the at amortized cost category to be designated as at fair value if the fair-value designation would eliminate or significantly reduce measurement or recognition inconsistency. It is mandatory to assign equity instruments to the at fair value category. If, however, the equity instrument is not held for trading, the standard allows an irrevocable option to be made at initial recognition to designate it as at fair value through other comprehensive income. Dividend income resulting from the equity instrument is recognized in profit or loss. IFRS 9 is applicable for fiscal years beginning on or after January 1, 215. Previous periods do not require any amendment in case of first-time application, but the effects of first-time application require disclosure. Deufol AG is currently assessing the effects for the presentation of the Group s net assets, financial position and results of operations and its cash flows. In October 21, the IASB issued the pronouncement Disclosures Transfers of Financial Assets as an amendment to IFRS 7 Financial Instruments: Disclosures. The amendment requires quantitative and qualitative disclosures to be made for transfers of financial assets where the transferred assets are derecognized in their entirety or the transferor retains continuing involvement. The amendment is intended to provide greater transparency around such transactions (e. g. securitizations) and help users understand the possible effects of any risks that may remain with the entity that transferred the assets. The amendment also requires supplementary information to be disclosed if a substantial proportion of the total amount of transfer activity takes place in the closing days of a reporting period. The amendments are applicable for fiscal years beginning on or after July 1, 211. The European Union endorsed this pronouncement in November 211. Deufol AG is currently assessing the effects for the presentation of the Group s net assets, financial position and results of operations and its cash flows. It may lead to extended disclosure obligations. Also in October 21, the IASB issued requirements on accounting for financial liabilities. These are integrated into IFRS 9 Financial Instruments and replace the existing provisions on this subject in IAS 39 Financial Instruments: Recognition and Measurement. In the new pronouncement, the requirements relating to recognition and derecognition as well as most of the requirements for classification and measurement are carried forward unchanged from IAS 39. However, the requirements related to the fair-value option for financial liabilities are changed in the new IFRS 9 to address own credit risk and the prohibition of fair-value measurement is eliminated for derivative liabilities that are linked to an unquoted equity instrument and must be settled by delivery of an unquoted equity instrument. The pronouncement is applicable for fiscal years beginning on or after January 1, 215. Previous periods do not require any amendment in case of first-time application, but the effects of first-time application require disclosure. The European Union has not yet endorsed this pronouncement. Deufol AG is assessing the effects for the presentation of the Group s net assets, financial position and results of operations and its cash flows.
87 Notes to the Consolidated Financial Statements Consolidated Financial Statements Basis of Preparation In December 21, the IASB issued the pronouncements Deferred Tax: Recovery of Underlying Assets Amendments to IAS 12. The amendment sets presumptions for the recovery of certain assets. This is relevant in those cases where different tax consequences can arise depending on how the carrying amounts are recovered. The pronouncement introduces a rebuttable presumption that the carrying amount of an investment property that is measured using the fair-value model in IAS 4 Investment Property will be recovered through sale. In any case, there is also a non-rebuttable presumption that the carrying amount of a non-depreciable asset that is measured using the fair-value model in IAS 16 Property, Plant and Equipment will be recovered through sale. Interpretation SIC 21 Income Taxes Recovery of Revalued Non-Depreciable Assets was replaced by the new pronouncement. It is applicable for fiscal years beginning on or after January 1, 212 and has not yet been endorsed by the European Union. Deufol AG is assessing the effects for the presentation of the Group s net assets, financial position and results of operations and its cash flows. In May 211, the IASB published three new IFRSs (IFRS 1, IFRS 11, IFRS 12) and two revised standards (IAS 27, IAS 28) that govern the accounting for investments in subsidiaries, joint arrangements and associates. The provisions have not yet been endorsed by the European Union and must be applied for fiscal years beginning on or after January 1, 213. Application of the new and revised IFRSs may affect the presentation of the Group s net assets, financial position and results of operations and its cash flows in case of future business combinations and may lead to additional Notes for the Deufol Group. However, this does not include the new version of IAS 27 since this exclusively covers single-entity financial statements and Deufol does not prepare any IFRS single-entity financial statements pursuant to section 325 (2a) HGB. The IASB is introducing a harmonized consolidation model by issuing IFRS 1 Consolidated Financial Statements. This new standard does away with the distinction between traditional subsidiaries (IAS 27) and special-purpose entities (SIC-12). An investor controls an investee when the investor is exposed, or has rights, to variable returns from its involvement with the investee and has the ability to affect those returns through its power over the investee. Upon its entry into force, IFRS 1 will replace SIC-12 Consolidation Special Purpose Entities as well as the requirements relevant to consolidated financial statements in IAS 27 Consolidated and Separate Financial Statements. IFRS 11 Joint Arrangements will replace IAS 31 Interests in Joint Ventures and SIC-13 Jointly Controlled Entities Non-Monetary Contributions by Venturers. It governs the accounting for joint ventures and joint operations. Proportionate consolidation for joint ventures will no longer be permissible as a result of the discontinuation of IAS 31. The amended IAS 28 Interests in Associates and Joint Ventures governs the application of the at-equity method when accounting for investments in both associates and joint ventures. In case of a joint operation, the share of assets, liabilities, expenses and revenues is directly recognized in the consolidated financial statements and annual financial statements of a joint operator. IFRS 12 Disclosure of Interests in Other Entities combines all disclosures required in the consolidated financial statements regarding subsidiaries, joint arrangements and associates, as well as unconsolidated structured entities. 85
88 86 Consolidated Financial Statements Notes to the Consolidated Financial Statements Basis of Preparation The amended IAS 27 Separate Financial Statements exclusively governs the accounting for subsidiaries, joint ventures and associates in the annual financial statements and the corresponding notes (separate financial statements according to section 325 (2a) HGB). The amended IAS 28 Investments in Associates and Joint Ventures governs the accounting of investments in associates and joint ventures using the atequity method. In May 211, the IASB also published IFRS 13 Fair Value Measurement. With this standard, the IASB has created a uniform, comprehensive standard for fair-value measurement. IFRS 13 must be applied prospectively for fiscal years beginning on or after January 1, 213. IFRS 13 provides guidance on how to measure at fair value when other IFRSs require fair-value measurement (or disclosure). A new definition of fair value applies which characterizes fair value as the selling price of an actual or hypothetical transaction between any independent market participants under normal market conditions on the reporting date. The standard is almost universally applicable, with the only exemptions being IAS 2 Inventories, IAS 17 Leases, and IFRS 2 Share-Based Payment. While the guidance remains virtually unchanged for financial instruments, the guidance for other items (e. g. investment property, intangible assets and property, plant and equipment) is now more comprehensively and / or precisely defined. The established three-level fair-value hierarchy has to be applied across the board. Application of IFRS 13 is expected to lead to extended Notes to Deufol s consolidated financial statements. The European Union has not yet endorsed these regulations. In June 211, the IASB issued amendments to IAS 1 Presentation of Financial Statements. The amendments require that the items listed under other comprehensive income be split into two categories, according to whether or not they will be recognized in the income statement in future periods ( recycling ). The amendments to IAS 1 must be applied for fiscal years beginning on or after July 1, 212 and have not yet been endorsed by the European Union. Deufol AG is currently assessing the effects for the presentation of the Group s net assets, financial position and results of operations and its cash flows, and currently assumes that the above-mentioned amendments will be incorporated in its statement of comprehensive income. In June 211, the IASB also issued amendments to IAS 19 Employee Benefits. These amendments mean the discontinuation of existing options for the recognition of actuarial gains and losses. As the corridor method, as it is known, will no longer be permissible, with immediate effect actuarial gains and losses have to be recognized in full and exclusively directly in equity, which corresponds to the method we currently apply. Other amendments concern the recognition of past service cost and of the net interest income / expense resulting from defined-benefit plans, as well as the differentiation between termination benefits and other employee benefits. One significant consequence of these amendments is that top-up payments made as part of partial retirement programs may no longer be recognized as termination benefits and therefore have to be accrued over their vesting period. Disclosure requirements are also being extended, e. g. for characteristics of defined-benefit plans and the risks arising from those plans. The amendments to IAS 19 are applicable retrospectively for fiscal years beginning on or after January 1, 213 and have not yet been endorsed by the European Union. Deufol AG currently expects that its financial statements will be affected by the extended disclosure obligations and is also examining the effects of this amendment for the presentation of the Group s net assets, financial position and results of operations and its cash flows.
89 Notes to the Consolidated Financial Statements Consolidated Financial Statements Basis of Preparation In December 211, the IASB published amendments to IAS 32 Financial Instruments: Presentation specifying the requirements for offsetting financial instruments. To meet the new offsetting requirements in IAS 32, an entity s right to set off must not be contingent on a future event and must be enforceable both in the normal course of business and in the event of default or insolvency of the entity and all counterparties. It is further specified that a gross settlement system also complies with the offsetting requirements according to IAS 32, provided no major credit or liquidity risks remain and receivables and payables are processed in a single settlement step, making it equivalent to a net settlement. The new requirements must be applied retrospectively for fiscal years beginning on or after January 1, 214 and have not yet been endorsed by the European Union. Deufol AG is assessing the effects for the presentation of the Group s net assets, financial position and results of operations and its cash flows, but does not currently expect any significant changes. In December 211, the IASB also issued extended disclosure requirements regarding offsetting rights in IFRS 7 Financial Instruments: Disclosures. In addition to extended disclosures on offsetting activities actually carried out pursuant to IAS 32, disclosure requirements on existing rights to set off are introduced regardless of whether the offsetting under IAS 32 is actually carried out. The new requirements must be applied retrospectively for fiscal years beginning on or after January 1, 213 and have not yet been endorsed by the European Union. Deufol AG is assessing the effects for the presentation of the Group s net assets, financial position and results of operations and its cash flows, and assumes that extended disclosure requirements will result. 87
90 88 Consolidated Financial Statements Notes to the Consolidated Financial Statements Scope of Consolidation Scope of Consolidation Consolidated Companies In addition to Deufol AG, the group of fully consolidated companies includes all major subsidiaries and subgroups over which Deufol AG has legal or practical control. figures in thousand Dec. 31, 21 Consolidated subsidiaries Additions Disposals Dec. 31, thereof in Germany thereof abroad Companies valued using the at-equity method thereof in Germany 3 3 thereof abroad Total The following table shows the companies fully consolidated as of December 31, 211: Companies fully consolidated as of Dec. 31, 211 Country Equity interest (%)* Aircon Airfreight Container Maintenance GmbH, Mörfelden-Walldorf Germany 56.7 Baumann Technologie GmbH, Oberhausen Germany 56. Deufol Services & IT GmbH, Hofheim Germany 1. D.Services Immobilien GmbH & Co. KG i. L., Hofheim Germany 94.8 Deufol Mitte GmbH, Hofheim Germany 1. Dualogis GmbH, Erlenbach Germany 51. Deufol Nürnberg GmbH. Nuremberg, previously Deufol Tailleur GmbH, Oberhausen (incl. subsidiaries) Deufol Hamburg GmbH, Hamburg Germany 1. Germany 1. Deufol Frankfurt GmbH, Frankfurt Germany 1. Deufol West GmbH, Oberhausen Germany 1. Deufol Nord GmbH, Peine Germany 1. Deufol Bochum GmbH, Bochum Germany 1. Deufol Süd GmbH, Neutraubling Deufol Produktionsgesellschaft mbh, Hofheim Germany 1. Germany 1. DTG Verpackungslogistik GmbH, Fellbach Germany 51. Fischer Kisten GmbH, Mühlhausen Germany 1. GGZ Gefahrgutzentrum Frankenthal GmbH, Frankenthal Germany 1. Germany 1. Deufol Remscheid GmbH, Remscheid, previously Günter Baumann Transport + Verpackung GmbH, Oberhausen Horst Lange GmbH, Hamburg Germany 56.7 IAD Industrieanlagen-Dienst GmbH, Munich Germany 1. Deufol München GmbH, Munich Deufol Berlin GmbH, Berlin Deufol Südwest GmbH, Walldorf, previously Walpa Gesellschaft für Übersee- und Spezialverpackung mbh, Walldorf Deufol Austria GmbH, Bruck a. d. Leitha, previously Logis Industriedienstleistung GmbH, Tulln on the Danube Germany 1. Germany 1. Germany 1. Austria 1.
91 Notes to the Consolidated Financial Statements Consolidated Financial Statements Scope of Consolidation Companies fully consolidated as of Dec. 31, 211 Country Equity interest (%)* Deufol Česká republika a. s., previously Logis průmyslové obaly a. s., Ivancice Czech Republic 1. Deufol Slovensko s. r. o., Krušovce Slovak Republic 1. China 1. Deufol (Suzhou) Packaging Co. LTD, Suzhou Deufol North America Inc., Sunman, Indiana (incl. subsidiaries) USA 1. Deufol Sunman Inc., Sunman, Indiana USA 1. USA 1. Deufol Packaging Tienen N. V., Tienen Deufol Charlotte LLC., Charlotte, North Carolina Belgium 1. Deufol Logistics Tienen N. V., Tienen Belgium 1. Deufol België N. V., Tienen (incl. subsidiaries) Belgium 1. Belgium Arcus Installation B. V. B. A., Houthalen AT + S N. V., Houthalen Belgium Deufol Waremme S. A., Waremme Belgium 98.8 Deufol Italia S. p. A., Fagnano Olona Italy 1. * Attributable to the relevant parent Investments Accounted for The following companies were included in consolidation using the at-equity method: Using the At-Equity Method Companies accounted for using the at-equity method as of Dec. 31, 211 Equity interest (%) SIV Siegerländer Industrieverpackungs GmbH, Kreuztal Germany 5. Abresch Industrieverpackung GmbH, Viernheim Germany 5. Deutsche Tailleur Bielefeld GmbH & Co. KG, Bielefeld Germany 3. France 24. Deufol St. Nabord SAS, previously D.Logistics France SAS, Saint Nabord Information in Accordance Country Deufol AG holds at least 2 % of the shares in the following companies: with Section 313 (2) No. 4 of the German Commercial Code Company s name and registered office Country Equity interest (%) Equity in thousand Result for the fiscal year in thousand BVU Bayerisches Verpackungs unternehmen GmbH i. I., previously BVU Bayerisches Verpackungs unternehmen GmbH, Munich* Germany (74) Deufol Securitas Int. GmbH, Hamburg* Germany (4) Deutsche Tailleur Bielefeld Beteiligungs GmbH, Bielefeld Germany Belgium 5. Italy (1) Securitas Int. B. V., Antwerp Deufol Packaging Italy S. R. L. i. L., Fagnano Olona * Figures as of December 31, 29 89
92 9 Consolidated Financial Statements Notes to the Consolidated Financial Statements Scope of Consolidation Acquisitions and Sales Under a purchase agreement of December 2, 21 with a closing date of January 28, 211, Deufol AG acquired 1. % of the shares in Richard Wolfsberger GmbH. This company was incorporated in the consolidated financial statements with effect as of February 1, 211. The fair values for the assets and liabilities of the acquired company at the time of acquisition are presented in the following summary: figures in thousand Previous net carrying amounts Fair values at the time of acquisition Intangible assets 6 64 Property, plant and equipment Other receivables Deferred tax assets Cash and cash equivalents Total assets 675 1,331 Other reserves Financial liabilities Other liabilities Deferred tax liabilities 1,348 1, Total liabilities 1,627 1,817 Net assets (952) (486) Goodwill from company acquisitions 636 Purchase price 15 less cash and cash equivalents 114 Cash outflow 36 The intangible assets include an identifiable established clientele in the amount of 634 thousand. This is subject to straight-line depreciation over a period of five years. The difference between the purchase price and the purchased equity which is not directly attributable to any asset was recorded as goodwill. The goodwill includes non-separable values such as potential profits derived from future synergy effects. Under a notarial contract of April 8, 211, Richard Wolfsberger GmbH, Bruck on the Leitha, was renamed Deufol Austria GmbH. The entry in the commercial register was made on April 23, 211. Under a notarial contract dated December 14, 211, Deufol Austria GmbH merged with Logis Industriedienstleistungen GmbH. Logis Industriedienstleistungen GmbH was subsequently renamed Deufol Austria GmbH. The entry in the commercial register was made on December 23, 211. The following corporate transactions were resolved through a notarial recording on August 23, 211: Merger of Deufol Kirchheimbolanden GmbH, Kirchheimbolanden, with Deufol Tailleur GmbH, Oberhausen Sale by Deufol AG of Deufol Nord GmbH, Peine, to Deufol Tailleur GmbH; split-off of the Peine operation of Deufol West GmbH, Oberhausen, for incorporation in Deufol Nord GmbH, Peine Merger of Deufol Süd GmbH, Neutraubling, with Deufol Nürnberg GmbH, Nuremberg Split-off of the assets of Deufol Nürnberg GmbH with the exception of its Neutraubling operation for incorporation in Deufol Tailleur GmbH as the absorbing entity
93 Notes to the Consolidated Financial Statements Consolidated Financial Statements Scope of Consolidation Renaming of Deufol Nürnberg GmbH as Deufol Süd GmbH and transfer of the company s registered office to Neutraubling Renaming of Deufol Tailleur GmbH as Deufol Nürnberg GmbH and transfer of the company s registered office to Nuremberg The companies established in 21 Deufol Charlotte LLC., Charlotte, North Carolina, and Deufol (Suzhou) Packaging Co. LTD, Suzhou commenced their operating activities in the fiscal year 211 and were thus fully consolidated for the first time. Acquisitions and Start-ups 21 With effect as of January 1, 21, Deufol Berlin GmbH acquired the outstanding shares in Deufol Hamburg GmbH (previously Alltrans Exportverpackung GmbH) for a purchase price of 35 thousand. Since the increase of an investment in a fully consolidated subsidiary is not an acquisition of control within the meaning of IFRS 3, the identifiable assets and liabilities have not been measured. Under a notarial contract of October 18, 21, Deufol AG established Deufol Nord GmbH, Peine. The company has been fully consolidated for the first time as of December 31, 21. Under a notarial contract of October 18, 21, Deufol AG established Deufol Produktionsgesellschaft mbh, Hofheim. The company has been fully consolidated for the first time as of December 31, 21. Under a notarial contract of October 18, 21, Deufol AG established Deufol Süd GmbH, Neutraubling. The company has been fully consolidated for the first time as of December 31, 21. All these companies have been provided with Subscribed Capital in the amount of 25 thousand. The actual payments amounted to 13 thousand each and were made in cash. Deconsolidation 21 BVU Bayerisches Verpackungsunternehmen mbh filed for insolvency on August 3, 21. This company was thus removed from the consolidated group with effect as of August 31, 21. This removal r esulted in a profit of 136 thousand. In the first eight months of 21, BVU realized an operating result of 691 thousand. The assets and liabilities removed from the consolidated group are shown in the following table: figures in thousand Aug. 31, 21 Dec. 31, Noncurrent assets 445 Current assets Total assets 682 1, Noncurrent liabilities 189 Current liabilities Total liabilities (136) Net assets Disposal profit Disposal proceeds less disposal of cash and cash equivalents (1) Cash outflow (1) On October 28, 21, the liquidation of Deufol Packaging Italy S. r. l., Fagnano Olona, Italy, was resolved. This company was accordingly removed from the consolidated group with effect as of October 31, 21. Deufol Italia S. p. A. now handles this company s business activities. Expenditure in the amount of 18 thousand arose in connection with its removal from the consolidated group. 91
94 92 Consolidated Financial Statements Notes to the Consolidated Financial Statements Consolidated Income Statement Disclosures Consolidated Income Statement Disclosures 1 Sales The sales mainly resulted from the provision of services and, to a lesser extent, from rents. They include rental income from the investment properties in the amount of 86 thousand (previous year: 19 thousand). In respect of further comments on the sales, we refer to the segment reporting on pages 2 Cost of Sales 12 ff. The cost of sales includes the following expenses: Personnel costs 76,19 72,77 Cost of purchased services 75,535 78,886 Cost of materials 79,222 65,927 Rental and lease expenses 2,61 18,369 7,965 7,68 figures in thousand Depreciation, amortization and impairment Space costs 6,557 6,898 Maintenance costs 3,646 3,411 Insurance premiums 2,983 2,876 Vehicle fleet costs 2,229 2, Expenses for loss or damage incurred Other 6,234 5,396 Total 281, ,325 The cost of sales includes expenses for the investment properties in the amount of 65 thousand (previous year: 96 thousand). Income was achieved through these properties throughout the fiscal year. 3 Selling Expenses The selling expenses include the following expenses: figures in thousand Personnel costs 3,365 4,453 Valuation adjustments on trade receivables and losses on receivables Travel expenses Advertising costs Depreciation, amortization and impairment Cost of purchased services ,63 5,97 Other selling expenses Total
95 Notes to the Consolidated Financial Statements Consolidated Financial Statements Consolidated Income Statement Disclosures 4 Administrative Expenses The general and administrative expenses include the following expenses: figures in thousand Personnel costs Legal and consulting costs 12,921 12,278 1,941 1, IT and communications costs Cost of purchased services Rental and lease expenses Travel expenses Annual General Meeting and financial reports Space costs ,359 2,687 2,747 2,369 figures in thousand Release of accruals and liabilities 1, Insurance compensation and other indemnification 1, Total The following table shows the breakdown of other operating income: Claim for refund of taxes paid in prior periods Income from deconsolidation Income from disposal of fixed assets Exchange rate gains 6 Other Operating Expenses 21 Depreciation, amortization and impairment Other administrative expenses 5 Other Operating Income Other 1,538 1,52 Total 4,36 2, The following table shows the breakdown of other operating expenses: figures in thousand Expenses for damage incurred in previous periods 419 Other space costs Additional payments of other taxes following external audit Depreciation of property, plant and equipment 186 Valuation adjustments on other receivables 681 Losses on disposal of fixed assets Exchange-rate losses 24 8 Expenses for deconsolidation 18 Other 757 1,287 Total 1,489 3,126 93
96 94 Consolidated Financial Statements Notes to the Consolidated Financial Statements Consolidated Income Statement Disclosures 7 Financial Result The financial result can be broken down as follows: figures in thousand Financial income 2,14 1,496 from bank balances from finance leases 1,76 1,175 from legal disputes from recognition of the interest rate swap in income Accumulation of receivables Finance costs 22 (6,434) from financial liabilities (4,934) (5,1) from finance leases (1,5) (1,129) (51) (295) (3,331) (4,335) figures in thousand Effective income tax expense 3,371 3,432 Accumulation of liabilities and accruals Shares of profits of at-equity-method-accounted companies Total 8 Tax Proceeds / Expenses 23 (6,35) The Group s income taxes can be broken down as follows: Germany Rest of the World Deferred income taxes due to the occurrence or reversal of temporary differences Germany 816 1,76 2,555 2, (434) 1,193 (271) (1,54) (163) 3,51 2,998 figures in thousand * Recognition of loss carryforwards Rest of the World Total Deferred tax expenses (previous year: proceeds) are as follows: (795) (714) Tax only assets Valuation of property, plant and equipment (38) 13 (149) (119) Valuation of clientele Valuation of receivables Finance leasing 682 (129) (177) Other Total 139 (434) * The presentation for 21 was adjusted to the presentation for 211.
97 Notes to the Consolidated Financial Statements Consolidated Financial Statements Consolidated Income Statement Disclosures As of December 31, 211, deferred taxes were calculated for German companies with an overall tax rate of % (previous year: %). The relevant national tax rate applies for the deferred taxes of companies outside Germany. The following table shows the reconciliation between the expected and reported income tax expense for the Group, subject to the % (previous year: %) income tax rate for Deufol AG: figures in thousand Earnings before taxes from continuing operations Earnings before taxes from discontinued operations ,382 6,35 (3,261) Income tax rate of the Deufol Group (%) Expected tax expense 1,215 1, Effect of different tax rates Unrecognized deferred tax assets on loss carryforwards Use of previously unconsidered tax losses (751) (432) Effect of tax-exempt income (674) (575) Effect of expenses not deductible for tax purposes Effect of impairment of goodwill Prior-period tax effects Other Income taxes 3,51 2,998 Effective tax rate (%) * Deferred tax assets can be broken down as follows: figures in thousand Tax loss carryforwards 8,43 7,13 Tax only assets 1,768 2,185 Finance leases 1,27 1, Cash flow hedges Provisions for pensions Other Deferred tax assets Offset against deferred tax liabilities Total ,668 11,45 (554) (648) 11,114 1,82 * The presentation for 21 was adjusted to the presentation for 211. Deferred tax assets include 9,246 thousand (previous year: 1,54 thousand) for consolidated companies in Germany. In Germany, tax loss carryforwards can be carried forward indefinitely, although domestic income is subject to minimum taxation. As of December 31, 211, corporate income tax loss carryforwards amounted to a total of 79.8 million (previous year: 77.4 million). Of this amount, 75.3 million (previous year: 72.4 million) can be carried forward indefinitely. The trade tax loss carryforwards of German Group companies amount to 73.3 million (previous year: 71.9 million) and can be carried forward indefinitely. Temporary differences relating to shares in subsidiaries for which no deferred taxes were accounted total 2.2 million (previous year: 23.7 million). 95
98 96 Consolidated Financial Statements Notes to the Consolidated Financial Statements Consolidated Income Statement Disclosures Deferred tax liabilities can be broken down as follows: 9 Income (Loss) from Discontinued Operation figures in thousand Property, plant and equipment 1,376 1,416 Finance leases Clientele Other receivables and other assets Other Deferred tax liabilities 3,197 2,74 Offset against deferred tax assets (554) (648) Total 2,643 2,56 Within the framework of its portfolio optimization, in the past fiscal year Deufol Sunman Inc. wound up its Carton Business, i. e. production of carton packaging. This is classifiable as a discontinued operation in accordance with IFRS 5. Accordingly, in the period under review all income and expenses for this operation are reported separately in the income statement under Income (loss) from discontinued operation (net of tax). The previous year s figures have been adjusted accordingly. The position Income (loss) from discontinued operation (net of tax) in the consolidated income statement is made up as follows: figures in thousand Income from operating activities 2,29 4,123 Expenses for operating activities (2,787) (5,35) Expenses from the recognition of a liability in relation to a pension fund (2,53) Income (loss) from discontinued operation (before tax) (3,261) (1,227) Taxes Income (loss) from discontinued operation (net of tax) (3,261) (1,227) Earnings per share from discontinued operation ( ) (.74) (.28) The employees in the Cartons division have entitlements under a multi-employer pension plan. In the past few years, no relevant calculations were available to enable the necessary disclosures for a defined-benefit pension plan. Accordingly, to date this item has been permissibly reported as a defined-contribution pension plan. Deufol Sunman has withdrawn from this group fund on closing its Cartons business field. This means that non-covered pension claims must be reported as a noncurrent obligation. The present value of this obligation is 2,693 thousand. This obligation is recognizable in income at the time that it is incurred and requires settlement over a period of 2 years through annual payments of 268 thousand. At the present time, no final calculation of this value is available and it may therefore be adjusted in subsequent financial statements.
99 Notes to the Consolidated Financial Statements Consolidated Financial Statements Consolidated Income Statement Disclosures The cash flow is as follows: figures in thousand Operating activities Investing activities Financing activities Net cash flow 1 Profit / Loss Attributable to Noncontrolling Interests 11 Earnings per Share , , The consolidated net profit attributable to noncontrolling interests primarily consists of profit shares attributable to companies in the Deufol Nürnberg Group. Income figures in thousand Result attributable to the holders of Deufol AG common stock ,927 3,35 4,154 (3,261) (1,227) 43,773,655 43,773, Wages and salaries 73,446 72,333 Social security contributions 19,3 18,237 Total 92,476 9,57 from continuing operations from discontinued operation Shares in circulation figures in units Weighted average number of shares 12 Other Consolidated Income The following personnel costs are included in the expense items: Statement Disclosures figures in thousand The average number of employees in 211 was 2,818 (previous year: 2,721), of which Germany accounted for 1,648 employees (previous year: 1,583), the Rest of Europe for 698 employees (previous year: 665) and USA / Rest of the World for 463 employees (previous year: 466). The holding had 9 employees on average (previous year: 7). As of the reporting date December 31, 211, the Group had 2,772 employees (previous year: 2,782). The Group auditors fees recognized in the consolidated income statement amounted to 297 thousand (previous year: 186 thousand) for audits of financial statements and thousand (previous year: 1 thousand) for other services. 97
100 98 Consolidated Financial Statements Notes to the Consolidated Financial Statements Consolidated Balance Sheet Disclosures Consolidated Balance Sheet Disclosures 13 Property, Plant and Equipment Property, plant and equipment also includes leased buildings and technical equipment and machinery where the Group as lessee is considered to be the economic owner because all substantial risks and rewards incident to the use of the leased assets are transferred. Within leased assets, the following amounts are attributable to the Operating and office equipment and Technical equipment and machinery asset classes: 211 figures in thousand 21 Cost 11,759 11,39 Accumulated depreciation and amortization (6,71) (5,364) 5,58 5, Net carrying amount The following amounts are attributable to Buildings : figures in thousand Cost Accumulated depreciation and amortization Net carrying amount 7,52 7,52 (5,276) (4,818) 2,226 2,684 As of December 31, 211, the fair value of investment property was.7 million (previous year:.2 million). The fair value of investment property was measured on the basis of the Company s yield analysis. 14 Intangible Assets Intangible assets primarily consist of the goodwill recognized on consolidating acquirees. The following table shows the breakdown of goodwill by segment: Germany Rest of Europe figures in thousand Carrying amount as of Jan. 1, 211 USA / Rest of the World Total 52,665 15,314 67,979 Additions Impairments Currency translation adjustments (4) (4) 52,666 15,946 68,612 Carrying amount as of Dec. 31, 211 In accordance with IAS 36 Impairment of Assets, goodwill should be tested for impairment at least once a year. In the course of impairment testing, the carrying amount of a cash-generating unit (CGU) is compared with its recoverable amount. The recoverable amount of a CGU is the higher of its fair value less costs to sell and its value in use.
101 Notes to the Consolidated Financial Statements Consolidated Financial Statements Consolidated Balance Sheet Disclosures In principle, the lowest level within the Group at which goodwill is monitored for internal management purposes is the level for operating segments as defined by IFRS 8. Accordingly, goodwill is allocated to the operating segments Germany, Rest of Europe and USA / Rest of the World. In the Rest of Europe segment, the management monitors goodwill by distinguishing between three regionally classified cash-generating units. The recoverable amount corresponds to the value in use and was calculated as the present value of future cash flows. Future cash flows are determined on the basis of the multiple-year financial plans of the companies included in the scope of consolidation. The concrete planning period in each case is three years. The forecasts contained therein are based on past experience and the expected future segment and market development. The discount rates before taxes are calculated on the basis of market data. For the Group s individual CGUs, they are between 7.8 % and 8.52 % (previous year: 7.35 % to 1.33 %). The terminal growth rate of 1 % (previous year: 1.5 % to 2 %) does not exceed the long-term growth rates for the industry and region in which the cash-generating units operate. Impairment testing did not identify the need to recognize impairment losses for the CGUs defined above. A modification of the basic assumptions regarding an increase in the discount interest rate by 1. percentage points and a simultaneous reduction in the long-term growth rate to 1. % would not lead to any need to recognize impairment losses. 15 Investments Accounted for Using the At-Equity Method As of December 31, 211, the carrying amount of the investments in associates accounted for using the atequity method amounts to 2,794 thousand (previous year: 2,74 thousand). The following table provides summary information for the companies accounted for using the at-equity method. The figures are for the Group s share in the associates. Assets figures in thousand Dec. 31, 211 Dec. 31, 21 Current assets 2,374 2,361 Noncurrent assets 2,492 2,462 Total assets 4,866 4,823 Equity and liabilities figures in thousand Debt 2,72 2,144 Equity 2,794 2,679 Total equity and liabilities 4,866 4,823 Total sales 1,1 9,875 Total expenses (9,286) (9,254) Income The pro-rata profits of a company accounted for using the at-equity method (Deufol St. Nabord SAS) were recognized for the first time in 211. The unrecognized profits amount to 25 thousand (previous year: 18 thousand); cumulative unrecognized losses amount to thousand (previous year: 25 thousand). 99
102 1 Consolidated Financial Statements Notes to the Consolidated Financial Statements Consolidated Balance Sheet Disclosures Consolidated statement of changes in assets 21 and 211 Procurement and production costs Jan. 1, 211 Currency translation adjustments Changes in the scope of consolidation Additions figures in thousand Reclassifi cations Disposals Dec. 31, 211 other held for disposal (287) (5,61) ,361 Property, plant and equipment Land, land rights and buildings 38, Technical equipment and machinery 47, ,494* (11,396) (27) 1,8 39,285 Operating and office equipment 31, ,82 (1,66) (74) (19) 32,297 1,293 (22) 318 (1,61) ,541 (7) 22 1,722 (74) (277) 19,261 Assets under construction Leased assets Investment property , ,27 (13,489) (5,891) 126,715 12, (47) (13) 13,66 Goodwill 7,59 (4) ,223 Total 83, ,262 (47) (13) 84, , ,532 (13,536) (5,94) 211,598 Total Intangible assets Patents, licenses, trademarks and similar rights and assets Sum total figures in thousand Jan. 1, 21 Dec. 31, 21 Property, plant and equipment Land, land rights and buildings 38,577 1,123 (643) Technical equipment and machinery 44,838 1,773 (232) Operating and office equipment 3, (279) (1,568) 1,13* (728) 1,55 (335) , (15) ,476 Patents, licenses, trademarks and similar rights and assets Goodwill Total Assets under construction Leased assets Investment property Total 1, , ,294 (97) 31,23 (7) (35) 1,293 4,94 (717) (533) 18, ,127 (1,34) 8,128 (3,418) 138,9 12,2 216 (35) 241 (21) 12,421 7,588 9 (7) 7,59 82, (35) 241 (28) 83,11 214,84 3,352 (1,339) 8,369 (3,446) 221,2 Intangible assets Sum total * The additions for procurement and production costs include additions in the amount of 1 thousand (previous year: 72 thousand) from discontinued operations. ** The additions for depreciation and amortization include depreciation in the amount of 366 thousand (previous year: 696 thousand) from discontinued operations.
103 Notes to the Consolidated Financial Statements Consolidated Financial Statements Consolidated Balance Sheet Disclosures Depreciation and amortization charges Jan. 1, 211 Currency translation adjustments Changes in the scope of consolidation Additions 16, ,331 38,76 (85) 1,557** 21, ,16 1,182 (2) Net amounts Reclassifi cations Disposals Dec. 31, 211 Dec. 31, 21 Dec. 31, ,361 2,261 other held for disposal (188) (3,635) (1,362) (847) 1, ,792 (737) (259) 11,976 8,359 7,285 14,1 (24) ,35 9,218 9,98 (65) (64) 22,196 1,18 1, , ,842 (12,134) (3,94) 78,177 51,85 48,538 9, ,314 (47) (13) 1,882 2,814 2,778 2,611 2,611 67,979 68,612 12, ,314 (47) (13) 13,493 7,793 71,39 98, ,156 (12,181) (3,917) 91,67 122, ,928 Dec. 31, 29 Dec. 31, 21 22,473 22,361 Jan. 1, 21 Dec. 31, 21 16, (551) 1,546 (1,26) 35,258 1,323 (2) 19, (22) 16,334 1,684** (61) 2,59 (29) ,76 9,58 9,218 (13) 21,23 1,915 1, ,293 8, (121) 2,833 (6) (599) 1,182 7,159 8, ,869 1,883 (1,74) 8,178 (2,697) 86,159 51,67 51,85 8,348 1 (35) 1,213 (19) 9,67 3,672 2,814 2,611 2,611 67,977 67,979 1,959 1 (35) 1,213 (19) 12,218 71,649 7,793 9,828 1,983 (1,19) 9,391 (2,716) 98, , ,643 11
104 12 Consolidated Financial Statements Notes to the Consolidated Financial Statements Consolidated Balance Sheet Disclosures 16 Financial Receivables The Deufol Group has rental and lease agreements under which Deufol is the lessor and essentially all risks and opportunities are transferred to the lessee. These are classified as finance leases with Deufol as the lessor. They relate primarily to buildings, technical equipment and machinery that is used exclusively on a customer-specific basis. Corresponding financial receivables have been recognized on the basis of the net investment in the future lease installments to be paid by the customer. The total future payments from leasing contracts can be broken down as follows as of December 31, 211: figures in thousand Total future payments ,531 16,764 thereof due within one year 2,847 2,859 thereof due between one and five years 8,231 8,952 thereof due in more than five years Present value of future payments 3,453 4,953 11,88 12,532 thereof due within one year 1,953 1,867 thereof due between one and five years 5,947 6,34 thereof due in more than five years Interest element 3,188 4,361 3,443 4,232 These amounts differ from the amounts reported under financial receivables in the balance sheet by 796 thousand (previous year: 891 thousand) since they include expected future investments as well as the minimum lease payments. The financial receivables also include loans amounting to thousand (previous year: 444 thousand). 17 Other Receivables The following table shows the breakdown of the Other receivables and other assets item: and Other Assets Total Current Total Current Value-added tax and other taxes receivable 3,184 3,184 3,96 3,96 Deferred expenses 2,43 1,48 1,278 1,148 Guarantees , Air Cargo Wings GmbH purchase price receivable Receivables from related parties ,25 1, Other 4,445 1,89 3,351 1,52 Total 12,91 8,664 9,89 5,93 figures in thousand Insurance compensation and indemnification Receivables from employees
105 Notes to the Consolidated Financial Statements Consolidated Financial Statements Consolidated Balance Sheet Disclosures 18 Inventories The following table shows the breakdown of inventories: 211 figures in thousand 21 Raw materials, consumables and supplies 9,493 8,535 Finished products and merchandise 1,295 1,986 Work in progress Total 1,488 1,845 12,276 12,366 The reversal amount for inventories recorded as a reduction in the cost of sales amounts to 26 thousand (previous year: 97 thousand). The carrying amount of the inventories reported at the net disposal value amounts to 59 thousand (previous year: 14 thousand). 19 Trade Receivables All trade receivables are non-interest-bearing and are generally due within 3 to 9 days. 211 figures in thousand 21 Trade receivables 5,568 38,846 Valuation adjustments (1,531) (1,22) Trade receivables, net 49,37 37,824 Trade receivables from related parties amount to 384 thousand (previous year: 282 thousand). As of December 31, 211, the age structure of the trade receivables was as follows: Overdue, but not value-impaired Total Neither overdue nor valueimpaired < 3 days 3 6 days 6 9 days 9 18 days > 18 days ,37 34,996 9,715 1, ,824 29,91 6, figures in thousand In respect of the receivables which are neither value-impaired nor overdue, as of the reporting date there are no indications that the debtors will be unable to meet their payment obligations. 13
106 14 Consolidated Financial Statements Notes to the Consolidated Financial Statements Consolidated Balance Sheet Disclosures The following table shows the development of valuation adjustments on trade receivables: figures in thousand Valuation adjustments at start of period 1,22 1,22 Currency translation adjustments Changes to scope of consolidation 2 Cash and Cash Equivalents (3) 9 (3) Addition Utilization (65) (157) Reversal (155) (58) Valuation adjustments at end of period 1,531 1, The following table shows the breakdown of cash and cash equivalents: figures in thousand Cash on hand Checks 2 Bank balances 11,353 16,759 Total 11,416 16,811 There are no restrictions on the amounts reported as cash. 21 Classified Assets Held for Disposal 22 Subscribed Capital The classified assets held for disposal are a property in Brookville, Indiana, which is not currently used and whose disposal is envisaged. This property is owned by our subsidiary Deufol Sunman Inc. As of December 31, 211, the Subscribed Capital is 43,773,655 (previous year: 43,773,655) and is divided up into the same number of no-par value shares to bearer. An amount of 2,, remained unchanged as Approved Capital as of December 31, 211 for the issuance of new shares in return for cash contributions or contributions in kind (end of previous year: 2,,). In accordance with the resolution passed by the Annual General Meeting on June 16, 29, the Company has been authorized to increase the Company s share capital by up to 2,, by June 15, 214. As of December 31, 211, the Contingent Capital amounts to 8,413,296 (end of previous year: 8,413,296). In accordance with the resolution passed by the Annual General Meeting on June 22, 21, the Company has been authorized to purchase up to 4,377,365 of its own shares in the period from June 22, 21 to June 21, 215; this corresponds to 1 % of the share capital as of June 21.
107 Notes to the Consolidated Financial Statements Consolidated Financial Statements Consolidated Balance Sheet Disclosures 23 Capital Reserves At the end of 211, the capital reserves continue to amount to 17,24 thousand. The capital reserves mainly consist of the premium resulting from the issue of shares plus payments by the shareholders. 24 Noncontrolling Equity Interests The noncontrolling equity interests primarily consist of shares held by external third parties in Deufol Tailleur Group companies. The development of these shares is outlined in detail in the statement of changes in equity. Proposal for the Appropriation of Net Profit In the invitation to the Annual General Meeting, the Executive and Supervisory Boards will propose the appropriation of the net income (calculated according to German Commercial Code principles) of Deufol AG for the fiscal year 211 in the amount of 9,411 thousand. 25 Share-Based Payment Stock Option Plan August 22 At the Annual General Meeting on August 13, 22, a stock option plan was resolved for members of the Executive Board and members of the management of subsidiaries in Germany and abroad with a volume of up to 85, shares. The issue period was limited to twelve days after publication of quarterly or annual financial statements. The subscription price was calculated as the average price after such a publication plus 25 %. Stock options were exercisable for the first time two years after issue and only during the issue period of ten days, starting twelve days after the publication of quarterly or annual financial statements. An exercise hurdle of an additional 5 % on the subscription price had to be observed. The stock options were issuable on one or several occasions up to August 12, 27, and had a term of three years. Under the Stock Option Plan August 22, stock options were issued as follows: figures in units Stock options 33,334 1, 1, 8, 93,75 The changes in the options issued to eligible employees under the Stock Option Plan August 22 are summarized in the following table: 211 Number 21 Exercise price (average, in ) Number Exercise price (average, in ) Options outstanding (at January 1) 93, Options expired 93, Options outstanding (at December 31) of which exercisable at December 31 15
108 16 Consolidated Financial Statements Notes to the Consolidated Financial Statements Consolidated Balance Sheet Disclosures In accordance with IFRS 2 Share-Based Payment, the fair value of the stock options issued is determined using an option price model. The total value of the options at the issue date is recognized ratably as a personnel cost over the lock-up (vesting) period. In the fiscal years 21 and 211, the options issued under the Stock Option Plan August 22 did not result in any personnel costs. At the end of 21 and 211, there were no longer any outstanding options. The fair value of equity-settled stock options is determined at the grant date using the Black Scholes option pricing model. The calculation at the relevant exercise date was based on the following parameters: Issue / valuation date Jun. 6, 25 Apr. 21, 26 Sep. 5, 26 Apr. 24, 27 Share price at the issue date ( ) Subscription price ( ) Expected share price volatility (%) Expected dividend yield (%).... Risk-free interest rate (%) Term of options (years) The expected volatility is based on the assumption that future trends can be inferred from historical volatility; however, actual volatility may differ from the assumptions made. No other factors relating to the option grant were incorporated into the measurement of fair value. 26 Financial Liabilities The following table summarizes the financial liabilities of the Deufol Group: thereof with a remaining maturity of Total up to 1 year 1 to 5 years over 5 years Total up to 1 year 1 to 5 years over 5 years 7,653 28,15 38,72 3,783 68,815 39,93 24,282 5,44 8,914 2,162 5,266 1,486 9,32 1,99 5,547 1, ,62 3,312 44,39 5,269 78,186 41,83 29,88 7,223 figures in thousand Amounts due to banks Liabilities under financial leases Other financial liabilities Financial liabilities thereof with a remaining maturity of Property, plant and equipment in the amount of 3.7 million (previous year: 33.8 million), trade receivables in the amount of 1.6 million (previous year: 7.3 million) and inventories in the amount of 4.6 million (previous year: 5.4 million) have been pledged as collateral to secure liabilities to banks and other financial liabilities. These assets have been collateralized subject to standard terms and modalities.
109 Notes to the Consolidated Financial Statements Consolidated Financial Statements Consolidated Balance Sheet Disclosures Liabilities to Banks Current account credit lines of 54.1 million are available to the Group at various banks (previous year: 34.1 million). As of December 31, 211, 26.9 million (previous year: 23.8 million) of this had been utilized, subject to variable interest rates. The financial liabilities carried in the balance sheet are subject to standard market interest rate risks. In fiscal year 211, the average weighted interest rate for shortterm loans was 4.93 % (previous year: 4.16 %). The following table shows the Group s material noncurrent liabilities to banks: 211 Currency Net carrying amount ( thousand) 21 Remaining maturity (years) Effective interest rate (%) Currency Net carrying amount ( thousand) Remaining maturity (years) Effective interest rate (%) Loans EUR 7, EUR 8, Loans EUR 3, EUR 4, Loans EUR 1, EUR 2, Loans EUR 1, 1 variable* 5.25 EUR 1, 2 variable* 5.25 Loans EUR 9,5 4 variable** EUR 7,5 3.5 variable* * 3-month EURIBOR % ** 3-month EURIBOR + 3. % There are also further noncurrent amounts due to banks for financing of property, plant and equipment, particularly technical equipment and machinery, in the amount of 1.6 million (previous year: 11.4 million). The liabilities to banks also include liabilities under finance leases in the amount of 5.3 million (previous year: 6.5 million). For the variable-interest loans interest-rate hedging transactions have been concluded in some cases. Please see Note (42) on pages Liabilities under Financial Leases 114 ff. for further disclosures. The total future minimum payments from financial leasing contracts can be broken down as follows as of December 31, 211: figures in thousand Total future minimum lease payments thereof due within one year thereof due between one and five years thereof due in more than five years Present value of future minimum lease payments ,337 23,191 4,75 4,81 1,969 12,472 4,663 5,99 14,217 15,864 thereof due within one year 3,411 3,369 thereof due between one and five years 7,493 8,582 thereof due in more than five years Interest element 3,313 3,913 6,12 7,327 17
110 18 Consolidated Financial Statements Notes to the Consolidated Financial Statements Consolidated Balance Sheet Disclosures The following table shows the liabilities under financial leases included in the amounts due to banks: figures in thousand Total future minimum lease payments 6,77 8,38 thereof due within one year 1,539 1,729 thereof due between one and five years 2,862 3,847 thereof due in more than five years Present value of future minimum lease payments 2,36 2,732 5,25 6,544 thereof due within one year 1,254 1,379 thereof due between one and five years 2,168 3,34 thereof due in more than five years Interest element 1,828 2,131 1,457 1,764 In several cases extension or purchase options plus price-adjustment clauses apply which are based on standard indexes. 27 Provisions for Pensions The Deufol Group has both defined-contribution and defined-benefit pension schemes in place. The definedbenefit pension plans include pension obligations (funded and unfunded) and noncurrent-benefit entitlements (provisions for similar post-employment benefits). Noncurrent-benefit entitlements are recognized in the balance sheet at the Italian subsidiary. The recognized provisions can be broken down as follows: Provisions for pensions Provisions for other post-employment benefits figures in thousand Liability to pension fund 2,693 Total 3,885 1,298 The pension obligations (actuarial present value of benefit entitlements or defined-benefit obligation) were calculated using actuarial methods. The calculations were based on the following parameters: Germany figures as % 211 Italy Discount rate Turnover rate*.... Index-linked salary increase Index-linked pension increase * No assumptions are made with regard to turnover, as all benefits are vested. Pension obligations are measured in accordance with the provisions of IAS 19.
111 Notes to the Consolidated Financial Statements Consolidated Financial Statements Consolidated Balance Sheet Disclosures The following table shows the changes in the present value of the total obligation: figures in thousand Present value of the obligation at January 1 1,24 1,269 Current service cost Interest cost Pension payments Actuarial losses Present value of the obligation at December (145) (91) 14 (28) 1,126 1,24 The present value of the total obligation was 1,373 thousand at December 31, 27, 1,264 thousand at December 31, 28, and 1,269 thousand at December 31, 29. The actuarial gains and losses amounted to thousand on December 31, 27, to 113 thousand on December 31, 28, and to 38 thousand on December 31, 29. The expected pension expense for 212 is 53 thousand. Adjustment to reconcile the total obligation to net pension provisions: figures in thousand Present value of the total obligation at December 31 1,126 1,24 Unrealized gains Net pension provisions at December ,192 1,298 The net pension provisions recognized in the balance sheet changed as follows in the fiscal year: figures in thousand Net pension provisions at January 1 1,298 1,335 Current pension expense Pension payments (145) (91) Net pension provisions at December 31 1,192 1, Pension expense in the fiscal year can be broken down as follows: figures in thousand Current service cost Interest cost Actuarial losses Total pension expense (14)
112 11 Consolidated Financial Statements Notes to the Consolidated Financial Statements Consolidated Balance Sheet Disclosures For fiscal year 212, lower pension payments than in the previous year are expected. In the case of the defined-contribution plans, the Deufol Group does not enter into any obligations above and beyond its obligation to pay contributions. In 211, pension expenses relating to defined-contribution plans totaled 346 thousand (previous year: 321 thousand). In addition, contributions were paid to state pension insurance agencies in the amount of 3,873 thousand (previous year: 3,843 thousand). The Company has carried as a liability in relation to a pension fund an amount of 2,693 thousand in connection with the closure of the so-called Carton Business. No calculations in accordance with IAS 19 are required for this obligation but it requires repayment over a period of 2 years in equal installments of 268 thousand. Please see Note (9) for further disclosures. 28 Other Provisions The following table shows the changes in other provisions: Jan. 1, 211 Utilization Reversal Addition Changes in scope of consolidation Dec. 31, (117) (254) figures in thousand Guarantee and liability risks Litigation risk 381 (35) (65) 281 Restructuring 569 (25) (13) Other risks Total 98 (164) (98) ,27 (566) (547) 44 1,597 Provisions for guarantee and liability risks included assuming obligations for former subsidiaries and the claims from damage and other warranties. These provisions were recognized on the basis of experience from previous years. The accruals for legal disputes were made for anticipated claims due to ongoing legal disputes. The accrual for restructuring comprises social security plan costs incurred by the Italian subsidiary.
113 Notes to the Consolidated Financial Statements Consolidated Financial Statements Consolidated Balance Sheet Disclosures The provisions recognized by the Deufol Group are mainly current provisions. More specifically, the outflows are structured as follows based on when they are expected to be settled: Current figures in thousand Total Guarantee and liability risks Restructuring Other risks ,177 1, ,597 2,27 Other liabilities can be broken down as follows: Total Current Total Current 2,461 2,461 1,99 1, Liabilities to employees relating to wages and salaries 2,187 2,187 1,899 1,899 Other liabilities to employees (annual leave, overtime, etc.) 5,75 5,75 4,572 4,572 Deferred income 3, , ,78 1,78 figures in thousand Value-added tax and other taxes payable Social security liabilities Liabilities to related parties Liabilities to former shareholders 3 Trade Payables 211 Litigation risk Total 29 Other Liabilities 211 Noncurrent Other 1,875 1,346 3,138 2,231 Total 16,624 13,519 16,555 12,672 Trade payables amount to 28,971 thousand (previous year: 25,926 thousand) and all have a remaining term of less than one year. This includes liabilities for trade payables that have not yet been invoiced in the amount of 1,899 thousand (previous year: 1,944 thousand). 111
114 112 Consolidated Financial Statements Notes to the Consolidated Financial Statements Consolidated Cash Flow Statement Disclosures Consolidated Cash Flow Statement Disclosures The consolidated cash flow statement is prepared in accordance with IAS 7. It shows the origin and appropriation of the money flows in the fiscal years 211 and 21. It is of key significance for an assessment of the financial position of the Deufol Group. The cash flow statement distinguishes between cash flows from operating activities, investing activities and financing activities. The cash and cash equivalents reported in the cash flow statement correspond to the Cash and cash equivalents item in the balance sheet and comprise cash on hand, checks and immediately available bank balances with an original maturity of up to three months. A breakdown of cash and cash equivalents is provided in Note (2). The cash flow from investing activities and the cash flow from financing activities are both calculated directly. In contrast, the cash flow from operating activities is derived using the indirect method. 31 Net Cash Provided by Operating Activities In fiscal year 211, operating activities provided net cash of 4.6 million (previous year: 19.9 million). It should be noted that adjustments were made for the effects of changes in the scope of consolidation. In the Other noncash revenue and expenses position, the 2.5 million addition to the pension commitment for the discontinued operation was also adjusted. 32 Acquisitions and Sales Please see page 33 Net Cash Used In the past fiscal year, a.4 million (previous year: 4.4 million) outflow of funds from investing activities in Investing Activities 9 for details of acquisitions and sales. resulted. The investments in intangible assets and property, plant and equipment amounted to 6.2 million and an inflow of funds in the amount of 1.7 million resulted from the disposal of intangible assets and property, plant and equipment. The net change in financial receivables in the amount of 1.8 million and interest received in the amount of 2. million were also significant. 34 Net Cash Used in Financing Activities In the past fiscal year, a 9.8 million (previous year: 13.5 million) outflow of funds from financing activities resulted. This mainly consists of interest paid in the amount of 6.1 million, the decrease in other financial liabilities in the amount of 2. million and distributions in the amount of 1.7 million. In 211, Deufol AG paid a dividend per share of.3, corresponding to a total dividend of approx. 1.3 million. In 21, no dividend was paid out. 35 Change in Cash and Cash Equivalents The cash and cash equivalents balance decreased by 5.4 million from 16.8 million to 11.4 million. Net financial indebtedness defined as financial liabilities less the Group s financial receivables, cash and cash equivalents rose by 8.6 million.
115 Notes to the Consolidated Financial Statements Consolidated Financial Statements Other Disclosures Other Disclosures 36 Contingencies and Contingent Liabilities Within the Group, guarantees have been granted to third parties only for items reported in the balance sheet or reciprocal rental payment guarantees within the Group. The Group has guarantees to associates totaling thousand (previous year: thousand). Expenses amounting to 2,65 thousand (previous year: 18,982 thousand) were recognized in the consolidated income statement due to rental agreements and leases that do not qualify as finance leases under IFRSs (Operating Leases). The proportion of contingent lease payments included therein is of minor significance. We examine legal disputes and administrative procedures on an individual basis. We evaluate the possible outcomes of such legal disputes on the basis of the information we have received and in consultation with our lawyers and tax advisers. Where we are of the opinion that an obligation will probably lead to future fund outflows, we carry as a liability the present value of the expected fund outflows where these are deemed to be reliably measurable. Legal disputes and tax affairs present complex issues and are associated with a large number of imponderabilities and difficulties, including the facts and circumstances of the individual case and the authority involved. Deufol AG s key legal risks are indicated in the following. Tax assessment notices were issued in January 29 against a Group company for previous fiscal years, requiring an additional tax payment due to alleged concealed dividend payments to former shareholders of this subsidiary in the amount of 3.7 million. Objections have been lodged against these notices. On the basis of legal assessments, due to the appeal procedure, the Group considers it likely that the tax assessment notices will not be enforced. Moreover, Deufol AG is not obliged to settle this company s liabilities. Accordingly, as of December 31, 211, no accrual was made for this item. An external audit of Deufol Italia S. p. A. has resulted in an audit finding that would entail a material additional tax payment. The context of this audit is the loss of a major client in 26. In the view of the fiscal administration, other companies of the Deufol Group compensated for the loss of this client. The management maintains that this audit finding is untenable and that the regulations cited by the tax office are not applicable in this instance. It has therefore lodged an appeal against this finding and does not expect this matter to lead to any tax payments for the Company. Accordingly, Deufol AG has not made any accrual for this in its consolidated financial statements. The social security authorities in Belgium have notified Deufol Packaging Tienen N. V. that it belongs to a different category of employer with retrospective effect as of January 1, 29 and therefore falls under the remit of other so-called joint committees. This would entail a higher wage structure and thus increased personnel costs, amounting to a maximum of approx. 1. million as of December 31, 211. Deufol Packaging Tienen N. V. maintains that this assessment is incorrect. It therefore brought an action against this notice before the competent labor court and was successful before the court of first instance in June 211. The social security authorities have lodged an appeal but a ruling is not expected before the end of 212. The management assumes that it is also highly likely to succeed before the higher court. On this basis, no accrual has been made in the consolidated financial statements of Deufol AG. 37 Obligations under Operating The future (nondiscounted) minimum lease payments under such noncancelable leases are as follows: Leases Group as Lessee Dec. 31, 211 Dec. 31, 21 Not later than one year 13,928 12,74 Later than one year and not later than five years 22,71 24,215 5,478 7,692 42,17 44,647 figures in thousand Later than five years Total minimum lease payments 113
116 114 Consolidated Financial Statements Notes to the Consolidated Financial Statements Other Disclosures These standard market obligations result primarily from leases for warehouse or office space, vehicles, and IT and office equipment. The leases have terms of between one and six years and, in some cases, contain a renewal option. 38 Receivables under Operating Leases Group as Lessor The Deufol Group has concluded leases for the commercial leasing of its investment property. These leases have remaining, noncancelable terms of between three and five years. All leases contain a clause under which the rent can be adjusted annually on the basis of prevailing market conditions. In accordance with IAS 17, further contracts have been classified as operating leases with the Group as lessor. These contracts have remaining, noncancelable terms of between one and five years. As of December 31, 211, receivables in the form of future minimum lease payments under noncancelable operating leases are as follows: figures in thousand Dec. 31, 211 Not later than one year 1,668 2,475 Later than one year and not later than five years 3,972 2,735 Later than five years Total minimum lease payments 39 Contingent Assets Dec. 31, ,13 6,185 6,223 As of the balance sheet date, as in the previous year, there were no contingent assets that could have a significant financial impact on the Deufol Group. 4 Government Grants In 211, the Deufol Group received no government grants. In 21 the Deufol Group received a total of.19 million in government grants for the reactivation of a rail connection. 41 Capital Management Disclosures In principle, Deufol s goal is to secure its equity capital base on a long-term basis. A Group equity ratio in excess of 4 % is aimed for. At December 31, 211, the Group s equity ratio was 42.1 % (previous year: 43.6 %). The equity ratio thereby functions merely as a passive management criterion, with sales and the operating result (EBIT) being used as active management variables. In some cases within the Group, credit agreements are tied to compliance with financial ratios. In these cases, the development of the relevant financial ratios forms a fixed component of the reporting of the affected companies, for early recognition and rectification of undesirable trends and negotiations with the relevant lenders. 42 Financial Risk Management The Deufol Group is exposed to various financial risks in its normal business activities. These include, in particular, market risks (currency risk, interest risk and goods price risk), the risk of nonpayment and the liquidity risk. The Deufol Group uses a standardized, Group-wide risk management system to manage these risks. The aim is to establish an operating routine based on actions, and therefore on constant risk minimization. Within the Deufol Group, derivatives are used exclusively for risk reduction purposes.
117 Notes to the Consolidated Financial Statements Consolidated Financial Statements Other Disclosures Currency risk The currency risk is the risk of the fair value or future cash flows of a financial instrument being subject to change due to exchange-rate fluctuations. Overall, the risks resulting from the change in exchange rates are of minor significance for the operating activities of the Deufol Group. The main effect on the Group s assets position resulted from the translation of the American companies US-dollar-denominated financial statements into the reporting currency euro. Further currency risks result from the consolidation of the Czech company. If the euro were 1 % stronger (weaker) against the US dollar, the earnings of the Group would have been 312 thousand higher (lower), and in the previous year 195 thousand higher (lower). The balancing item in equity would have been 1,341 thousand lower (higher), and in the previous year 1,346 thousand lower (higher). The Deufol Group has not currently used any forward exchange transactions to hedge currency risks. Interest rate risk The interest rate risk is the risk of the fair value or future cash flows of a financial instrument being subject to fluctuation due to changes in the market interest rate. Businesses may be exposed to this risk through both variable-interest and fixed-interest financial instruments. The Deufol Group holds both fixed-interest and variable-interest financial instruments. In some cases, interest-rate hedging transactions in the form of interest rate swaps have been entered into to secure significant, variable-interest noncurrent bank loans. The following table shows the Group s interest-rate hedging transactions at December 31, 211: Interest rate derivatives Maturity Notional amount Fair value Euro 15,, (342,934) Jun. 29, 27 Jun. 3, 214 Euro 5,, (77,322) Nov. 15, 27 May 15, 212 Currency Start date Maturity date The following table shows the interest-rate hedging transactions as of December 31, 21: Interest rate derivatives Currency Maturity Notional amount Fair value Start date Maturity date Euro 15,, (524,676) Jun. 29, 27 Jun. 3, 214 Euro 5,, (241,773) Nov. 15, 27 May 15, 212 US dollar 2,18,556 (77,534) Jan. 1, 27 Jan. 1, 212 The euro-denominated interest rate swaps are allocated to directly and indirectly earmarked loans in the form of cash flow hedges. The change in the fair value of these interest rate swaps is reported in other recognized income and expense. The fair values are based on market prices for comparable instruments. Due to the entirely effective hedge relationship, no ineffectivity was recorded in the income statement. The US-dollar-denominated hedge is no longer effective, so that changes in fair value are recorded in the income statement. If the interest rate level as of December 31, 211 had been 1. % higher (lower), the market value of the interest rate swaps would have been 94 thousand higher or 91 thousand lower (previous year: 442 thousand higher or 28 thousand lower). 115
118 116 Consolidated Financial Statements Notes to the Consolidated Financial Statements Other Disclosures If the interest rate level as of December 31, 211 for variable-interest liabilities had been an average of 1 basis points higher (lower), this would have had an effect on the Group s interest expense in the approximate amount of 249 thousand (previous year: 232 thousand). Goods price risk The Group s key requirements include packaging materials such as wood, foils, screws and cardboard. The purchasing prices for these products may fluctuate, depending on the market situation. It is not always possible to directly pass on fluctuating prices to customers. A goods price risk, therefore applies which may influence the Group s earnings, equity and cash flow situation. To minimize risks outline delivery agreements have been concluded with various suppliers. In addition, some agreements include a stipulation that the cost of materials will be passed on directly, so that no goods price risk applies in the case of these agreements. Credit risk (nonpayment risk) The Group only enters into business with creditworthy third parties. In almost all cases, customers of the Deufol Group are major industrial companies with good or very good credit standing. In addition, the Group s receivables are continuously monitored so that the Group is not exposed to any significant default risk. The maximum default risk for trade receivables is limited to their carrying amount. Please see Note (19) for further disclosures. In case of other financial assets of the Group such as cash and cash equivalents, receivables under finance leases and other assets, the maximum credit risk in the event of the counterparty s default is the carrying amount of these instruments. Liquidity risk The liquidity risk is the risk of a company experiencing difficulties in meeting its payment obligations for its financial instruments. The Deufol Group is financed in a decentralized form. Most financing is provided by means of bilateral bank loans and syndicated borrowing facilities. The consolidated companies liquidity status is continuously monitored by means of a standardized monthly reporting system. The following table shows all the contractually agreed payments for interest and repayment for financial liabilities shown in the balance sheet: figures in thousand to 216 after ,166 44,547 6,493 3,166 8,17 2, At December 31, 211 Amounts due to banks Liabilities under financial leases Other financial liabilities Trade payables 28,971 Other liabilities (excl. tax liabilities) 1, to 215 after ,83 34,297 6,291 3,81 8,625 3,177 Derivative financial liabilities figures in thousand At December 31, 21 Amounts due to banks Liabilities under financial leases 51 Trade payables Other financial liabilities 25,926 Other liabilities (excl. tax liabilities) 1, Derivative financial liabilities
119 Notes to the Consolidated Financial Statements Consolidated Financial Statements Other Disclosures Further Financial Instruments The net result for the financial instruments in terms of valuation categories is as follows: Disclosures From subsequent measurement From interest At fair value Currency translation Valuation adjustment From disposal figures in thousand 938 (42) 518 (563) Financial assets available for sale Loans and receivables Financial assets held for trading Financial liabilities measured at amortized cost (4,985) (4,985) (5,35) 52 Financial liabilities held for trading Valuation of financial instruments Cash and cash equivalents and trade receivables normally have short residual maturities. Accordingly, on the reporting date their carrying amounts approximately correspond to the fair value. Trade payables and other liabilities generally have short residual maturities. The figures shown in the balance sheet therefore approximately correspond to the fair values. The fair values of interest-bearing loans and borrowings and lease liabilities are calculated as the present value of the payments associated with the liabilities, with use of market interest rates. In the balance sheet as of December 31, 211, derivative financial liabilities in the amount of 42 thousand (previous year: 844 thousand) were exclusively measured at fair value. The fair value of these liabilities was determined on the basis of factors which are observable directly (e. g. prices) or indirectly (e. g. derived from prices). This fair-value measurement is therefore allocable to Level 2 of the hierarchical system of classification defined by IFRS 7. The fair-value hierarchy levels are as follows: Level 1: Quoted market prices for identical assets and liabilities in active markets, Level 2: Information other than quoted market prices which is observable directly (e. g. prices) or indirectly (e. g. derived from prices), and Level 3: Information for assets and liabilities which is not based on observable market data. 117
120 118 Consolidated Financial Statements Notes to the Consolidated Financial Statements Other Disclosures The carrying amounts for the financial instruments in terms of valuation categories are as follows: Balance sheet valuation (IAS 39) Category Net carrying amount Dec. 31, 211 Amortized cost Fair value not recognized in income Fair value recognized in income Valuation acc. IAS 17 Fair value Dec. 31, 211 Cash and cash equivalents 1) 11,416 11,416 11,416 Trade receivables 1) 49,37 49,37 49,37 Other receivables 1) 7,287 7,287 7,37 n. a. 1,292 1,292 12,56 figures in thousand Assets Receivables from the finance lease Other financial receivables 1) Financial assets 2) Amounts due to banks 4) 7,653 7,653 71,246 Trade payables 4) 28,971 28,971 28,971 n. a. 8,914 8,914 11,837 4) 1,717 1,717 1,695 n. a Equity and liabilities Liabilities under financial leases Other liabilities Derivatives with hedge relationships Aggregated by valuation category acc. IAS 39 1) Loans and receivables 67,74 67,74 67,49 2) Financial assets available for sale ) Financial assets held for trading 11,341 11,341 11,912 4) F inancial liabilities measured at amortized cost 5) Financial liabilities held for trading
121 Notes to the Consolidated Financial Statements Consolidated Financial Statements Other Disclosures Balance sheet valuation (IAS 39) Category Net carrying amount Dec. 31, 21 Amortized cost Fair value not recognized in income Fair value recognized in income Valuation acc. IAS 17 Fair value Dec. 31, 21 Cash and cash equivalents 1) 16,811 16,811 16,811 Trade receivables 1) 37,824 37,824 37,824 Other receivables 1) 5,516 5,516 5,515 n. a. 11,641 11,641 16,15 Other financial receivables 1) Financial assets 2) Amounts due to banks 4) 68,815 68,815 69,269 Trade payables 4) 25,926 25,926 25,926 n. a. 9,32 9,32 12,573 4) 1,322 1,322 1,3 n. a figures in thousand Assets Receivables from the finance lease Equity and liabilities Liabilities under financial leases Other liabilities Derivatives with hedge relationships Aggregated by valuation category acc. IAS 39 1) Loans and receivables 6,595 6,595 6,594 2) Financial assets available for sale ) Financial assets held for trading 15,63 15,63 15, ) F inancial liabilities measured at amortized cost 5) Financial liabilities held for trading 119
122 12 Consolidated Financial Statements Notes to the Consolidated Financial Statements Segment Information by Region and Service Segment Information by Region and Service 43 Segment Reporting The segment reporting is prepared in accordance with the provisions of IFRS 8 (Operating Segments). Deufol AG revised its segment reporting at the start of 211. Its primary reporting format is now based on geographical regions which have been grouped for the purpose of corporate management. As the segment result used for assessment of the business success of the respective segments the management has calculated the result for the period before taxes, financial income, financial expenses, shares of profits of companies accounted for using the at-equity method, and amortization / impairment of goodwill (EBITA). The Deufol Group has the following segments for which reporting requirements apply: Germany Rest of Europe USA / Rest of the World The holding company covers the Group s administrative activities and in addition to Group management functions includes support functions such as key account management and corporate communications. The operating result (EBITA) for the business units is separately monitored by the management in order to make decisions on the allocation of resources and to determine the units performance. The segments development is mainly measured with reference to the operating result. As the Deufol Group has a decentralized organizational structure, financial expenses and income and income taxes can be allocated to the individual business segments. The prices charged between the business segments are determined on the basis of standard market conditions between unrelated parties.
123 Notes to the Consolidated Financial Statements Consolidated Financial Statements Segment Information by Region and Service 44 Segment Information by Region Elimination Group ,19 1,781 (34,73) (34,73) 315,19 1,713 Holding company Germany Rest of Europe USA / Rest of the World External sales 173,166 87,4 54,525 Internal sales 24,636 8, ,82 95,319 54,559 2,24 figures in thousand 211 Total sales EBIT 5,365 7,433 1,64 (3,113) (36) Financial income 1,381 1, ,722 (3,111) 2,14 (3,617) (1,413) (2,55) (1,566) 3,111 (6,35) Finance costs Earnings from associates EBT ,83 7,979 (1,47) (2,957) (36) 7,382 Taxes (3,51) Result for the period Assets of which investments accounted for using the at-equity method 3,872 12,338 68,844 35, ,853 (198,311) 2, Non-allocated assets 22,879 2,794 12,47 Total assets 233,349 Financial liabilities 27,592 21,49 44,72 32,653 (46,754) 79,62 Other debt 58,867 18,413 1,28 7,911 (44,322) 51,77 Non-allocated debt 4,316 Total liabilities 135,13 Depreciation, amortization and impairment 4,22 2,969 1, ,79 Investments 3,666 1,691 1,824 1,35 8,531 External sales 16,866 85,169 56, ,26 Internal sales 23,674 6,611 1,848 (32,133) 184,54 91,78 56,689 2,15 (32,133) 33,26 11, Total sales EBIT 7,326 4,982 2,49 (2,454) (36) Financial income 1,224 1,471 1,558 (2,757) 1,496 (3,465) (1,423) (2,769) (1,534) 2,757 (6,434) Finance costs Earnings from associates EBT ,688 5,3 (72) (2,43) (36) 7,532 Taxes (2,998) Result for the period Assets of which investments accounted for using the at-equity method 4,534 93,57 67,493 34, ,49 (178,34) 2,74 Non-allocated assets 214,548 2,74 12,334 Total assets 226,882 Financial liabilities 28,715 24,53 38,445 2,97 (33,934) 78,186 Other debt 46,186 17,821 7,146 7,199 (32,33) 46,49 Non-allocated debt 3,671 Total liabilities 127,96 Depreciation, amortization and impairment 3,844 2,941 1, ,695 Investments 5,599 1,84 1, ,
124 122 Consolidated Financial Statements Notes to the Consolidated Financial Statements Segment Information by Region and Service The Deufol Group has various customers which are themselves subsidiaries of a corporate group. As in the previous year, the Deufol Group realized approx. 24 % of its total sales with these customers. This relates to the segments Germany, Rest of Europe and USA / Rest of the World. None of these customers provided more than 1 % of sales. 45 Segment Information The following table shows the sales trend by service: by Service Elimination Group ,19 1,781 (34,73) (34,73) 315, ,26 1,848 (32,133) (32,133) 33,26 Holding company Export & Industrial Packaging Consumer & Data Packaging Supplementary Services External sales 157,164 19,985 47,582 Internal sales 27,598 2,49 2, , ,394 5,524 2,24 External sales 14, ,666 46,945 Internal sales 26,5 2,31 1, , ,976 48,42 2,15 figures in thousand 211 Total sales 21 Total sales 46 Events after the Balance Sheet Date On April 4, 212, the Executive and Supervisory Boards of Deufol AG, Hofheim, filed charges with the Frankfurt am Main public prosecutor s office versus persons including the former managing director of the subsidiary Deufol Tailleur GmbH and the former Chairman of the Executive Board of Deufol AG. The Frankfurt am Main public prosecutor s office has now initiated preliminary proceedings. Deufol AG already parted ways with these persons in late 211. In the period from 26 to 211, they are suspected of having acted in business dealings to the detriment of the Deufol Group. The damage is a low eight-figure euro amount. As well as the criminal proceedings which are now underway, Deufol AG will also assert compensation claims in a civil action. The Company is confident in its ability to enforce these compensation claims.
125 Notes to the Consolidated Financial Statements Consolidated Financial Statements Supplementary Disclosures Supplementary Disclosures Disclosures Concerning the Executive Bodies The following persons were appointed to the Supervisory Board during the reporting period: Helmut Olivier (Chairman of the Supervisory Board since November 24, 211, Deputy Chairman to November 24, 211) Executive Board member of Lehman Brothers AG i. Ins., appointed until the 213 Annual General Meeting Prof. Dr. Wolfgang König (since June 29, 211, Deputy Chairman since November 24, 211) Managing Director at House of Finance, Goethe University Frankfurt, Frankfurt am Main, appointed until the 213 Annual General Meeting, Supervisory Board member of Veritas AG, Mannheim Mr. Wulf Matthias (since November 24, 211) Managing Director at Bank Sarasin AG, Frankfurt am Main, appointed until the 213 Annual General Meeting, Supervisory Board member of Wirecard AG, Wirecard Bank AG and Wirecard Technologies AG, all seated in Aschheim Georg Melzer (Chairman of the Supervisory Board to November 24, 211) Lawyer at the law firm Thum & Cie and Legal Officer at DZ Bank, Supervisory Board member of DeDeMa AG, Hofheim am Taunus Prof. Dr. Kai Furmans (to June 29, 211) Holder of the endowed chair in logistics at the University of Karlsruhe, Supervisory Board member of j & m Management Consulting AG, Mannheim No loans or advances were granted to members of the Supervisory Board, nor were any contingent liabilities assumed in favor of the members of the Supervisory Board. In 211, Supervisory Board compensation totaled 8 thousand (previous year: 8 thousand). This amount was divided up as follows between the individual Supervisory Board members: Helmut Olivier (Chairman since November 24, 211) 22 thousand, Prof. Dr. Wolfgang König (since June 29, 211) 1 thousand, Mr. Wulf Matthias (since November 24, 211) 2 thousand, Georg Melzer (Chairman to November 24, 211) 36 thousand, Prof. Dr. Kai Furmans (to June 29, 211) 1 thousand. The following persons were appointed to the Executive Board during the reporting period: Name and position Other board positions held Detlef W. Hübner Businessman Member of the Executive Board Appointed until December 31, 213 Member of the Supervisory Board of DeDeMa AG, Hofheim (since October 24, 21) Member of the Supervisory Board of PickPoint AG, Hofheim (to September 14, 211) Executive Board member of the Detlef Hübner Foundation, Hofheim (since December 19, 2) Dr. Tillmann Blaschke (since July 1, 211) Businessman CFO since November 28, 211 Appointed until June 3, 214 No other board positions held Tammo Fey Businessman CFO to November 28, 211 Appointed until December 31, 211 Member of the Supervisory Board of PickPoint AG, Hofheim (to September 14, 211) Group positions: Supervisory Board member of Logis průmyslové obaly a. s., Ivancice (since August 31, 21) Andreas Bargende (to November 28, 211) Lawyer CEO Chairman of the Supervisory Board of PickPoint AG, Hofheim (to September 14, 211) Group positions: Member of the Board of Directors of Deufol Italia S. p. A., Fagnano Olona, Italy (since April 18, 28) 123
126 124 Consolidated Financial Statements Notes to the Consolidated Financial Statements Supplementary Disclosures The total remuneration of the Executive Board can be broken down as follows: figures in thousand Fixed remuneration 1,27 1, Variable remuneration Other remuneration Total ,564 1,388 Executive Board compensation in 211 totaled 1,554 thousand (previous year: 1,388 thousand). For further information, please refer to the remuneration report contained in the management report. Securities Held by the Organs On December 31, 211, the Executive Board held 23,25,632 shares. The members of the Supervisory Board do not hold either shares or options to purchase shares in Deufol AG. The securities holdings are as follows: Executive Board No-par value shares at Dec No-par value shares at Dec Dr. Tillmann Blaschke 29,8 Tammo Fey 15, 15, Detlef W. Hübner 23,16,832 23,11,832 Total 23,25,632 23,125,832 Mr. Detlef W. Hübner holds most of his shares indirectly through Lion s Place GmbH, Hofheim am Taunus. Andreas Bargende resigned from the Executive Board on November 28, 211. In late 21, he held 58, shares. Directors Dealings Transactions of the organs involving financial instruments of Deufol AG are notified promptly in accordance with the statutory regulations. An overview of transactions can be found on the website of Deufol AG ( in the Investor & Public Relations area under the heading The share. Declaration of Conformity in The declaration of conformity with the recommendations of the Government Commission on the German Accordance with Section 161 Corporate Governance Code required under section 161 of the German Stock Corporation Act was issued of the German Stock Corpora- in February 212 and made permanently available to shareholders on the Internet. tion Act Information in Accordance The consolidated financial statements of Deufol AG have a discharging effect for the preparation and with Section 264 (3) of the disclosure of the annual financial statements of the consolidated corporations pursuant to section 264 (3) German Commercial Code HGB once the preconditions laid down in these provisions have been fulfilled. The following consolidated companies will in this case make use of the exemption provisions: Deufol Nürnberg GmbH, Nuremberg (previously Deufol Tailleur GmbH, Oberhausen) Deufol Frankfurt GmbH, Frankfurt am Main Deufol West GmbH, Oberhausen Deufol Süd GmbH, Neutraubling (previously Deufol Nürnberg GmbH, Nuremberg) Deufol Remscheid GmbH, Remscheid (previously Günter Baumann Transport + Verpackung GmbH, Oberhausen) IAD Industrieanlagen-Dienst GmbH, Munich Deufol Berlin GmbH, Berlin
127 Notes to the Consolidated Financial Statements Consolidated Financial Statements Supplementary Disclosures Relationships with Related Parties Apart from the companies included in the consolidated financial statements, Deufol AG also has direct or indirect relations with joint ventures and associates in the course of its normal business. Business relationships with these companies are entered into on an arm s length basis. The following table shows the services performed by the Group for related parties and for the Group by related parties in the past fiscal year: figures in thousand Associates and other equity investments Other related parties 211 Sales and other income 3,83 2,31 (2,38) (6,743) Receivables Liabilities Expenses 21 adjusted Sales and other income Expenses 3,356 1,498 (2,21) (6,561) Receivables Liabilities 271 1,41 The transactions with other related parties primarily relate to Mr. Manfred Wagner. Mr. Wagner was the managing director of Deufol Nürnberg GmbH (previously Deufol Tailleur GmbH) until December 6, 211 and held an indirect interest in the Deufol Tailleur subgroup until June 29, 27. Besides the relationships already known of with companies in which Mr. Wagner holds an interest, further such relationships were identified in 211. The figures for the previous year were adjusted accordingly. In the fiscal year 211, these relationships resulted in expenses amounting to 6,48 thousand (previous year: 6,52 thousand) and sales of 2,276 thousand (previous year: 1,486 thousand). Services were provided at arm s length prices in all cases and relate mainly to rental agreements and purchased materials. The transactions with other related parties also include relationships with companies in which Mr. Detlef W. Hübner holds a majority interest. In the past fiscal year, these transactions resulted in sales of 34 thousand (previous year: 12 thousand) and expenses of 262 thousand (previous year: 21 thousand). On December 31, 211, the Group had receivables from these companies in the amount of 17 thousand (previous year: 2 thousand) and liabilities in the amount of 98 thousand (previous year: 3 thousand). 125
128 126 Consolidated Financial Statements Auditors Report Auditors Report We have audited the consolidated financial statements comprising the income statement, statement of comprehensive income, balance sheet, cash flow statement, statement of changes in equity and notes and the Company and Group management report prepared by Deufol AG for the fiscal year from January 1 to December 31, 211. The Company s management is responsible for preparation of the consolidated financial statements and the summarized management and Group management report in accordance with the International Financial Reporting Standards (IFRS) as adopted by the EU and the supplementary provisions of German commercial law required to be applied under section 315a (1) HGB. Our responsibility is to express an opinion on the consolidated financial statements and the summarized management report and Group management report based on our audit. We conducted our audit of the consolidated financial statements in accordance with section 317 HGB and the German generally accepted standards for the audit of financial statements promulgated by Institut der Wirtschaftsprüfer in Deutschland e. V. (IDW). Those standards require that we plan and perform the audit such that misstatements materially affecting the presentation of the net assets, financial position and results of operations in the consolidated financial statements in accordance with the applicable financial reporting standards and in the Company and Group management report are detected with reasonable assurance. Knowledge of the business activities and the economic and legal environment of the Group and expectations as to possible misstatements are taken into account in the determination of audit procedures. The effectiveness of the accounting-related internal control system and the evidence supporting the disclosures in the consolidated financial statements and the Company and Group management report are examined primarily on a test basis within the framework of the audit. The audit includes assessing the annual financial statements of the companies included in the consolidated financial statements, the determination of the companies to be included in the consolidated financial statements, the accounting and consolidation principles used and significant estimates made by the management, as well as evaluating the overall presentation of the consolidated financial statements and the Company and Group management report. We believe that our audit provides a reasonable basis for our opinion. Our audit has not led to any reservations. In our opinion, based on the findings of our audit, the consolidated financial statements of Deufol AG, Hofheim, comply with IFRSs as adopted by the EU and the supplementary provisions of German commercial law required to be applied under section 315a (1) of the HGB and give a true and fair view of the net assets, financial position and results of operations of the Group in accordance with these requirements. The summarized management report and Group management report is consistent with the consolidated financial statements, as a whole provides a suitable understanding of the Group s position and suitably presents the opportunities and risks of future development. Frankfurt am Main, April 12, 212 Warth & Klein Grant Thornton AG Wirtschaftsprüfungsgesellschaft Dirk Bauer Certified auditor Robert Binder Certified auditor
129 Responsibility Statement by the Management Consolidated Financial Statements Responsibility Statement by the Management To the best of our knowledge, and in accordance with the applicable reporting principles for financial reporting, the consolidated financial statements give a true and fair view of the assets, liabilities, financial position and profit or loss of the Group, and the management report of the Group includes a fair review of the development and performance of the business and the position of the Group, together with a description of the principal opportunities and risks associated with the expected development of the Group. Hofheim (Wallau), April 12, 212 Detlef W. Hübner Dr. Tillmann Blaschke 127

130

131
132 13 Facts & Figures Information on Deufol AG Income Statement of Deufol AG figures in thousand Sales 2,24 2, ,582 (2,313) (19) (1,942) (88) (269) (258) 2. Other operating income thereof from currency translation: 1 thousand (previous year: 162 thousand) 3. Personnel expenses a) Wages and salaries b) Social security contributions 4. Amortization of intangible assets and depreciation of property, plant and equipment 5. Other operating expenses thereof from currency translation: 7 thousand (previous year: 16 thousand) (3,331) (4,42) 6. Income from profit and loss pooling agreements thereof from affiliated companies: 5,14 thousand (previous year: 1,15 thousand) 5,14 1,15 7. Income from investments thereof from affiliated companies: 3,593 thousand (previous year: 4,231 thousand) 3,593 4, Other interest and similar income thereof from affiliated companies: 1,671 thousand (previous year: 1,52 thousand) 1,722 1, Write-downs of financial assets thereof from affiliated companies: 1,11 thousand (previous year: thousand) (1,11) 1. Interest and similar expenses thereof from affiliated companies: 296 thousand (previous year: 188 thousand) (1,564) (1,343) 4,596 3, (183) 11. Income / loss from ordinary activities 12. Income taxes 13. Other taxes (148) (11) 14. Net income / loss 4,486 3, Retained profits brought forward 4,925 2, Balance sheet profit 9,411 6,238
133 Facts & Figures Balance Sheet of Deufol AG Assets figures in thousand A. Fixed assets I. Intangible assets Acquired patents, licenses, trademarks and similar rights and assets Dec. 31, 211 Dec. 31, 21 15,964 13, ,129 6,218 5, , III. Financial assets 1. Shares in affiliated companies 2. Loans to affiliated companies 99,67 95,67 4,63 97,282 94,369 2,913 B. Current assets 13,74 2,441 I. Receivables and other assets 1. Trade receivables 2. Receivables from affiliated companies 3. Other assets 13, ,894 2,66 2, ,64 II. Cash in hand, bank balances C. Prepaid expenses ,452 16,17 Dec. 31, 211 Dec. 31, 21 II. Property, plant and equipment 1. Land, land rights and buildings including buildings on third-party land 2. Other equipment, operating and office equipment Total assets Equity and Liabilities figures in thousand A. Equity 81,415 78,242 I. Subscribed Capital Contingent Capital: 8,413 thousand (previous year: 8,413 thousand) 43,774 43,774 II. Capital reserves 28,184 28, ,411 6, III. Retained earnings Legal reserve IV. Balance sheet profit thereof profit brought forward: 4,925 thousand (previous year: 2,568 thousand) B. Provisions 1. Tax provisions 2. Other provisions C. Liabilities 38,13 27, Liabilities to banks 26,623 2, ,719 5, Trade payables 3. Liabilities to affiliated companies 4. Other liabilities thereof taxes: 55 thousand (previous year: 6 thousand) thereof social security liabilities: thousand (previous year: thousand) D. Prepaid expenses Total equity and liabilities ,452 16,17 131
134 132 Facts & Figures Key Subsidiaries / Affiliates of Deufol AG Equity interest (%)* Subscribed Capital ( thousand) Sales ( thousand) Employees 58 Germany Deufol Berlin GmbH, Berlin ,215 Deufol Bochum GmbH, Bochum 1. 1,143 7, Deufol Mitte GmbH, Hofheim 1. (3,87) 23, Deufol München GmbH, Munich 1. (46) 4, Deufol Nord GmbH, Peine 1. 1,42 19, Deufol Nürnberg GmbH, Nuremberg 1. 18,61 23, Deufol Remscheid GmbH, Remscheid ,59 58 Deufol Süd GmbH, Neutraubling ,64 13 Deufol West GmbH, Oberhausen 1. 2,177 28, DTG Verpackungslogistik GmbH, Fellbach , Dualogis GmbH, Erlenbach am Main , ,885 8, Deufol Südwest GmbH, Walldorf Rest of Europe Deufol België N. V., Tienen, Belgium 1. 8,436 29, Deufol Ceská republika a. s., Ivancice, Czech Republic 1. 1,322 1, Deufol Italia S. p. A., Fagnano Olona, Italy 1. 2,38 19, Deufol Logistics Tienen N. V., Tienen, Belgium , Deufol Packaging N. V., Tienen, Belgium , ,322 1, ,22 54, Deufol Waremme S. A., Waremme, Belgium USA / Rest of the World Deufol Sunman Inc., Sunman, Indiana (USA) * Attributable to the relevant parent
135 Facts & Figures Glossary Acid test (%) Dividend yield (%) Investment ratio Ratio of cash and cash equivalents plus current Dividend paid for the fiscal year as a ratio Ratio of expenditure on property, plant and receivables and inventories to current liabilities of the year-end stock exchange price equipment to revenue Asset cover ratio I EBIT Net carrying amount per share Ratio of equity to noncurrent assets Earnings before interest and taxes Ratio of equity adjusted for deferred tax assets to the number of shares in circulation Asset cover ratio II EBITA Ratio of equity plus noncurrent liabilities to Earnings before interest, taxes and Net financial liabilities noncurrent assets amortization / impairment of goodwill Financial liabilities less financial receivables and cash and cash equivalents Asset depreciation ratio EBITDA Ratio of the accumulated depreciation of property, Earnings before interest, taxes, depreciation and Operating cash flow plant and equipment to the historical cost amortization / impairment of goodwill Net cash provided by operating activities Capital employed EBT Personnel expense ratio Operating capital that is tied up in the operation Earnings before taxes Ratio of personnel expenses to revenue ment and other noncurrent assets (offset against EBTA Price earnings ratio other non current, non-interest-bearing liabilities) Earnings before taxes and amortization / impairment Ratio of share price to earnings per share of a company. It is the total of working capital, the net carrying amount of property, plant and equip- of goodwill Property, plant and equipment ratio Cash ratio (%) Ratio of cash and cash equivalents to current Enterprise value Ratio of property, plant and equipment to liabilities The enterprise value is the value (price) of a total assets company if it were to be purchased and subsequently freed of debt (incl. the sale of nonoperating assets Current ratio (%) such as financial assets). It is calculated as Receivables turnover Ratio of cash and cash equivalents plus current the sum of the company s market capitalization and Ratio of revenue to trade accounts receivable receivables to current liabilities net liabilities Days payables outstanding Free cash flow Working capital is the difference between Ratio of trade payables to revenue The net amount of cash flow from ordinary operating current assets and current non-interest-bearing activities and cash flow from investing activities liabilities Working capital Day s sales in inventory Turnover of inventories, expressed in days Interest cover The total of EBITA and interest income divided by interest expense Days sales outstanding Ratio of trade accounts receivable to revenue Inventory turnover Ratio of cost of sales to inventories 133
136 134 Facts & Figures Key Group Figures Five-Year Overview Results of operations Sales ( thousand) Change as against previous year (%) Gross profit ( thousand) Margin (%) EBITDA ( thousand) Margin (%) EBITA ( thousand) Margin (%) EBT ( thousand) Margin (%) Income (loss) from continuing operations ( thousand) Margin (%) Net income ( thousand) Margin (%) Operating cash flow ( thousand) Margin (%) Free cash flow ( thousand) Margin (%) ,19 33,26 29,53 336, , (13.9) (.3) ,652 38,71 3,361 41, 39, ,53 2,562 16,238 24,1 2, ,713 11,867 6,421 14,562 12, ,382 7,532 (38) 9,911 7, (.1) ,872 4, ,369 3, , , , ,623 19,924 15,6 15,663 16, ,259 15,55 12,254 15,113 (8,86) (2.6) ,689 76,746 81,496 8,288 88, ,66 15, ,52 159, , , , ,16 239, , (3.9) (1.4) ,13 127,96 14,889 14, ,845 Asset ratios Current assets ( thousand) as % of balance sheet total Noncurrent assets ( thousand) as % of balance sheet total Balance sheet total ( thousand) Change as against previous year (%) Liabilities ( thousand) as % of balance sheet total Shareholders equity ( thousand) ,336 98,976 95,127 99,31 83,27 as % of balance sheet total Working capital ( thousand) 39,362 34,645 28,167 35,41 3,87 as % of balance sheet total Capital employed ( thousand) as % of balance sheet total Noncurrent / current assets , , , , , Shareholders' equity / liabilities Property, plant and equipment ratio Asset depreciation ratio (%) Inventory turnover Days sales in inventory Inventories / sales (%) Receivables turnover Days sales outstanding Days payables outstanding
137 Facts & Figures Financial and liquidity ratios Capital employed / sales (%) Investment ratio (%) Operating cash flow / investments Asset cover ratio I (%) Asset cover ratio II (%) Interest cover Cash ratio (%) Acid test (%) Financial liabilities / shareholders' equity (%) Current ratio (%) Financial liabilities / capital employed (%) , ,366 1,364 15,663 11,697 Net financial liabilities / EBITDA (%) Net financial liabilities / market capitalization (%) Productivity ratios Sales per employee ( ) EBITDA per employee ( ) 6,921 7,557 5,619 7,534 6,89 EBITA per employee ( ) 3,82 4,361 2,222 4,569 4,16 Operating cash flow per employee ( ) Personnel costs per employee ( ) Personnel cost ratio (%) 1,641 7,322 5,211 4,915 5,252 32,816 32,638 32,67 32,726 34, Per-share ratios Earnings per share from continuing operations ( ) Dividend per share ( ) n/a Dividend yield (%) n/a Earnings per share (EPS) ( ) Price earnings ratio (PER) Book value per share ( ) Price / book value Book value per share (less goodwill) ( ) Price / book value (less goodwill) Investment ratios Market capitalization / sales Enterprise value / sales Enterprise value / EBITDA Enterprise value / EBIT Enterprise value / operating cash flow Enterprise value / free cash flow n/m 135
138 136 Facts & Figures Operating Subsidiaries / Affiliates of Deufol AG* Germany Deufol Nürnberg GmbH Deufol Mitte GmbH Deufol Remscheid GmbH 46. Baumann Technologie GmbH Deufol Produktionsgesellschaft GmbH Deufol Bochum GmbH Deufol Süd GmbH Deufol Nord GmbH Deufol Frankfurt GmbH IAD Industrieanlagen-Dienst GmbH Deufol West GmbH DTG Verpackungslogistik GmbH 5. GGZ Gefahrgutzentrum Frankenthal GmbH 1. Deufol München GmbH Deufol Südwest GmbH Fischer Kisten GmbH Deufol Berlin GmbH 1. Deufol Hamburg GmbH 1. Deufol Securitas International GmbH2) Horst Lange GmbH 5. Abresch Industrieverpackung GmbH1) 5. SIV Siegerländer Industrieverpackung GmbH1) 3. Deutsche Tailleur Bielefeld GmbH & Co. KG1) 3. Deutsche Tailleur Bielefeld Beteiligungs-GmbH2) Tier 1 investment Tier 2 investment Tiers 3 and 4 investment 1) 2) Included at equity Unconsolidated AIRCON Airfreight Container Maintenance GmbH Deufol Services & IT GmbH 1. Dualogis GmbH * As at December 31, 211; figures in % 51.
139 Facts & Figures Rest of Europe Deufol Logistics Tienen N. V..33 Deufol Packing Tienen N. V. Deufol Italia S. p. A. (BE) (BE) Arcus Installation B. V. B. A. (BE) (IT) 1..4 Assembling of Transport Systems and Service N. V. (BE) Deufol België N. V. (BE) Deufol Austria GmbH (AT) Deufol Waremme S. A. (BE) Deufol Česká republika a. s. (CZ) D.Logistics France SAS1) (FR) Deufol Slovensko s. r. o. (SK) (FR) Securitas International N. V.2) SCI Immo DLS2) (BE) USA / Rest of the World Deufol (Suzhou) Packaging Co., Ltd. Deufol North America Inc. (CN) 1. Deufol Sunman Inc. 5. Intelipac. L. L. C.2) 1. Deufol Charlotte, LLC (US) (US) (US) (US) 137
140 138 Impressum Facts & Figures Imprint Publisher: Deufol AG Johannes-Gutenberg-Strasse 3 5 D Hofheim (Wallau) Phone: +49 (61 22) 5 - Fax: +49 (61 22) deufol.com Concept and design: FIRST RABBIT GmbH, Cologne Prepress: FIRST RABBIT GmbH, Cologne Printing: Druckpartner, Essen Contact: Deufol AG Rainer Monetha Investor Relations Johannes-Gutenberg-Strasse 3 5 D Hofheim (Wallau) Phone: +49 (61 22) rainer.monetha@deufol.com This report is available in German and English. Both versions are available on the Internet at
141

142
Packaging. Next level. REMOVING LIMITS.
 Packaging. Next level. REMOVING LIMITS. ANNUAL REPORT # 2015 Overview of the Deufol Group Figures in million 2015 2014 ± (%) Results of operations Total sales 324.8 298.9 8.7 Germany 170.9 156.3 9.4 Rest
Key Figures for the D.Logistics Group
 Geschäftsbericht Annual Report 2008 Key Figures for the D.Logistics Group Amounts in million 2008 2007 Change (%) Results of operations Revenue (total) 336.7 337.7 (0.3) Germany 183.7 185.7 (1.1) Rest
ANNUAL REPORT 950 /1000
 ANNUAL REPORT 950 /1000 Key Figures for the D.Logistics Group Amounts in million 2009 2008 Change (%) Results of operations Revenue (total) 290.0 336.7 (13.9) Germany 158.1 183.7 (13.9) Rest of the World
228 x 297 MM. REPORT AREA ANNUAL REPORT
 228 x 297 MM. REPORT AREA ANNUAL REPORT Key Data for the D.Logistics Group amounts in millions 2006 2005 Change (%) Results of operations Revenue (total) 322.4 313.5 2.8 Germany 166.7 165.9 0.5 Abroad
Antonio Fazio: Overview of global economic and financial developments in first half 2004
 Antonio Fazio: Overview of global economic and financial developments in first half 2004 Address by Mr Antonio Fazio, Governor of the Bank of Italy, to the ACRI (Association of Italian Savings Banks),
Bayer Annual Report To our Stockholders Investor Information. Jan Feb Mar Apr May June July Aug Sep Oct Nov Dec
 Bayer Annual Report 2015 39 Performance of Bayer Stock in 2015 [Graphic 2.1] (Indexed; 100 = Xetra closing price on December 31, 2014; source: Bloomberg) 130 120 110 100 90 80 Jan Feb Mar Apr May June
FINANCIAL REPORT 30 NOVEMBER ST HALF OF FISCAL YEAR 2017/2018
 FINANCIAL REPORT 30 NOVEMBER 2017 1ST HALF OF FISCAL YEAR 2017/2018 CONTENTS 03 KEY PERFORMANCE INDICATORS 04 HIGHLIGHTS 05 HELLA ON THE CAPITAL MARKET 07 INTERIM GROUP MANAGEMENT REPORT 07 Economic development
KION UPDATE CALL Q Gordon Riske, CEO Thomas Toepfer, CFO Wiesbaden, 7 May 2015
 KION UPDATE CALL 2015 Gordon Riske, CEO Thomas Toepfer, CFO Wiesbaden, 7 May 2015 AGENDA 1 Highlights Gordon Riske 2 Market update Gordon Riske 3 Financial update Thomas Toepfer 4 Outlook Gordon Riske
Oct-Dec st Preliminary GDP Estimate
 Japan's Economy 15 February 2016 (No. of pages: 5) Japanese report: 15 Feb 2016 Oct-Dec 2015 1 st Preliminary GDP Estimate GDP experiences negative growth for first time in two quarters hinting at risk
Jan-Mar nd Preliminary GDP Estimate
 Japan's Economy 8 June 2016 (No. of pages: 5) Japanese report: 08 Jun 2016 Jan-Mar 2016 2 nd Preliminary GDP Estimate Real GDP growth rate revised upwards slightly from 1 st preliminary; results in accordance
Half-Yearly Report 2016
 Half-Yearly Report 2016 Revenue expanded 5 % to EUR 38.3 million in first six months Orders on hand up 15 % to EUR 11.8 million Marked upturn in the second quarter report optimize! Half-yearly report 2016
Interim report January 1 to March 31, 2012
 Interim report January 1 to March 31, 2012 The first three months of 2012 at a glance Highlights Dynamic start into the year 2012 Sales growth of 11.8 % to EUR 18.9 million Earnings margins at the 2011
Report on the first 9 months of 2010
 Report on the first 9 months of 20 Key Figures in m EUR 3rd Quarter 20 3rd Quarter 2009 Change absolute Change in % 9 Months 9 Months 20 2009 Change absolute Change in % Sales and earnings Sales 86.4 78.7
Eurozone Economic Watch
 BBVA Research - Global Economic Watch December 2018 / 1 Eurozone Economic Watch December 2018 Eurozone GDP growth still slows gradually, but high uncertainty could take its toll GDP growth could grow by
Jul-Sep st Preliminary GDP Estimate
 Japan's Economy 16 November 2015 (No. of pages: 5) Japanese report: 16 Nov 2015 Jul-Sep 2015 1 st Preliminary GDP Estimate Second consecutive quarter of negative growth due mainly to inventory adjustment
INTERIM REPORT BY THE EXECUTIVE BOARD FIRST QUARTER 14/15
 INTERIM REPORT BY THE EXECUTIVE BOARD FIRST QUARTER 14/15 2 3 FOREWORD BY THE EXECUTIVE BOARD Dear shareholders, The Bene Group has consistently implemented restructuring measures and realised impressive
Report on the Third Quarter of 2012/13 (May 2012 January 2013)
") Report on the Third Quarter of 2012/13 (May 2012 January 2013) 1 Wolford Group Key Data Earnings Data 05/12-01/13 05/11-01/12 Chg. % 2011/12 Revenues in mill. 124.13 121.13 +2 154.06 EBITDA in mill. 9.79
Report on the Third Quarter of 2012/13 (May 2012 January 2013) 1 Wolford Group Key Data Earnings Data 05/12-01/13 05/11-01/12 Chg. % 2011/12 Revenues in mill. 124.13 121.13 +2 154.06 EBITDA in mill. 9.79
The real change in private inventories added 0.22 percentage points to the second quarter GDP growth, after subtracting 0.65% in the first quarter.
 QIRGRETA Monthly Macroeconomic Commentary United States The U.S. economy bounced back in the second quarter of 2007, growing at the fastest pace in more than a year. According the final estimates released
STADA KEY FIGURES. 02 STADA Key Figures. 6 months 2015 Jan. 1 June 30 ± % 6 months 2016 Jan. 1 June 30. Key figures for the Group in million
 02 STADA Key Figures STADA KEY FIGURES Key figures for the Group in million 6 months 2016 Jan. 1 June 30 6 months 2015 Jan. 1 June 30 ± % Group sales 1,034.7 1,025.9 +1% Generics (core segment) 603.8 615.3-2%
Herford Interim Report Q1 2014/15
 AHLERS AG Herford Interim Report Q1 2014/15 AHLERS AG INTERIM REPORT Q1 2014/15 (December 1, 2014 to February 28, 2015) BUSINESS PERFORMANCE IN THE FIRST THREE MONTHS OF FISCAL 2014/15 -- 7 percent decline
HSBC Trade Connections: Trade Forecast Quarterly Update October 2011
 HSBC Trade Connections: Trade Forecast Quarterly Update October 2011 New quarterly forecast exploring the future of world trade and the opportunities for international businesses World trade will grow
Austria s economy set to grow by close to 3% in 2018
 Austria s economy set to grow by close to 3% in 218 Gerhard Fenz, Friedrich Fritzer, Fabio Rumler, Martin Schneider 1 Economic growth in Austria peaked at the end of 217. The first half of 218 saw a gradual
Eurozone Economic Watch. November 2017
 Eurozone Economic Watch November 2017 Eurozone: improved outlook, still subdued inflation Our MICA-BBVA model for growth estimates for the moment a quarterly GDP figure of around -0.7% in, after % QoQ
NBIM Quarterly Performance Report Second quarter 2007
 NBIM Quarterly Performance Report Second quarter 2007 Government Pension Fund Global Norges Bank s foreign exchange reserves Investment portfolio Buffer portfolio Government Petroleum Insurance Fund Norges
Eurozone Economic Watch. May 2018
 Eurozone Economic Watch May 2018 BBVA Research - Eurozone Economic Watch / 2 Eurozone: more moderate growth with higher uncertainty The eurozone GDP growth slowed in more than expected. Beyond temporary
Half-Year Interim Report report. optimize!
 Half-Year Interim Report 2017 report optimize! Consolidated Key Figures Q2 2017 Q2 2016 Half-yearly report 2017 Half-yearly report 2016 Incoming orders (EUR million) 17.8 21.9 39.5 39.6 Revenue (EUR million)
Monthly Economic Report
 Monthly Economic Report April 19, 2018 Copyright Mizuho Research Institute Ltd. All Rights Reserved. 1. The Japanese Economy: the business conditions DI deteriorated; FY2018 fixed investment plans were
Facts and figures Fiscal siemens.com
 Facts and figures Fiscal siemens.com Fiscal was another record year for Siemens operations. We fulfilled our ambitious guidance, which we d raised twice during the year, at every point. We ve already achieved
(0.7) (17.0) (11.0) (21.7) (20.0) (21.2) 5.5 (14.7) (17.3) (7.6) (14.5) (19.2) 1Y Rtn (12/31/10-12/30/11)
 (17.0) (11.0) (21.7) (20.0) (21.2) 5.5 (14.7) (17.3) (7.6) (14.5) (19.2) 1Y Rtn (12/31/10-12/30/11)") Research Division Monthly Unit Trust Review AMB Dec 2011:The MUTI continues expansion albeit slumps in the stock markets TABLE 1: MAJOR & REGIONAL INDICES AS AT 30 DECEMBER 2011 Index Points % MOM % YOY
Research Division Monthly Unit Trust Review AMB Dec 2011:The MUTI continues expansion albeit slumps in the stock markets TABLE 1: MAJOR & REGIONAL INDICES AS AT 30 DECEMBER 2011 Index Points % MOM % YOY
Eurozone Economic Watch. February 2018
 Eurozone Economic Watch February 2018 Eurozone: Strong growth continues in 1Q18, but confidence seems to peak GDP growth moderated slightly in, but there was an upward revision to previous quarters. Available
half-year financial report of volkswagen leasing gmbh january june
 half-year financial report of volkswagen leasing gmbh january june 2014 1 INTERIM REPORT 2014 6 HALF-YEARLY FINANCIAL Report 2014 1 Report on Economic Position 3 Report on Opportunities and Risks Report
GERRY WEBER International AG Interim report Q2 2010/2011. Report on the six-month period ended 30 April 2011 WKN: ISIN: DE
 GERRY WEBER International AG Interim report Q2 2010/2011 Report on the six-month period ended 30 April 2011 WKN: 330 410 ISIN: DE0003304101 The GERRY WEBER share Gaining roughly 27 percent, the GERRY WEBER
Eurozone. Economic Watch FEBRUARY 2017
 Eurozone Economic Watch FEBRUARY 2017 EUROZONE WATCH FEBRUARY 2017 Eurozone: A slight upward revision to our GDP growth projections The recovery proceeded at a steady and solid pace in, resulting in an
Munich Re information On The FinAnciAL YeAR 2009
 Munich Re INFORMATION ON THE FINANCIAL YEAR 2009 2 letter to shareholders Dear Shareholders, In the initial months of 2009, the severest financial crisis for 80 years was at its height. Important companies
INTERIM REPORT Q3/2016
 INTERIM Q3/2016 02 KEY INCOME FIGURES KEY INCOME FIGURES of the euromicron Group at September 30, 2016 Key figures 2016 2015 thou. thou. Sales 226,567 242,708 EBITDA (operating) * 1,428 5,761 EBITDA margin
Forum in Frankfurt / Main
 6-month report 2009 / 2010 Key figures at a glance (IFRS) 6 month 2009 / 2010 (Jul 1, 2009 Dec 31, 2009) Comparable period (Jul 1, 2008 Dec 31, 2008) Revenues 15,261 20,216 Earnings before interest and
Record dividend of 3.00 euros per share leading the field of solar stock in the
 Press Release SMA Solar Technology AG SMA Solar Technology AG surpasses last year s record results Sales doubled and rose to 1.9 billion euros Record EBIT margin of 26.9 % High cash flow through low capital
World Economy Geopolitics Investment Strategy. The Impact of EU s Sovereign Risks on Turkish Economy. Presentation given by
 World Economy Geopolitics Investment Strategy OUTLOOK FOR WORLD S MAJOR FINANCIAL MARKETS The Impact of EU s Sovereign Risks on Turkish Economy Presentation given by Dr. Michael Ivanovitch, President MSI
Eurozone Economic Watch Higher growth forecasts for January 2018
 Eurozone Economic Watch Higher growth forecasts for 2018-19 January 2018 Eurozone Economic Watch January 2018 Eurozone: Higher growth forecasts for 2018-19 Our MICA-BBVA model estimates a broadly stable
Logwin AG. Interim Financial Report as of 30 June 2018
 Logwin AG Interim Financial Report as of 30 June 2018 Key Figures 1 January 30 June 2018 Earnings position In thousand EUR 2018 2017 Revenues Group 540,104 541,383 Change on 2017-0.2 % Air + Ocean 361,316
5.9 Percent 4.4 Percent 10.2 Percent 9.7 Percent. autonomous federated state Head of Government Angela Merkel Horst Seehofer José Manuel Barroso 3,7%
 Economic Outlook Germany, Bavaria, Eurozone, and EU-27 General Information Germany Bavaria Eurozone EU-27 Area 357.022 km² 70.552 km² 4.324.782 km² Population 81.796.000 12.583.538 327.054.866 502.489.100
Bilfinger Berger: Entering new growth phase
 Bilfinger Berger: Entering new growth phase Roadshow London, Roland Koch, CEO Andreas Müller, Head of Corporate Accounting and Investor Relations Agenda 1. Bilfinger Berger Overview 2. Preliminary figures
High-quality aluminium coils of AMAG Austria Metall AG
 High-quality aluminium coils of AMAG Austria Metall AG Financial Report 1 st half year of 2015 2 AMAG Financial Report Key figures for the AMAG Group Key figures for the Group in EUR million Q2/2015 Q2/2014
International economy in the first quarter of 2009
 The article is based on data with cutoff date as of June, 9. I volume, 8/9B International economy in the first quarter of 9 GLOBAL ECONOMY The GDP development in OECD countries recorded a further decrease
QUARTERLY STATEMENT 9M January 1 to September 30, 2018
 QUARTERLY STATEMENT 9M 2018 January 1 to September 30, 2018 2 STRATEC Quarterly Statement 9M 2018 STRATEC REPORTS FIGURES FOR THE FIRST NINE MONTHS OF 2018 Organic sales decline of 4.8 % to 134.6 million
FINANCIAL REPORT NOVEMBER 30, ST HALF OF FISCAL YEAR 2018/2019
 FINANCIAL REPORT NOVEMBER 30, 2018 1ST HALF OF FISCAL YEAR 2018/2019 H1 CONTENTS 03 KEY PERFORMANCE INDICATORS 04 HIGHLIGHTS 05 HELLA ON THE CAPITAL MARKET 07 INTERIM GROUP MANAGEMENT REPORT 07 Economic
AHLERS AG, HERFORD Interim Report Q3 2013/14
 AHLERS AG, HERFORD Interim Report Q3 2013/14 2 INTERIM REPORT Q3 2013/14 AHLERS AG INTERIM REPORT Q3 2013/14 (December 1, 2013 to August 31, 2014) BUSINESS PERFORMANCE IN THE FIRST NINE MONTHS OF FISCAL
Herford Half-year Report 2017/18
 AHLERS AG Herford Half-year Report 2017/18 2 AHLERS AG HALF-YEAR REPORT 2017/18 (1. December 1, 2017 to May 31, 2018) BUSINESS PERFORMANCE IN THE FIRST SIX MONTHS OF FISCAL 2017/18 H1 2017/18 - Highlights
China Economic Update Q1 2015
 Key Developments in Brief Economic development Growth drivers Risks GDP growth slows to 7. Slowdown challenging, but manageable More easing policies expected Reforms progressing slowly Services and retail
Half-yearly Financial Report. 1 January - 30 June 2018
 Half-yearly Financial Report 1 January - 30 June 2018 Quarterly Financial Report Table of contents Table of contents LPKF Laser & Electronics AG at a glance... 3 Chairman's Statement... 4 Interim Management
Quarterly Financial Report Logwin AG
 Quarterly Financial Report 2008 Logwin AG Key Figures January 1 March 31, 2008 in thousand 2 3 Months Group 2008 2007 in % Sales 523,180 507,462 3.1 Gross profit 40,909 42,277 3.2 Margin 7.8 % 8.3 % Earnings
OPEN INNOVATIVE FOCUSED SOLID
 OPEN INNOVATIVE FOCUSED SOLID QUARTERLY STATEMENT AS OF MARCH 31, 2018 To our shareholders Patrik Heider, Spokesman of the Executive Board and CFOO The Nemetschek Group began the 2018 fiscal year according
1.1. Low yield environment
 1. Key developments Overall, the macroeconomic outlook has deteriorated since June 215. Although many European countries continue to recover, economic growth still remains fragile reflecting high public
N O R M A G R O U P S E
 NORMA GROUP SE Overview of Key Figures Q3 2017 1 Q3 2016 1 Q1 Q3 2017 1 Q1 Q3 2016 1 Order situation Oder book (Sep 30) EUR millions 322.7 282.7 Income statement Revenue EUR millions 244.4 216.6 763.4
COMMISSION OF THE EUROPEAN COMMUNITIES REPORT FROM THE COMMISSION CONVERGENCE REPORT 2006 ON LITHUANIA
 COMMISSION OF THE EUROPEAN COMMUNITIES Brussels, 16.5.2006 COM(2006) 223 final REPORT FROM THE COMMISSION CONVERGENCE REPORT 2006 ON LITHUANIA (prepared in accordance with Article 122(2) of the Treaty
GERRY WEBER International AG Report on the first three months of 2007/2008. Report on the three-month period ended 31 January 2008
 GERRY WEBER International AG Report on the first three months of 2007/2008 Report on the three-month period ended 31 January 2008 WKN: 330 410 ISIN: DE0003304101 The share In the first quarter of 2007/2008
ANNUAL GENERAL MEETING 2002
 ANNUAL GENERAL MEETING 2002 Letter to shareholders M Münchener Rück Munich Re Group Supervisory Board Chairman Board of Management Chairman Ulrich Hartmann Dr. Hans-Jürgen Schinzler Dr. Wolf Otto Bauer
Economic Outlook. Global And Finnish. Technology Industries In Finland Turnover and orders picking up s. 5. Economic Outlook
 Economic Outlook Technology Industries of Finland 2 217 Global And Finnish Economic Outlook Broad-Based Global Economic Growth s. 3 Technology Industries In Finland Turnover and orders picking up s. 5
The real change in private inventories added 0.15 percentage points to the second quarter GDP growth, after subtracting 0.65% in the first quarter.
 QIRGRETA Monthly Macroeconomic Commentary United States The U.S. economy rebounded in the second quarter of 2007, growing at an annual rate of 3.4% Q/Q (+1.8% Y/Y), according to the GDP advance estimates
PMI Quarterly on China Manufacturing
 China Federation of Logistics & Purchasing China Federation of Logistics & Purchasing (CFLP) is the logistics and purchasing industry association approved by the State Council. CFLP s mission is to push
Financial review. Continuous organic growth. Strong growth in the EMEA region. Positive operating margin development
 66 Financial review Sonova generated record sales of CHF 2,35.1 million in 214 / 15, an increase of 4.3 % in reported Swiss francs or 6.2 % in local currencies. Group EBITA rose by 5.9 % in reported Swiss
Press release sentix Economic Index 04. June 2018
 Registration for the press distribution list and further information at www.sentix.co.uk Manfred Hübner CEFA, Managing Director manfred.huebner@sentix.de sentix GmbH Wiesenhüttenstraße 17, 60329 Frankfurt
PRESS AND ANALYST CONFERENCE
 PRESS AND ANALYST CONFERENCE Metzingen April 12, 2010 Press and Analyst Conference 2010 HUGO BOSS April 12, 2010 2 / 39 AGENDA KEY FACTS 2009 FINANCIAL PERFORMANCE 2009 OUTLOOK 2010 GROWTH STRATEGY 2015
Press release sentix Economic Index 09. April 2018
 Registration for the press distribution list and further information at www.sentix.co.uk Patrick Hussy CEFA, Managing Director patrick.hussy@sentix.de sentix GmbH Wiesenhüttenstraße 17, 60329 Frankfurt
EUROZONE ECONOMIC WATCH JANUARY 2017
 EUROZONE ECONOMIC WATCH JANUARY 2017 Key messages: some changes for the better Improving confidence in across the board shows the resilience of the eurozone to the various potentially disturbing political
Jul-Sep nd Preliminary GDP Estimate
 Japan's Economy 8 December 2014 (No. of pages: 5) Japanese report: 08 Dec 2014 Jul-Sep 2014 2 nd Preliminary GDP Estimate Downward revision betrays hopes, falls below market consensus Economic Intelligence
The MCCI BUSINESS CONFIDENCE INDICATOR
 1 The MCCI BUSINESS CONFIDENCE INDICATOR 33 rd Edition Second Quarter 018 1 NOTE: CHANGE IN PRESENTATION NO MORE INDEXATION Similar to its international counterparts, the CES-Ifo and the OECD, the MCCI
December 2017 Machinery Orders
 Japan's Economy 15 February 2018 (No. of pages: 5) Japanese report: 15 Feb 2018 December 2017 Machinery Orders Lull in manufacturing orders causes concern possible slowdown due to capex cycle Economic
Q4 results: Strong execution, resilient portfolio
 Q4 results: Strong execution, resilient portfolio Fast cost take-out keeps full-year EBIT margin well within target range 2-year savings program expanded to $3 billion Pace of base order decline year-on-year
Shaping digital transformation. Unicredit & Kepler Cheuvreux GCC, Frankfurt
 Shaping digital transformation Unicredit & Kepler Cheuvreux GCC, Frankfurt Business model January 2018 Unicredit & Kepler Cheuvreux GCC 2 TAKKT is a portfolio of B2B direct marketing specialists January
Jean-Pierre Roth: Recent economic and financial developments in Switzerland
 Jean-Pierre Roth: Recent economic and financial developments in Switzerland Introductory remarks by Mr Jean-Pierre Roth, Chairman of the Governing Board of the Swiss National Bank and Chairman of the Board
DEVELOPMENTS IN THE COST COMPETITIVENESS OF THE EUROPEAN UNION, THE UNITED STATES AND JAPAN MAIN FEATURES
 DEVELOPMENTS IN THE COST COMPETITIVENESS OF THE EUROPEAN UNION, THE UNITED STATES AND JAPAN MAIN FEATURES The euro against major international currencies: During the second quarter of 2000, the US dollar,
1 World Economy. Value of Finnish Forest Industry Exports Fell by Almost a Quarter in 2009
 1 World Economy The recovery in the world economy that began during 2009 has started to slow since spring 2010 as stocks are replenished and government stimulus packages are gradually brought to an end.
Roadshow Kepler Cheuvreux. November 7, 2016, London. Driving transformation. Shaping the future.
 Roadshow Kepler Cheuvreux November 7, 2016, London Driving transformation. Shaping the future. Disclaimer Note: This presentation contains statements concerning the future business trend of the Vossloh
Economic Indicators. Roland Berger Institute
 Economic Indicators Roland Berger Institute October 2017 Overview Key points Economic Indicators A publication, compiled by the Roland Berger Institute, that provides you with the most important macroeconomic
Investors Conference Commerzbank Sector Conference
 Investors Conference Commerzbank Sector Conference August 30, 2017, Frankfurt Clear focus. Sharpened profile. Draft, version 4, as of 3/8/2016, 11:20 a.m. Disclaimer Note: This presentation contains statements
December 2017 ECONOMIC FORECASTS FOR SPAIN 2018
 ECONOMIC FORECASTS FOR SPAIN 2018 1 Contents RECENT EVOLUTION OF THE SPANISH ECONOMY... 4 FORECASTS 2017-2018... 6 MAIN RISKS... 7 CONCLUSIONS:... 8 ANNEXES:... 9 2 The following executive report deals
Corporate News. November 11, 2010 STADA The Health Company Page 1 of 11
 Corporate News STADA: Group sales increased in 1-9/2010 adjusted EBITDA went up considerably high burdening one-time special effects confirmation of outlook for 2010 Important items at a glance Group sales
Special Edition. Special Edition. of the Credit Suisse Swiss Pension Fund Index
 Special Edition Special Edition of the Credit Suisse Swiss Pension Fund Index Pension Fund Index loses 1.83 percent in January 2015 January s negative performance is also reflected in the asset allocation
Investors Conference HSBC SRI Conference. February 7, 2017, Frankfurt. Driving transformation. Shaping the future.
 Investors Conference HSBC SRI Conference February 7, 2017, Frankfurt Driving transformation. Shaping the future. Disclaimer Note: This presentation contains statements concerning the future business trend
RECOVERY CONTINUES FOR LOGISTICS REAL ESTATE
 RECOVERY CONTINUES FOR LOGISTICS REAL ESTATE World events trigger soft patch The global economic soft patch in the first half of 2011 was primarily caused by the cost of oil reaching $114 per barrel, rising
Herford Interim Report Q3 2014/15
 AHLERS AG Herford Interim Report Q3 2014/15 AHLERS AG INTERIM REPORT Q3 2014/15 (December 1, 2014 to August 31, 2015) BUSINESS PERFORMANCE IN THE FIRST NINE MONTHS OF FISCAL 2014/15 -- Premium brands
Annual Press Conference 2010 Peter Löscher President and CEO, Siemens AG Munich, Germany, November 11, 2010
 Annual Press Conference 2010 Peter Löscher President and CEO, Munich,, November 11, 2010 Check against delivery. Siemens growth gains momentum We have just completed a very successful fiscal year. We are
Quarterly Report Q3 Financial Year 2016 / Touching the Future of Vision Automation
 Quarterly Report Q3 Financial Year 2016 / 2017 Touching the Future of Vision Automation 150 ISRA VISION Quarterly Report Q3 Financial Year 2016 / 2017 2 rd ISRA VISION AG: 3 quarter 2016 / 2017 revenues
Survey conducted by GfK On behalf of the Directorate General for Economic and Financial Affairs (DG ECFIN)
") FINANCIAL SERVICES SECTOR SURVEY Report April 2015 Survey conducted by GfK On behalf of the Directorate General for Economic and Financial Affairs (DG ECFIN) Table of Contents 1 Introduction... 3 2 Survey
FINANCIAL SERVICES SECTOR SURVEY Report April 2015 Survey conducted by GfK On behalf of the Directorate General for Economic and Financial Affairs (DG ECFIN) Table of Contents 1 Introduction... 3 2 Survey
HALF-YEAR REPORT ENDED 30 JUNE HelloFresh SE
 HALF-YEAR REPORT ENDED 30 JUNE 2018 HELLOFRESH AT A GLANCE Key Figures APR 1 - JUN 30, 2018 APR 1 - JUN 30, 2017 YoY growth JAN 1 - JUN 30, 2018 JAN 1 - JUN 30, 2017 YoY growth Key Performance Indicators
Quarter 3/2009 Interim Report
 Quarter 3/2009 Interim Report Deutsche Börse Group: Financial Highlights Quarter ended Nine months ended 30 Sep. 2009 30 Sep. 2008 30 Sep. 2009 30 Sep. 2008 Consolidated income statement Sales revenue
January 1 to March 31. Interim Report January to March 2004
 25 26 27 January 1 to March 31 Interim Report 24 First Quarter 24 Linde Financial Highlights 24 23 Change Year 23 Share Closing price 43.9 29.15 47.8% 42.7 3 month high 45.9 36.69 25.1% 43.4 3 month low
The international environment
 The international environment This article (1) discusses developments in the global economy since the August 1999 Quarterly Bulletin. Domestic demand growth remained strong in the United States, and with
Ilmars Rimsevics: General economic developments and banking in Latvia
 Ilmars Rimsevics: General economic developments and banking in Latvia Speech by Mr Ilmars Rimsevics, Governor of the Bank of Latvia, Riga, November 2002. * * * With Latvia's economic indicators confirming
COMMIT DELIVER AND I N T E R I M S T A T E M E N T AS AT 3 0 SEP TEM B ER
 COMMIT AND DELIVER I N T E R I M S T A T E M E N T AS AT 3 0 SEP TEM B ER 2 0 1 8 Key Figures TOM TAILOR GROUP KEY FIGURES TOM TAILOR GROUP EUR million Revenue Q3 2017 Change relative Q1 Q1 Q3 2017 Change
Eurozone Economic Watch
 BBVA Research Eurozone Economic Watch November 2018 / 1 Eurozone Economic Watch November 2018 Eurozone: Growth to recover in 4Q18, but concerns about the slowdown next year are growing Eurozone GDP growth
Quarterly Financial Report
 2/2015 Quarterly Financial Report Incoming orders grow 40 % to EUR 41.1 million Revenue up more than 8 % to EUR 36.5 million Strong start to second half-year Quarterly Financial Report 2/2015 Dear Shareholders,
RHI Group >> Quarterly Report III/2006
 RHI Group >> Key Figures RHI Group Q1 - Q3 Change in million 2006 2005 in % Revenue 998.6 893.9 11.7 EBITDA 130.5 108.1 20.7 EBITDA margin 13.1% 12.1% 8.1 EBIT 97.5 78.3 24.5 EBIT margin 9.8% 8.8% 11.5
INTERIM REPORT 2015 BRENNTAG AG
 INTERIM REPORT 2015 BRENNTAG AG Q3 key financial figures at a glance consolidated income statement Q3 2015 Q3 2014 1) Sales in EUR m 2,607.5 2,587.2 Gross profit in EUR m 570.5 520.3 Operating EBITDA in
BUILDING THE FUTURE TOGETHER HALF YEAR REPORT AS OF JUNE 30, 2017
 HALF YEAR REPORT AS OF JUNE 30, 2017 BUILDING THE FUTURE TOGETHER To our shareholders Patrik Heider, Spokesman of the Executive Board and CFOO The Nemetschek Group has continued on its course of dynamic
Figures in millions Q1 to Q3 Q3. Incoming orders 1,780 1, Net sales 1,552 1,
 Interim Financial Report Third Quarter 2015/2016 Heidelberg Group Interim Financial Report Q3 2015 / 2016 Sales for the first nine months increase 1,802 million Growth in incoming orders 1,904 million
Financial report to 31 March 2010
 Dear shareholder, After the crisis year 2009, which tipped Germany and the entire global economy into the deepest recession in the post-war period, the effects are still being felt by the Einhell Group.
Global Macroeconomic Monthly Review
 Global Macroeconomic Monthly Review August 14 th, 2018 Arie Tal, Research Economist Capital Markets Division, Economics Department 1 Please see disclaimer on the last page of this report Key Issues Global
OVERVIEW. The EU recovery is firming. Table 1: Overview - the winter 2014 forecast Real GDP. Unemployment rate. Inflation. Winter 2014 Winter 2014
 OVERVIEW The EU recovery is firming Europe's economic recovery, which began in the second quarter of 2013, is expected to continue spreading across countries and gaining strength while at the same time