2012 Full Year Results. Thursday, March 21, 2013
|
|
|
- Daniella Golden
- 5 years ago
- Views:
Transcription


1 2012 Full Year Results Thursday, March 21, 2013
2 INTRODUCTORY MATTERS Forward-Looking Information This document contains certain forward-looking statements which speak only as of the date on which they are made. Forward-looking statements relate to projections, anticipated events or trends, future plans and strategies, and reflect Havas current views about future events. They are therefore subject to inherent risks and uncertainties that may cause Havas actual results to differ materially from those expressed in any forward-looking statement. Factors that could cause actual results to differ materially from expected results include changes in the global economic environment or in the business environment, and in factors such as competition and market regulation. For more information regarding risk factors relevant to Havas, please see Havas filings with the Autorité des Marchés Financiers (documents in French) and, up to October 2006, with the U.S. Securities and Exchange Commission (documents in English only). Havas does not intend, and disclaims any duty or obligation, to update or revise any forward-looking statements contained in this document to reflect new information, future events or otherwise. Net New Business Net new business represents the estimated annual advertising budgets for new business wins (which includes new clients, clients retained after a competitive review, and new product or brand expansions for existing clients) less the estimated annual advertising budgets for lost accounts. Havas' management uses net new business as a measurement of the effectiveness of its client development and retention efforts. Net new business is not an accurate predictor of future revenues, since what constitutes new business or lost business is subject to differing judgments, the amounts associated with individual business wins and losses depend on estimated client budgets, clients may not spend as much as they budget, the timing of budgeted expenditures is uncertain, and the amount of budgeted expenditures that translate into revenues depends on the nature of the expenditures and the applicable fee structures. In addition, Havas' guidelines for determining the amount of new business wins and lost business may differ from those employed by other companies. The average net debt (quarterly, semi-annually and annually) is calculated as the difference between the structured gross debt under IFRS (OBSAAR, Eurobond, used credit lines, etc ) and the cash in bank and cash equivalents measured on a daily basis for the main countries integrated in the International cashpool; for the other countries, the average net debt taken into account is the monthly average net debt. The new definition excludes earn-out and buy-out obligations and includes blocked current accounts relating to employee profit-sharing. 2 2
3 2012 Key Figures Revenue : 1,778M in 2012, +2.1% organic growth (at constant exchange rate and scope) vs 2011 and +8% overall growth +2.1% +8.0% Emerging markets represent 17% of total revenue Digital accounts for 26% of total revenue Income from operations reached 240M in 2012 vs 220M in 2011, improving by +9%. Income from operations margin grew +10 bp to 13.5% Net income, group share of 126M in 2012 up +5% Earnings per share as determined on the basis of outstanding shares as at Dec, 31st 2012 amounts to 33 cents ( ) Net debt (2) of 168M as of December 31st, 2012 vs 44M net cash in Average net debt (2) was 225M in 2012 vs 12M in 2011 after 269M share buy-back Strong level of Net New Business (1) to 1.7bn +9.0% +5.0% +16% +22% 3 (1) (2) Definition of «Net New Business» and details on net debt calculation on page 2 Résultats Annuels
4 2012 Revenue by Area % change 2012 vs 2011 Organic Growth EUROPE % +2.3% NORTH AMERICA % +13.5% ASIA PACIFIC & AFRICA % +26.2% LATAM % +9.5% TOTAL 1,778 1, % +8.0% 4 Résultats Annuels 2012
5 Digital at the Core of Our Agencies and Our Strategy To be the world s best company at connecting BRANDS with PEOPLE using CREATIVITY, MEDIA and TECHNOLOGY 5
6 What Makes Havas Different? More integrated More agile More entrepreneurial Smaller legacy business Longer-term focus, Bolloré Group Challenger mentality : WE EXIST TO CHANGE THE INDUSTRY 6
7 1. TO STRENGTHEN OUR POSITION AS THE MOST INTEGRATED, DIGITAL, AGILE, ENTREPRENEURIAL AND CLIENT- FOCUSED COMMUNICATIONS GROUP 7 Résultats Annuels 2012

8 8 The Traditional Holding Company Model


9 Former structure 9 9


10 New structure OTHERS 10 10


11 11 Euro RSCG Worldwide Becomes Havas Worldwide to Underscore Havas s Unique Integrated Structure


12 Offices Rebranding in 120 Cities in 75 Countries

13 13 Havas Media Changes

14 Integration of Creative and Media Paris HQ centralization, similar move in NY during Spring 2013 business synergies leases & rental savings shared services alignment of incentive schemes shared platform e.g. sustainability 14 Résultats Annuels 2012
15 2. DIGITAL AT THE CORE OF ALL OUR ACTIVITIES AND ALL OUR AGENCIES 15 Résultats Annuels 2012


16 16


17 17 HAVAS PARIS


18 HAVAS VILLAGE, PARIS 2,200 EXPERTS CREATIVE, DIGITAL, MEDIA


19 19 HAVAS, NEW YORK
20 20

21 21

22 22
23 23
24 Further Development of Havas Media Tools Expansion of Artémis, our data management platform Created 12 years ago Havas is one of the only groups that has deployed a DMP globally Already used by a majority of clients, in the US and Europe A 30-person team based in London, Madrid, Paris, Shanghai and Boston Further developing Affiperf, our digital trading solution launched in 2010 Development of Paris, London, NY, Mexico and Singapore hubs Current coverage of 35 countries and all main ad exchanges: display, video and mobile Acquisition opportunities to further strengthen our capabilities. No proprietary technology imposed on clients. 24 Résultats Annuels 2012
25 25 Leading the North American Market in Mobile - Agency of the Year, 2 Years Running

26 Havas, only advertising Holding company part of Facebook Client Council Client Council 26
27 27 Leader in Digital Big Data


28 28 Winning Major Digital Business


29 Attracting the Best Digital Talent Matt Howell Global Chief Digital Officer Arnold, prev. Modernista! Dave Dugan Global Commercial Officer Arnold, prev. BzzAgent, Digitas Elliot Seaborn Executive Director Arnold, prev. Digitas Drake Pusey VP, Dir. of Digital Platforms Arnold prev. Isobar Dorothy Gemmell President Havas Life, New York, prev. WebMD Sylvain Le Borgne SVP, Director of Insights & Data Solutions, Havas Media Angela Wei Chief Digital Officer Arnold prev. Time Inc. Rori DuBoff SVP, Director Global Strategy Havas Digital, prev. Ogilvy & Mather Laura Maness Chief Growth Officer Havas Worldwide US, prev. Propane Studio Andrew Altersohn President, Havas Media North America, prev. Digitas, Publicis Maria DePanfilis SVP, Dir. of Analytics Havas Lynx NY prev. CementBloc Marcus Tavares MD Havas Worldwide Digital Brazil prev. Wunderman 29
30 Global Leader in Integrated Digital +249% 26% % digital revenue 9%
31 3. ACQUISITIONS AND START-UPS TO GROW AND DEVELOP EXISTING CORE STRENGTHS AND ADD NEW COMPETENCIES 31 Résultats Annuels 2012
32 Recent Acquisitions and Startups Shanghai Shanghai Singapore 32


33 Recent Acquisitions and Startups Singapore Shanghai Poland China, India, Singapore Shanghai Kenya Rep of Congo South Africa Nigeria 33
34 PURSUE A PATIENT, RIGOROUS AND DIFFERENTIATED ACQUISITION STRATEGY THAT MAXIMIZES SHAREHOLDER VALUE 34
35 4. ACCELERATE DEVELOPMENT IN HIGH-GROWTH MARKETS 35 Résultats Annuels 2012
36 % Share of Revenue in "Emerging" Markets 16% 17% 13% 10% 11,0% 11,0% Havas Digital Revenue
37 2012 Organic Growth by Market > 15 % +10% to +15% +5% to +10% < 5% MAINLAND CHINA, UNITED ARAB EMIRATES, JAPAN, TURKEY, PHILIPPINES, THAILAND, ARGENTINA, PERU, URUGUAY, VENEZUELA AUSTRIA, INDIA, COLOMBIA, SOUTH AFRICA, TUNISIA MEXICO, RUSSIA, BELGIUM, HUNGARY, SINGAPORE, TAIWAN, KOREA, SAUDI ARABIA FRANCE, U.K., SPAIN, GERMANY, PORTUGAL, ITALY, THE NETHERLANDS, SWITZERLAND, AUSTRALIA, US, CANADA, BRAZIL, INDONESIA, H.K. 37
38 5. DEVELOP AND ACCELERATE GLOBAL CLIENT GROWTH 38 Résultats Annuels 2012


39 +170% * Havas Worldwide markets Pernod Ricard brands in 70+ markets * 2002 vs 2012 Revenue % Change


40 +778% * Havas Worldwide is responsible for 160 Reckitt Benckiser brands in 70+ markets Continued year-on-year growth +11% FY * 2002 vs 2012 Revenue % Change


41 +505% * Growth driven by Digital and Network expansion Active in 60+ countries globally Continued year-on-year growth +20% FY * 2002 vs 2012 Revenue % Change


42 Havas WW named to Unilever s First Global Digital Roster in 2009 Havas EHS named as Dove Deo AOR January 2011 Havas EHS named as Unilever Global Consumer Data AOR in December % * * 2009 vs 2012 Revenue % Change
43 6. CONSOLIDATE LEADERSHIP IN SUSTAINABILITY/SOCIAL RESPONSIBILITY 43 Résultats Annuels 2012


44 Consolidate Leadership in Sustainability/Social Responsibility One Young World Meaningful Brands Social Business Idea 44 «Who Cares Wins» published in 9 languages - #WhoCaresWins
45 6. BRILLIANT CREATIVITY 45 Résultats Annuels 2012
 Gold 5 Silver 8 Bronze 13")
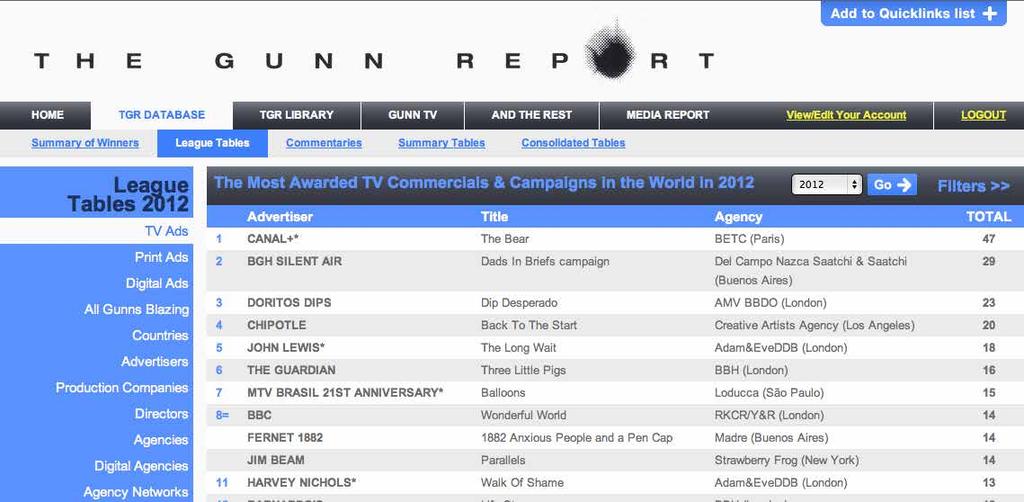
46 Havas Wins 27 Lions at Cannes 2012, +20% vs 2011 Grand Prix 1 (BETC, Canal+ The Bear ) Gold 5 Silver 8 Bronze 13 46

47 47
48 48

49 49 Main New Business wins in 2012
50 RESULTS & FINANCIAL STRUCTURE 2012
51 Consolidated P&L M 2011 Revenue 1,645 Compensation (1,002) Other expenses and income from operations (424) Income from operations 220 Other operating expenses and income (23) Operating income 197 Net financial expense (31) Income of consolidated companies before tax 166 Income tax (38) Net income of consolidated companies 128 Minority interests (8) Net income, group share ,778 (1,094) (445) 240 (21) 219 (29) 190 (55) 135 (9) 126 Variance 2012/ % +9% +11% +14% +5% +5% Restated EPS (1) in % 51 (1) EPS as determined on the basis of Havas SA outstanding capital shares at 31/12/12
52 Margins M Variance 2012/2011 Revenue 1,645 1,778 +8% Organic growth Income from operations % % Income from operations margin (in %) 13.4% 13.5% Operating income % Operating income margin (in %) 12.0% 12.3% Net income, group share % Restated EPS in (1) % 52 (1) EPS as determined on the basis of Havas SA outstanding capital shares at 31/12/12
53 Progression of Income from Operations Margin 13,1% 13,4% 13,5% 12,7% 9,5% 11,0% 12,0% Havas Digital Revenue
54 Compensation Ratio Evolution M Variation Compensation % o/w bonuses % o/w severance Freelance costs % Compensation incl. Free lance ex. severance % in % of revenue 63.3% 63.3% Average headcounts 14,830 15, % 54
55 Other Expenses from Operations Under Control: +5% Other expenses from op Forex Effect Amort. Leases IT & telecom New biz and com. costs Other expenses from op
56 Income Tax Increase of income tax rate from 23% to 29% Higher income tax to pay (France, Mexico, US, China,...) Deferred tax assets: - USA: end of deferred tax assets - France: lower utilization rate of deferred tax assets 56
57 Cash Flow Statement M Net income of consolidated companies Amortization, provisions and financial cost Operating cash flow Change in WCR Cash flow from operations Investments (incl. Buy-out) Change in capital * Dividends Net proceeds from borrowings Financial charges and forex effect Change in net cash position Change in net cash excl. Share buy-back * OPRA / OPAS effect = 269M
58 Consolidated Balance Sheet M Assets 12/31/1 1 Intangible and tangible assets 1,866 Net differed tax 80 12/31/1 2 1, Liabilities Consolidated equity 12/31/1 1 1,306 Provisions 102 Net financial debt (44) 12/31/1 2 1, WCR (494) (472) Earn out / Buy-out Total 1,452 1,516 Total 1,452 1,516 58
59 Change in Net Debt Calculation Closing net debt Average net debt Former definition Total E/O and B/O Employee profit-sharing blocked in current accounts New definition
 of 225M in 2012 vs 12M in 2011.")
60 Closing and Average Net Debt Net debt of 168M as of 12/31/2012 vs 44M net cash as of 12/31/2011. Average net debt (1) of 225M in 2012 vs 12M in (1) Definition of net debt on page 2
61 Liquidity as of 12/31/2012 ( M) Undrawn mid-term committed credit lines 376 Undrawn 365 day committed credit lines 79 Cash and cash equivalents 530 Total of potential liquidity 985 Available uncommitted credit lines 194 Available commercial paper program 210 Total of financing resources 1,389 61
62 Financial Ratios M Net Debt Equity 1,306 1,136 Gearing Adjusted EBITDA (1) Net debt / adjusted EBITDA -0.2x 0.6x Average net debt (2) Average net debt / adjusted EBITDA 0.0x 0.8x Financial result Adjusted EBITDA / Financial Result 8.3x 9.6x 62 (1) Adjusted EBITDA = Income from operations plus intangible and tangible fixed assets depreciation and amortization, stock option charges and other compensation defined by IFRS 2 (2) Definition of average net debt on page 2
63 Stable Dividend of 0.11 per Share but Significant Cash Return Thanks to Buy-Back 301M 52m Havas shares bought and cancelled in 2012 Dividend proposal of 0.11 per share, payment date: 06/12/ Share buy-back Dividends
64 Conclusion Structural advantage: agile & entrepreneurial Continued success growing global clients Unique "digital at the core " model in all agencies Confirmed objective to increase operating margins Ongoing acquisiton policy focused on digital with clear financial criteria Sustained cash return policy in the long run 64
2012 FIRST HALF RESULTS. August 31, 2012
 August 31, 2012 1 INTRODUCTORY MATTERS Forward-Looking Information This document contains certain forward-looking statements which speak only as of the date on which they are made. Forward-looking statements
2016 FULL YEAR RESULTS. February 28th, 2017
 2016 FULL YEAR RESULTS February 28th, 2017 INTRODUCTORY MATERS Forward-Looking Information This document contains certain forward-looking statements which speak only as of the date on which they are made.
2010 Annual Results. February 10, 2011
 2010 Annual Results February 10, 2011 Disclaimer This presentation contains forward-looking statements. The use of the words "aim(s)," "expect(s)," "feel(s)," "will," "may," "believe(s)," "anticipate(s)"
THIRD QUARTER 2017 OCTOBER 2017
 THIRD QUARTER 2017 OCTOBER 2017 DISCLAIMER Certain information contained in this document, other than historical information, may constitute forward-looking statements or unaudited financial forecasts.
1st Half 2010 Results. July 29, 2010
 Results July 29, 2010 1 Disclaimer This presentation contains forward-looking statements. The use of the words "aim(s)," "expect(s)," "feel(s)," "will," "may," "believe(s)," "anticipate(s)" and similar
1st Quarter Revenue. April 22, 2010
 1st Quarter Revenue April 22, 2010 Disclaimer This presentation contains forward looking statements. The use of the words "aim(s)," "expect(s)," "feel(s)," "will," "may," "believe(s)," "anticipate(s)"
THIRD QUARTER OCTOBER 2018
 THIRD QUARTER 2018 18 OCTOBER 2018 DISCLAIMER Certain information contained in this document, other than historical information, may constitute forward-looking statements or unaudited financial forecasts.
2009 RESULTS: Solid performance in 2009 Net cash position turned positive Proposed doubling of dividend
 Suresnes, March 23, 2010 PRESS RELEASE 2009 RESULTS: Solid performance in 2009 Net cash position turned positive Proposed doubling of dividend Annual revenue of 1,441 million, organic growth of -7.9% for
THIRD QUARTER 2016 REVENUE. 20 October 2016
 THIRD QUARTER 2016 REVENUE DISCLAIMER Certain information contained in this document, other than historical information, may constitute forward-looking statements or unaudited financial forecasts. These
3 rd Quarter Revenue. October 20, 2011
 3 rd Quarter Revenue October 20, 2011 DISCLAIMER This presentation contains forward-looking statements. The use of the words "aim(s)," "expect(s)," "feel(s)," "will," "may," "believe(s)," "anticipate(s)"
2012 HALF YEAR RESULTS
 2012 HALF YEAR RESULTS DISCLAIMER This presentation contains forward-looking statements. The use of the words "aim(s)," "expect(s)," "feel(s)," "will," "may," "believe(s)," "anticipate(s)" and similar
Global Business Barometer April 2008
 Global Business Barometer April 2008 The Global Business Barometer is a quarterly business-confidence index, conducted for The Economist by the Economist Intelligence Unit What are your expectations of
2010 Results. Paris - March 2, 2011
 2010 Results Paris - March 2, 2011 > Highlights of 2010 > Financial results > Strategy and outlook 2010 Results 2 2010: A Year of Acceleration Highlights of 2010 Revenue of 3,892m, up 19.1% Operating profit
Marine. Global Programmes. cunninghamlindsey.com. A Cunningham Lindsey service
 Marine Global Programmes A Cunningham Lindsey service Marine global presence Marine Global Programmes Cunningham Lindsey approach Managing your needs With 160 marine surveyors and claims managers in 36
EQUITY REPORTING & WITHHOLDING. Updated May 2016
 EQUITY REPORTING & WITHHOLDING Updated May 2016 When you exercise stock options or have RSUs lapse, there may be tax implications in any country in which you worked for P&G during the period from the
Risks and Opportunities in Global Equities Today BCI Global Investment Conference Tom Mann, CFA Senior Portfolio Manager
 Risks and Opportunities in Global Equities Today BCI Global Investment Conference Tom Mann, CFA Senior Portfolio Manager June 2017 For professional investors only. Not suitable for retail clients 05/06/2017
First ever quarter with over 200m Gross Profit
 11 July 2018 and H1 2018 Trading Update Steve Ingham Kelvin Stagg Chief Executive Officer Chief Financial Officer First ever quarter with over 200m Gross Profit LSE: PAGE.L Website: http://www.page.com/investors
AXA. Jean-Laurent Granier. Chairman & CEO of AXA Global P&C CEO of the Mediterranean and Latin American Region Member of the Management Committee
 AXA Jean-Laurent Granier Chairman & CEO of AXA Global P&C CEO of the Mediterranean and Latin American Region Member of the Management Committee March 27, 2014 Morgan Stanley European Financials Conference
Prosegur 1H 2014 Results
 Prosegur 31 st July 2014 20140731ACD INVESTOR RELATIONS 1 Highlights Organic growth Improvement of more than 50% over the same period in 2013 Incremental EBIT improvement Continuing with the trend initiated
CONTEXT. Headwinds on economies 2012 GDP growth forecast lowered to +3.3% by the IMF. Impacts on the sector. Growth deceleration USA ROW
 2012 Q3 RESULTS DISCLAIMER This presentation contains forward-looking statements. The use of the words "aim(s)," "expect(s)," "feel(s)," "will," "may," "believe(s)," "anticipate(s)" and similar expressions
Q REVENUE April 21, 2015
 Q1 2015 REVENUE April 21, 2015 DISCLAIMER This presentation contains forward-looking statements. The use of the words "aim(s)," "expect(s)," "feel(s)," "will," "may," "believe(s)," "anticipate(s)" and
Second Quarter Trading Update 9 July 2010
 Second Quarter Trading Update 9 July 2010 Michael Page International Second Quarter Trading Update 2010 2 Group gross profit Constant Group gross profit m m Reported exchange 2010 vs 2009 111.5 83.8 +33.1%
New in 2013: Greater emphasis on capital flows Refinements to EBA methodology Individual country assessments
 As in 212: Stock-take: multilaterally consistent assessment of external sector policies of the largest economies Feeds into Article IVs Draws on External Balance Assessment (EBA) methodology/other Identifies
2017 Fourth Quarter Data Book
 2017 Fourth Quarter Data Book TABLE OF CONTENTS PAGE STOCK AND EQUITY RELATED INFORMATION --------------------------------------------------- 3 SUMMARY OF SALES AND INCOME-----------------------------------------------------------------
2017 Fourth Quarter Data Book
 2017 Fourth Quarter Data Book 14 February 3M 2018. All Rights Reserved. 1 TABLE OF CONTENTS PAGE STOCK AND EQUITY RELATED INFORMATION ------------------------------------------------------- 3 SUMMARY OF
World s Best Investment Bank Awards 2018
 Global Finance will publish its selections for the 19th Annual World s Best Investment Banks in the April 2018 issue. Winners will be honored at an awards ceremony in New York City in March, and all award
Global Consumer Confidence
 Global Consumer Confidence The Conference Board Global Consumer Confidence Survey is conducted in collaboration with Nielsen 4TH QUARTER 2017 RESULTS CONTENTS Global Highlights Asia-Pacific Africa and
FY2016 RESULTS. 1 February 2016 to 31 January Inditex continues to roll out its global, fully integrated store and online model.
 FY2016 RESULTS 1 February 2016 to 31 January 2017 Inditex continues to roll out its global, fully integrated store and online model. Strong operating performance: Net sales for FY2016 reached 23.3 billion,
Global Exhibition Barometer 13 th edition (July 2014)
") Global Exhibition Barometer 13 th edition A UFI report based on the results of a survey conducted in June among UFI*, SISO**, AFIDA*** & EXSA**** Members (*) Global (**) USA (***) Central & South America
Global Exhibition Barometer 13 th edition A UFI report based on the results of a survey conducted in June among UFI*, SISO**, AFIDA*** & EXSA**** Members (*) Global (**) USA (***) Central & South America
Another quarter of double digit growth
 11 April 2018 2018 Trading Update Steve Ingham Kelvin Stagg Chief Executive Officer Chief Financial Officer Another quarter of double digit growth LSE: PAGE.L Website: http://www.page.com/investors Headline
Best Treasury & Cash Management Providers 2017
 Page 1 of 5 In March 2017, Global Finance will publish its selections for the Seventeenth Annual World s Best Treasury & Cash Management Providers. Global Finance will select the best overall global cash
Financial wealth of private households worldwide
 Economic Research Financial wealth of private households worldwide Munich, October 217 Recovery in turbulent times Assets and liabilities of private households worldwide in EUR trillion and annualrate
CNH and China QFII market: Opportunities and Challenges A Fund Custodian and Administrator's Perspective"
 CNH and China QFII market: Opportunities and Challenges A Fund Custodian and Administrator's Perspective" Eric Chow HSBC Securities Services June 2011 2 Agenda About HSBC Securities Services (HSS) Introducing
Half-year 2014 results. May 16 th, 2014
 Half-year 2014 results May 16 th, 2014 Winter 2014 2 Pragelato-Vialattea, Italia Differences between the final figures and estimated data* *Published on April 28 th, 2014 (in m) S1 12 S1 13 S1 14 estimated
Investor Presentation
 Investor Presentation May 2013 48,000 employees 200 offices 70 countries 1 global platform Table of Contents I. Company Description II. Global Growth Strategy III. Financial Overview IV. Appendix 2 Company
Guide to Treatment of Withholding Tax Rates. January 2018
 Guide to Treatment of Withholding Tax Rates Contents 1. Introduction 1 1.1. Aims of the Guide 1 1.2. Withholding Tax Definition 1 1.3. Double Taxation Treaties 1 1.4. Information Sources 1 1.5. Guide Upkeep
Half Year Earnings Press conference August 2, 2018
 Half Year Earnings 2018 Press conference August 2, 2018 IMPORTANT LEGAL INFORMATION AND CAUTIONARY STATEMENTS CONCERNING FORWARD-LOOKING STATEMENTS Certain statements contained herein may be forward-looking
2014 Full year results. INVESTOR CALL 26 March 2014
 2014 Full year results INVESTOR CALL 26 March 2014 AGENDA DISCLAIMER 2014 FOURTH QUARTER 2014 FULL YEAR CAPITAL STRUCTURE OUTLOOK APPENDIX 2 DISCLAIMER Any information in this presentation that is not
Chart Collection for Morning Briefing
 Chart Collection for Morning Briefing February 12, 219 Dr. Edward Yardeni 516-972-7683 eyardeni@ Mali Quintana 48-664-1333 aquintana@ Please visit our sites at blog. thinking outside the box 25 Figure
Compagnie Financière Tradition
 Compagnie Financière Tradition H1 2016 results presentation Zurich 1 September 2016 First semester activity in a stabilising market environment Results overview H1 2016 Performance Differentiation in revenue
Prosegur. May 7 th, 2014 PROSEGUR. 1Q 2014 Results. 1Q 2014 Results
 Prosegur May 7 th, 2014 20140422ACD INVESTOR RELATIONS 1 Highlights Profitability Increase Margin recovery in all regions Tighter indirect costs control EBIT grows 32% at constant FX rate Exchange Rate
EP UNEP/OzL.Pro.WG.1/39/INF/2
 UNITED NATIONS EP UNEP/OzL.Pro.WG.1/39/INF/2 Distr.: General 26 May English only United Nations Environment Programme Open-ended Working Group of the Parties to the Montreal Protocol on Substances that
Summary 715 SUMMARY. Minimum Legal Fee Schedule. Loser Pays Statute. Prohibition Against Legal Advertising / Soliciting of Pro bono
 Summary Country Fee Aid Angola No No No Argentina No, with No No No Armenia, with No No No No, however the foreign Attorneys need to be registered at the Chamber of Advocates to be able to practice attorney
SHARE IN OUR FUTURE AN ADVENTURE IN EMPLOYEE STOCK OWNERSHIP DEBBI MARCUS, UNILEVER
 SHARE IN OUR FUTURE AN ADVENTURE IN EMPLOYEE STOCK OWNERSHIP DEBBI MARCUS, UNILEVER DEBBI.MARCUS@UNILEVER.COM RUTGERS SCHOOL OF MANAGEMENT AND LABOR RELATIONS NJ/NY CENTER FOR EMPLOYEE OWNERSHIP AGENDA
San Francisco Retiree Health Care Trust Fund Education Materials on Public Equity
 M E K E T A I N V E S T M E N T G R O U P 5796 ARMADA DRIVE SUITE 110 CARLSBAD CA 92008 760 795 3450 fax 760 795 3445 www.meketagroup.com The Global Equity Opportunity Set MSCI All Country World 1 Index
US Economic Indicators: Import Prices, PPI, & CPI
 US Economic Indicators: Import Prices, PPI, & CPI December 1, 17 Dr. Edward Yardeni 51-97-73 eyardeni@ Debbie Johnson --1333 djohnson@ Please visit our sites at blog. thinking outside the box Table Of
2018 Global Survey of Accounting Assumptions. for Defined Benefit Plans. Executive summary
 2018 Global Survey of Accounting Assumptions for Defined Benefit Plans Executive summary Executive summary In broad terms, accounting standards aim to enable employers to approximate the cost of an employee
July 26, 2017 LafargeHolcim Ltd 2015
 Second Quarter 2017 Results Beat Hess, Chairman and Interim CEO Roland Köhler, Interim COO and Regional Head of Europe, Australia/NZ & Trading Ron Wirahadiraksa, CFO July 26, 2017 LafargeHolcim Ltd 2015
HSBC Holdings plc Annual Results
 HSBC Holdings plc Forward-looking statements This presentation and subsequent discussion may contain certain forward-looking statements with respect to the financial condition, results of operations and
IT ONLY TAKES ONE INDEX TO CAPTURE THE WORLD THE MODERN INDEX STRATEGY. msci.com
 IT ONLY TAKES ONE INDEX TO CAPTURE THE WORLD THE MODERN INDEX STRATEGY msci.com MSCI DELIVERS THE MODERN INDEX STRATEGY The MSCI ACWI Index, MSCI s flagship global equity benchmark, is designed to represent
Overview of Transfer Pricing Regulations. CA Akshay Kenkre
 Overview of Transfer Pricing Regulations CA Akshay Kenkre 1 What is Transfer Pricing What is Transfer Price? A Price at which one person transfers physical goods, services, tangible or/ and intangibles
Market Correlations: CRB Raw Industrials Spot Price Index
 Market Correlations: Spot Price Index December 15, 2017 Dr. Edward Yardeni 516-972-7683 eyardeni@ Debbie Johnson 480-664-1333 djohnson@ Mali Quintana 480-664-1333 aquintana@ Please visit our sites at www.
2013 Global Survey of Accounting Assumptions. for Defined Benefit Plans. Executive Summary
 2013 Global Survey of Accounting Assumptions for Defined Benefit Plans Executive Summary Executive Summary In broad terms, accounting standards aim to enable employers to approximate the cost of an employee
Market Briefing: Global Markets
 Market Briefing: Global Markets July 6, 218 Dr. Edward Yardeni 516-972-7683 eyardeni@ Mali Quintana 48-664-1333 aquintana@ Please visit our sites at blog. thinking outside the box Table Of Contents Table
FY2017 RESULTS. 1 February 2017 to 31 January Inditex continues to roll out its global, fully integrated store and online platform.
 FY2017 RESULTS 1 February 2017 to 31 January 2018 Inditex continues to roll out its global, fully integrated store and online platform. Strong operating performance: Net sales for FY2017 reached 25.3 billion,
HALF-YEAR RESULTS Robert Walters plc 26 July 2017
 HALF-YEAR RESULTS Robert Walters plc STRATEGY & GROUP HIGHLIGHTS Robert Walters, Chief Executive Officer AGENDA FINANCIAL REVIEW Alan Bannatyne, Chief Financial Officer OPERATIONS REVIEW Giles Daubeney,
2009 Half Year Results. August 25, 2009
 1 2009 Half Year Results August 25, 2009 2 Caution statement This presentation may contain forward looking statements, which are subject to risk and uncertainty. A variety of factors could cause our actual
February 29 th, FY 2015 Results Presentation
 February 29 th, 2016 FY 2015 Results Presentation 1 GROWTH Excellent results in Spain and Argentina Positive organic growth in Brazil Sales growth of 4.7% including FX rate LatAm organic growth above 12%
Double Tax Treaties. Necessity of Declaration on Tax Beneficial Ownership In case of capital gains tax. DTA Country Withholding Tax Rates (%)
") Double Tax Treaties DTA Country Withholding Tax Rates (%) Albania 0 0 5/10 1 No No No Armenia 5/10 9 0 5/10 1 Yes 2 No Yes Australia 10 0 15 No No No Austria 0 0 10 No No No Azerbaijan 8 0 8 Yes No Yes
Double Tax Treaties DTA Country Withholding Tax Rates (%) Albania 0 0 5/10 1 No No No Armenia 5/10 9 0 5/10 1 Yes 2 No Yes Australia 10 0 15 No No No Austria 0 0 10 No No No Azerbaijan 8 0 8 Yes No Yes
2017 Global Family Business Tax Monitor
 2017 Global Family Business Tax Monitor Preserve your legacy: a global study on inheritance tax for family business Peter Englisch EY Global Family Business Leader Alongside his extensive experience as
IMPORTANT TAX INFORMATION
 00126803 IMPORTANT TAX INFORMATION Dear Hartford Funds Shareholder: The following information about your enclosed 1099-DIV from Hartford Funds should be used when preparing your 2014 tax return. The information
Islamic Finance News Forum London, October 17 th, Christine Chardonnens MSCI Barra
 Islamic Finance News Forum London, October 17 th, 2008 Christine Chardonnens MSCI Barra Islamic Indices 1. Construction and methodology highlights, including dividend purification 2. Performance and risk
26 MAY Boustead Singapore Limited / Boustead Projects Limited Joint FY2015 Financial Results Presentation
 26 MAY 2015 Boustead Singapore Limited / Boustead Projects Limited Joint FY2015 Financial Results Presentation Disclaimer This presentation contains certain statements that are not statements of historical
Actuarial Supply & Demand. By i.e. muhanna. i.e. muhanna Page 1 of
 By i.e. muhanna i.e. muhanna Page 1 of 8 040506 Additional Perspectives Measuring actuarial supply and demand in terms of GDP is indeed a valid basis for setting the actuarial density of a country and
Q3 REVENUE October 22, 2015
 Q3 REVENUE 2015 October 22, 2015 DISCLAIMER This presentation contains forward-looking statements. The use of the words "aim(s)," "expect(s)," "feel(s)," "will," "may," "believe(s)," "anticipate(s)" and
First Quarter 2018 Trading Update
 FOR IMMEDIATE RELEASE 30 April, 2018 First Quarter 2018 Trading Update Guidance for 2018 unchanged; fresh look at strategy with focus on growth Reported revenue down 4.0% at 3.555 billion, currency headwinds
PMITM. The world s leading economic indicator
 PMITM The world s leading economic indicator The Purchasing Managers IndexTM (PMITM) is based on monthly surveys of carefully selected companies representing major and developing economies worldwide. KEY
STATISTICS Last update: 03/07/2017
 STATISTICS 2012-2016 Last update: 03/07/2017 BU NEWS BUSINESS [USD, BILLIONS] New business by year, vs. total world exports 3,000 2,500 2,000 1,500 1,000 500 12,131 1,138 40 127 971 14,023 1,323 53 143
Global solutions. Local expertise.
 Global solutions. Local expertise. Count on Sedgwick around the world Sedgwick is a leading global provider of technology-enabled risk, benefits and integrated business solutions. Our 21,000 colleagues,
Full Year 2017 Earnings. Press Conference February 22, 2018
 Full Year 2017 Earnings Press Conference February 22, 2018 IMPORTANT LEGAL INFORMATION AND CAUTIONARY STATEMENTS CONCERNING FORWARD-LOOKING STATEMENTS Certain statements contained herein may be forward-looking
Global Economic Briefing: Global Liquidity
 Global Economic Briefing: Global Liquidity December 21, 217 Dr. Edward Yardeni 516-972-7683 eyardeni@ Debbie Johnson 48-664-1333 djohnson@ Mali Quintana 48-664-1333 aquintana@ Please visit our sites at
Reporting practices for domestic and total debt securities
 Last updated: 27 November 2017 Reporting practices for domestic and total debt securities While the BIS debt securities statistics are in principle harmonised with the recommendations in the Handbook on
2013 APCBF SALES INCENTIVE SURVEY REPORT INDIA
 2013 APCBF SALES INCENTIVE SURVEY REPORT INDIA Contents INTRODUCTION... 2 EXECUTIVE SUMMARY... 3 PARTICIPANT PROFILE... 7 SALES PLAN DESIGN... 12 SALES INCENTIVE PLAN DESIGNING... 12 FUNCTIONS COVERED
Global Economic Indictors: CRB Raw Industrials & Global Economy
 Global Economic Indictors: & Global Economy December 14, 2017 Dr. Edward Yardeni 516-972-7683 eyardeni@ Mali Quintana 480-664-1333 aquintana@ Please visit our sites at www. blog. thinking outside the box
Unilever Investor Event 2018 Graeme Pitkethly 4 th December 2018
 Unilever Investor Event 2018 Graeme Pitkethly 4 th December 2018 SAFE HARBOUR STATEMENT This announcement may contain forward-looking statements, including forward-looking statements within the meaning
Market Briefing: Gold
 Market Briefing: Gold January 3, 218 Dr. Edward Yardeni 516-972-7683 eyardeni@ Mali Quintana 48-664-1333 aquintana@ Please visit our sites at www. blog. thinking outside the box Table Of Contents Table
FOREIGN ACTIVITY REPORT
 FOREIGN ACTIVITY REPORT SECOND QUARTER 2012 TABLE OF CONTENTS Table of Contents... i All Securities Transactions... 2 Highlights... 2 U.S. Transactions in Foreign Securities... 2 Foreign Transactions in
MCL Global. Major & Complex Loss. Global Capabilities. cunninghamlindsey.com
 Major & Complex Loss Global Capabilities cunninghamlindsey.com MCL Global - Global Capabilities Strength in numbers The insurance market is facing some fundamental changes in the claims it faces and the
Market Correlations: Expected Inflation in TIPS
 Market Correlations: in TIPS April, 8 Dr. Edward Yardeni 56-97-768 eyardeni@ Joe Abbott 7-497-56 jabbott@ Mali Quintana 48-664- aquintana@ Please visit our sites at www. blog. thinking outside the box
ROADSHOW POST-Q2 & H RESULTS. September 2016
 ROADSHOW POST-Q2 & H1 2016 RESULTS September 2016 1. COMPANY OVERVIEW Rexel at a glance : Strategic partner for suppliers and customers Energy Providers Suppliers Customers Endusers Economies of scale
2016 FULL YEAR EARNINGS
 2016 FULL YEAR EARNINGS Press conference Paris 23 February 2017 Certain statements contained herein are forward-looking statements including, but not limited to, statements that are predictions of or indicate
MAISONS DU MONDE: FULL-YEAR 2018 RESULTS
 PRESS RELEASE MAISONS DU MONDE: FULL-YEAR 2018 RESULTS Strong performance in line with targets Continued solid momentum in online and international sales Focus on strategic pillars to deliver further profitable
Financial achievements & objectives. Elie Girard Group CFO
 Disclaimer This document contains forward-looking statements that involve risks and uncertainties, including references, concerning the Group's expected growth and profitability in the future which may
Market Correlations: Trade-Weighted Dollar
 Market Correlations: Trade-Weighted Dollar March 11, 218 Dr. Edward Yardeni 516-972-7683 eyardeni@ Joe Abbott 732-497-536 jabbott@ Mali Quintana 48-664-1333 aquintana@ Please visit our sites at www. blog.
MERCER SMARTDB TM A SMARTER APPROACH TO MANAGING LONGEVITY RISK
 MERCER SMARTDB TM A SMARTER APPROACH TO MANAGING LONGEVITY RISK www.uk.mercer.com/smartdb MERCER SMARTDB TM A SMARTER APPROACH TO MANAGING LONGEVITY RISK Mercer SmartDB TM is a groundbreaking new solution
Global Construction 2030 Expo EDIFICA 2017 Santiago Chile. 4-6 October 2017
 Global Construction 2030 Expo EDIFICA 2017 Santiago Chile 4-6 October 2017 Graham Robinson Global Construction Perspectives Global Construction 2030 is the fourth in a series of global studies of the construction
YUM! Brands, Inc. Historical Financial Summary. Second Quarter, 2017
 YUM! Brands, Inc. Historical Financial Summary Second Quarter, 2017 YUM! Brands, Inc. Consolidated Statements of Income (in millions, except per share amounts) 2017 2016 2015 YTD Q3 Q4 FY FY Revenues Company
UP OR DOWN? 2015 Q3 NIELSEN GLOBAL SURVEY OF CONSUMER CONFIDENCE AND SPENDING INTENTIONS
 UP OR DOWN? 2015 Q3 NIELSEN GLOBAL SURVEY OF CONSUMER CONFIDENCE AND SPENDING INTENTIONS Among the world s largest economies, U.S. consumer confidence jumped 18 index points in the third quarter to a score
The Capital Requirements (Country-by-Country Reporting) Regulations December 2017
 Regulations December 2017") HSBC Holdings plc The Capital Requirements (Country-by-Country Reporting) Regulations 2013 31 December 2017 This report has been prepared for HSBC Holdings plc and its subsidiaries (the HSBC Group ) to
HSBC Holdings plc The Capital Requirements (Country-by-Country Reporting) Regulations 2013 31 December 2017 This report has been prepared for HSBC Holdings plc and its subsidiaries (the HSBC Group ) to
Luxottica Group Net Sales for First Quarter 2005 Up Year-Over-Year by 34.8 percent
 Luxottica Group Net Sales for First Quarter 2005 Up Year-Over-Year by 34.8 percent Milan, Italy April 28, 2005 - Luxottica Group S.p.A. (NYSE: LUX; MTA: LUX), global leader in the eyewear sector, today
Global Economic Briefing: Global Inflation
 Global Economic Briefing: Global Inflation November, 7 Dr. Edward Yardeni -97-7 eyardeni@ Debbie Johnson -- djohnson@ Mali Quintana -- aquintana@ Please visit our sites at www. blog. thinking outside the
DOMESTIC CUSTODY & TRADING SERVICES
 Pricing Structure DOMESTIC CUSTODY & TRADING SERVICES A flat custody fee of 20bps per account type per year is applicable to all holdings and cash, the custody fee is collected each month but will be capped
Planning Global Compensation Budgets for 2018 November 2017 Update
 Planning Global Compensation Budgets for 2018 November 2017 Update Planning Global Compensation Budgets for 2018 The year is rapidly coming to a close, and we are now in the midst of 2018 global compensation
Investing in the Education Sector
 This document was created before Parthenon joined Ernst & Young LLP on August 29, 2014, and has not been updated to reflect the combination. Investing in the Sector Strategies for Success in Emerging Markets
2018 Edelman Trust Barometer
 2018 Edelman Trust Barometer Snapshot Australia #TrustBarometer Trust Index A World of Distrust Average trust in institutions, general population, 2017 vs. 2018 Global Trust Index remains at distruster
Quarterly Investment Update First Quarter 2017
 Quarterly Investment Update First Quarter 2017 Market Update: A Quarter in Review March 31, 2017 CANADIAN STOCKS INTERNATIONAL STOCKS Large Cap Small Cap Growth Value Large Cap Small Cap Growth Value Emerging
Total Imports by Volume (Gallons per Country)
") 3/7/2018 Imports by Volume (Gallons per Country) YTD YTD Country 01/2017 01/2018 % Change 2017 2018 % Change MEXICO 54,235,419 58,937,856 8.7 % 54,235,419 58,937,856 8.7 % NETHERLANDS 12,265,935 10,356,183
3/7/2018 Imports by Volume (Gallons per Country) YTD YTD Country 01/2017 01/2018 % Change 2017 2018 % Change MEXICO 54,235,419 58,937,856 8.7 % 54,235,419 58,937,856 8.7 % NETHERLANDS 12,265,935 10,356,183
Hewitt Associates, Inc Robert W. Baird Business Solutions Conference
 February 26, 2009 Hewitt Associates, Inc. 2009 Robert W. Baird Business Solutions Conference Forward-Looking Statements and Non-GAAP Financial Measures This presentation contains forward-looking statements
Presentation 22 August 2018
 Presentation 22 August 2018 Exceeded 3YP targets in 2017, but 2018 is challenging due to continued destocking, store closures and bankruptcies Profit attributable to shareholders (like-for-like) down 19%
NORTH AMERICAN UPDATE
 NORTH AMERICAN UPDATE December 6 th, 2018 INNOVATION INSIGHT GROWTH SINCE 1968 TOUGH YEAR FOR RETURNS AROUND THE WORLD Index Year-to-date Performance MSCI World -1.2% MSCI USA 3.9% MSCI Canada -3.9% MSCI