Q3 FY18 Noteholder Presentation 29 TH AUGUST 2018
|
|
|
- Gilbert Simon
- 5 years ago
- Views:
Transcription

1 Q3 FY18 Noteholder Presentation 29 TH AUGUST 2018

2 The Presenting Team David Flochel Gabriel Pirona CEO CFO
3 Agenda 01 SELECTA TODAY 02 TRADING UPDATE 03 FINANCIAL RESULTS 04 APPENDIX

4 01 Selecta Today


 TRADING")

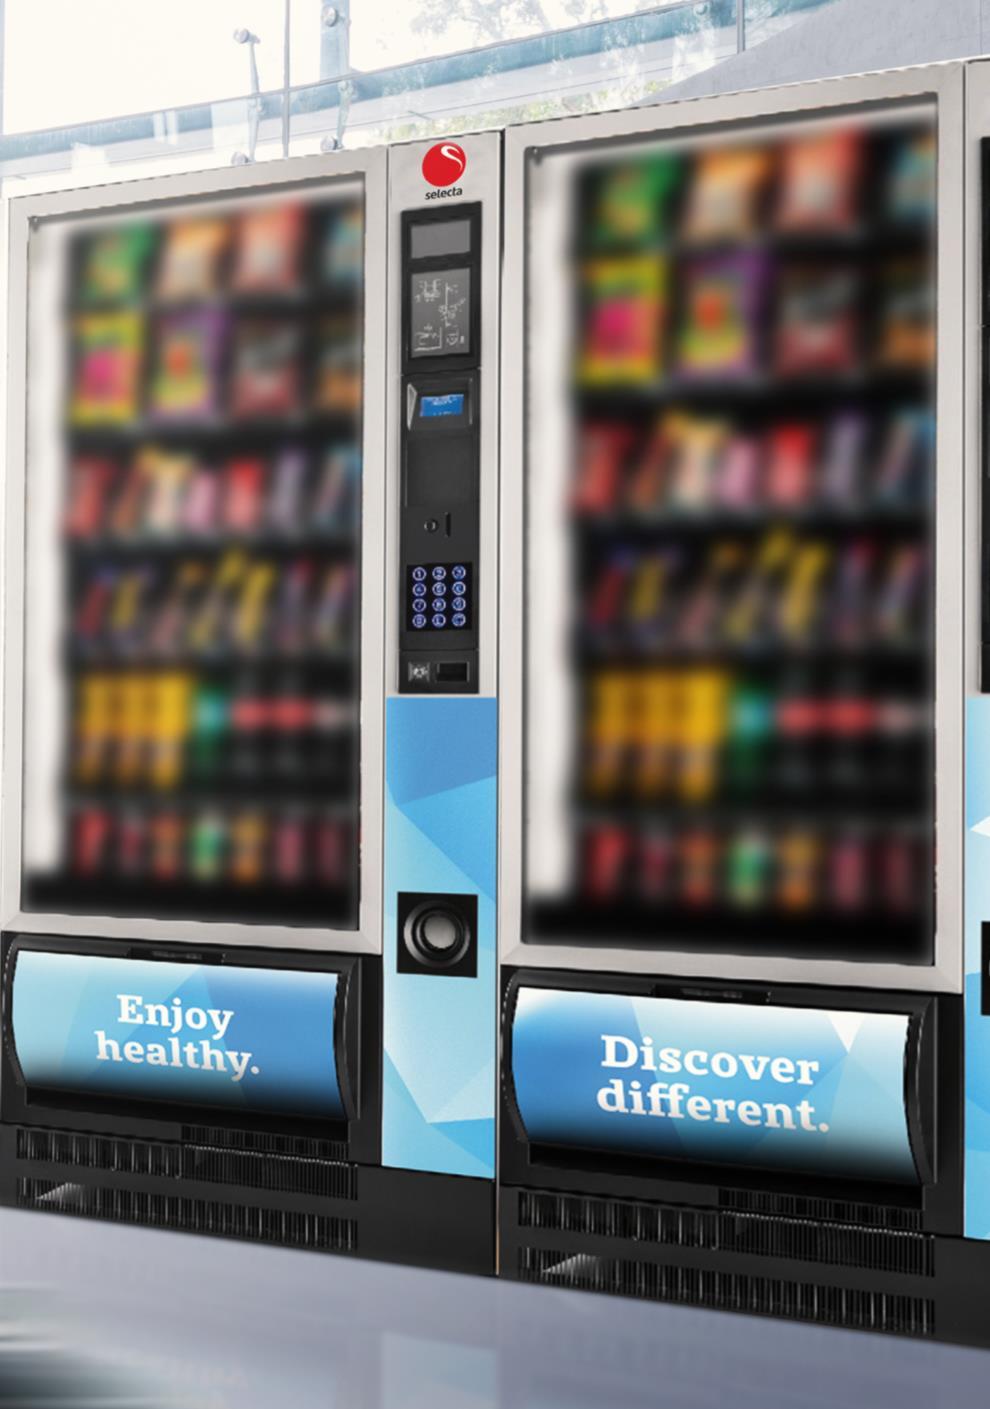
5 01 Selecta Today: the Leading Unattended Self-Service Coffee and Convenience Food Provider in Europe Revenue grew by >2x, from 612 million 1 to 1.4 billion² in past 12 months Increased density and scale of the business, with significant synergy savings 10 million consumers served daily Proven route-based business with unique logistics infrastructure and high density on the last mile Q3FY18 Selecta Business Model: Breakdown by Channels SELECTA: a Rapid Consolidation Key Global Partnerships Trading 20% Q3 Gross Revenue: 380m 4% Total Machine Numbers: ca. 455k 76% On-the-Go Workplace Services HOT DRINKS COLD DRINKS and SNACKS (IMPULSE) TRADING Premium Coffee and Other 55% 30% 15% 1 FY17 Selecta Net Revenue. Excludes disposed entities: East, Baltics and Selecta Finland 2 Pro-forma combined Group Net Revenue FY17 3 OC&C Report, management estimates No. 1 or 2 Position in European Market 3 No. 3 or 5 Position in European Market 3 5


 Detailed database and insights into consumption preferences and trends Scale to Drive Operation Efficiency, Margin Expansion, and Superior")
6 01 Leading Market Positions and Scale Drive Superior Returns SELECTA MANAGE M EN T PRESENTA T I O N SEPTEMBE R 2018 ~4 500 Route Merchandisers Strategic Partnership to Enhance Brand Recognition Leading European footprint positions us as Partner of Choice with global coffee players Natural partner for leading facility management & catering customers as well as large corporates ~1 500 Route Technicians > Vehicles Ability to Invest in Best-in-Class Customer Experience Ability to invest in latest technologies Unique modern tech development (e.g. touchscreen user interface) Detailed database and insights into consumption preferences and trends Scale to Drive Operation Efficiency, Margin Expansion, and Superior Returns Centralized planning and tech support ~150 Planners Negotiate best procurement arrangements Highest density yields superior efficiency and savings Largest machine buyer in Europe, resulting in more efficient capex spend and being the partner of choice for machine manufacturers 6
7 01 Successfully Strengthened #1 Market Leader Position in Europe Ambition Values Strategies Growth Pillars Guided by our Vision & Mission Guided by our Vision & Mission Accelerate our market leadership in Europe with our customers and consumers in mind Being number 1 or 2 in top markets in which we operate Customer Focus Teamwork & winning attitude Integrity Excellence In Execution Self-Service Retail Experience Deliver best solutions to consumers by offering flexible payments, loyalty programs & leveraging data to improve offering Route to Market Excellence Drive customer acquisition by selling unique concepts, opening new routes and standardizing sales processes, and maximize customer base value through high retention, profitability and satisfaction Powered by Great People Attract talent and retain capable organization, in line with core values, for the growth and transformation of the company Operational Excellence Deliver high quality service at highest efficiency through continuous improvement, standardization and technology in order to maximize customer satisfaction, retention and profitability Innovation Leadership Set industry standard for innovation, leveraging the latest technologies to enhance our offering in Self-Service Retail and beyond Improved Retention Rates Growing Sales / Machine / Day + Driven by Strong Management Teams Bolt-On M&A Opportunities Innovation Pipeline New Client Wins Vision: Selecta is the European leader in unattended self-serve coffee and convenience food, at the workplace and on-the-go Mission: Selecta is dedicated to providing great quality coffee brands, convenience food & beverages concepts 7

8 02 Trading Update
9 02 Reconfirmation of FY18 Outlook Update at the End of Q3 ON TRACK TO DELIVERY FULL-YEAR 2018 GUIDANCE TREND UNDERPINNED BY IMPROVING LEADING INDICATORS FOR ORGANIC GROWTH 1 Gross sales to increase by +2.0% (at constant scope and FX rate 1 ) Business is growing as planned in spite of the ongoing major business transformation and the impact of the SNCF strikes in France 2 Adjusted EBITDA for the full year to increase to m (at constant scope and FX rate 1, consistent with prior guidance) Pro-forma EBITDA (including pro-forma unrealised synergies) in excess of 300m 3 Synergy program to be cash positive Total 2018/2020 synergy program of 75m 4 (at constant scope and FX rate 1, consistent with prior guidance) Cash capex to be m (at constant FX rate 1 ) Strong pipeline of commitments Strong uplift in proposals submitted Enhanced density; stronger lever across countries and borders Increase in retention rate Improvement in average sales per machine¹ AND A CONSISTENT, SUCCESSFUL AND ACCRETIVE STRATEGY OF BOLT-ON M&A Successful implementation of on-going M&A activity: goal to deliver 3-5% sales per annum as well as delivering immediate cost synergies Scale continues to make Selecta the consolidator of choice - Completion of acquisition of Stop & Go S.r.l. in Italy - recent acquisition (Q4, August 2018) of Express Vending in the UK 1 Constant foreign currency rates applied: CHF/EUR 1.15; SEK/EUR 9.65; GBP/EUR
10 02 Financial Overview: Q3 FY18 Q3 FY18 revenue in line with expectations Q3 FY18 reported growth +2.1%, despite impact of French railway strikes ( 2m less of sales): LfL growth 2.5% Q3 FY18 adjusted EBITDA at 59.4 or 15.6% margin to gross revenue Underlying Adjusted EBITDA expansion of +2% despite further costs from former PR businesses (as expected) and the impact from loss of earnings due to French rail strikes, as well as deferred extra income (to Q4) Capex efficiencies contributing to the 10.4% increase in EBITDA less net capex ratio Gross revenue ¹ ² Adjusted EBITDA¹ Selecta ( m) +2.1% % Margin +2.0% % Adjusted EBITDA less net capex¹ ³ Q3 FY17 Q3 FY18 1 Constant foreign currency rates applied: CHF/EUR 1.15; SEK/EUR 9.65; GBP/EUR Selecta /PR/Argenta adjusted for subsidiary disposed (Selecta Finland) 2 Revenue gross of vending fees 3 Net capital expenditures is defined as capital expenditures less net book value of disposals of vending equipment 10
 92.5% 94.5% 96% +4.9% +3.2% +1.3% Contract signed Agreed Negotiation Proposal sent 28 26 10.5 11.0 10.8 11.1 11.")

11 Q 3 FY18 N O T E H O L D E R P R E S E N T A T I O N 02 3 Focused Drivers of Organic Growth Best-in-Class Retention Growing Sales / Machine / Day (in ) New Business Pipeline Acceleration ( m) (% retention rate) 92.5% 94.5% 96% +4.9% +3.2% +1.3% Contract signed Agreed Negotiation Proposal sent Q4 17 Q3 18 Near term target Q1 17 Q1 18 Q2 17 Q2 18 Public Q3 17 Q Dedicated task force in FR/UK Standardised reporting tracking progress Recent renewal successes Pricing, assortment & availability optimisation with telemetry data Cashless Private Uplifting c.2,500 underperforming machines YTD Q1 18 Q2 18 Q3 18 Q4 18 CRM in all markets driving discipline Q3 FY18 closed very positively notable wins Other Customer/Partner Development Highlights AWARDED OUTSTANDING SUPPLIER OF THE YEAR BY SHELL FOR FRESH FOOD AND DRINK Publifon CONTRACT RENEWED FOR 3 YEARS 11 11


12 03 Financial Results
13 03 Pro Forma P&L Summary at Actual Rates¹ 3 Months ended 30 th June 2018 Gross revenue In spite of difficult trading conditions, +2.1% at constant scope² and currency ³ (- 6.4m FX impact), +2.5% LfL. The best performance came from the Public and Trading channels. Net revenue Growth YoY at CC of 0.8%, +1.0% LfL with increases in vending fees in the Public channel in the Central markets and UK (higher petrol station vending fees) Adjusted EBITDA Flat YoY at actual rates, +2.0% at CC Negative impact of the rail strikes (SNCF) in France (~ 1.2 m) EBITDA Adjustments 12.7m in Q3 FY18, flat on Q2 Synergy costs ( 10.0m synergy project costs) in the quarter driven by acceleration of initiatives resulting from program upgrade (Group procurement, French integration) and ongoing integration actions (UK and other entities) Reported EBITDA - 4.1m in Q3FY18 vs Q3FY17 m Q3 FY17 Q3 FY18 Variance Variance % Gross Revenue % Vending fees (30.2) (35.0) (4.8) 15.8% Net Revenue (3.3) -1.0% Materials and consumables used (132.0) (128.7) % Gross Profit (0.1) 0.0% % margin on net revenue 61.8% 62.4% 0.6 pts Adjusted employee benefits expense (111.3) (105.3) % Adjusted other operating expenses/income (43.2) (49.3) (6.1) 14.1% Adjusted EBITDA (0.2) -0.3% % margin on gross revenue 15.7% 15.6% -0.1 pts Restructuring / Redundancy costs (1.7) (1.8) (0.2) Other synergy project costs - (10.0) (10.0) Pelican Rouge acquisition costs (at SEL and PR) (5.0) Other adjustments (2.1) (0.8) 1.3 Reported EBITDA (4.1) -8.2% % margin on gross revenue 13.4% 12.2% -1.1 pts 1 At actual FX rates 2 Selecta constant scope adjusted for subsidiary disposed (Selecta Finland). FY17 numbers are a pro forma amalgamation of Selecta, Pelican Rouge and Argenta results 3 Constant foreign currency rates applied: CHF/EUR 1.15; SEK/EUR 9.65; GBP/EUR
14 03 Result by Segment at Constant Rates¹ 3 Months ended 30 th June 2018 Net Revenue by Segment + 2.9m YoY at constant currency and constant scope basis² Slight growth in Switzerland, Benelux, Italy, Spain and Sweden offset by decrease in turnaround markets like France and UK South, UK & Ireland: Central: Approx 36% of total revenue; uplift due to better than expected performance in Spain and Italy Approx 37% of total revenue; down by 2.5m largely due to impact of French railway strikes Q3 FY17 Constant Scope South, UK & Ireland ( m) Net Revenue by region (2.5) Central North Q3 FY18 Constant Scope North: Approx 27% of total revenue; up by 3.9m with rapid growth in Denmark, Norway on the back of new wins rollout, and trading activity in Sweden and Belgium Adjusted EBITDA by Segment (2.1) ( m) Adjusted EBITDA by region m vs LY at CC sharp acceleration of profit generation expected in Q4 South, UK & Ireland: + 2.5m driven by synergies in UK and Spain Central: - 2.1m North: Flat due to lower margins in Trading channel HQ: + 0.8m due to synergies savings and cost management Q3 FY17 Constant Scope South, UK & Ireland Central North HQ Q3 FY18 Constant Scope 1 Constant foreign currency rates applied: CHF/EUR 1.15; SEK/EUR 9.65; GBP/EUR Selecta constant scope adjusted for subsidiary disposed (Selecta Finland). FY17 numbers are a pro forma amalgamation of Selecta, Pelican Rouge and Argenta results 3 Revenue net of vending fees 14 14
15 03 Liquidity at 30 June 2018 Liquidity Summary Cash at bank up from 85.9m to 101.6m end June Senior notes of 1,306.1m 765m senior secured 5.875% m senior secured floating notes 2024 CHF250m senior secured 5.875% 2024 Total accrued interest at June 42.8m Revolving credit facility: 15m drawn in June Group available liquidity 236.6m m Dec 17 Jun 18 Cash at bank Factoring facilities Reverse factoring facilities Revolving credit facility Senior notes ,306.1 Accrued interest Finance leases Total senior debt 1, ,418.7 Net senior debt ,317.1 Adjusted EBITDA last twelve months ¹ ² Leverage ratio 4.8x 5.6x Available liquidity ³ Leverage Ratio Pro-forma leverage ratio (post synergies) of 4.5x m Jun 18 Adjusted EBITDA last twelve months² Leverage ratio excluding synergies 5.6x Pro-forma leverage ratio (post synergies) 4.5x 1 Dec 17 adjusted EBITDA last twelve months based on Selecta and Pelican Rouge only 2 June 2018 adjusted EBITDA last twelve months based on pro forma results of Selecta, Pelican Rouge and Argenta. 3 Includes cash at bank and unused revolving credit facility 15 15
16 03 Cash Flow Statement at Actual Rates 3 Months ended 30 th June Cash Flow Statement at Actual Rates YTD Free Cash Flow impacted by adverse working capital changes, due to Pelican Rouge acquisition and pre-integration costs cashed out in H1 FY18, and adverse movements in Q2 and Q3 expected to be reversed in Q4 Q3 negative financing cash outflow driven by Refinancing transactions costs payout, whereas 15m was drawn on the Revolving Credit Facility (RCF) m Q3 FY18 YTD FY18² EBITDA (Profit) / loss on disposals Cash changes from other operating activities Change in working capital and provisions Net cash from operating activities Capex Finance lease payments EBITDA less net capex (comparable scope and constant rates)¹ ³ m Q3 FY17 Q3 FY18 Variance % Adjusted EBITDA Reported EBITDA Net capexª Adjusted EBITDA less net capex³ On a pro forma basis, adjusted EBITDA less net Capex increases by 9.7% at actual rates and 10.4% at constant rates This improvement is underpinned by capital intensity efficiencies, through the optimisation of investment in new machines and the expansion of external lease / funding schemes Interest received Proceeds from sale of subsidiaries & other proceeds Net cash used in investing activities excluding M&A Free cash flow Acquisition of subsidiary net of cash acquired Free cash flow including acquisition Proceeds from capital increase - - Proceeds/ repayment of loans and borrowings Interest paid and other financing costs Financing related financing costs paid Other 6.8 Net cash used in financing activities Total net cash flow ¹ At comparable scope, i.e. combining Selecta, Pelican Rouge and Argenta for both Q3 FY18 and Q3 FY17, and at constant foreign currency rates: CHF/EUR 1.15; SEK/EUR 9.65; GBP/EUR 0.88 ² No pro forma Q3 FY17 numbers available. YTD FY18: excludes Argenta cash flow for first 4 months, as acquisition happened in month 5 (Feb 2018) 3 Net capital expenditures is defined as capital expenditures less net book value of disposals of vending equipment 16 16
17 03 Outlook for 2018 Full Year ON TRACK TO DELIVER AS PROMISED 1 Gross sales to increase by +2.0% (at constant scope and FX rate 1 ) Business is growing as planned 2 Adjusted EBITDA for the full year to increase to m (at constant scope and FX rate 1, consistent with prior guidance) Pro-forma EBITDA (including pro-forma unrealised synergies) in excess of 300m 3 Synergy program to be cash positive Total 2018/2020 synergy program of 75m (at constant scope and FX rate 1, consistent with prior guidance) 4 5 Cash capex to be m (at constant FX rate 1 ) Free Cash Flow generation that covers our fixed cash charges in FY18 1 Constant foreign currency rates applied: CHF/EUR 1.15; SEK/EUR 9.65; GBP/EUR

18 04 Appendix
19 04 Pro Forma P&L Multiple Rate View 3 Months ended 30 th June 2018 m Q3 CC rates 1,2 Q3 CC rates 1,2 Variance Variance % Q3 ACT FY18 rates 2 Q3 ACT FY18 rates 2 Variance Variance % Gross Revenue % % Vending fees (30.1) (35.0) (4.9) 16.4% (30.1) (35.0) (4.9) 16.4% Net Revenue % % Materials and consumables used (130.9) (129.7) % (129.9) (128.7) % Gross Profit % % % margin on net revenue 61.7% 62.4% 0.6 pts 61.7% 62.4% 0.7 pts Adjusted employee benefits expense (110.2) (106.2) % (109.3) (105.3) % Adjusted other operating expenses/income (42.8) (49.6) (6.9) 16.1% (42.4) (49.3) (6.8) 16.1% Adjusted EBITDA % % % margin on gross revenue 15.6% 15.6% -0.8% 15.6% 15.6% 0.9% Restructuring / Redundancy costs (1.7) (1.9) (0.2) (1.6) (1.8) (0.2) Other synergy project costs - (8.8) (8.8) - (8.7) (8.7) Pelican Rouge acquisition costs (at SEL and PR) (4.8) (4.8) Other adjustments (2.1) (2.0) 0.1 (2.1) (2.2) (0.1) Reported EBITDA (2.8) -5.7% (3.0) -6.1% % margin on gross revenue 13.3% 12.3% -1.0 pts 13.3% 12.2% -1.1 pts 1 Selecta constant scope adjusted for subsidiary disposed (Selecta Finland). FY17 numbers are a pro forma amalgamation of Selecta, Pelican Rouge and Argenta results 2 Constant foreign currency rates applied: CHF/EUR 1.15; SEK/EUR 9.65; GBP/EUR
Q2 FY18 Noteholder Presentation. May 30, 2018
 Q2 FY18 Noteholder Presentation May 30, 2018 Disclaimer THIS PRESENTATION IS NOT AN OFFER OR SOLICITATION OF AN OFFER TO BUY OR SELL SECURITIES IN THE UNITED STATES OF AMERICA OR IN ANY OTHER JURISDICTION.
Q1 FY17/18 Noteholder Presentation. 27 February 2018
 Q1 FY17/18 Noteholder Presentation 27 February 2018 Disclaimer THIS PRESENTATION IS NOT AN OFFER OR SOLICITATION OF AN OFFER TO BUY OR SELL SECURITIES IN THE UNITED STATES OF AMERICA OR IN ANY OTHER JURISDICTION.
Selecta Group B.V. and its subsidiaries, Amsterdam (The Netherlands)
") Selecta Group B.V. and its subsidiaries, Amsterdam (The Netherlands) Condensed consolidated interim financial statements for the 3 months ended 31 December 2017 (unaudited) Table of Contents Operating
Selecta Group B.V. and its subsidiaries, Amsterdam (The Netherlands) Condensed consolidated interim financial statements for the 3 months ended 31 December 2017 (unaudited) Table of Contents Operating
Selecta Group B.V. and its subsidiaries, Amsterdam (The Netherlands)
") Selecta Group B.V. and its subsidiaries, Amsterdam (The Netherlands) Condensed consolidated interim financial statements for the 9 months ended 30 June 2016 (unaudited) Table of Contents Operating and
Selecta Group B.V. and its subsidiaries, Amsterdam (The Netherlands) Condensed consolidated interim financial statements for the 9 months ended 30 June 2016 (unaudited) Table of Contents Operating and
Investor Day. Corporate Overview. Henry Buckley, President & CEO and Eric Bussières, CFO November 28, 2017
 Investor Day Corporate Overview Henry Buckley, President & CEO and Eric Bussières, CFO November 28, 2017 Preliminary Comments Forward-looking statements: The information provided in this presentation contains
Selecta Group B.V. and its subsidiaries, Amsterdam (The Netherlands)
") Selecta Group B.V. and its subsidiaries, Amsterdam (The Netherlands) Condensed consolidated interim financial statements for the 6 months ended 31 March 2018 (unaudited) Table of Contents Condensed consolidated
Selecta Group B.V. and its subsidiaries, Amsterdam (The Netherlands) Condensed consolidated interim financial statements for the 6 months ended 31 March 2018 (unaudited) Table of Contents Condensed consolidated
Presentation of consolidated results. For the 52 weeks ended 30 March 2013
 Presentation of consolidated results For the 52 weeks ended 30 March 2013 1 Agenda Strategic and operational update Financial review Looking forward Jürgen Schreiber CEO Mark Bower Deputy CEO & CFO Jürgen
Presentation of consolidated results. For the quarter ended 28 September 2013
 Presentation of consolidated results For the quarter ended 28 September 2013 1 Agenda Strategic and operational update Financial review Looking forward Jürgen Schreiber CEO Mark Bower Deputy CEO & CFO
Coca-Cola Enterprises and The Coca-Cola Company Strategically Advance and Strengthen their Partnership. February 25, 2010
 Coca-Cola Enterprises and The Coca-Cola Company Strategically Advance and Strengthen their Partnership February 25, 2010 Information & Forward-Looking Statements FORWARD-LOOKING STATEMENTS Included in
Copyright Infor. All Rights Reserved.
 1 The next generation software for the next generation 2 Financial Overview May 2013 3 Infor Overview $2.7B total revenue FY13 pro forma $829M adjusted EBITDA FY13 pro forma 301 new products 3,000+ new
Selecta Group B.V. and its subsidiaries, Amsterdam (The Netherlands)
") Selecta Group B.V. and its subsidiaries, Amsterdam (The Netherlands) Condensed consolidated interim financial statements for the 3 months ended (unaudited) Table of Contents Operating and financial review
Selecta Group B.V. and its subsidiaries, Amsterdam (The Netherlands) Condensed consolidated interim financial statements for the 3 months ended (unaudited) Table of Contents Operating and financial review
Copyright Infor. All Rights Reserved.
 1 Financial Overview February 2013 2 Infor overview $2.8B total revenue FY12 pro forma $838M adjusted EBITDA FY12 pro forma 1,500 partners 2,300 new customers 12,400 employees 70,000 customers around the
FIRST-HALF 2017 RESULTS. 27 July 2017
 FIRST-HALF 2017 RESULTS 27 July 2017 Disclaimer FORWARD LOOKING STATEMENTS This presentation contains certain statements that constitute "forward-looking statements", including but not limited to statements
ELECTROCOMPONENTS Full-year results for the year ended 31 March 2018
 ELECTROCOMPONENTS Full-year results for the year ended 31 March 2018 24 May 2018 SAFE HARBOUR This presentation contains certain statements, statistics and projections that are or may be forward-looking.
Copyright Infor. All Rights Reserved.
 1 Financial Overview February 2014 2 Infor Overview $2.7B total revenue FY13 pro forma $829M adjusted EBITDA FY13 pro forma 301 new products in FY13 3,000+ new customers in FY13 1,745 partners one of the
CEVA Logistics AG Investor Call Second Quarter/First Half July CEVA Logistics AG Q2 2018
 CEVA Logistics AG Investor Call Second Quarter/First Half 2018 27 July 2018 1 Highlights Q2 Revenue up 5.1% year on year in constant currency Good Ocean volumes, Air picking up after softer Q1 CL growth
Elis 2017 annual results MARCH 7, 2018
 Elis 2017 annual results MARCH 7, 2018 Forward looking statements This document may contain information related to the Group s outlook. Such outlook is based on data, assumptions and estimates that the
Investor Presentation 2016 Results. 23 February 2017
 Investor Presentation 2016 Results 23 February 2017 Forward-looking statements This presentation contains forward-looking statements, including, but not limited to, the statements and expectations contained
Financial results & business update. Quarter and year ended 31 December February 2016
 Financial results & business update Quarter and year ended 31 December 2015 11 February 2016 Disclaimer 3 Any remarks that we may make about future expectations, plans and prospects for the company constitute
Q presentation. 5 February 2015
 Q4 2014 presentation 5 February 2015 Agenda Highlights Financial overview Market outlook Q4 Highlights Strong finish to a record year Revenue of NOK 7 549 million, up 10.3% EBITDA* of NOK 396 million,
Strategic Review ELIOR GROUP Develop, Innovate, Accelerate. September 24, 2015
 Strategic Review 2016-2020 ELIOR GROUP 2020 Develop, Innovate, Accelerate September 24, 2015 EXECUTIVE SUMMARY 2020 STRATEGY: Develop, Innovate, Accelerate 1 2 3 ELIOR A successful growth story Track record
Electrocomponents 2017 half-year financial results. 18 November 2016
 Electrocomponents 2017 half-year financial results 18 November 2016 Agenda Overview of results Lindsley Ruth Financial results and performance update David Egan Performance Improvement Plan Lindsley Ruth
Cover-More Group. UBS Australasia Conference. November 2015
 Cover-More Group UBS Australasia Conference November 2015 Executive summary: FY15 overview Cover-More delivered another year of double digit earnings growth, with offshore business growing substantially.
Q Results Conference Call Speaker Notes. Hello Everyone and Welcome to our third quarter 2017 results conference call.
 1 Q3 2017 Results Conference Call Speaker Notes OG Hello Everyone and Welcome to our third quarter 2017 results conference call. I am Olivier Gernandt, Europcar s Investor Relations Director. In a moment,
2013 Interim Results. 14 August 2013
 2013 Interim Results 14 August 2013 1 This presentation contains statements that are, or may be, forward-looking regarding the group's financial position and results, business strategy, plans and objectives.
EUROPCAR GROUP Q Results
 EUROPCAR GROUP Q1 2018 Results 1 Q1 2018 RESULTS CAROLINE PAROT, Europcar Group CEO LUC PELIGRY, Europcar Group CFO IMPORTANT NOTICE: based on Financial statements prepared under IFRS 2 Important Legal
Q RESULTS BRUSSELS, 23 JULY 2015 WOLFGANG M. NEUMANN, PRESIDENT & CEO KNUT KLEIVEN, DEPUTY PRESIDENT & CFO
 Q2 2015 RESULTS BRUSSELS, 23 JULY 2015 WOLFGANG M. NEUMANN, PRESIDENT & CEO KNUT KLEIVEN, DEPUTY PRESIDENT & CFO Park Inn by Radisson Istanbul Ataturk Airport 1 I Q2-2015 Results Strengthening our position
1H 2018 Results Presentation
 1H 2018 Results Presentation Agenda of the presentation 1. Executive Summary 2. Summary of Eurocash parts (segments) 3. Market overview 4. Eurocash Financials 2 1. Executive summary WHOLESALE - STRONG
EUROPCAR GROUP FULL YEAR 2015 RESULTS. The leading European car rental company at the heart of new mobility solutions.
 EUROPCAR GROUP The leading European car rental company at the heart of new mobility solutions FULL YEAR 2015 RESULTS February 25, 2016 Agenda Our Success and Our Commitments Operating Performance & Financing
Kraft Foods. Deutsche Bank Global Consumer Conference. June 19, 2012
 Kraft Foods Deutsche Bank Global Consumer Conference June 19, 2012 Forward-looking statements This presentation contains a number of forward-looking statements. The words drive, build, focus, manage, aim,
25 October Q Revenues. Gilles Petit, CEO Arnaud Louet, CFO
 Q3 2016 Revenues Gilles Petit, CEO Arnaud Louet, CFO Q3 2016 Revenues FORWARD LOOKING STATEMENTS This presentation contains certain statements that constitute "forward-looking statements", including but
John F. Brock CHAIRMAN & CEO. Nik Jhangiani SVP & CFO
 John F. Brock CHAIRMAN & CEO Nik Jhangiani SVP & CFO Forward-Looking Statements Included in this presentation are forward-looking management comments and other statements that reflect management s current
JOHN F. BROCK CHAIRMAN & CEO NIK JHANGIANI SVP & CFO
 JOHN F. BROCK CHAIRMAN & CEO NIK JHANGIANI SVP & CFO Forward-Looking Statements Included in this presentation are forward-looking management comments and other statements that reflect management s current
FORWARD-LOOKING STATEMENT
 Fourth Quarter Results February 2, 2018 FORWARD-LOOKING STATEMENT This presentation contains statements, including financial projections, that are forwardlooking in nature. These statements are based on
Baird Global Industrial Conference Beth Wozniak, CEO Stacy McMahan, CFO November 6, 2018
 Baird Global Industrial Conference 2018 Beth Wozniak, CEO Stacy McMahan, CFO November 6, 2018 Forward-Looking Statement CAUTION CONCERNING FORWARD-LOOKING STATEMENTS This presentation contains statements
2017 Half-Year Results
 2017 Half-Year Results Martin Earp, CEO Josée Lemoine, CFO 16 August 2017 Financials Pillars of Growth Summary of Performance H1 2017 Sales Revenue $218.2m 1.7% Demographics Deaths 1 2.8% Australia $44.1m
MAISONS DU MONDE: FIRST-HALF 2018 RESULTS
 PRESS RELEASE MAISONS DU MONDE: FIRST-HALF 2018 RESULTS A solid first half in a challenging environment Updated full-year 2018 targets Sales up 11% to 507m including Modani, and up 9.8% at constant scope
Copyright Infor. All Rights Reserved.
 1 Financial Overview August 2013 2 Infor Overview $2.7B total revenue FY13 pro forma $829M adjusted EBITDA FY13 pro forma 301 new products in FY13 3,000+ new customers in FY13 1,745 partners one of the
Financial Overview. July 2014
 Financial Overview July 2014 1 Infor Overview $2.8B total revenue FY14 pro forma $814M adjusted EBITDA FY14 pro forma 211 new products in FY14 3,550 new customers in FY14 2,204 partners one of the world
Press Release Intrum presents 2020 strategy, financial targets and updates on recent continued strong business development
 Stockholm at 07.40 CET 2017-12-07 Press Release Intrum presents 2020 strategy, financial targets and updates on recent continued strong business development At the Capital Markets Day, to be held in Stockholm
Financial Results Q4 & FY 2017
 Financial Results Q4 & FY 2017 Loxam at a glance Europe s #1 equipment rental company. World s #3 powered access player LTM PF Group Revenue LTM PF Group EBITDA 1,435m 479m Divisions Key figures Generalist
Q Results. Adecco Group
 Adecco Group Zurich, Disclaimer and Note on Terminology Forward-looking statements Information in this release may involve guidance, expectations, beliefs, plans, intentions or strategies regarding the
Achieving our goals and. Annual Meeting of Shareholders. poised for growth
 Achieving our goals and poised for growth Conference call for the year and quarter ended December 31, 2016 Forward-Looking Statements (For definitions of capitalized terms, please refer to the Glossary
Selecta Group B.V. and its subsidiaries, Amsterdam (The Netherlands)
") Selecta Group B.V. and its subsidiaries, Amsterdam (The Netherlands) Consolidated financial statements for the year ended 30 September and report of the independent auditor Table of Contents Consolidated
Selecta Group B.V. and its subsidiaries, Amsterdam (The Netherlands) Consolidated financial statements for the year ended 30 September and report of the independent auditor Table of Contents Consolidated
ELECTROCOMPONENTS 2019 half-year financial results
 ELECTROCOMPONENTS 2019 half-year financial results 20 November 2018 SAFE HARBOUR This presentation contains certain statements, statistics and projections that are or may be forward-looking. The accuracy
Financial Overview. January 2015
 Financial Overview January 2015 1 Infor Overview $2.8B total revenue FY14 pro forma $814M adjusted EBITDA FY14 pro forma 211 new products in FY14 3,550 new customers in FY14 2,204 partners one of the world
MAISONS DU MONDE: FULL-YEAR 2018 RESULTS
 PRESS RELEASE MAISONS DU MONDE: FULL-YEAR 2018 RESULTS Strong performance in line with targets Continued solid momentum in online and international sales Focus on strategic pillars to deliver further profitable
Fourth Quarter FY2018 Earnings Presentation
 Fourth Quarter FY2018 Earnings Presentation November 28, 2018 Inspiring people. Nurturing landscapes. Introductory Information This presentation contains forward looking statements that involve substantial
Board of Directors Zurich, 24 March, 2009 Dufry Presentation - Full Year 2009 Results
 Dufry Presentation - Full Year 2009 Results March 2010 1 Legal Disclaimer Information in this presentation may involve guidance, expectations, beliefs, plans, intentions or strategies regarding the future.
Chairman & CEO SVP & CFO
 Chairman & CEO SVP & CFO 1 Included in this presentation are forward-looking management comments and other statements that reflect management s current outlook for future periods. As always, these expectations
Operational performance Financial results Outlook and financial targets Appendix
 INTERIM REPORT 6 MONTHS ENDED 30 JUNE 2009 Operational performance Financial results Outlook and financial targets Appendix Financial Results: 6 months ended 30 June 2009 Page 2 Strong six months result
JOHN F. BROCK / CHAIRMAN & CEO BILL DOUGLAS / EVP & CFO
 JOHN F. BROCK / CHAIRMAN & CEO BILL DOUGLAS / EVP & CFO Forward-Looking Statements INCLUDED IN THIS PRESENTATION ARE FORWARD-LOOKING MANAGEMENT COMMENTS AND OTHER STATEMENTS THAT REFLECT MANAGEMENT S CURRENT
KION Q3 UPDATE CALL Gordon Riske, CEO Thomas Toepfer, CFO Wiesbaden, 14 November 2013
 KION Q3 UPDATE CALL 2013 Gordon Riske, CEO Thomas Toepfer, CFO Wiesbaden, 14 November 2013 AGENDA 1 Highlights 2013 Gordon Riske 2 Financial Update Thomas Toepfer 3 Outlook Gordon Riske 14 November 2013
BAML Conference - Miami
 BAML Conference - Miami Francois Luscan, President & CEO Xavier Leclerc de Hauteclocque, CFO December 3, 2013 Forward Looking Statement This presentation may include forward-looking statements. Forward-looking
Goldman Sachs 2012 Leveraged Finance Healthcare Conference MATTHEW WALSH SVP FINANCE & CFO
 Goldman Sachs 2012 Leveraged Finance Healthcare Conference MATTHEW WALSH SVP FINANCE & CFO 05.01.2012 Forward Looking Statements This presentation contains both historical and forward-looking statements.
Press release 8 March RESULTS
 2011 RESULTS Slight growth in sales, supported by emerging markets Current Operating Income of 2.2bn Net income, Group share, down 14%, impacted by significant one off elements Net debt reduced by more
Quarter ended 30 September Financial results & business update
 Quarter ended 30 September 2014 Financial results & business update 21 October 2014 Disclaimer Any remarks that we may make about future expectations, plans and prospects for the company constitute forward-looking
2007 Revenue and Results. 2007: strong increase in results Strengthened growth momentum. February 15 th, 2008
 2007 Revenue and Results 2007: strong increase in results Strengthened growth momentum February 15 th, 2008 2007 revenue and results Agenda A successful 2007 Be the recognized industry leader John Glen
MORGAN STANLEY GLOBAL CONSUMER & RETAIL CONFERENCE. Cécile Cabanis, CFO. November 14, 2017 I 1 I
 MORGAN STANLEY GLOBAL CONSUMER & RETAIL CONFERENCE November 14, 2017 Cécile Cabanis, CFO I 1 I This document contains certain forward-looking statements concerning Danone. In some cases, you can identify
EUROPCAR GROUP. INVESTOR PRESENTATION JUNE 1 st 2016 THE LEADING EUROPEAN CAR RENTAL COMPANY AT THE HEART OF NEW MOBILITY SOLUTIONS
 EUROPCAR GROUP THE LEADING EUROPEAN CAR RENTAL COMPANY AT THE HEART OF NEW MOBILITY SOLUTIONS INVESTOR PRESENTATION JUNE 1 st 2016 European #1 with global reach in the growing vehicle rental and mobility
3Q 2017 Results Presentation
 3Q 2017 Results Presentation STRATEGIC OUTLOOK Evolution from Wholesale into Retail WHOLESALE + FRANCHISE TESTS IN RETAIL M&A IN RETAIL INTEGRATION STRONG RETAIL BRAND Independent Trade is still growing,
H Results. July 26th 2018
 H1 2018 Results July 26th 2018 FIRST SIGNIFICANT ADVANCES IN THE CARREFOUR 2022 TRANSFORMATION PLAN H1 2018: Strong momentum for Carrefour 2022 OMNICHANNEL RAPIDLY RAMPING-UP Rapid implementation of food
Q Sales January 22 nd 2019
 Q4 20 Sales January 22 nd 2019 Highlights Solid sales growth in Q4 and FY 20: +1.9% LFL in Q4 and +1.4% in FY Group sales up +1.9% LFL vs +1.1% over first 9 months Food e-commerce sales up by more than
Financial Overview. July Copyright Infor. All Rights Reserved.
 Financial Overview July 2015 Copyright 2015. Infor. All Rights Reserved. www.infor.com 1 Infor Overview $2.8B total revenue FY15 LTM* pro forma $786M adjusted EBITDA FY15 LTM* pro forma 13,000 employees
Nilfisk Q3 Interim Report 2018 Webcast presentation November 14, 2018
 Nilfisk Q3 Interim Report 2018 Webcast presentation November 14, 2018 Agenda 1 2 3 4 5 Highlights Business unit update Simplifications initiatives Financials Outlook 2018 6 Q&A 2 Q3 2018 results Financial
FULL YEAR 2011 RESULTS
 FULL YEAR 2011 RESULTS February 28 th 2012 1 28 February 2011 This document does not constitute a purchase, sales or exchange offer, nor is it an invitation to draw up a purchase, sales or exchange offer,
NKT I Annual Report 2014 I Webcast. 27 February 2015 I 1 NKT. Annual Report Webcast, 27 February 2015, 10:00 CET
 27 February 2015 I 1 NKT Annual Report 2014 Webcast, 27 February 2015, 10:00 CET 27 February 2015 I 2 Forward looking statements This presentation and related comments contain forward-looking statements.
Pentair KeyBanc Capital Markets Industrial, Automotive & Transportation Conference
 Pentair KeyBanc Capital Markets Industrial, Automotive & Transportation Conference John L. Stauch Chief Financial Officer May30, 2013 PENTAIR FORWARD-LOOKING STATEMENTS CAUTION CONCERNING FORWARD-LOOKING
Britvic plc Interim Results 2018
 Britvic plc Interim Results 2018 CEO SIMON LITHERLAND DELIVERING ON OUR STRATEGIC PRIORITIES AND VISION 2 OUR STRATEGY IS DELIVERING CONSISTENT RETURNS FOR SHAREHOLDERS GENERATE PROFITABLE GROWTH IN OUR
COMPANY PRESENTATION NOVEMBER
 COMPANY PRESENTATION NOVEMBER 2018 DISCLAIMER This presentation includes or may include representations or estimations concerning the future about intentions, expectations or forecasts of VIDRALA or its
FIRST-HALF 2018 RESULTS 30 JULY 2018
 FIRST-HALF 2018 RESULTS 30 JULY 2018 Disclaimer FORWARD LOOKING STATEMENTS This presentation contains certain statements that constitute "forward-looking statements", including but not limited to statements
Financial results & business update. Quarter and year ended 31 December February 2017
 Financial results & business update Quarter and year ended 31 December 2016 14 February 2017 Disclaimer 3 Any remarks that we may make about future expectations, plans and prospects for the company constitute
The Food Travel Experts.
 The Food Travel Experts www.foodtravelexperts.com Presentation structure 1. Group highlights Kate Swann 2. Financial review Jonathan Davies 3. Business review Kate Swann 4. Q&A All 2 Group highlights Good
CEVA Logistics AG Investor Call Third Quarter/First 9 Months November CEVA Logistics AG Q3 2018
 CEVA Logistics AG Investor Call Third Quarter/First 9 Months 2018 13 November 2018 1 Highlights Third Quarter of 2018 Revenue up 4.7% year on year in constant currency FM growth +6.8% in constant currency,
For personal use only
 Affinity Education Group (ASX:AFJ) Morgans Conference 10 October 2014 Disclaimer This presentation contains general information in summary form which is current as at 10 October 2014. It presents financial
Hill-Rom Fourth Quarter 2016 Financial Results. November 3, 2016
 Hill-Rom Fourth Quarter 2016 Financial Results November 3, 2016 Forward Looking Statements Certain statements in this presentation contain forward-looking statements, within the meaning of the Private
KION UPDATE CALL Q Gordon Riske, CEO Thomas Toepfer, CFO Wiesbaden, 7 May 2015
 KION UPDATE CALL 2015 Gordon Riske, CEO Thomas Toepfer, CFO Wiesbaden, 7 May 2015 AGENDA 1 Highlights Gordon Riske 2 Market update Gordon Riske 3 Financial update Thomas Toepfer 4 Outlook Gordon Riske
FLAT +3.8% YEAR-END REPORT JANUARY DECEMBER 2017 STRONG Q4 PUTS 2017 CASH FLOW WELL ABOVE EXPECTATIONS JOHAN DENNELIND PRESIDENT & CEO 2.
 YEAR-END REPORT JANUARY DECEMBER 2017 JOHAN DENNELIND PRESIDENT & CEO Q4 STRONG Q4 PUTS 2017 CASH FLOW WELL ABOVE EXPECTATIONS We said: cash flow above SEK 7.5 billion WE DID 9.7bn +0.8bn Q4 (+0.8bn Q4)
CAGNY Conference. February 22, 2018
 CAGNY Conference February 22, 2018 Disclaimer This presentation has been prepared and issued by Nomad Foods Limited (the "Company"). This Presentation has been provided solely for information and background.
Integrated Dental Holdings. Q4 FY2017 Year-end and Quarterly Results - Investor presentation 1 June 2017
 Integrated Dental Holdings Q4 FY2017 Year-end and Quarterly Results - Investor presentation 1 June 2017 DISCLAIMER THIS PRESENTATION IS NOT AN OFFER OR SOLICITATION OF AN OFFER TO BUY OR SELL SECURITIES
2017 Full Year Results
 2017 Full Year Results Title of the presentation 2 lines Location, Date, Author Paris February 15 th, 2018 Disclaimer This presentation may contain forward-looking statements, Such statements may include
2012 Annual Results Stanislas de Bentzmann Co-CEO
 2012 Annual Results Stanislas de Bentzmann Co-CEO C O N N E C T I N G B U S I N E S S & T E C H N O L O G Y Disclaimers This presentation contains forward-looking statements that involve risks and uncertainties
Nilfisk Financial Results 2017 Webcast presentation - February 28
 Webcast presentation - February 28 Today s presenters Nilfisk CEO Hans Henrik Lund Nilfisk CFO Karina Deacon Page 2 Agenda 1 2 3 4 5 6 Highlights Business unit update Financials Nilfisk Next Outlook 2018
Roadshow presentation 9-Month Key Sales Figures July 2016
 Roadshow presentation 9-Month Key Sales Figures 2015-16 Agenda BC at a glance Highlights 9 months 2015/16 Strategy & Outlook Page 2 BC at a glance Who we are? The heart and engine of the chocolate industry
Q4 and Full-Year 2013 Results
 Q4 and Full-Year 2013 Results Wolfgang M. Neumann, President & CEO Knut Kleiven, Deputy President & CFO February 7, Amsterdam / Radisson Blu Hotel Amsterdam, Netherlands An expanding portfolio in the Netherlands
ZEBRA TECHNOLOGIES FIRST QUARTER 2016 RESULTS May 10, 2016
 ZEBRA TECHNOLOGIES FIRST QUARTER 2016 RESULTS May 10, 2016 Anders Gustafsson Chief Executive Officer Mike Smiley Chief Financial Officer 2 Safe Harbor Statement Statements made in this presentation which
Part 1 Executing our strategy
 Entwurf 19.09.018 15h00 Part 1 Executing our strategy Klaus Rosenfeld Chief Executive Officer Capital Markets Day 018 Berlin Disclaimer This presentation contains forward-looking statements. The words
2015 full-year results
 2015 full-year results Contents 1. 2015: A successful turnaround 2. 2015 full-year results 3. 2016: On the road to profitable growth 2 12015: A successful turnaround A new name for the Group: Marie Brizard
June Dear Fellow Takeda Shareholder,
 June 2018 Dear Fellow Takeda Shareholder, Since joining Takeda in April 2014, my mission has been to continue the transformation of Takeda in order to ensure that Takeda will be a successful company in
Financial Overview. Leslie Varon
 Financial Overview Leslie Varon Xerox Investment Proposition Global Market Leader Attractive Market Opportunities Disciplined Operator Strong Annuity- Driven Cash Flow Sustainable Shareholder Returns Strong
Finansforeningens Virksomhedsdag 2015 ISS. Heine Dalsgaard, CFO June 2015
 Finansforeningens Virksomhedsdag 2015 ISS Heine Dalsgaard, CFO June 2015 1 Forward-looking statements This presentation contains forward-looking statements, including, but not limited to, the statements
2017 Full Year. Results Presentation. 21 February 2018
 2017 Full Year Results Presentation 21 February 2018 CAUTIONARY STATEMENT 2017 Full Year Results Slide 2 Full Year Highlights 2017 Full Year Results Presentation 8TH YEAR OF DOUBLE-DIGIT GROWTH 2017 FINANCIAL
1Q19 FINANCIAL RESULTS. November 7, 2018
 1Q19 FINANCIAL RESULTS November 7, 2018 1Q19 FINANCIAL HIGHLIGHTS A CHALLENGING QUARTER REFLECTING IMPACT OF DISRUPTION ~2,137 $1,150M (+150M) -90 1Q19 Net Revenue LFL (7.7%), or ~(2.5%) when excluding
Schaeffler Group Mobility for tomorrow Klaus Rosenfeld Chief Executive Officer
 Schaeffler Group Mobility for tomorrow Klaus Rosenfeld Chief Executive Officer Capital Markets Day July 20 th, 2016 London Agenda 1 Overview 2 Our Strategy 3 Our Action Plan 4 Our Financial Ambitions 5
Makes it easier to be professional
 Makes it easier to be professional Handelsbanken Nordic Mid/small Cap Seminar June 8, 2017 President and CEO Johan Nilsson 2 2 Introduction One-Stop-Shop multi channel offering for professionals Branches
SECOND QUARTER July 21, 2016 Tele2 AB
 SECOND QUARTER 2016 July 21, 2016 Tele2 AB Delivering on our long term strategy Value Champion Focused Technology Choices Step-Change Productivity Winning People & Culture Sweden Consumer Postpaid and
CABOT CREDIT MANAGEMENT Financial Results. For the nine months ended 30 September 2018
 CABOT CREDIT MANAGEMENT Financial Results For the nine months ended 30 September 2018 8 November 2018 DISCLAIMER This presentation has been prepared by Cabot Credit Management ( the Company ) solely for
PRESENTATION OF 2017 ANNUAL RESULTS
 PRESENTATION OF 2017 ANNUAL RESULTS Paris, 19 February 2018 Delivering Transformation. Together. DISCLAIMER This presentation contains forward-looking information subject to certain risks and uncertainties
H Financial Results
 H1 2016 Financial Results Gilles Petit, CEO Arnaud Louet, CFO H1 2016 Financial Results FORWARD LOOKING STATEMENTS This presentation does not constitute an offer to sell securities in the United States
Second Quarter 2017 Results. August 9, 2017
 1 Second Quarter 2017 Results August 9, 2017 Q2 Highlights Dick Boer President and CEO Highlights second quarter 2017 3 Improved pro forma sales performance, up 3.4% (+1.8% at constant exchange rates)