H Results. July 26th 2018
|
|
|
- Dominick Watson
- 5 years ago
- Views:
Transcription


1 H Results July 26th 2018
2 FIRST SIGNIFICANT ADVANCES IN THE CARREFOUR 2022 TRANSFORMATION PLAN
3 H1 2018: Strong momentum for Carrefour 2022 OMNICHANNEL RAPIDLY RAMPING-UP Rapid implementation of food e-commerce proposition in all countries: Renewed and simplified front websites (1 single site per country) Order preparation optimized and industrialized Extension of delivery services Acceleration of e-commerce sales growth in H1 REVAMPED COMMERCIAL PROPOSITION Adaptation of the sales area/store formats Simplification of assortment Investments in price competitiveness Rapid expansion of growth formats: 15 Cash & Carry and 180 convenience store openings A LEANER AND MORE EFFICIENT ORGANIZATION All restructuring processes signed and being implemented 520m in cost-reduction achieved in H1 Capex and inventories optimized PARTNERSHIPS WITH STRATEGIC PLAYERS Strategic partnerships signed with recognized leaders: Purchasing with Tesco/Système U/Fnac Darty Digital with Google/Tencent/Sapient IMPROVED FINANCIALS Net sales up +0.7% LFL Recurring Operating Income up +5.8% at constant FX (1) Free Cash Flow ex exceptionals up + 418m Net debt improved by + 1.5bn (1) Vs. reported H H RESULTS 3
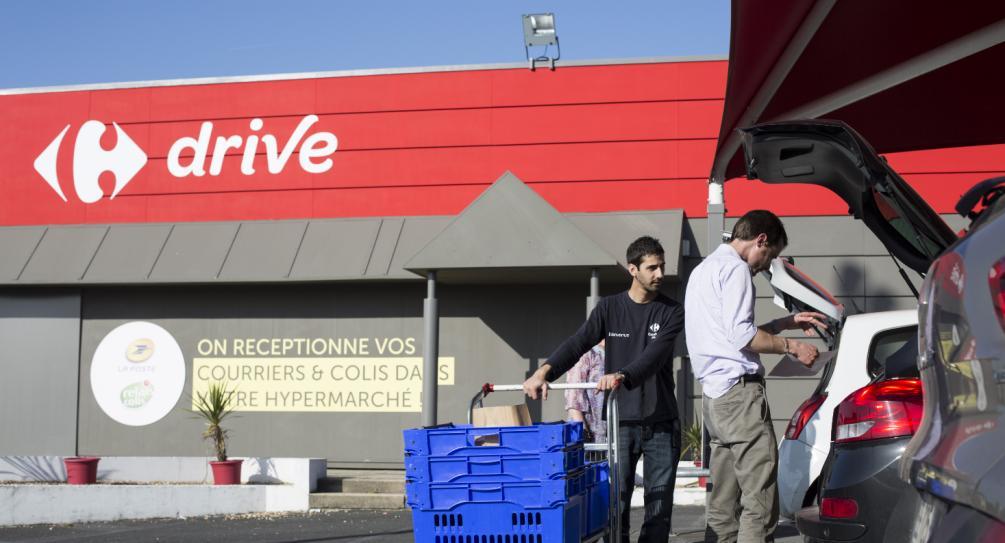
4 Rapid implementation of leading e-commerce services in all countries Key initiatives to enhance Carrefour s e-commerce proposition ORDER Single Carrefour entry point already available in 7 countries carrefour.fr live in Q as planned Non-food marketplace already available in 5 countries PREPARE Dedicated online order preparation warehouse/dark stores opened or under construction in most countries Aulnay PPC 1 in Paris region opened in April Hybrid solutions rolled out in Spain and Italy DELIVER Home delivery now available in 9 countries, service extended to new cities in H1 Express 1-hour delivery now available in 6 countries, service extended to new cities in H1 Click & Collect offered in 8 countries More than 130 new Drive openings in H1, of which 13 pedestrian Fresh/food lockers tested O2O growing rapidly in China, offering ready-to-eat solutions on leading local mobile applications Acceleration of food e-commerce sales growth in H1 2018: +30% 1) PPC: Plateforme de Préparation de Commandes (Dedicated online order preparation platform) H RESULTS 4
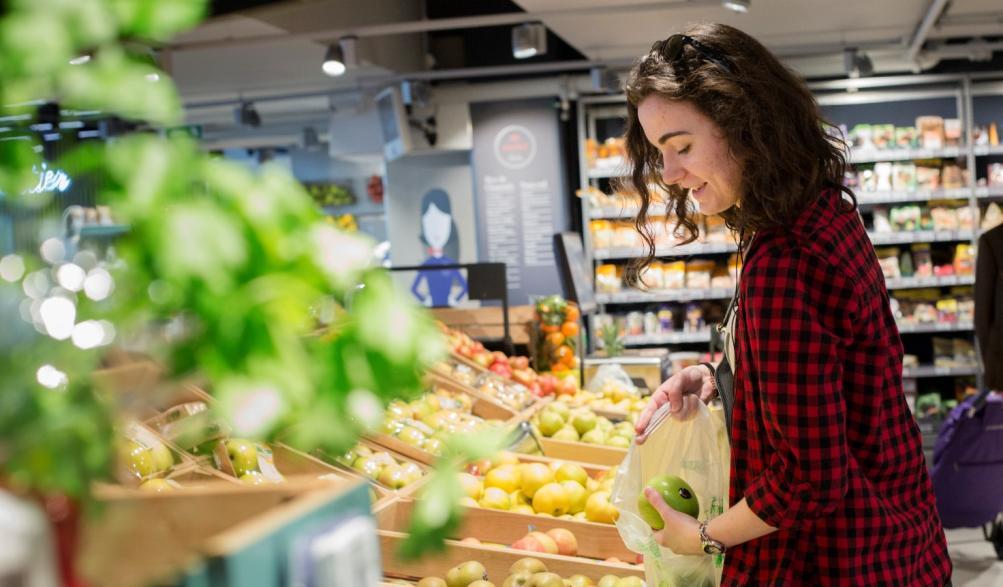
5 In-depth reshaping of commercial proposition on track in H1 PRICE COMPETITIVENESS First investments in price competitiveness implemented in H1 OPTIMISATION OF STORE NETWORKS Commercial proposition reshaping Hypermarkets: Sales area reduction underway Transfers of hypermarkets to supermarkets or C&C (eg. Belgium, Italy, LatAm) Transfer to lease management REVAMPING OF ASSORTMENTS Optimization of assortment by reducing number of SKUs (down 4% in France at end of June) Fostering innovation by nourishing privileged relationships with selected suppliers Acceleration of expansion in Cash & Carry and convenience Closure of loss-making stores Promoting a responsible product offering: Commitments in favor of local producers and elimination of controversial components, roll out of blockchain technology, increased organic offer CUSTOMER-ORIENTED SERVICES Easier and faster payments with Carrefour Pay Omnichannel and delivery services Easier access to consumer credit eg. Atacadao card Focus on customer satisfaction (NPS) H RESULTS 5


6 Key strategic partnerships signed Strategic partnerships were signed in H1 First benefits expected in H2 2018, with ramp-up in 2019 PURCHASING DIGITAL ADD-ON INVESTMENTS H RESULTS 6
7 All components of the efficiency plan are on track EFFICIENCY PLAN Organization transformation Cost savings Capex Inventory STATUS H1 ACHIEVEMENTS All plans signed Implementation in progress 520m -39% - 175m H RESULTS 7
8 H key figures: Growth in ROI and strong growth of free cash flow NET SALES +0.7% LFL RECURRING OPERATING INCOME + 36m (1) +5.8% (1) FREE CASH FLOW EX. EXCEPTIONAL ITEMS growing by + 418m NET DEBT (2) improving by 1,465m 1) At constant FX vs. reported H l 2) As of 30 June 2018 vs. 30 June 2017 H RESULTS 8
9 FINANCIAL ANALYSIS
10 Ex-Dia stores acccounted for as discontinued activities as from January 1 st Rapid progress in the disposal and closure process of 273 ex-dia stores All stores sold or closed at end July 2018 Ex-Dia stores accounted for as discontinued activities as from January 1 st (IFRS 5 standard) Rapid implementation of plan January 23 rd April July Announcement of the plan to exit 273 ex-dia stores from Group scope Agreement with the unions Start of the search for buyers Completion of the process: All stores sold or closed (info) Deconsolidation of the stores ow. 244 closures and 29 disposals H RESULTS 10
11 H sales marked by improved trends in Q2 H Gross sales evolution (in m and %) +1.1% +0.7% +0.4% +0.1% +0.3% +0.7% +2.2% -3.0% 42.7 bn +0.4% +0.9% -5.2% 41.4 bn Q1 Q2 H H Store H LFL openings/ organic ex petrol closures ex petrol ex calendar ex calendar Calendar Acquisitions/ Petrol H Disposals at constant fx rates Forex H at current fx rates H RESULTS 11
12 Negative FX impact, mainly due to BRL evolution Currency H evolution 1 Brazilian Real -16.9% Argentine Peso -34.3% -5.2% negative FX impact in H sales Polish Zloty +1.2% Romanian Leu -2.5% Chinese Yuan -3.5% Taiwanese Dollar -7.1% - 60m negative FX impact in H ROI (1) FX evolution vs. H H RESULTS 12
13 H1 ROI growing + 36m (at constant exchange rates) Gross margin decrease due to mix effect, market competitiveness and commercial investments Distribution costs down -70bps Improvement in all geographies Cost reduction plan delivering strong performance in H1 H reported H Evolution at constant FX ( m / %) Net sales (in bn) % LFL Gross margin from recurring operations as a % of net sales 22.9% 22.2% -70bps Total distribution costs (1) (7,419) (6,884) 138m As a % of net sales -19.3% -18.6% -70bps Recurring operating income (ROI) ( mn) m / +5.8% As a % of net sales 1.6% 1.6% stable (1) Total distribution costs are composed of sales, general and administrative expenses H RESULTS 13
14 Ahead of schedule on cost reductions: 520m achieved in H1 COGS Distribution costs Objective STATUS 2bn H1 ACHIEVEMENTS > First gains recorded in H1 > Purchasing alliances signed with Tesco internationally, Système U in France, PAM/VéGé in Italy > Strong contribution to total cost reduction in H1 thanks to: Demand control/challenge Process redesign Productivity gains Systematic renegotiations 520m NEXT STEPS > Acceleration of savings to come in 2019 thanks to purchasing alliances > Streamlining actions to continue > Savings from reorganizations from H2 onwards H FY 2020 Objective confirmed: 2bn cost savings by 2020 H RESULTS 14
15 France: Commercial activity still under pressure (in m) H % reported H change Net sales 17,307 17, % LFL ex petrol, ex calendar -0.1% ROI % ROI margin 1.2% 0.6% -60bp > Broadly stable sales year-on-year in a persistently competitive market > ROI drop: Pressure on gross margin (negative mix effect, competitive markets and investments in price competitiveness) Positive momentum in cost reduction and transformation of organization, with effects ramping up in H2 and 2019 H RESULTS 15
16 Other European countries: Slight growth in recurring operating income (in m) H H % change at current FX % change at constant FX Net sales 10,010 10, % +1.0% LFL ex petrol, ex calendar -1.5% ROI % +2.2% ROI margin 1.5% 1.5% 0bp > Overall sales growth, contrasted trends between growth in Northern Europe and slight drop in Southern Europe > Slight improvement in ROI thanks to positive cost reduction momentum H RESULTS 16
17 Latin America: Strong commercial momentum and improved profitability (in m) H H % change at current FX % change at constant FX Net sales 8,075 6, % +8.6% LFL ex petrol, ex calendar +6.4% ROI % +28.0% ROI margin 3.6% 4.6% +90bp +60bp > Brazil: Atacadao: LFL sales acceleration, margin growth and expansion on track Retail: Solid performance despite a combination of deflation and mix effects Banking activities: Strong profitability growth on higher billings and lower risk charges > Argentina: Higher sales volumes, turnaround plan underway > Solid growth in ROI and 60bp improvement in margin at constant FX H RESULTS 17
18 Latin America: Interruption in food deflation in June FOOD INFLATION (IPCA) FOOD AT HOME INDEX EVOLUTION (JAN 2017 JUNE 2018) 6.5% 4.6% 4.3% 1.0% 3.0% 2.5% 1.1% 0.1% -4.0% -2.8% -0.6% -4.5% -4.5% -3.9% -3.8% -4.3% -4.7% -3.8% -3.1% -5.2% -5.3% -5.1% -5.3% -4.9% Jan Feb Mar Apr May Jun Jul Aug Sep Oct Nov Dec Source : IBGE H RESULTS 18
19 Asia: Recurring operating income improvement despite difficult commercial trends in China (in m) H H % change at current FX % change at constant FX Net sales 3,135 2, % -4.3% LFL ex petrol, ex calendar -3.9% ROI mn + 22mn ROI margin 0.4% 1.1% +70bp > China sales impacted by continued e-commerce rise, good momentum in Taiwan > Significant profitability improvement thanks to cost reduction and loss-making store closures H RESULTS 19
20 Adjusted net income, Group share, from continuing operations of 131mn (in m) H reported H Recurring operating income Net income from associates and JVs 13 (6) Non-recurring income and expenses, net (150) (785) EBIT 484 (194) Net financial expenses (247) (149) Income before taxes 236 (342) Income tax expense (89) (179) Normative tax rate 34.4% 34.7% Net income from discontinued operations (1) (229) Consolidated Net income 147 (750) Mainly related to Carrefour 2022 transformation initiatives launched in H1 98mn improvement in net financial expenses due to improved refinancing terms and deleveraging Normative tax rate reflecting footprint and country weighting Including principally the 273 ex-dia stores exiting the Group s scope Net income, Group share 78 (861) Net income from continuing operations, Group share 79 (633) Minority interests Adjusted net income, Group share from continuing operations H RESULTS 20
21 All restructuring processes are well underway Key Initiatives Status Next steps Savings recognition phasing HQ France Voluntary departure plan Signed Implementation underway Full completion expected by year end > Starting in H > Full-year effect in 2019 DIA 273 ex-dia stores to be removed from Group scope Signed Disposals/closures completed by end of July 2018 > Ex-Dia scope discontinued from January 1 st Belgium Voluntary departure plan c.950 FTE Conversion of 5 hypermarkets to supermarkets Flexibility measures in hypers Signed Hypermarkets to be converted in Q4 Voluntary departure plan to be fully completed in Q > Mostly in 2019 Argentina Crisis prevention plan 11 store closures Voluntary departure plan: c.750 FTE Signed 6 stores to close in H Implementation of voluntary departure plan to be finalized in Q4 > Starting in H > Full-year effect in 2019 H RESULTS 21
22 Most retructuring costs accounted for in H1 related cash-out mostly in H2 (in m) H reported H Restructuring costs (102) (693) Impairment and asset write-offs (31) (44) Other non-current items (17) (48) Related to the transformation initiatives announced in H1, notably in France, Belgium and Argentina Non-recurring expense related to the ex-dia network and included in the Net income from discontinued activities amounts to (183)m Non-recurring income and expenses, net (150) (785) Restructuring expenses linked to H1 announcements were recorded in H Cash-out is expected mainly in H and the balance in 2019 H RESULTS 22
23 A tax expense reflecting a normative half-year tax rate of 34.7% (in m) H Reported H Half-year normative tax rate (1) 34.2% 34.7% Normative tax expense (132) (154) Non income-based taxes (incl. CVAE (2) ) (28) (28) Others (3) 71 3 Total tax expense (89) (179) Effective tax rate 37.5% (52.2)% The +0.5 pts increase mainly reflects a greater weight of Brazil in Group pretax income in H vs H Mainly reflects the recognition of tax assets in H High level of non-current expenses in pre-tax income implies a negative and non-meaningful effective tax rate (1) Half-year Normative tax rate: Reflects Carrefour s geographic footprint and the relative weighting of each country Calculation based on local corporate income tax rate applied to pre-tax income excluding non-current items Full-year normative tax rate was 31.9% in 2017 (2) CVAE: Local business tax in France assessed on the basis of the value-added generated by the business, recorded as corporate income tax H RESULTS 23
24 Focus on Free Cash Flow generation: + 418m (excl. exceptional items) (in m) H reported H Variation at current FX EBITDA 1,431 1,373 (58) Financial result (58) (37) 21 Cash impact of non-recurring items (126) (193) (67) Other (including tax paid) (268) (195) 73 Gross cash flow (excl. discontinued) (31) Change in working capital (2,518) (2,365) 153 Discontinued activities (3) (6) (4) Operating cash flow (1,541) (1,423) 118 Capital expenditure (ex. Cargo) (904) (555) 349 Net capital expenditure (Cargo) (85) (38) 47 Change in net payables to fixed asset suppliers (262) (274) (12) Asset disposals (business-related) Discontinued activities 0 (3) (3) Free cash flow (2,736) (2,219) 517 Incl. Impact of Cargo (85) (38) 47 Incl. Impact of exceptional items and discontinued (64) (12) 52 Free cash flow from continuing operations, exl. exceptionnal items (2,587) (2,169) Working capital improvement mainly coming from reduction of inventories 2. Capex ex-cargo down to 555m thanks to continuous productivity improvements and more selectivity on investments H RESULTS 24
25 1 Better inventory management in most geographies INVENTORY - (in m) - 175m Key levers Assortment rationalization and better management of inventories Inclusion of FCF objectives in managers incentive schemes Supply chain: Optimization of flows H reported H constant FX Forex H current FX H RESULTS 25
26 2 Capex reduced by 39% thanks to greater productivity and selectivity of investments INCREASED SELECTIVITY & PRODUCTIVITY H capex ex. Cargo down 349m or 39% at current FX 904m Full remodelings and hypermarket extensions Cost per unit Standardization Return on capital employed Capex reduction through better productivity and selectivity Standardization efforts underway 555m ALLOCATION ALIGNED WITH STRATEGIC PRIORITIES IT & Omnichannel to support digital ambition 2nd PPC launched in April to supply the Paris region H reported H Expansion in Cash & Carry and convenience stores Commercial proposition to optimize the store network Opening of more than 130 Drives at Group level Investments in growth formats: 15 C&C and 180 openings of convenience stores Objective confirmed: 2bn of capex in 2018 H RESULTS 26
27 427mn net debt improvement in last 12 months excluding FX impact and Brazil IPO proceeds 427m improvement Incl. a 345m cash out related to exceptional items (mainly restructuring) 7,720m 7,293m (239) (246) (107) (283) ,255m June Net Debt H RESULTS 27 FCF Dividends Cost of net financial debt (1) June Net Debt before FX impact and Brazil IPO proceeds Others June (1) Net Debt FX impact Brazil IPO June Net Debt
28 Successful refinancing operations conducted in H1 5.25% DEBT REDEMPTION SCHEDULE (in m and %) 4.00% 3.88% 1.75% 1.75% 1.25% 0.49% 0.51% On March 27, 2018, issuance of $500 million non-dilutive cash-settled convertible Bond, swapped in euros with a maturity of 6 years and a zero coupon 1,179 On June 5, 2018, oversubscribed issuance of 500 million bonds with a maturity of 5 years 1,000 1,000 1,000 1, * 750 At end June 2018, debt maturity stood at 3.7 years * 750 Credit Rating as of June 30, 2018: BBB + negative outlook (S&P) Baa1 stable outlook (Moody s) issuance Average annual coupon The Group has 3.9bn credit facilities available, of which 2.5bn maturing in 2022 and 1.4bn in 2023 * The $500m Convertible Bonds of 2023 and 2024 are here converted using the /$ exchange rate of June 30, 2018 H RESULTS 28
29 57% take-up of scrip dividend PAYMENT AND SETTLEMENT ON JULY 13, 2018 (H2) DIVIDEND PAID IN CASH DIVIDEND PAID IN SHARES 152m CASH-OUT IN H2 57% TAKE-UP RATIO equivalent to 200m Total dividend: 352m H RESULTS 29
30 Transformation plan targets confirmed > 5bn of food e-commerce sales in 2022 > 5bn in sales of organic products in 2022 > A cost reduction plan of 2bn by 2020 on full-year basis > Disposal of non-strategic assets for 500m by 2020 > Annual capex of 2bn Carrefour 2022 transformation plan progressing rapidly, targets confirmed H RESULTS 30
31 APPENDIX
32 ADJUSTED NET INCOME, GROUP SHARE (in m) H reported H (in m) H reported H EBITDA (1) 1,431 1,373 Recurring operating income Net income from associates and JVs 13-6 Non-recurring income EBIT Net financial expenses Net interest expense Net income from continuing operations Minority share of net income from continuing operations Net income from continuing operations, Group share Net income from discontinued operations, Group share Other net financial expenses Income before taxes Income tax expense Net income, Group share Adjusted net income, Group share (1) Recurring operating income before depreciation and amortization (including supply chain depreciation) H RESULTS 32
33 H INCOME STATEMENT (in m) H reported H Net sales 38,526 37,071 Net sales, net of loyalty program costs 38,228 36,728 Other revenue 1,354 1,309 Total revenue 39,582 38,037 Cost of good sold -30,762-29,816 Gross margin from recurring operations 8,821 8,221 SG&A -7,419-6,884 Recurring operating income before D&A (EBITDA) (1) 1,431 1,373 Depreciation and amortization Recurring operating income (ROI) Recurring operating income (ROI) including income from associates and joint ventures Non recurring income and expenses EBIT Financial expense Income tax expense Minority interests Net income from continuing operations, Group share Net income from discontinued operations, Group share Net income, Group share Adjusted net income, Group share (1) Tax impact of restated items (from non-recurring income and expenses and financial expenses) and non-recurring tax items H RESULTS 33
34 Net sales and recurring operating income per region NET SALES RECURRING OPERATING INCOME (in m) H reported H Variation at constant exch. rates Variation at current exch. rates H reported H Variation at constant exch. rates Variation at current exch. rates France 17,307 17, % -0.9% % -44.8% Other European countries 10,010 10, % +0.8% % +1.9% Latin America 8,075 6, % -13.6% % +8.8% Asia 3,135 2, % -9.0% % % International 21,219 19, % -6.1% % +10.6% Global functions % -52.4% TOTAL 38,526 37, % -3.8% % -3.8% H RESULTS 34
35 ADJUSTED NET INCOME, GROUP SHARE (in m) H reported H Net income from continuing operations, Group share 78 (861) Restatement for non-recurring income and expenses (before tax) Restatement for exceptional items in net financial expenses 17 6 Tax impact (1) (84) (19) Restatement on share of income from minorities and companies consolidated by the equity method (7) (8) Restatement for discontinued operations Adjusted net income, Group share (1) Tax impact of restated items (from non-recurring income and expenses and financial expenses) and non-recurring tax items H RESULTS 35
36 EARNINGS PER SHARE ( per share) H reported H Net income from continuing operations 0.11 (0.83) Net income from discontinued operations (0.00) (0.30) Net income, Group share 0.10 (1.13) Adjusted net income, Group share Weighted average number of shares pre-dilution (in millions) (1) (1) Non significant dilutive impact H RESULTS 36
37 STORES UNDER BANNERS 1 AT END H (#) Hypermarkets Supermarkets Convenience Cash & Carry Total France 248 1,059 3, ,390 Spain ,010 Italy ,077 Belgium Poland Romania Others Other European countries 455 1,749 2, ,656 Argentina Brazil Latin America ,021 China Taiwan Others Asia Others (2) Total 1,377 3,255 6, ,947 H RESULTS 37
38 H GROSS SALES Gross sales (in m) Change at current exch. rates inc. petrol Change at constant exch. rates inc. petrol LFL ex. petrol ex. calendar Organic growth ex. petrol ex. calendar France 19, % +0.9% -0.1% -1.1% Hypermarkets 9, % -0.1% -1.6% -2.2% Supermarkets 6, % +0.9% +0.8% -1.0% Others, inc. convenience 2, % +4.6% +2.6% +2.3% International 22, % +3.2% +1.2% +2.6% Other European countries 11, % +0.7% -1.5% -0.7% Spain 4, % +2.2% -1.8% -1.0% Italy 2, % -3.0% -3.6% -3.5% Belgium 2, % -2.2% -2.0% -2.2% Poland 1, % +2.8% +0.8% +2.9% Romania % +8.7% +5.3% +8.1% Latin America 7, % +9.3% +6.4% +9.5% Brazil 6, % +5.8% +1.9% +5.7% Argentina 1, % +24.6% +24.7% +24.7% Asia 3, % -4.6% -3.9% -4.5% China 2, % -8.0% -6.4% -7.8% Taiwan % +3.7% +2.2% +3.7% Group total 41, % +2.2% +0.7% +1.1% H RESULTS 38
39 Q GROSS SALES Gross sales (in m) Change at current exch. rates inc. petrol Change at constant exch. rates inc. petrol LFL ex. petrol ex. calendar Organic growth ex. petrol ex. calendar France 9, % +0.9% -0.1% -0.9% Hypermarkets 5, % +0.2% -1.0% -1.4% Supermarkets 3, % +0.4% +0.1% -1.5% Others, inc. convenience 1, % +4.5% +2.2% +2.0% International 10, % +2.5% +1.7% +3.1% Other European countries 5, % -1.3% -2.2% -1.5% Spain 2, % +0.2% -2.9% -2.2% Italy 1, % -5.0% -3.9% -3.8% Belgium 1, % -3.9% -2.3% -3.2% Poland % +0.1% +2.3% +4.5% Romania % +7.0% +3.1% +6.0% Latin America 3, % +9.6% +8.4% +11.5% Brazil 3, % +5.5% +3.4% +7.3% Argentina % +26.8% +28.0% +27.9% Asia 1, % -4.7% -4.2% -4.7% China % -8.0% -6.5% -8.0% Taiwan % +2.8% +1.0% +2.7% Group total 20, % +1.8% +0.9% +1.4% H RESULTS 39
40 DISCLAIMER This presentation contains both historical and forward-looking statements. These forward-looking statements are based on Carrefour management's current views and assumptions. Such statements are not guarantees of future performance of the Group. Actual results or performances may differ materially from those in such forward-looking statements as a result of a number of risks and uncertainties, including but not limited to the risks described in the documents filed with the Autorité des Marchés Financiers as part of the regulated information disclosure requirements and available on Carrefour's website ( and in particular the Annual Report (Document de Référence). These documents are also available in the English language on the company's website. Investors may obtain a copy of these documents from Carrefour free of charge. Carrefour does not assume any obligation to update or revise any of these forward-looking statements in the future.
2017 FULL YEAR RESULTS. February 28,
 2017 FULL YEAR RESULTS February 28, 2018 1 Disclaimer This presentation contains both historical and forward-looking statements. These forward-looking statements are based on Carrefour management's current
H FINANCIAL RESULTS. August 30,
 August 30, 2017 1 Disclaimer This presentation contains both historical and forward-looking statements. These forward-looking statements are based on Carrefour management's current views and assumptions.
Q Sales January 22 nd 2019
 Q4 20 Sales January 22 nd 2019 Highlights Solid sales growth in Q4 and FY 20: +1.9% LFL in Q4 and +1.4% in FY Group sales up +1.9% LFL vs +1.1% over first 9 months Food e-commerce sales up by more than
Press release July 26, 2018
 POSITIVE FIRST-HALF 2018 RESULTS Growth in recurring operating income and strong cash flow generation Rapid implementation of the transformation plan, targets confirmed Like-for-like sales up 0.7% in first-half
FIRST-HALF 2016 KEY FIGURES
 FIRST-HALF 2016 KEY FIGURES (in m) H1 2015 H1 2016 (1) Variation at constant exch. rates Variation at current exch. rates Net sales 37,739 36,289 +2.2% -3.8% Net sales excluding petrol 34,337 33,243 +3.2%
FINANCIAL RESULTS PIERRE-JEAN SIVIGNON
 FINANCIAL RESULTS PIERRE-JEAN SIVIGNON 2 FURTHER PROFIT GROWTH IN FIRST-HALF 2015 (in m) H1 2014 (1) H1 2015 (2) Variation at constant exch. rates Variation at current exch. rates Net sales 35,870 37,739
2018 FULL-YEAR RESULTS. Upwards revision of several targets of the Carrefour 2022 plan
 FULL-YEAR RESULTS Powerful transformation dynamic launched in Upwards revision of several targets of the Carrefour 2022 plan Satisfactory results, in line with the plan: o Group sales up 1.4% on a like-for-like
Press release February 28, FULL-YEAR 2017 RESULTS Recurring Operating Income of 2.0bn Free cash flow (excluding exceptional items) of 950m
 of 950m") FULL-YEAR 2017 RESULTS Recurring Operating Income of 2.0bn Free cash flow (excluding exceptional items) of 950m Slowdown in Group like-for-like sales, at +1.6% in 2017 vs. +3.0% in 2016. Recurring Operating
FULL-YEAR 2017 RESULTS Recurring Operating Income of 2.0bn Free cash flow (excluding exceptional items) of 950m Slowdown in Group like-for-like sales, at +1.6% in 2017 vs. +3.0% in 2016. Recurring Operating
Press release August 30, FIRST-HALF 2017 RESULTS Solid sales growth of +6.2% Recurring operating income of 621m
 FIRST-HALF 2017 RESULTS Solid sales growth of +6.2% Recurring operating income of 621m Net sales up +6.2% to 38.5bn, reflecting the combination of a good like-for-like performance and the effect of expansion:
Q SALES. January 17th, 2018
 SALES January 17th, 2018 Total FY Sales: +2.7% growth at constant exchange rates in a challenging environment CHANGE IN FY SALES 85.7 bn +1.6% +0.5% +2.2% -0.5% +0.8% +0.2% +2.7% +0.3% +3.0% 88.2 bn FY
Full Year Sales: Fourth consecutive year of organic sales growth, up +3.0%
 Full Year Sales: Fourth consecutive year of sales growth, up +3.0% Full Year 2015 consolidated sales: 86.3bn, up +3.0% on an basis and Carrefour s Full Year sales were impacted by an unfavorable 1.6% petrol
Pierre-Jean SIVIGNON
 AUGUST 29 th, 2013 Georges PLASSAT Pierre-Jean SIVIGNON H1 2013 Preliminary Remarks Business The Group continued to reorganize and strengthen its partnerships in Turkey, the Middle East and Africa Reorganization
FINANCIAL RESULTS Pierre-Jean SIVIGNON
 August 30 th, 2012 FINANCIAL RESULTS Pierre-Jean SIVIGNON 2 H1 2012 Preliminary Remarks The H1 2012 accounts fully consolidate Guyenne & Gascogne as of June 1, 2012 following the successful tender offer
Carrefour: 2012 Full-Year Results Growth in sales and net income, Group share Strengthened financial structure
 Carrefour: 2012 Full-Year Results Growth in sales and net income, Group share Strengthened financial structure 2012 key figures Growth in sales: +0.9% to 76.8bn, driven by emerging markets Resilient Recurring
Press release 8 March RESULTS
 2011 RESULTS Slight growth in sales, supported by emerging markets Current Operating Income of 2.2bn Net income, Group share, down 14%, impacted by significant one off elements Net debt reduced by more
Carrefour reports growth in recurring operating income and in net income for the first half 2013
 Carrefour reports growth in recurring operating income and in net income for the first half 2013 Key H1 2013 figures Sales ex. VAT of 36.5bn, up 1.4% at constant exchange rates. Taking into account the
New Debt Issue Investor Presentation. September 2007
 Carrefour Group Representatives Eric Reiss Chief Financial Officer Jean-Brieuc Le Tinier Director of Corporate Treasury 2 Summary Group Overview Business Strategy Financial overview Key credit strengths
2012 Half Year Results
 2012 Half Year Results Growth in sales supported by emerging countries Recurring Operating Income: 769m Net income from continuing operations, Group share of 199m Net debt reduced to 9.6bn, a decrease
HALF-YEAR FINANCIAL REPORT
 HALF-YEAR FINANCIAL REPORT June 30, 2018 Carrefour Half-year Financial Report June 30, 2018 Contents Management's discussion and analysis for the six-month period ended June 30, 2018 page 2 Condensed Consolidated
Business held up well in first-half 2009
 Paris - 27 August 2009 Business held up well in first-half 2009 Organic growth of 1.3%, excluding petrol and the calendar effect EBITDA margin almost stable on an organic basis Resilience of the convenience
ROADSHOW POST-Q2 & H RESULTS. September 2016
 ROADSHOW POST-Q2 & H1 2016 RESULTS September 2016 1. COMPANY OVERVIEW Rexel at a glance : Strategic partner for suppliers and customers Energy Providers Suppliers Customers Endusers Economies of scale
FY 2016 RESULTS. March 2 nd, 2017
 FY 2016 RESULTS March 2 nd, 2017 AGENDA Key messages & strategy execution Financial update 2017 outlook & conclusion FY2016 RESULTS 2 KEY MESSAGES & STRATEGY EXECUTION KEY MESSAGES 2016 results in line
RALLYE. Investor Presentation November 2017
 RALLYE Investor Presentation November 2017 GROUP PRESENTATION AS AT JUNE 30, 2017 RALLYE Listed company 51.1% of shares (1) 63.6% of voting rights 100% INVESTMENT PORTFOLIO Strategic asset Among the global
2015 FY RESULTS. / IR Team / Tel: ext
 2015 FY RESULTS / IR Team / Tel: +34 91 398 54 00 ext. 33890 investor.relations@diagroup.com 1 Disclaimer This document does not constitute or form part of any purchase, sales or Exchange offer, nor is
2017 HALF-YEAR RESULTS
 I 1 I 2017 HALF-YEAR RESULTS July 27, 2017 Emmanuel Faber, CEO Cécile Cabanis, CFO I 2 I This document is presented by Danone. It contains certain forward-looking statements concerning Danone. In some
Strong growth of results in 2017 Rapid progress of Fnac Darty integration
 Ivry, February 21, 2018 Strong growth of results in 2017 Rapid progress of Fnac Darty integration 2017 reported revenues up +38.7%, +0.4% pro-forma 1, and +2.2% excluding the TV segment (unfavorable comparison
ANNUAL GENERAL MEETING METRO AG. 15 February 2019
 ANNUAL GENERAL MEETING METRO AG 15 February 2019 DISCLAIMER AND NOTES To the extent that statements in this presentation do not relate to historical or current facts, they constitute forward-looking statements.
July 26, 2017 LafargeHolcim Ltd 2015
 Second Quarter 2017 Results Beat Hess, Chairman and Interim CEO Roland Köhler, Interim COO and Regional Head of Europe, Australia/NZ & Trading Ron Wirahadiraksa, CFO July 26, 2017 LafargeHolcim Ltd 2015
Grupo Carrefour Brasil
 Free translation into English from the original previously issued in Portuguese Grupo Carrefour Brasil Individual and Financial Statements as of December 31, 2017 Atacadão S.A. Grupo Carrefour Brasil Individual
1. Consolidated sales and earnings performance page Main earnings indicators 1.2. Analysis of the main income statement items
 Management's discussion and analysis as of December 31, 2017 Contents 1. Consolidated sales and earnings performance page 3 1.1. Main earnings indicators 1.2. Analysis of the main income statement items
2016 FULL-YEAR RESULTS Wednesday, March 15 th 2017
 2016 FULL-YEAR RESULTS Wednesday, March 15 th 2017 FORWARD LOOKING STATEMENTS This presentation may contain some forward-looking statements. These statements are not undertakings as to the future performance
Half-year 2016 highlights (1/2)
") Half-year 2016 highlights (1/2) Continued turnaround in France Progression of the activity: same-store sales* growth of +0.9% in H1 2016 Further market share gains Profit recovery: Improved trading profit
Half-year 2016 highlights (1/2) Continued turnaround in France Progression of the activity: same-store sales* growth of +0.9% in H1 2016 Further market share gains Profit recovery: Improved trading profit
RALLYE first-half results
 Paris, July 26, 208 RALLYE 208 first-half results Successful issue of a new CHF denominated bond for an amount of CHF95m ( 8m) maturing in February 2024, with a 3.25% coupon (euro equivalent of 4.23%)
EUROPCAR GROUP Q Results
 EUROPCAR GROUP Q1 2018 Results 1 Q1 2018 RESULTS CAROLINE PAROT, Europcar Group CEO LUC PELIGRY, Europcar Group CFO IMPORTANT NOTICE: based on Financial statements prepared under IFRS 2 Important Legal
H Results. July 24, 2018
 H1 2018 Results July 24, 2018 1 DISCLAIMER Financial data for 2018 are provided in accordance with IFRS 15 and IFRS 9, effective since January 1, 2018. To ensure a meaningful comparison with 2017, financial
2013 Annual Results March 7, 2014 RALLYE
 2013 Annual Results March 7, 2014 RALLYE GROUP PRESENTATION AS AT DECEMBER 31, 2013 RALLYE Listed company 48.4% of shares 59.5% of voting rights 93.7% of shares 94.6% of voting rights INVESTMENT PORTFOLIO
RALLYE. First-Half 2018 results July 26, 2018
 RALLYE First-Half 2018 results July 26, 2018 GROUP PRESENTATION AS AT JUNE 30, 2018 RALLYE Listed company 51.4% of shares 64.3% of voting rights 100% INVESTMENT PORTFOLIO Strategic asset Among the global
Axway Software 2018 Full-Year Results: Execution of the AMPLIFY strategy accelerates in the second-half
 Contacts Investor Relations: Arthur Carli +33 (0)1 47 17 24 65 acarli@axway.com Press Relations: Sylvie Podetti +33 (0)1 47 17 22 40 spodetti@axway.com Press Release Axway Software 2018 Full-Year Results:
MAISONS DU MONDE: FULL-YEAR 2018 RESULTS
 PRESS RELEASE MAISONS DU MONDE: FULL-YEAR 2018 RESULTS Strong performance in line with targets Continued solid momentum in online and international sales Focus on strategic pillars to deliver further profitable
1. SUBSIDIARIES ACTIVITY
 1 Paris, July 27, 2017 RALLYE 2017 first-half results Refinancing of the October 2018 bond at an equivalent yield with a 350m bond issue maturing in 2023, which has been significantly oversubscribed 1
FIRST-HALF 2017 RESULTS. 27 July 2017
 FIRST-HALF 2017 RESULTS 27 July 2017 Disclaimer FORWARD LOOKING STATEMENTS This presentation contains certain statements that constitute "forward-looking statements", including but not limited to statements
Worldpay Group 2016 Half Year Results. 9 August 2016
 Worldpay Group 2016 Half Year Results 9 August 2016 DISCLAIMER Important Notice The information set out in this document and any discussion which follows it does not constitute a public offer for the purposes
H FINANCIAL RESULTS. Milan September 18 th, 2018
 H1 2018 FINANCIAL RESULTS Milan September 18 th, 2018 1 AGENDA H1 2018 Highlights o o o Group overview Results by business Outlook Financial results Appendix 2 H1 2018 Financial Highlights Organic sales
Half-year Financial Report June 30, 2017
 Half-year Financial Report June 30, Contents Management's discussion and analysis for the six-month period ended June 30, page 2 Condensed Consolidated Financial Statements for the six-month period ended
H results. Stéphane Richard, Chairman and CEO Gervais Pellissier, Deputy CEO and CFO. July 29 th, 2014
 H1 2014 results Stéphane Richard, Chairman and CEO Gervais Pellissier, Deputy CEO and CFO July 29 th, 2014 disclaimer This presentation contains forward-looking statements about us. Although we believe
FIRST-HALF 2018 RESULTS 30 JULY 2018
 FIRST-HALF 2018 RESULTS 30 JULY 2018 Disclaimer FORWARD LOOKING STATEMENTS This presentation contains certain statements that constitute "forward-looking statements", including but not limited to statements
Financial Information
 Financial Information H1 revenues reached 12.8bn up 9.8%, flat org. in Q2 Adj. EBITA reached 1.6bn, up 6.4%, Adj. EBITA margin flat excl. Invensys in a challenging environment 2015 targets: Around flat
2017 Full Year Results
 2017 Full Year Results Title of the presentation 2 lines Location, Date, Author Paris February 15 th, 2018 Disclaimer This presentation may contain forward-looking statements, Such statements may include
AGENDA 01 ENVIRONMENT ANALYSIS OF 2013 RESULTS ARE THE CONCLUSIONS OF THE FIRST PART OF THE PLAN?
 1 AGENDA 01 ENVIRONMENT 02 DETAILED 03 WHAT 04 GOALS 05 QUESTIONS ANALYSIS OF 2013 RESULTS ARE THE CONCLUSIONS OF THE FIRST PART OF THE PLAN? 2014-2016 / ANSWERS 2 3 01 ENVIRONMENT 4 ENVIRONMENT STRONG
Orange financial results
 H1 2016 Orange financial results Stéphane Richard Chairman and CEO Ramon Fernandez Deputy CEO, Chief Financial and Strategy Officer 23 February 2017 FY Disclaimer This presentation contains forward-looking
2017 Annual Results. Philippe Capron
 2017 Annual Results Philippe Capron Overall 2017 performance better than expected, marked by strong revenue growth Strong revenue growth: +4.9% at constant FX (+3.5% like-for-like): improvement in France
FULL YEAR 2011 RESULTS
 FULL YEAR 2011 RESULTS February 28 th 2012 1 28 February 2011 This document does not constitute a purchase, sales or exchange offer, nor is it an invitation to draw up a purchase, sales or exchange offer,
RALLYE Annual Results February 17, 2015
 RALLYE 2014 Annual Results February 17, 2015 GROUP PRESENTATION AS AT DECEMBER 31, 2014 RALLYE Listed company 48.4% of shares 60.4% of voting rights 100% INVESTMENT PORTFOLIO Strategic asset Among the
Third Quarter 2017 Results Jan Jenisch, CEO Ron Wirahadiraksa, CFO. October 27, 2017 LafargeHolcim Ltd 2015
 Third Quarter 2017 Results Jan Jenisch, CEO Ron Wirahadiraksa, CFO October 27, 2017 LafargeHolcim Ltd 2015 01 Initial views Q3 2017 and Outlook Jan Jenisch, Chief Executive Officer 2017 LafargeHolcim 2
Capgemini records an excellent performance in 2017 with growth acceleration fueled by Digital and Cloud
 Press relations: Florence Lièvre Tel.: +33 1 47 54 50 71 florence.lievre@capgemini.com Investor relations: Vincent Biraud Tel.: +33 1 47 54 50 87 vincent.biraud@capgemini.com Capgemini records an excellent
1,633m 2013 Revenues 2013 ANNUAL RESULTS. 13 March ,427 Employees in % of Revenues for International in 2013
 1,633m 2013 Revenues 2013 ANNUAL RESULTS 13 March 2014 55% of Revenues for International in 2013 20,427 Employees in 2013 Disclaimer This presentation contains forward-looking statements (as defined in
2017 FULL YEAR RESULTS
 2017 FULL YEAR RESULTS Consolidated net sales: +5.0% Consolidated trading profit: +20.1% Underlying earnings per share: +13.4% In 2017, the Group reached its objective of a trading profit growth of 20%
Resultados 3º Trimestre de de outubro Q18 and 2018 Results February 21, 2019
 4Q18 and 2018 Results February 21, 2019 2018: Highlights OPTIMIZATION OF STORE PORTFOLIO 15 Pão de Açúcar stores renovated into the new model 23 Extra Super to Mercado Extra 13 conversions to Compre Bem
RALLYE Annual Results. Increase in Rallye s 2014 activity driven by the organic growth of Casino s net sales
 Paris, February 17, 2015 RALLYE 2014 Annual Results Increase in Rallye s 2014 activity driven by the organic growth of Casino s net sales Decrease in Rallye s 2014 cost of net financial debt by 23m, to
12M 2013 Financial results
 12M 2013 Financial results Financial analysts meeting February 13, 2014 1 1 Highlights 2 Commercial & Risk overview 3 Quarterly results 4 Year-to-date results 5 Shareholders equity & Economic solvency
Q Results presentation
 Q1 2016 Results presentation 12 May 2016 1 Disclaimer This presentation (the "Presentation") has been prepared and is issued by, and is the sole responsibility of Telepizza Group, S.A. ( Telepizza" or
4Q18 & 2018 EARNINGS RELEASE
 São Paulo, February 20, 2019 - GPA [B3: PCAR4; NYSE: CBD] announces its results for the fourth quarter and full year of 2018. Due to the ongoing divestment of the interest held by GPA in Via Varejo S.A.,
FY 2017 RESULTS. March 8 th, 2018
 FY 2017 RESULTS March 8 th, 2018 AGENDA Highlights 2017 performance 2018 outlook Additional material FY 2017 RESULTS 2 HIGHLIGHTS SUCCESSFUL STRATEGIC REPOSITIONING Our 3-year plan is now 90% completed
PRESS RELEASE Paris, July 29, 2015
 PRESS RELEASE Paris, July 29, 2015 SECOND-QUARTER & HALF-YEAR 2015 RESULTS (unaudited) SOLID GROWTH IN REPORTED SALES SEQUENTIAL IMPROVEMENT IN ADJUSTED EBITA MARGIN IN Q2, DESPITE SLOWDOWN IN ORGANIC
technicolor.com 7 JUNE 2018
 technicolor.com 7 JUNE 2018 COUNTRIES SITES REVENUES Connected Home 57% 57% 2017 2016 16% 1% 26% Production Services 18% DVD Services 24% North America 53% 2017 2016 25% 16% 52% 7% Europe, Middle-East
3Q18 EARNINGS. Food Business Multivarejo Assaí. (R$ million) (1) 3Q18 3Q17 Δ 3Q18 3Q17 Δ 3Q18 3Q17 Δ 3Q18 3Q17 Δ
 (1) 3Q18 3Q17 Δ 3Q18 3Q17 Δ 3Q18 3Q17 Δ 3Q18 3Q17 Δ") São Paulo, October 25, 2018 - GPA [B3: PCAR4; NYSE: CBD] announces its results for the third quarter of 2018. Due to the ongoing divestment of the interest held by GPA in Via Varejo S.A., as announced
São Paulo, October 25, 2018 - GPA [B3: PCAR4; NYSE: CBD] announces its results for the third quarter of 2018. Due to the ongoing divestment of the interest held by GPA in Via Varejo S.A., as announced
Net sales 8,669 8, % 0.6% Operating income (EBIT) % -19.5% Basic EPS % -38.2%
 % -19.5% Basic EPS % -38.2%") 22 February 2018 Audited Financial summary Gross sales amounted to EUR10.3bn in 2017, implying 1.5% growth ex-currency. In Spain, gross sales declined by 3.8%, in line with a 3.9% space reduction carried
22 February 2018 Audited Financial summary Gross sales amounted to EUR10.3bn in 2017, implying 1.5% growth ex-currency. In Spain, gross sales declined by 3.8%, in line with a 3.9% space reduction carried
Consolidated Financial Statements
 Consolidated Financial Statements as of 2017 Contents Consolidated income statement page 3 Consolidated statement of comprehensive income page 4 Consolidated statement of financial position page 5 Consolidated
FULL-YEAR 2017 RESULTS
 Nanterre (France), February 16, 2018 FULL-YEAR 2017 RESULTS STRONG PERFORMANCE IN 2017 WITH OPERATING MARGIN AT 7% OF SALES IN H2 2018 GUIDANCE AHEAD OF ROADMAP RECORD ORDER INTAKE AT 62BN, UP 9BN ACCELERATION
Q Results. May 17 th, 2018
 May 17 th, 2018 Disclaimer This presentation contains estimates and/or forward-looking statements and information. These statements include financial projections, synergies, estimates and their underlying
RALLYE first-half results
 Paris, July 29, 2016 RALLYE 2016 first-half results Casino consolidated net sales of 19.7bn, up + 2.7% on an organic basis: Increase in activity and significant profit recovery in France Sustained good
EUROPCAR GROUP FULL YEAR 2015 RESULTS. The leading European car rental company at the heart of new mobility solutions.
 EUROPCAR GROUP The leading European car rental company at the heart of new mobility solutions FULL YEAR 2015 RESULTS February 25, 2016 Agenda Our Success and Our Commitments Operating Performance & Financing
Strong increase in business performance and results in the first half of 2014
 Press release Paris, July 30, 2014 Strong increase in business performance and results in the first half of 2014 - Revenue of 703 million o up 20 percent on a comparable basis 1 o up 7 percent on a reported
PRESENTATION GERMAN CORPORATE CONFERENCE
 PRESENTATION GERMAN CORPORATE CONFERENCE 17 January 2018 1 DISCLAIMER To the extent that statements in this presentation do not relate to historical or current facts, they constitute forward-looking statements.
Continued operating improvements leading to EBITDA growth and further deleveraging
 PRESS RELEASE 2018 annual Results Continued operating improvements leading to EBITDA growth and further deleveraging Highlights of the year Paris, February 14 th, 2019 Reported revenue of 2,416 million
RALLYE Annual Results
 Paris, 1 st March 2013 RALLYE 2012 Annual Results A year of major transformations and strong growth for Casino: Control of GPA in Brazil in July 2012 and agreement with Galeries Lafayette on the acquisition
Q results. April 27, 2018
 Q1 2018 results April 27, 2018 Consolidated financial statements as of March 31, 2018 were authorized for issue by the Board of Directors held on April 26, 2018. Q118 KEY HIGHLIGHTS Q1 2018 in line with
Third Quarter 2018 Earnings Conference Call. August 7, 2018
 Third Quarter 2018 Earnings Conference Call August 7, 2018 1 Safe Harbor Statement Our commentary and responses to your questions may contain forward-looking statements, including our outlook for the remainder
Financial information for the year ended December 31, 2017
 Financial information as of December 31, 2017 Société Anonyme (corporation) with share capital of 1,516,715,885 Registered office: 13 boulevard du Fort de Vaux - CS 60002 75017 PARIS - France 479 973 513
2015 RESULTS. February 23, Emmanuel FABER, CEO Cécile CABANIS, CFO
 2015 RESULTS February 23, 2016 Emmanuel FABER, CEO Cécile CABANIS, CFO 1 DISCLAIMER This document contains certain forward-looking statements concerning Danone. Although Danone believes its expectations
Financial summary Gross sales amounted to EUR4.60bn in H1 2018, implying 1.4% growth ex-currency.
 26 July 2018 Revised H1/2018 Financial summary Gross sales amounted to EUR4.60bn in H1 2018, implying 1.4% growth ex-currency. The group s LFL grew by 1.8% in the first half of 2018, 0.4% down in Iberia
Solid performance in a mixed environment
 2014 Full Year Solid performance in a mixed environment Paris, 2014 Full Year Paris, Solid performance and sustained shareholder return in a mixed environment Sales growth, enhanced competitiveness Strong
Electrocomponents 2017 half-year financial results. 18 November 2016
 Electrocomponents 2017 half-year financial results 18 November 2016 Agenda Overview of results Lindsley Ruth Financial results and performance update David Egan Performance Improvement Plan Lindsley Ruth
Statkraft Investor Update. March 2014
 Statkraft Investor Update March 2014 Disclaimer This presentation has been prepared by, and the information contained herein (unless otherwise indicated) has been provided by Statkraft AS (the "Company").
Investor Presentation. May 2015
 Investor Presentation May 2015 AGENDA 1 - Our markets, a significant opportunity 2 Cnova is built on two strong companies: Cdiscount and Cnova Brasil 3 - The development of marketplaces: a key element
9M 2018 FINANCIAL RESULTS. Milan November 14 th, 2018
 9M 2018 FINANCIAL RESULTS Milan November 14 th, 2018 1 AGENDA 9M 2018 Highlights o Group overview o Results by business Financial results Appendix 2 9M 2018 Financial Highlights Organic sales growth at
t e c h n i c o l o r. c o m
 2017 t e c h n i c o l o r. c o m Forward looking statements THIS PRESENTATION contains certain statements that constitute "forward-looking statements", including but not limited to statements that are
Q SALES. April 18, Cécile Cabanis CFO I 1 I
 Q1 2018 SALES April 18, 2018 Cécile Cabanis CFO I 1 I Disclaimer This presentation contains certain forward-looking statements concerning Danone. In some cases, you can identify these forwardlooking statements
Investment Community Conference Call
 DieboldNixdorf.com Investment Community Conference Call Third Quarter, 2018 Earnings October 31, 2018 Use of non-gaap Financial Information To supplement our condensed consolidated financial statements
Johnson Controls background and Financial guidance (as announced on December 2, 2014)
") If you can read this Click on the icon to choose a picture or Reset the slide. To Reset: Right click on the slide thumbnail and select reset slide or choose the Reset button on the Home ribbon (next to
If you can read this Click on the icon to choose a picture or Reset the slide. To Reset: Right click on the slide thumbnail and select reset slide or choose the Reset button on the Home ribbon (next to
RALLYE Annual Results. Strong decrease of Rallye s cost of net financial debt, at 112m compared to 165m in 2014
 Paris, March 9, 2016 RALLYE 2015 Annual Results Strong decrease of Rallye s cost of net financial debt, at 112m compared to 165m in 2014 Increase in Rallye s stake in Casino to 50.1% of share capital Average
Results 2Q18. August 2, 2018
 Results August 2, 2018 Highlights Indicators Var. x 2Q17 Operating Income (R$ MM) 42.8 +92.7% Operating Margin 1.8% +0.8 p.p. Net operating revenues: R$2.4 billion (+9.0% vs. 2Q17) ASK (BN) 10.7 +2.2%
FY 2016 Financial Results. Milan March 1st 2017
 FY 2016 Financial Results Milan March 1st 2017 Agenda FY 2016 Highlights o o Group overview Results by business Financial results Appendix FY 2016 Financial Results 2 FY 2016 Highlights Adj. EBITDA at
FINANCIAL INFORMATION AS OF SEPTEMBER 30, 2015
 FINANCIAL INFORMATION AS OF SEPTEMBER 30, 2015 KEY MESSAGES Financial performance impacted by commodity price drop, partially offset by performance in fast growing markets and cost discipline Cash flow
Strengthening the economic model
 Strengthening the economic model Cécile CABANIS Executive Vice President, Chief Financial Officer Strategy and Information Systems DISCLAIMER This document is presented by Danone. It contains certain forward-looking
2015 Fourth-Quarter and Fiscal Year Performance
 205 Fourth-Quarter and Fiscal Year Performance Financial Results and Company Highlights March 5, 206 Disclaimers Forward-Looking Statements This presentation includes forward-looking statements within
PRESS RELEASE Paris, October 31, 2018
 PRESS RELEASE Paris, October 31, 2018 THIRD-QUARTER & NINE-MONTH 2018 RESULTS SALES GROWTH FOR THE 8 th CONSECUTIVE QUARTER, SAME-DAY SALES UP 3.4% ADJUSTED EBITA UP +9.2% AND RECURRING NET INCOME UP 20%
2017 Full Year Results
 A GLOBAL LEADER IN METAL FLOW ENGINEERING 2017 Full Year Results 1 March 2018 Patrick André Chief Executive 1 Disclaimer This presentation, which has been prepared by Vesuvius plc (the Company ), includes
PRESS RELEASE Paris, October 31, 2013
 PRESS RELEASE Paris, October 31, 2013 THIRD-QUARTER & 9-MONTH 2013 RESULTS (unaudited) Condensed consolidated interim financial statements as of September 30, 2013 were authorized for issue by the Management
Q Financial Results October 20, 2014
 Q3 2014 Financial Results October 20, 2014 Balanced exposures providing resilience to industry cycles Uniquely balanced geographic exposure One of the broadest Attractive end-markets exposure product portfolios