2 nd Annual Goldman Sachs JB Were Australasian Investment Forum, New York
|
|
|
- Alfred Owens
- 5 years ago
- Views:
Transcription


1 2 nd Annual Goldman Sachs JB Were Australasian Investment Forum, New York Kirby Adams, Managing Director and Chief Executive Officer March, 26 ASX Code: BSL
2 Important Notice THIS PRESENTATION IS NOT AND DOES NOT FORM PART OF ANY OFFER, INVITATION OR RECOMMENDATION IN RESPECT OF SECURITIES. ANY DECISION TO BUY OR SELL BLUESCOPE STEEL LIMITED SECURITIES OR OTHER PRODUCTS SHOULD BE MADE ONLY AFTER SEEKING APPROPRIATE FINANCIAL ADVICE. RELIANCE SHOULD NOT BE PLACED ON INFORMATION OR OPINIONS CONTAINED IN THIS PRESENTATION AND, SUBJECT ONLY TO ANY LEGAL OBLIGATION TO DO SO, BLUESCOPE STEEL DOES NOT ACCEPT ANY OBLIGATION TO CORRECT OR UPDATE THEM. THIS PRESENTATION DOES NOT TAKE INTO CONSIDERATION THE INVESTMENT OBJECTIVES, FINANCIAL SITUATION OR PARTICULAR NEEDS OF ANY PARTICULAR INVESTOR. TO THE FULLEST EXTENT PERMITTED BY LAW, BLUESCOPE STEEL AND ITS AFFILIATES AND THEIR RESPECTIVE OFFICERS, DIRECTORS, EMPLOYEES AND AGENTS, ACCEPT NO RESPONSIBILITY FOR ANY INFORMATION PROVIDED IN THIS PRESENTATION, INCLUDING ANY FORWARD LOOKING INFORMATION, AND DISCLAIM ANY LIABILITY WHATSOEVER (INCLUDING FOR NEGLIGENCE) FOR ANY LOSS HOWSOEVER ARISING FROM ANY USE OF THIS PRESENTATION OR RELIANCE ON ANYTHING CONTAINED IN OR OMITTED FROM IT OR OTHERWISE ARISING IN CONNECTION WITH THIS. Page 2
3 Introduction Page 3
4 Our Bond What we value Our customers are our partners Our people are our strength Our shareholders are our foundations Our communities are our homes Page 4
5 Our Customers serving them in over 2 countries Over 3, customers using BlueScope Steel products with confidence Americas 21% Exports 38% Europe/Africa 3% Geographic markets (tonnes by destination) First Half FY6 North America- NSBSS + C&BPNA 16% Asia 14% Asia 8% million tonnes Australia 34% New Zealand /Pacific 4% Painted 13% Global Product Mix ($ Revenue) First Half FY6 PEB/Roll formed 28% Metal Coated 18% Slab 9% CRC 3% Plate 6% HRC 23% PRODUCT OFFER Services Solutions Technical support Warranty Indicative Just In Time Delivery Transport & Logistics Design / Build / Install Information systems - web based - connectivity Page 5
6 Zero harm is our goal for our team and communities Lost Time Injury Frequency Rate Medically Treated Injury Frequency Rate Injuries resulting in lost time per million man-hours worked Reported performance for IISI member companies H Medically treated injuries per million man-hours worked H 7. ** Includes Butler performance from May 24 * Includes Butler performance from May 24 17,5 Employees, 75 manufacturing sites, 17 countries Page 6
7 Our shareholders continuing to reward shareholders as we grow Share Buybacks Public Listing to 31 December 25 - Purchased and cancelled 113m shares * on market 87m shares * off market 26m shares Dividends - All Fully Franked 62 Total return to shareholders since BSL s public listing (July 22): Share buybacks Dividends paid Interim dividend (to be paid April 6) $2.39 share or 77% payout ratio $ 687m $ 97m $ 14m $ 1,797m Cents Per Share FY23-1H FY23-2H FY24-1H FY24-2H FY25-1H 2 24 FY25-2H 2 FY26-1H Special Ordinary: - Interim - Final Page 7
8 Unique and valuable franchise in world s largest and fastest growing markets Asia & China 2 BlueScope Buildings Sites India 5:5 JV with Tata Steel MC 25kt Painting 15kt 2 BlueScope Buildings sites 1 Butler PEB Thailand Cold Rolling 3kt MC 375kt Painting 9kt PEB Malaysia MC 16kt Painting 7kt Australia 7 Service Centres 34 BlueScope Buildings sites 7 BlueScope Water Indonesia MC 1kt +25kt Painting 5kt +75kt Western Port Hot Rolling 1.43mt Cold Rolling 1.mt MC (3 lines) 83kt + Painting (2 lines) 33kt + China MC 25kt Painting 15kt 3 Butler PEB Vietnam MC 125kt Painting 5kt Brisbane Painting 88kt Sydney Painting (1 line) 12 kt Coated and Building Products North America North Star JV Hot Rolling 1.8mt (1%) Castrip JV Port Kembla / Springhill Raw Steel 5.1mt Hot Rolling 2.4mt +4kt Plate 36kt Cold Rolling 1,18kt Tinplate/Black plate 2kt MC (3 lines) 75kt + PL (2 lines) 27kt + New Zealand / Pacific Iron sand Mining Raw Steel 625kt Hot Rolling 75kt Cold Rolling36kt MC 23kt + Painting 6kt Hollow Sections 45kt Pacific BlueScope Buildings sites 3 Page 8
.9 6.")
9 Upstream Steel Making Capability Products Statistics Port Kembla Steelworks NSW, Australia New Zealand Steel North Star BlueScope Ohio, USA Slab Hot Rolled Coil Plate Raw steel capacity (mtpa) - PKSW NZS.6 - NS (5%) Cost curve (HRC) - PKSW & NZS - lowest quartile - NS - most efficient EAF Turnover (1H-6) - PKSW A$1,9m - NS (5%) US$243m Customers - Internal mid-stream - Pipe & Tube - Fabrication / manufacturing - Ship building (Korea) - Distribution Markets - Australia, NZ, Americas, Asia Page 9
 - Indonesia - Malaysia - Thailand - Vietnam - China Research & Development Technical Support COLORBOND ZINCALUME CLEAN COLORBOND GALVASPAN Capacity (ktpa) growing Asia FY5 FY9 - Cold Rolled")

10 Midstream Metallic Coating and Coil Coating Network Capability Products Statistics Australia: - Western Port, Vic - Illawarra Coated Products, NSW - Queensland - Sydney New Zealand Asia: - India JV (Tata) - Indonesia - Malaysia - Thailand - Vietnam - China Research & Development Technical Support COLORBOND ZINCALUME CLEAN COLORBOND GALVASPAN Capacity (ktpa) growing Asia FY5 FY9 - Cold Rolled Coil Metallic Coating 43 1,46 - Painting Australia - Cold Rolled Coil 1,93 2,18 - Metallic Coating 1,58 1,58 - Painting NZ - Cold Rolled Coil Metallic Coating Painting 6 6 Feed source of Hot Rolled Coil and Cold Rolled Coil - Asia local suppliers and internal - Australia & NZ internal Customers - Principally construction, manufacturing & auto Markets - In market local supplier - + exports Page 1
 BlueScope Water Market leader in -")

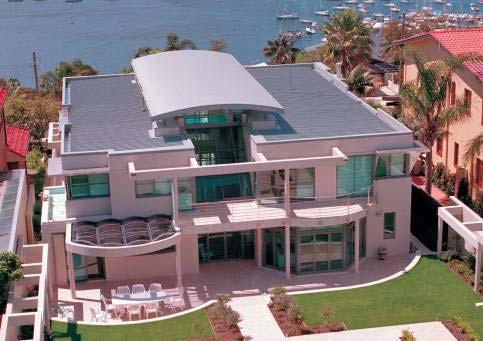
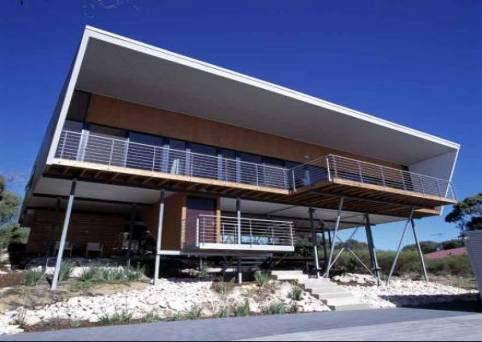
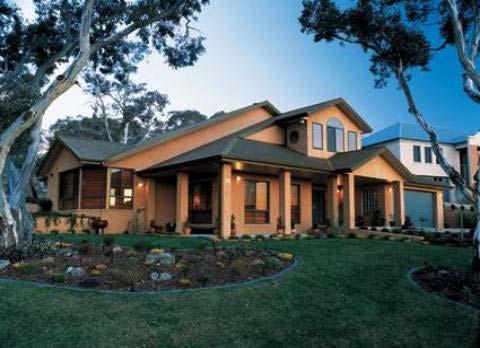
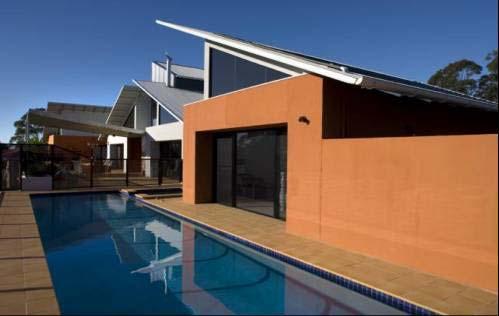
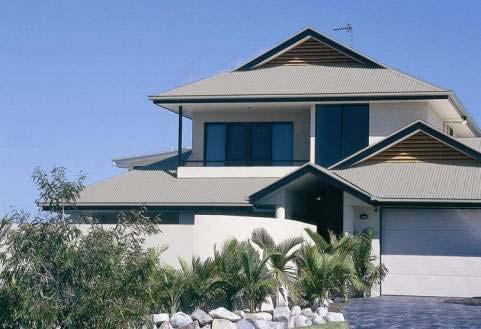
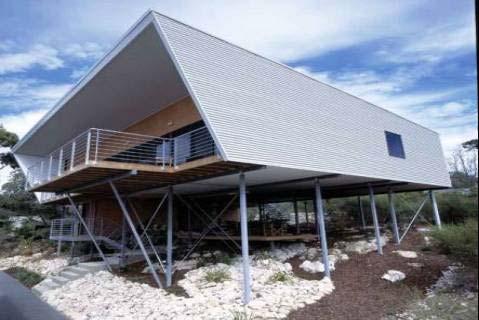
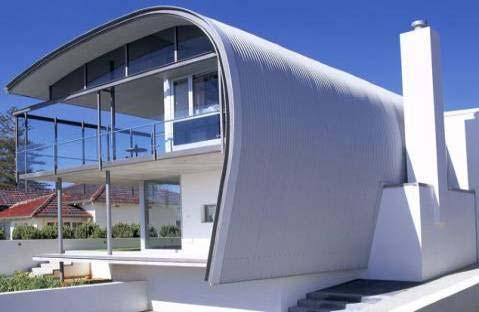
11 Downstream - Metal Building Products and Solutions Capability Products Statistics Australia New Zealand & Pacific Asia North America Lysaght roll formed steel components Butler Pre-Engineered Buildings (PEB) BlueScope Water Market leader in - Australia - China - South East Asia - USA (PEB) Feed - Australia - internal - Asia - internal - NZ internal - NA external / internal Customers - Principally construction sector Markets - In market local supplier - Branded products - Supply, install and fix Page 11
12 Current and expected market conditions confirm our strategic direction Downstream Midstream Upstream FUTURE GROWTH PROJECTS FY26 2H Australia - Water and new building products Thailand - First pre-engineered building (PEB) China - New panels, residential plants and new beam facility Vietnam - Ramp-up 125kt Metal Coating and 5kt Paint Lines Thailand - Ramp-up 2kt Metal Coating expansion New Zealand Steel - Front end study underway USA - North Star BlueScope new bag house -Castrip FY27-29 India - New PEB and Lysaght plants open China - New PEB and Lysaght plants open Australia - 12kt Colorbond plant start up (1H-CY7) China - 25kt Metal Coating and 15kt Paint lines start up (1Q-FY7 & 2H-FY6 respectively) India - 25kt Metal Coating & 15kt Paint lines start up (mid CY8) Indonesia - 25kt Metal Coating & 75kt Paint lines start up (early CY8) Australia - 4kt HSM expansion (1Qtr 7) - BF No. 5 reline (expected FY8) Page 12
13 Pricing over the cycle Indicative Selling Price $ PEB Paint ZAL Galv CRC HRC Slab Time Page 13

14 FY26 IN REVIEW Page 14
15 Our record since public listing Revenue & EBITDA Revenue (A$ Billions) 4,4 4, 3,6 3,2 2,8 2,4 2, 1,6 1,2 8 4 Revenue EBITDA 1H-3 2H-3 1H-4 2H-4 1H-5 2H-5 1H-6 Despatches (net) Revenue (A$m) 2,59 (1) 2,712 (1) 2,619 (1) 3,151 (1) 3,881 4,84 3,892 EBITDA (A$m) 464 (1) 417 (1) 44 (1) 665 (1) EBITDA (A$ Millions) (1) AGAAP Page 15
16 Calendar Year Earnings A$ Millions CY23 CY24 (2) CY25 Revenue 5,328 7,29 7,98 EBITDA (1) 857 1,51 1,411 EBIT (1) 581 1,212 1,111 Net Profit EPS ( ) (1) Includes EBITDA & EBIT for North Star BlueScope Steel but not revenue. (2) Includes eight months of BlueScope Butler financial results. Page 16
17 Group headlines First Half FY26 vs. First Half FY25 Revenue A$3,892 million Constant External despatches 3.5 million metric tonnes Up 3% EBITDA A$593 million Down 29% EBIT A$449 million Down 35% NPAT A$312 million Down 38% EPS 44 Down from 68 After tax Return on Invested Capital 14.6% Down from 27% After tax Return on Equity 18.9% Down from 32% Net operating Cashflow - after capital / investments ($19 million) Down 18% - before capital $347million Down 33% Interim Ordinary Dividend 2 per share Increased 2 per share (11%) (fully franked) Gearing (net debt) 33.2% 22.2% (June 5) including SOR Page 17
18 EBIT A$ Millions Coated and Building Products Asia unexpected market weakness Sales revenue down 7% to A$485m, including A$117m from BlueScope Butler China FY5-1H FY5-2H FY6-1H BlueScope Butler 1H-FY26 return on net assets annualised (pre-tax) (1%) Markets > Lower despatches / weaker markets > Heightened import competition > Customers high inventories / destocking > China credit controls delayed projects Performance First half > higher feed costs fully utilised in half > +$11m in pre-operating and business development costs vs. 1H-5 (gross $18m) > unfavourable FX - A$ stronger > growth projects on schedule, apart from China metal coating line (+1-3 months) Second half > improving margins, higher production and increased sales volumes > competitive market offers > project delivery / start-up Page 18
19 Continued GDP growth expected in South East Asia Annual % Change Annual % Change GDP - Thailand Consensus EIU IMA Asia e 6 7 GDP - Indonesia and Vietnam Vietnam Indonesia Consensus EIU IMA Asia F cast F cast e 6 7 Source: EIU, Consensus Economics, IMA Asia, BSL Economics Notes: All charts include calendar year data Annual % Change US$billion GDP - Malaysia Consensus EIU IMA Asia F cast e 6 7 Foreign Direct Investment [Thailand, Malaysia, Indonesia, and Vietnam] F cast e Page 19
20 China and India expected to maintain strong growth momentum Annual % Change China India GDP Consensus EIU IMA Asia F cast e 6 7 Industrial Production Consensus EIU F cast Annual % Change China Gross Fixed Investment e 6 7 China (LHS) India Consensus EIU IMA Asia Foreign Direct Investment F cast F cast 12 1 Annual % Change China India e 6 7 Source: EIU, Consensus Economics, IMA Asia, BSL Economics Notes: All charts include calendar year data US$billion India (RHS) EIU e Page 2
21 Our Asian Coating / Painting / Roll-Forming / PEB Capacity to Triple By Region Metal Coating Painting (k tonnes) x 3.4 x FY25 FY26 FY27 FY28 FY29 Page 21
22 Millions EBIT A$ Coated & Building Products Australia Challenged again Sales revenue of A$1,429m, down 5% H-FY26 return on net assets annualised (pre-tax) (5%) * FY5-1H FY5-2H FY6-1H * Excludes Packaging Products impairment write-down of $82million -3 Markets > Lower production & export volumes due to Western Port fire > Lower domestic demand for Australian canned goods > Lower domestic demand in manufacturing and distribution for bare galvanised > Increased bare product import offers > Strong domestic demand for higher quality construction products > Higher domestic prices Performance First half > significantly higher feed costs (HRC & slab) > Western Port HSM fire August 25 reduced production capacity fully operational November 25 > Higher zinc and aluminium costs > Increased metal coating and paint capacity > Western Sydney Colorbond Centre on schedule Second half > Improved sales and production > More competitive market offers > Lower bare product prices Page 22
23 EBIT A$ Millions Coated and Building Products North America Back in the black Sales revenue = A$67m down 4% FY5-1H FY5-2H FY6-1H 1H FY26 return on net assets annualised (pre-tax) 1% 2 Markets > Improved non-residential market but not as strong as the previous corresponding period > Good order bookings leading into the second half Performance First half > Overall continued improvement > Buildings - Jackson Tennessee specialty plant into full production - But, despatches down 7.5% due to delayed start-up - Sold Galesburg, Illinois facility >Vistawall - Tennessee extrusion expansion completed - Weekly order intake ($ terms) up 21% - Cost increases aluminium and energy Second half > Continued improvement Page 23
 42% Markets > Lower domestic sales (softer residential) > Higher domestic prices > Lower prices on export HRC sales > Higher average vanadium prices Performance First half >")
24 EBIT A$ Millions New Zealand and Pacific Steel Products still delivering Sales revenue down 8% to A$359m FY5-1H FY5-2H FY6-1H 66 1H-FY26 return on net assets annualised (pre-tax) 42% Markets > Lower domestic sales (softer residential) > Higher domestic prices > Lower prices on export HRC sales > Higher average vanadium prices Performance First half > Higher costs, including maintenance, unit costs and coal / electricity > Paint line production up due to FY5 upgrade > Regrettably had a fatality in July > Front end studies underway steel make and iron sands conversion Second half > Lower steel prices > Flat sales volumes Page 24
25 EBIT A$ Millions Hot Rolled Products excellence across the board PKSW sales revenue up 2% to A$1,9m NSBSS revenue US$243m (5%), down 17% North Star BlueScope Steel FY5-1H FY5-2H FY6-1H Port Kembla Steelworks 479 1H-FY26 return on net assets annualised (pre-tax) 44% 9 62 Markets > Increased export (principally slab) sales > Higher domestic prices; lower export prices > Strong USA HRC price / scrap spread Performance First half > Dramatically higher iron ore and coal costs, partly offset by lower priced iron ore inventory > Excellent operations / marketing effort post Western Port fire > Record 6 month iron make and slab production > Enterprise Bargaining Agreement extended to 29 > PKSW Hot Strip Mill expansion on schedule > North Star BlueScope record half year production and paid US$5m (1%) dividend Second half > Full impact of 71% higher iron ore costs > Flat steel volumes; weaker prices overall > More normal product mix; improved market offer Page 25
26 Earnings guidance for FY26 implies a more challenging second half FY26 after tax earnings outlook now expected to be in the range of A$.65 $.75 EPS on an AIFRS basis Downstream FY26 2H vs. 1H Lower bare feed costs Higher sales volumes Greater competition Australia Improved sales & production Displace imports Lower bare product prices Midstream Asia Improved margins Higher production & sales volumes Competition Vietnam project start up Full affect of higher iron ore (PKSW) Upstream Scrap free market linked to HRC Further softening in Asian export steel prices Flat sales volumes More normal product / geographical mix Page 26
27 Global steel industry currently squeezed by China s increased steel making capacity and higher raw material costs Million tonnes 4 35 China Crude Steel Production Sources: IISI, BSL Research 25 2 Raw Steel Prices Lump Iron Ore Extreme Deviation Jan-98 Jan-99 Jan- Jan-1 Jan-2 Jan-3 Jan-4 Jan-5 Jan-6 Japan to Korea HRC US Midw est HRC Latin America Slab US$ / Tonne. Indexed, Jan 98 = 1. (CRU) US$ / DMT. Lump iron ore indicative of all iron ore types. JSM Benchmark Pricing. Page 27
28 World crude steel production to 24 Million Tonnes Average Annual Growth Rates 4.% % 3.1% % Source: IISI Page 28
29 Global steel industry our long term view has not changed Current industry issues: China s capacity growth / fragmentation Lower Asian steel prices Higher raw material costs Scrap / iron ore differential Higher energy and other costs Increased competition Rest of steel world Continued discipline Continued industry consolidation India increased steel requirements (3-5 years) Likely industry outcomes long term: China steel reform initiatives taken / exports discouraged China increased demand / steel displaces inter-material Prices improve and then stabilise Raw material costs moderate Other costs remain high Competition BUT on increased demand Expansion programs being re-evaluated Page 29
30 Questions and Answers Strong Strong Board Board & Management Team Team Profitable Profitable Through Through the the Cycle Cycle Dynamic Dynamic Global Global Steel Steel Market Market Value Value Added Added Branded Branded Products Products Growth Growth Opportunities in in Asia Asia A VERY DIFFERENT KIND OF STEEL COMPANY Strong Strong Operating Operating Track Track Record Record Strong Strong and and Flexible Flexible Capital Capital Structure Structure Consistently Strong Strong Cash Cash Flows Flows Geographic Geographic and and Product Product Diversity Diversity Low Low Cost Cost Producer Producer Page 3
31 2 nd Annual Goldman Sachs JB Were Australasian Investment Forum, New York Kirby Adams, Managing Director and Chief Executive Officer March, 26 ASX Code: BSL
Half Year Results Presentation Period Ended 31 December 2005
 Half Year Results Presentation Period Ended 31 December 25 Kirby Adams, Managing Director and Chief Executive Officer Paul O Malley, Chief Financial Officer 2 February, 26 ASX Code: BSL Important Notice
Continuing to Reward Shareholders and Deliver on our Strategy
 Continuing to Reward Shareholders and Deliver on our Strategy Kirby Adams, Managing Director and Chief Executive Officer 27 September, 2005 ASX Code: BSL A Very Different Kind of Steel Company Page 2 Safety
Merrill Lynch Global Metals & Mining Conference 2007, Dublin
 Merrill Lynch Global Metals & Mining Conference 2007, Dublin Kirby Adams, Managing Director & Chief Executive Officer 8 th 10 th May 2007 ASX Code: BSL Important notice THIS PRESENTATION IS NOT AND DOES
Half Year Earnings Report Six Months Ended 31 December 2003
 BLUESCOPE STEEL LIMITED A.B.N. 16 000 011 058 Level 11, 120 Collins Street Melbourne, Victoria 3001 Ph: +61 (03) 9666 4000 Fax: +61 (03) 9666 4111 Website: www.bluescopesteel.com ASX Code: BSL 19 February
Annual General Meeting. Originally issued by BHP Steel. On 17 November 2003 BHP Steel became BlueScope Steel Limited.
 Annual General Meeting Originally issued by BHP Steel. On 17 November 2003 BHP Steel became BlueScope Steel Limited. Annual General Meeting Graham Kraehe Chairman 12 November 2003 Board of Directors GRAHAM
RESULTS FOR ANNOUNCEMENT TO THE MARKET (Under ASX listing rule 4.2A)
") BLUESCOPE STEEL LIMITED A.B.N. 16 000 011 058 Level 11, 120 Collins Street Melbourne, Victoria 3001 Ph: +61 (03) 9666 4000 Fax: +61 (03) 9666 4111 Website: www.bluescopesteel.com ASX Code: BSL FOR IMMEDIATE
BLUESCOPE STEEL LIMITED A.B.N. 16 000 011 058 Level 11, 120 Collins Street Melbourne, Victoria 3001 Ph: +61 (03) 9666 4000 Fax: +61 (03) 9666 4111 Website: www.bluescopesteel.com ASX Code: BSL FOR IMMEDIATE
JP Morgan Conference Singapore
 JP Morgan Conference Singapore John Knowles, VP Investor Relations Robert Elliott, VP Finance Asian Building & Manufacturing Markets 5 October, 2004 ASX Code: BSL Important Notice THIS PRESENTATION IS
RESULTS FOR ANNOUNCEMENT TO THE MARKET (Under ASX listing rule 4.2A)
") BLUESCOPE STEEL LIMITED A.B.N. 16 000 011 058 Level 11, 120 Collins Street Melbourne, Victoria 3001 Ph: +61 (03) 9666 4000 Fax: +61 (03) 9666 4111 Website: www.bluescopesteel.com ASX Code: BSL RESULTS
BLUESCOPE STEEL LIMITED A.B.N. 16 000 011 058 Level 11, 120 Collins Street Melbourne, Victoria 3001 Ph: +61 (03) 9666 4000 Fax: +61 (03) 9666 4111 Website: www.bluescopesteel.com ASX Code: BSL RESULTS
2004 Annual General Meeting
 2004 Annual General Meeting Annual General Meeting Graham Kraehe Chairman 19 October 2004 Board of Directors GRAHAM KRAEHE Chairman RON MCNEILLY Deputy Chairman KIRBY ADAMS MD & CEO TAN YAM PIN DIANE GRADY
ANNUAL GENERAL MEETING 10.00AM, WEDNESDAY, 12 NOVEMBER 2003 CHAIRMAN S ADDRESS - GRAHAM KRAEHE
 ANNUAL GENERAL MEETING 10.00AM, WEDNESDAY, 12 NOVEMBER 2003 CHAIRMAN S ADDRESS - GRAHAM KRAEHE TOTAL SHAREHOLDER RETURN SINCE OUR PUBLIC LISTING IN JULY LAST YEAR, YOUR COMPANY HAS BEEN SQUARELY FOCUSED
20 February The Manager Listings Australian Securities Exchange Limited Exchange Centre 20 Bridge Street SYDNEY NSW 2000.
 BLUESCOPE STEEL LIMITED A.B.N. 16 000 011 058 Level 11, 120 Collins Street Melbourne, Victoria 3001 Ph: +61 (03) 9666 4000 Fax: +61 (03) 9666 4111 Website: www.bluescopesteel.com ASX Code: BSL 20 February
Strategic Initiatives and Outlook Update
 Strategic Initiatives and Outlook Update Paul O Malley, Managing Director and Chief Executive Officer Charlie Elias, Chief Financial Officer 26 October 2015 BlueScope Steel Limited. ASX Code: BSL Important
For personal use only
 BlueScope Steel Limited A.B.N. 16 000 011 058 Level 11, 120 Collins Street Melbourne, Victoria 3001 Ph: +61 (03) 9666 4000 Web: www.bluescope.com ASX Code: BSL 20 February 2017 The Manager Listings Australian
20 February The Manager Listings Australian Securities Exchange Limited Exchange Centre 20 Bridge Street SYDNEY NSW 2000.
 BlueScope Steel Limited A.B.N. 16 000 011 058 Level 11, 120 Collins Street Melbourne, Victoria 3001 Ph: +61 (03) 9666 4000 Web: www.bluescope.com ASX Code: BSL 20 February 2017 The Manager Listings Australian
26 February The Manager Listings Australian Securities Exchange Limited Exchange Centre 20 Bridge Street SYDNEY NSW 2000.
 BlueScope Steel Limited A.B.N. 16 000 011 058 Level 11, 120 Collins Street Melbourne, Victoria 3001 Ph: +61 (03) 9666 4000 Web: www.bluescope.com ASX Code: BSL 26 February 2018 The Manager Listings Australian
BlueScope Steel Limited ABN Interim financial report - 31 December Contents
 ABN 16 000 011 058 Interim financial report - Contents Page Directors' report 1 Interim financial report Consolidated income statement 6 Consolidated balance sheet 7 Consolidated statement of recognised
Re: Compliance with Listing Rule 4.3A for the twelve months ended 30 June 2017
 A.B.N. 16 000 011 058 Level 11, 120 Collins Street Melbourne, Victoria 3001 Ph: +61 (03) 9666 4000 Web: www.bluescope.com ASX Code: BSL 21 August The Manager Listings Australian Securities Exchange Limited
BlueScope Steel Ltd. Interim financial report - 31 December Contents ABN
 ABN 16 000 011 058 Interim financial report - Contents Page Directors' report 2 Half-year financial report Consolidated income statement 7 Consolidated balance sheet 8 Consolidated statement of recognised
24 February The Manager Listings Australian Securities Exchange Limited Exchange Centre 20 Bridge Street SYDNEY NSW 2000.
 A.B.N. 16 000 011 058 Level 11, 120 Collins Street Melbourne, Victoria 3001 Ph: +61 (03) 9666 4000 Web: www.bluescope.com ASX Code: BSL 24 February 2014 The Manager Listings Australian Securities Exchange
BlueScope Steel Limited ABN Interim financial report - 31 December Contents
 ABN 16 000 011 058 Interim financial report - Contents Page Directors' report 1 Interim financial report Consolidated statement of comprehensive income 7 Consolidated statement of financial position 8
23 February The Manager Listings Australian Securities Exchange Limited Exchange Centre 20 Bridge Street SYDNEY NSW 2000.
 BlueScope Steel Limited A.B.N. 16 000 011 058 Level 11, 120 Collins Street Melbourne, Victoria 3001 Ph: +61 (03) 9666 4000 Web: www.bluescope.com ASX Code: BSL 23 February 2015 The Manager Listings Australian
For personal use only
 FY2016 Financial Results Presentation Paul O Malley, Managing Director and Chief Executive Officer Charlie Elias, Chief Financial Officer 22 August 2016 BlueScope Steel Limited. ASX Code: BSL 2 Important
FY2012 Financial Results Presentation
 FY2012 Financial Results Presentation Paul O Malley, Managing Director and Chief Executive Officer Charlie Elias, Chief Financial Officer 20 August 2012 ASX Code: BSL Page 1 Important notice THIS PRESENTATION
FY2015 Financial Results Presentation
 FY2015 Financial Results Presentation Paul O Malley, Managing Director and Chief Executive Officer Charlie Elias, Chief Financial Officer 24 August 2015 BlueScope Steel Limited. ASX Code: BSL Important
BLUESCOPE STEEL LIMITED ANNUAL REPORT 2006/07 PART 2 OF 2
 BLUESCOPE STEEL LIMITED ANNUAL REPORT 2006/07 PART 2 OF 2 CONTENTS II DIRECTORS REPORT 43 CORPORATE GOVERNANCE STATEMENT 66 CONCISE FINANCIAL REPORT 75 INDEPENDENT AUDIT REPORT TO THE MEMBERS 89 SHAREHOLDER
1H FY2018 Financial Results Presentation
 1H FY2018 Financial Results Presentation Mark Vassella, Managing Director and Chief Executive Officer Charlie Elias, Chief Financial Officer 26 February 2018 BlueScope Steel Limited. ASX Code: BSL ABN:
FY2017 Financial Results Presentation
 FY2017 Financial Results Presentation Paul O Malley, Managing Director and Chief Executive Officer Charlie Elias, Chief Financial Officer 21 August 2017 BlueScope Steel Limited. ASX Code: BSL Important
BLUESCOPE STEEL LIMITED ANNUAL REPORT 2008/09 PART 1 OF 2
 Dear Fellow Shareholder, The 2009 financial year will be known for the greatest downturn in global industrial output in post-war history. No one was immune from its effect. For BlueScope Steel, it was
1H FY2016 Financial Results Presentation
 1H FY2016 Financial Results Presentation Paul O Malley, Managing Director and Chief Executive Officer Charlie Elias, Chief Financial Officer 22 February 2016 BlueScope Steel Limited. ASX Code: BSL Important
Annual Financial Results
 Mittal Steel South Africa Limited Annual Financial Results for the 12 months ended December 2006 market & operations Rick Reato Introduction and Overview Earnings remain strong at R4.6bn - Earnings per
Citigroup s 5 th Annual Australia & New Zealand Investment Conference, London
 Citigroup s 5 th Annual Australia & New Zealand Investment Conference, London Paul O Malley, Managing Director and Chief Executive Officer March 2008 ASX Code: BSL Important notice THIS PRESENTATION IS
Analyst Meet Presentation Standalone Financial Results, Quarter Ended 30 Sep 2011
 Analyst Meet Presentation Standalone Financial Results, Quarter Ended 30 Sep 2011 Agenda Business Environment Key Developments Performance Overview Projects Update Guidance Update 2 Global economy Recovery
Doug Rowe CMA Corporation Limited
 Doug Rowe CMA Corporation Limited An emerging force in responsible recycling ASX Small to Mid Caps Conference New York, 26 February 2009 Doug Rowe MANAGING DIRECTOR Disclaimer This presentation for CMA
ThyssenKrupp Steel, London, August ThyssenKrupp Steel
 , London, August 2008 0 , London, August 2008 28 Disclaimer The information set forth and included in this presentation is not provided in connection with an offer or solicitation for the purchase or sale
For personal use only
 Financial Results Half year ended 31 December 2016 15 February 2017 Agenda Results Overview Galdino Claro, Group CEO Financial Results Fred Knechtel, Group CFO Strategic Progress & Outlook Galdino Claro,
NUPLEX INDUSTRIES LIMITED RESULTS PRESENTATION FOR THE YEAR ENDED 30 JUNE 2012 PRESENTATION AGENDA
 NUPLEX INDUSTRIES LIMITED RESULTS PRESENTATION FOR THE YEAR ENDED 30 JUNE 2012 17 AUGUST 2012 Emery Severin, Chief Executive Officer Ian Davis, Chief Financial Officer PRESENTATION AGENDA 1. Group Overview
Interim Results Presentation. For the six months ended 31 December 2018
 Interim Results Presentation For the six months ended 31 December 2018 1 STEEL & TUBE IS One of New Zealand s leading providers of steel solutions, and a proud New Zealand company, with over 65 years of
2016 Investor Presentation Bank of America Merrill Lynch - Global Metals & Mining Conference 11 May ASX: SGM USOTC: SMSMY
 2016 Investor Presentation Bank of America Merrill Lynch - Global Metals & Mining Conference 11 May 2016 ASX: SGM USOTC: SMSMY www.simsmm.com Business Highlights Company Global leader in metals and electronics
JSW Steel Limited Q1 FY Results Presentation July 25, Better Everyday
 JSW Steel Limited Q1 FY 2018-19 Results Presentation July 25, 2018 Better Everyday 1 Key highlights Q1 FY19 Standalone performance Crude Steel production: 4.11 million tonnes, up by 5% YoY Saleable Steel
Credit Suisse Annual Asian Investment Conference
 Adelaide Brighton Limited Credit Suisse Annual Asian Investment Conference Hong Kong, 27 30 March 2017 Martin Brydon Chief Executive Officer and Managing Director Adelaide Brighton Limited Overview of
Overview Sipho Nkosi: Chief Executive Officer
 Overview Sipho Nkosi: Chief Executive Officer Highlights LTIFR* LTIFR down from 0,33 to 0,25 0,36 0,39 0,33 0,25 14% increase in revenue to R17 billion 3% increase in coal production to 47Mt 105% increase
Media Release. OneSteel Lifts Net Operating Profit After Tax By 16.8% to $98.2 Million in the Six Months to December 2006
 Media Release OneSteel Lifts Net Operating Profit After Tax By 16.8% to $98.2 Million in the Six Months to December 2006 20 February 2007 OneSteel Limited Managing Director and Chief Executive Officer,
Financial Results Full year ended 30 June August 2018
 Yesterday Today Tomorrow Financial Results Full year ended 30 June 2018 24 August 2018 Disclaimer The material contained in this document is a presentation of information about the Group s activities current
IFRS Financial Statements for Q4 and FY 2014
 214 ACHIEVEMENTS 1 Record > 1.6 bln USD EBITDA MMK MC Dynamics, mln USD 2 577 2 5 2 Net debt down 1 bln USD -2% 2 63 2 3 FCF yield 37% 1 5 4 Lost opportunity of FMG stake sale in early 214 1 5 Social life:
Financial Results Half year ended 31 December February 2016
 Financial Results Half year ended 31 December 2015 19 February 2016 Improving the business and returns for shareholders Rapid deployment of business resetting actions $57 million in controllable costs
Sustainable Competitive and Reliable Supplier of Iron Ore
 Sustainable Competitive and Reliable Supplier of Iron Ore Forward looking statements Disclaimer Important Notice The purpose of this presentation is to provide general information about Fortescue Metals
2017 Full Year Results Presentation
 2017 Full Year Results Presentation Australia's leading supplier of aluminium products and solutions 5 plants; 8 extrusion presses 18 distribution centres Australia-wide Annual extrusion capacity 70k tonnes
Highveld Steel and Vanadium. Annual Results 31 December 2009
 Highveld Steel and Vanadium Corporation Limited Annual Results 31 December 2009 Disclaimer 2 Forward looking statements This document may contain forward looking information and statements about Highveld
Annual Financial Results. for the twelve months ended 31 December 2009
 Annual Financial Results for the twelve months ended 31 December 2009 1 Introduction and overview Nonkululeko Nyembezi-Heita, CEO 2 Overview (2009 vs 2008) Headline loss of R440m Headline loss per share
Third-quarter earnings burdened by raw material-related losses. Group adjusted EBITDA at EUR 56 million
 1 (23) Contents Highlights in the third quarter of 2017... 2 Highlights during the first nine months of 2017... 2 Business and financial outlook for the fourth quarter of 2017... 3 CEO Roeland Baan...
Financial results for the year ended December 2013
 Financial results for the year ended December 2013 Agenda OVERVIEW Results overview and recent developments Results analysis Steel market overview Operating results Finance Other key issues and outlook
Positive trend in earnings and strong cash flow
 Positive trend in earnings and strong cash flow Presentation of the Q3/2017 result Martin Lindqvist, President & CEO Håkan Folin, CFO October 25, 2017 Agenda Q3/2017 and performance by division Financials
Half Year Financial Results to 31 December 2017
 21 February 2018 Half Year Financial Results to 31 December 2017 Fortescue Metals Group Limited (ASX: FMG, Fortescue) Net profit of US$681 million and interim dividend of A$0.11 per share Fortescue has
Investor Presentation. ASX: SGM USOTC: SMSMY
 Investor Presentation ASX: SGM USOTC: SMSMY www.simsmm.com Business Highlights Company Global leader in metals and electronics recycling with $4.7 billion in annual sales revenue Operations in 20 countries
For personal use only
 11 May 2017 The Manager Company Announcements Office ASX Limited 20 Bridge Street SYDNEY NSW 2000 GRAINCORP LIMITED: GNC INVESTOR PRESENTATION FINANCIAL HALF YEAR ENDED 31 MARCH 2017 Please find attached
For personal use only
 23 August 2013 Full Year Results June 2013 We attach an Investor Presentation for the FY13 Full Year Results. As previously announced, a results briefing for analysts will be held at 10:30am Sydney time
A S X A N N O U N C E M E N T
 A S X A N N O U N C E M E N T DATE: 24 February 2016 Attached is the Presentation regarding Pact s Half year Financial Results for the half year ended 31 December 2015. The Presentation will occur at 10am
Tata Steel Reports Consolidated Financial Results for the Quarter and year ended March 31, 2018
 Mumbai, May 16, 2018 For immediate use Tata Steel Reports Consolidated Financial Results for the Quarter and year ended March 31, 2018 Highlights: Health and Safety: LTIFR rate of 0.46 in FY18 compared
 ASX ANNOUNCEMENT DATE: 22 February 2017 Attached is the Presentation regarding Pact s Half year Financial Results for the half year ended 31 December 2016. The Presentation will occur at 10am (Melbourne
31 December 2013 Half year results February 2014
 31 December 2013 Half year results February 2014 Disclaimer Important Notice The purpose of this presentation is to provide general information about Fortescue Metals Group Limited ("Fortescue"). It is
2017 FULL YEAR RESULTS
 2017 FULL YEAR RESULTS ESTABLISHING LEADING POSITIONS IN NEW GROWTH SECTORS Malcolm Bundey Managing Director and CEO Richard Betts Chief Financial Officer 16 August 2017 Pact Group Holdings Ltd ABN: 55
Third quarter r esults results th November 2008
 Third quarter results 2008 5th November 2008 Disclaimer Forward-Looking Statements This document may contain forward-looking information and statements about ArcelorMittal and its subsidiaries. These statements
For personal use only
 GALE PACIFIC LIMITED (ASX:GAP) ASX and Media Release 23rd August 2013 Record NPAT of $9.1 million up 7% on previous year Revenue increase of 9% to $120 million Diluted earnings per share of 3.00 cents
STEEL & TUBE HOLDINGS LIMITED. HY18 Interim Results Presentation. For the Six Months to 31 December February 2018
 STEEL & TUBE HOLDINGS LIMITED HY18 Interim Results Presentation For the Six Months to 31 December 2017 23 February 2018 BECOMING A MODERN AND INNOVATIVE COMPANY Providing Strength to New Zealand Steel
Emerging markets and mining growth
 Emerging markets and mining growth Aditya Mittal CFO and member of Group Management Board Plant Tour Brazil - 24-26 March 21 Disclaimer Forward-Looking Statements This document may contain forward-looking
25 February The Manager Market Announcements Australian Securities Exchange Limited 20 Bridge Street SYDNEY NSW 2000.
 Level 1 157 Grenfell Street Adelaide SA 5000 GPO Box 2155 Adelaide SA 5001 Adelaide Brighton Ltd ACN 007 596 018 Telephone (08) 8223 8000 International +618 8223 8000 Facsimile (08) 8215 0030 www.adbri.com.au
2017 Interim Results Corporate Presentation. 25 August 2017
 2017 Interim Results Corporate Presentation 25 August 2017 0 Disclaimer This document may contain forward-looking statements that reflect risks and uncertainties. These forward-looking statements are generally
JSW Steel post 17% higher EBIDTA at `4,501 crores
 Press Release February 06, 2019 JSW Steel post 17% higher EBIDTA at `4,501 crores Mumbai, India: JSW Steel Limited ( JSW Steel or the Company ) today reported its results for the third quarter and the
Qube Holdings Limited
 Qube Holdings Limited Investor Presentation FY 18 Interim Results 1 Disclaimer Important Notice ABN 141 497 230 53 The information contained in this Presentation or subsequently provided to the recipient
Fletcher Building Limited
 1 Fletcher Building Limited Half Year Results to 31 December 2010 16 February 2011 2 Disclaimer This annual results presentation dated 16 February 2011 provides additional comment on the media release
Conference Call Second Quarter 2008 Earnings
 Conference Call Second Quarter 2008 Earnings Paulo Penido Pinto Marques CFO and Investor Relations Director August 14, 2008 1 Disclaimer Declarations relative to business perspectives of the Company, operating
JSW Steel Limited Q2 FY Results Presentation October 31, 2017
 JSW Steel Limited Q2 FY 2017-18 Results Presentation October 31, 2017 Key highlights Q2 FY18 Standalone performance Crude Steel production: 3.94 million tonnes Saleable Steel sales: 3.92 million tonnes
For personal use only. FY2017 H1 Results February 2017
 For personal use only FY2017 H1 Results February 2017 The half year in review Broader automotive market supported by record new vehicle sales in Australia and New Zealand Strong Automotive earnings growth
Interim report Q1/2014. Sakari Tamminen, President & CEO Rautaruukki Corporation 24 April 2014
 Interim report Q1/214 Sakari Tamminen, President & CEO Rautaruukki Corporation 24 April 214 Agenda Q1 in brief, key figures Financial performance Business area performance Near-term outlook and guidance
FY2015. For personal use only. Full Year Results
 2015 For personal use only Full Year Results Create Build Operate Global Minerals Message from the Board & Executive GROUP Group PERFORMANCE Performance Our NPAT for 2015 is a solid performance and testament
AUDITED RESULTS FOR THE YEAR ENDED 31 DECEMBER 2016
 AUDITED RESULTS FOR THE YEAR ENDED 31 DECEMBER 2016 AGENDA 2 1 Opening remarks / market update 2 Financial results 3 Operational review 4 Strategy update 5 Outlook 1 2 3 4 5 OPENING REMARKS / MARKET UPDATE
Group financial results presentation for the 12-month period ended 31 December 2009
 Group financial results presentation for the 12-month period ended 31 December 2009 Overview Sipho Nkosi: Chief Executive Officer Overview 15% decrease in lost time injury frequency rate to 0,33 8% increase
For personal use only
 A S X A N N O U N C E M E N T DATE: 24 August 2016 FY2016 RESULTS PRESENTATION Attached is the Presentation regarding Pact s Financial Results for the year ended 30 June 2016. The Presentation will occur
Novolipetsk Steel. Corporate presentation Global Metals & Mining Conference Bank of America / Merrill Lynch. Barcelona, May 2009
 Novolipetsk Steel Corporate presentation Global Metals & Mining Conference Bank of America / Merrill Lynch Barcelona, 12 14 May 2009 Disclaimer This document is confidential and has been prepared by NLMK
ANN JOO RESOURCES BERHAD 22 ND ANNUAL GENERAL MEETING DATO LIM HONG THYE, GROUP MANAGING DIRECTOR 30 MAY 2018
 ANN JOO RESOURCES BERHAD 22 ND ANNUAL GENERAL MEETING DATO LIM HONG THYE, GROUP MANAGING DIRECTOR 30 MAY 2018 INDUSTRY OVERVIEW INDUSTRY PERFORMANCE STEEL BAR PRICES (SOUTHEAST ASIA) 2004-2008 Commodities
MITSUI MATSUSHIMA CO. LTD. Presentation for Business Results Ended March May 2012
 MITSUI MATSUSHIMA CO. LTD. Presentation for Business Results Ended March 212 May 212 1 Contents FY211 Financial Results P.3 FY212 Consolidated Financial Forecast P.1 Growth Strategy P.14 Appendix P.18
$115.6M 111% from $206.5M Before interest and tax. $211.7M 63% from Cash generated from ops. Net Profit After Tax
 Net Profit After Tax $115.6M 111% from 2017 Cash generated from ops $206.5M Before interest and tax Total tonnes sold 4.4M 10% from 2017 EBITDA $211.7M 63% from 2017 Interim dividend 6.0 cents 50% from
For personal use only
 HY14 Results 15 May 2014 Disclaimer This presentation includes both information that is historical in character and information that consists of forward looking statements. Forward looking statements are
Amcor Half Year Results
 Amcor Half Year Results Investor Presentation Ron Delia Managing Director & CEO Michael Casamento CFO Disclaimer Forward looking statements This presentation contains forwardlooking statements that involve
2QFY14 Results Presentation
 2QFY14 Results Presentation 1 Key highlights 3QFY14 Standalone performance Consolidated performance Key update Highest ever Crude Steel production: 3.19 million tonnes Gross Turnover: `12,651 crores Net
Adelaide Brighton Ltd ACN
 Level 1 157 Grenfell Street Adelaide SA 5000 GPO Box 2155 Adelaide SA 5001 Adelaide Brighton Ltd ACN 007 596 018 Telephone (08) 8223 8000 International +618 8223 8000 Facsimile (08) 8215 0030 www.adbri.com.au
EBOS Group Ltd. For personal use only. Results presentation Financial Year ended 30 June August 2016
 EBOS Group Ltd Results presentation Financial Year ended 30 June 2016 Patrick Davies John Cullity Chief Executive Officer Chief Financial Officer 25 August 2016 Disclaimer The information in this presentation
Boral Limited. Shareholder Review 2012
 Boral Limited Shareholder Review 2012 Chairman s Review Dr Bob Every AO Chairman The past year has been a difficult one for the Company as it continued to face tough trading conditions at the same time
Interim report Q1/2013. Sakari Tamminen, President & CEO Rautaruukki Corporation 25 April 2013
 Interim report Q1/2013 Sakari Tamminen, President & CEO Rautaruukki Corporation 25 April 2013 Agenda Q1 in brief, key figures Financial performance Business area performance Business environment Key actions
Boral Annual General Meeting Introducing the Board. Boral Annual General Meeting
 Boral Annual General Meeting 2009 1 Introducing the Board Boral Annual General Meeting 2009 2 1 Chairman s Address Ken Moss Boral Annual General Meeting 2009 3 FY2009 financial results Revenue 6% to $4.9bn
Agenda. Current Status. Business Strategy. Usiminas and the Distribution Sector. Investment Plan. Reinventing Project
 August, 2009 1S09 Agenda Current Status Business Strategy Usiminas and the Distribution Sector Investment Plan Reinventing Project 2 Current Status 3 The largest flat steel producer in Latin America and
Financial results. Half year ended 31 December Nick Hawkins Chief Financial Officer. Peter Harmer Managing Director and Chief Executive Officer
 Financial results Half year ended 31 December 2017 Peter Harmer Managing Director and Chief Executive Officer Nick Hawkins Chief Financial Officer 14 February 2018 Overview Peter Harmer Managing Director
Fortescue Metals Group
 Fortescue Metals Group March 2019 Together we are Fortescue Forward looking statements Disclaimer Important Notice The purpose of this presentation is to provide general information about Fortescue Metals
MAGNITOGORSK IRON & STEEL WORKS. Magnitogorsk Steel (MMK) Q2 and H IFRS Financial Results Presentation
 Q2 and H IFRS Financial Results Presentation") MAGNITOGORSK IRON & STEEL WORKS Magnitogorsk Steel (MMK) and H1 212 IFRS Financial Results Presentation MMK Group Highlights Financials Revenue USD 2,516 mln 4% growth q-o-q Operating profit USD 95 mln
MAGNITOGORSK IRON & STEEL WORKS Magnitogorsk Steel (MMK) and H1 212 IFRS Financial Results Presentation MMK Group Highlights Financials Revenue USD 2,516 mln 4% growth q-o-q Operating profit USD 95 mln
Note: *HRC Rolling Margin = HRC Spread/average selling price, **Net Debt = Interest Bearing Debt Cash and cash equivalents
 Management s Discussion and Analysis (MD&A) Sahaviriya Steel Industries Public Company Limited, its Subsidiaries and Jointly- Controlled Entities For the Third Quarter of 2012 1. Third Quarter of 2012
Watpac Limited. 31 December 2016 Half Year Results Presentation. 16 February 2017
 Watpac Limited 31 December 2016 Half Year Results Presentation 16 February 2017 1H FY17 Group financial summary Construction earnings down; Civil & Mining improves and project funding capacity substantially
Paul Maguire Philip Bennett Paul Witheridge Managing Director Chief Financial Officer Chief Financial Officer
 McPherson s Limited Results for the year to 30 June 2011 Paul Maguire Philip Bennett Paul Witheridge Managing Director Chief Financial Officer Chief Financial Officer McPherson s Limited McPherson s Limited
3rd Basic Materials Seminar, Exane BNP Paribas, London, March 19, ThyssenKrupp
 3rd Basic Materials Seminar, Exane BNP Paribas, London, March 19, 2008 0 3rd Basic Materials Seminar, Exane BNP Paribas, London, March 19, 2008 1 Agenda Peter Urban Vice Chairman and CFO Steel AG Overview
CRANE GROUP FULL YEAR RESULT (12 months to 30 June 2005)
") Crane Group Limited ABN 91 008 410 302 Level 14, Philips House 15 Blue Street North Sydney NSW 2060 Postal address Locked Bag 2125 North Sydney NSW 2059 Australia 3 August 2005 Telephone 61 2 8923 3000
Crane Group Limited ABN 91 008 410 302 Level 14, Philips House 15 Blue Street North Sydney NSW 2060 Postal address Locked Bag 2125 North Sydney NSW 2059 Australia 3 August 2005 Telephone 61 2 8923 3000
Pilgangoora: a world class lithium and tantalum project
 Pilgangoora: a world class lithium and tantalum project Ken Brinsden, Managing Director/CEO December Quarterly Results Presentation 25 January 2019 ASX: PLS ACCESS THE QUARTERLY INVESTOR, ANALYST AND MEDIA