Foreign Currency Usage and Percepti Title from a Survey on Cambodian Househol.
|
|
|
- Rosemary Walton
- 5 years ago
- Views:
Transcription
1 Foreign Currency Usage and Percepti Title from a Survey on Cambodian Househol Author(s) ODAJIMA, Ken Citation Issue Date Type Technical Report Text Version publisher URL Right Hitotsubashi University Repository
2 Discussion Paper No Foreign Currency Usage and Perception: Evidence from a Survey on Cambodian Households 1 Ken Odajima 2 October 24, 2016 Abstract Cambodia is highly dollarized in terms of macro aggregated figures, such as foreign currency deposit to M2. It is not well known that how households are living in the multicurrency environment. In this paper, the primary objective is to present the real picture of dollarization of households, using survey-based data from October 2014 to January This survey obtained responses from 2273 sample households from 25 provinces. It is possible to see different aspects of household behavior, such as income, expenditure, saving, borrowing, currency notes usage, potential risks of currency mismatches in the household s budget, and perception and opinions. 1 The author acknowledge financial supports from JICA Research Institute under the project Empirical Study on the Promotion of Home Currency in Cambodia. 2 Ph.D. program in economics, Graduate School of Economics, Hitotsubashi University and Japan International Cooperation Agency Research Institute. 0
3 1. Introduction It is well known that Cambodia is highly dollarized in terms of FDC/M2 or other financial sector figures. These figures give people an impression that almost all transactions are done in foreign currency. These data are useful whenever cross country comparison is needed, but sometimes mislead the real picture. It may be difficult to see how households are using foreign currency in their transactions from them. Moreover, since economic activities and their environments differ significantly by area, household behavior relating to currency usage may also be differentiated across the regions of the country. From the aggregated data it is impossible to see such difference. The survey data showed us well diversified usage of currencies of people living in multi-currency environment. The previous literature on the foreign currency borrowing of households using micro data has identified several factors that significantly impact upon household economic behavior. Seeking interest rate differentials between foreign currency loans and local currency loans, hedging foreign currency risks, or avoiding volatility on returns are some of the significant factors to drive households to borrow in foreign currencies (Fidrmuc et al. 2013). In the literature on the dollarization of transactions, network externality has also been discussed as a factor affecting foreign currency usage (Valev 2010). Thus, we know that households use foreign currencies differently depending on the types of transaction being undertaken. However, the motivations behind such foreign currency usage are complicated and not easily understandable. In this paper, the primary objective is to present the real picture of dollarization of households, using survey-based data from October 2014 to January This survey obtained responses from 2273 sample households from 25 provinces. We saw different aspects of household behavior, such as income, expenditure, saving, borrowing, currency notes usage, potential risks of currency mismatches in the household s budget, and perception and opinions. This chapter is intended to facilitate discussion on foreign currency usage, particularly from a household perspective. The rest of this chapter is organized as follows: the next section reviews the literature on dollarization from the household perspective, then the following section outlines the survey design for households, and the data collected. The remaining sections present the results of this survey from several aspects, allowing us to see the real picture of household behavior. The final section gives conclusions, and some implications for policy makers. 2. Previous Studies on the Dollarization of Household Behavior It may well be said that previous studies on dollarization with a particular focus on household behavior have been rather limited compared to those on financial institutions or enterprises. This is partly because previous studies of dollarization began by using aggregated macro data derived from the financial system, or used the financial statements of listed companies. Data that allows analysis of the actual behavior of households is not as readily available as the data commonly used for the analysis of financial institutions or enterprises. Such analyses require micro data to analyze these behaviors. In the past, studies on households were either focused on borrowing activities, or on currency preferences in terms of externality. The former strand of studies used micro survey data analyzing household choice of borrowing currency. Pellinyi and Bilek (2009) for example, used household survey data from Hungary to analyze the determinants of foreign currency borrowing. They did not find evidence that Hungarian foreign currency borrowers were better educated, wealthier or more risk-loving than their peers. However, they did find that foreign currency borrowers were likely to believe that depreciation could decrease the cost of taking loans in a local currency. Borrowers are more usually driven by macroeconomic factors such as: the high interest rate spread between local currency and foreign currency loans, a relatively stable exchange rate, and competition from foreign owned banks. Beer et al. (2010) analyzed the characteristics of FX (Swiss franc) borrowers in Austria. They used a uniquely detailed financial wealth survey of Austrian households to sketch a comprehensive profile of the attitudes and characteristics of the households involved. They found that risk seeking, affluence, and the marital status 1
4 of households, were more likely to influence the taking of a housing loan in a foreign currency. Moreover, financially literate or high-income households were more likely to take a housing loan in general. These socio-economic characteristics of foreign currency borrowers led them to conclude that Swiss franc borrowing may not be a serious threat to financial stability. Fidrmuc et al. (2013) studied the determinants of foreign currency loans of households, using data on the behavior of households in nine Central and Eastern European Countries (CEECs). Due to the richness of their data, they could examine hypothesis affecting loan currency in terms of macro variables and micro surveyed variables. However, their particular contribution to this strand of literature was that, instead of focusing on existing loans, they used information about respondents intentions to take out a loan, which they interpreted as a measure of the demand for foreign currency loans. This approach ennobled them to separate supply factors from demand factors affecting the currency choice outcome. They found that trust in domestic and foreign financial assets (saving) and institutions were the most robust determinants of foreign currency loans. Moreover, hedging factors such as remittances and household income in foreign currency would increase the probability of foreign currency loans. Beckmann & Stix (2015) studied household behavior in foreign currency borrowing, particularly focusing on their knowledge about exchange rate risk. They tested the proposition that demand for foreign currency loans was driven by a lack of knowledge about the exchange rate risk emanating from such loans. They employed individual-level survey data from eight Central and Eastern European countries that provided them with information on agents knowledge about exchange rate risks. They showed that a majority of respondents were aware that depreciation will increase loan installments, and that knowledge about exchange rate risks exerts a strong impact on the choice of the loan currency. Finally, they outlined the negative effect of exchange rate literacy on foreign currency borrowing. Later studies on the externality of currency usage also used micro surveyed data to analyze household preferences on currency. Valev (2010) examined the effect of externalities as well as that of expected depreciation on foreign currency preferences, using survey data from Bulgaria. In this survey, households were asked about currency preferences in terms of seller perspectives on real estate sales, car sales, real estate rentals, and labor sales (wages). He showed that foreign currencies were preferred in transactions if households perceive that they are widely used in the economy. But expected depreciation played a rather limited role in currency preferences. It was observed only for residents in small towns and villages. Based on these findings, he concluded that it may be necessary to distinguish between factors affecting financial dollarization and those affecting dollarization of transactions. 3. Survey Data and Methodology The authors carried out a survey of households from October 2014 to January This collected information from all 25 provinces of Cambodia (Table 3.1). We divided our sample survey into seven regions: (1) Phnom Penh; (2) Siem Reap; (3) the Northeast Area; (4) the Northwest Area; (5) the Central Area; (6) the Southeast Area; and (7) the Southwest Area. 3 In this survey, we interviewed 2,273 households; to simplify the data collection process and to avoid sampling biases, we employed stratified sampling at the provincial level according to the actual regional population from the General Census of 2008 (covering 2,841,897 households) 4. Our questionnaire covered income, expenditure, tangible and financial assets, and borrowings, and also demographical variables such as age and the education levels of household heads. In the sample, districts/communes close to the borders with Thailand and Vietnam were 3 The Northeast Area includes Kratie, Modul Kiri, Ratanak Kiri, and Stung Treng. The Northwest Area includes Banteay Meanchey, Otdar Meanchey, and Preah Vihear. Central Area includes Kampong Cham, Kampong Chhnang, Kampong Speu, Kampong Thom, and Kandal. Southeast Area includes Kampot, Kep, Prey Veng, Svay Rieng, Takeo, and Tboung Khmum. Southwest Area includes Koh Kong, Preah Sihanouk, Pursat, Battambang and Pailin. 4 We obtained the General Census 2008 from the National Institute of Statistics (NIS). 2
5 included, which enabled us to analyze the usage of foreign currency other than the US Dollar in these areas. Table 3.1: Summary of the Household Survey Sample Size Region Province Urban Rural Total Phnom Penh Siem Reap Kratie The North-East Mondul Kiri Area Ratanak Kiri Stung Treng Banteay Meanchey The North-West Area Oddar Meanchey Preah Vihear Kampot Kep South-East Area Prey Veng Svay Rieng Takeo Tbong Khmum Koh Kong Preah Sihanouk South-West Area Pursat Battambang Pailin Kandal Kampong Cham Central Area Kampong Chhnang Kampong Speu Kampong Thom Total Survey Results 4.1. Income Dollarization 3
.")
6 As discussed in Fidrmuc et al. (2013), income in foreign currencies can be interpreted as one of the major hedging measures that facilitates other economic behavior based on foreign currencies. For our study, we first classified the income sources of households into three: salary/wage income, income from business ownership, and income from agriculture (Figure 3.1). When looking into foreign currency denominated income by source of income, we observed that salary/wage income has the highest ratio of foreign to local currency, with a mean value of 38.3 percent, while business ownership and agricultural operations use around 16.9 percent and 5.0 percent respectively. Thus, salary/wage income is one of the key drivers for income dollarization. Specifically, the data suggests that among wage earners, those engaged in the garment/shoe manufacturing sector showed the highest mean value of dollarization, at 87.5%, and those in the banking/finance sector recorded the second highest at 62.2%. By area, those living in Phnom Penh showed the highest mean value of 66.2%, and those in Siem Reap had the second highest at 51.4%. Figure 3.1: Income Dollarization (by source of income and income level) The mean value of total income (excluding remittances) dollarization ratios was 21.6 percent for the 2,164 effective respondents. However, our survey showed that there were significant differences in level of income dollarization by area. We examine the degree of dollarization in different areas of Cambodia in Figure

7 Figure 3.2: Ratio of FX in Income Panel A: Ratio of FX in Income Panel B: Currency Composition of Income by Area Panel C: Currency Composition of Income by Income Level Panel D: Currency Composition of Agriculture Income by Area Panel E: Currency Composition of Income of Business Ownership by Area Panel F: Currency Composition of Wage/Salary Income by Area 5
8 Panel A in Figure 3.2: Ratio of FX in Income gives the distribution of ratios of foreign currency denominated income to total income by individual sample. Panel B gives the average level of currency composition of income by area. In Phnom Penh the ratios were uniformly distributed, while in the other areas the ratio ranging from 0-10 % was most frequently observed. In Siem Reap we observed samples evenly distributed in the range from 10% to 60%, but still the lowest range of less than 10% was the most popular one (Panel A). On average in Phnom Penh, Siem Reap, the Northwest Area, and the Southwest Area, there was a higher composition of foreign currencies in total income, while in the Northeast, Central, and Southwest Areas this ratio was lower (Panel B). Based on these results, we may say that other than in Phnom Penh, the most common currency for household income is the KHR. Though observable, foreign currency usage for income was not so common. However, in Phnom Penh it is quite common for people get their income in foreign currencies, and the degree of dollarization varies significantly. This result conforms well to the anecdotal evidence that dollarization is led by foreign direct investment (FDI) and the tourism sector, which are common in these urban areas. In the Northwest and Southwest Areas, usage of the Thai baht contributed to the rise of foreign currency usage. In the Southeast Area we observed usage of the Vietnamese Dong, but its contribution was quite low. Thus, in the west side of the country, particularly in the Northwest Area, people use the currencies of the neighboring country, as this might generate income from cross border transactions with the Thai people for example. Panel C gives the average level of currency composition of income by income level. Here we divided income levels into five categories; ranging from the lowest with a monthly income of USD 300 equivalent or less, to the highest with a monthly income above USD 5000 equivalent. In general, the data show that the higher is the income level, the higher is the ratio of foreign currency in total income. As income in foreign currencies can be a good hedging measure for other foreign currency transactions; thus those with higher incomes may use foreign currencies more frequently than those with lower incomes. Panel D gives the currency composition of average agriculture incomes by area. In general, the use of foreign currencies for agriculture income is quite limited. This can be interpreted by noting that farmers sell their products into local markets in KHR. However, the pattern is quite different in the Northwest and Southwest Areas. Use of foreign currencies dominates agriculture income, particularly the Thai Baht, which is the most common currency in these areas. Farmers there sell their products to the market or to middle man and get paid in Thai Baht. Panel E analyses the currency composition of income from business ownership. It is observed that Phnom Penh has the highest ratio of foreign currency use in business income. In the second rank is the Northwest Area, and the third is Siem Reap. It is noted that use of the Thai Baht raises the ratio in Northwest Area in general. The Central and Northeast Areas show the lowest and the second lowest ratios. Finally, Panel F gives the currency composition of wage/salary income by area. In general, it can be observed that wage/salary income is the leading source for income dollarization for households except in the Northeast Area. This is particularly clear for wage/salary earners in Phnom Penh and Siem Reap. Overall, we can say that as an individual household behavior; income dollarization is an important phenomenon for those living in Phnom Penh or to some extent in Siem Reap. In the rest of the country, particularly in the Northeast Area, foreign currency use in income generation is not significant. Even if we include remittances in household income, the main results stay the same. It is also noted that in the Northwest and in Southwest Areas the use of the Thai Baht pushes up the ratio of foreign currency composition significantly, suggesting the development of cross border transactions in these areas The Dollarization of Expenditure As discussed in Valev (2010), foreign currencies are preferred in transactions if they are already used widely in the economy. To test such perceptions of households, in the expenditure section we asked respondents for the ratios of foreign currency use by items: (1) food; (2) rice; (3) tobacco & alcoholic beverages; (4) house rent; (5) recreation & culture; (6) clothing & footwear; (7) restaurant & eating out; (8) communication; (9) education; (10) health including toiletry; (11) transportation; (12) furniture & appliances; and (13) water & electricity. The results told us that in general foreign currencies widely used in Cambodia, but depending on items its degree of usage differs significantly. Depending on the items bought, people used different currencies 6
9 for purchase or payment. Generally speaking, for food and beverage, alcohol and tobacco, water and electricity, and health including toiletries, people used the KHR. However, for house rent, communication, and furniture and appliances they used foreign currency. Depending on what they purchase or for what they pay then, they differentiate the use of currencies. This again conforms to anecdotal evidence that durables like furniture, appliances, and particularly real estate and their related services are basically transacted in dollars, while KHR is used frequently for daily and small transactions. However, in Phnom Penh, for expenditure on recreation & culture, clothing & footwear, restaurant & eating out and education, we observed a different pattern of foreign currency usage compared to the other areas. Respondents in Phnom Penh used foreign currency more frequently for such expenditure compared to the other areas. (Figure 3.3, Panels E, F, G, I) With regard to the ratios of foreign currency use to total expenditure, Panel N in Figure 3.3 shows the average level of currency composition by area. Phnom Penh has the highest ratio of foreign currency use in total expenditure. The second highest was the Southwest Area, and the third was Siem Reap. Panel O in same figure gives the average level of currency composition by income level. We found that the higher the level of income, the more foreign currency is used. This may be interpreted as households with high income level will consume more durables like furniture, appliances, and particularly real estate and their related services. Thus, the weight of daily and small items such as food or toiletry is small in their total expenditure basket. The survey results suggest that respondents use either local or foreign currency differently by type of products or services. Some items showed high usage of foreign currency in their purchase or payment patterns. In terms of daily expenditure, foreign currency is not the major method of payment for households. However, for large transactions, such as for payment of house rent or furniture/appliances, there is reliance on foreign currency The results here are consistent with the discussion of Valev (2010) that perceptions of the use of foreign currencies are influenced by an individual s personal experience of use. The results show that there is network externality in the context of Cambodia, as Valev (2010) suggested The Use of Currency exchange in Sales of Assets In order to examine household preferences for currencies in transactions, we asked which currencies they would prefer to receive for sales of their assets: real estate, furniture and appliances, motorcycles & cars, other machinery & equipment for business/personal use, livestock, and inventories for business/farming. In terms of the sales of real estate, out of 2169 respondents, 82.5% responded that they preferred US Dollars. Only 13.9% said that they preferred KHR. In terms of the sales of furniture and appliances, 61.9% of 2156 respondents preferred KHR while 34.4% said USD. For motorcycles & cars, 81.4% of 1911 respondents preferred USD, and 47.3% of 1032 respondents preferred KHR for sales of other machinery & equipment for business/personal use. For livestock, 84.0% of 886 respondents preferred KHR, and of 1402 respondents, 79.5% preferred KHR for sales of inventories for business/farming (Figure 3.3). These results are far different from what was observed in the case of Hungary by Valev (2010). There, only 35.8% of respondents preferred foreign currency for real estate sales. In case of the sales of vehicles, just 32.7% of respondents preferred foreign currencies. From these figures we may well say that the dollarization environment in Cambodia is far different from what was observed in Hungary. In fact, we may expect stronger effects to network externality for the use of foreign currencies in Cambodia. Moreover, we also observed significant differences by areas: Panels A to F of Figure 3.4 give currency preferences by area. As for sales of real estate, and motorcycles & cars, USD was the most preferred currency to receive in all areas (Panels A, C). But for livestock, and inventories for business/farming, KHR is the most preferred currency in all areas (Panels E, F). For furniture and appliances KHR is the most preferred currency except in Phnom Penh (Panel B). And for other machinery & equipment for business/personal use, foreign currencies including the Thai Baht were preferred to local currency except in the Central and Southeast areas (Panel D). 7
10 Figure 3.3: Ratio of FX in Expenditure Panel A Panel B respondents was Panel C respondents was Panel D respondents was 795. Panel E respondents was 90. Panel F respondents was 478. respondents was


11 Panel G Panel H respondents was 560. Panel I respondents was Panel J respondents was Panel K respondents was Panel L respondents was respondents was
12 Panel M Panel N: Currency Composition of Total Expenditure respondents was Panel O: Currency Composition of Total Expenditure by income level 10

13 Figure 3.4: Preferred Currency to Receive Panel A Panel B respondents was Panel C respondents was Panel D respondents was Panel E respondents was Panel F respondents was 886. respondents was
14 4.4. Saving Behavior Currency Choice for Saving To determine the saving behavior of households, respondents were asked their current saving habits. Though we asked several questions regarding assets, as it is common in Cambodia, particularly in rural areas, to save in kind, in order to identify preferences in currency usage we focused on financial assets. Because in Cambodia the financial products available for households are quite limited, we concentrated on savings in deposits in financial institutions (bank or MFI), cash held at home, and savings in other schemes. Of 2232 effective respondents, 60.5% (1351) answered that they had savings. These households saved money in the form of financial assets (cash or deposits). In terms of currency choice for such savings, 1329 households expressed their choice of currencies (Figure 3.6: Currency Choices for Saving Panel A): of these, 87.0% (1,157 households) saved their money in KHR, and 43.9% (584 households) saved their money in USD, while 32.4% (431 households) saved in both currencies. In terms of headcounts, KHR is more popular for saving than USD. Thus, we found that in terms of numbers of households, Cambodian households save in local currency rather than in USD. This feature is quite different from what we can observe in terms of the amount of deposits, here the use of KHR is quite marginalized. It is noted that those who had income in KHR tended to save only in KHR, while those possessing USD savings tended to save in both currencies. We may infer that there would be differences in terms of holding costs, accessibility, or purpose between saving in KHR and those in USD (Figures 3.5 and 3.6). Figure 3.5: The Purpose of Saving For retirement For education for my children For emergency health care To expand my business To buy a car or motobike or vihicle To buy electronic equipement, etc Other ,000 Note: This table shows the frequency of answers to the question For what purpose are you/your household head saving? Select top 3. (Q51) 12

15 Figure 3.6: Currency Choices for Saving Panel A: Currency for Savings Saving in KHR Saving in USD Yes No Total Yes No Total 1, ,329 Note: Panel A and B are the summary responses to the question asked Approximately how much cash do you and your household head have in saving, and in which currency? Some respondents were dropped from households who answered that they had some savings. Panel C: Foreign Currency Usage in Savings Panel B: Details of Savings by Currency Type of Currency Obs Mean Std. Dev. Min Max ALL KHR savings USD savings Baht savings Dong savings Others 0 Amounts > 0 KHR savings USD savings Baht savings Dong savings Others 0 Note: Expressed in USD except for observation numbers. Upper panel is the summary statistics of saving amount answered. Due to nonresponses, sample size was reduced from 1329 to The lower panel gives summary statistics using respondents with positive amounts only. Panel D: Currency Composition of Savings by area Panel E: Currency Composition of Saving by income level 13
16 Of 1329 respondents, 82.6% (1098 households) revealed the amount they saved. From Panel B in Figure 3.6: Currency Choices for Saving we can observe that USD saving has much higher value than that of KHR. Therefore, we may understand that KHR is a more popular currency for savings, but the savings in KHR are smaller than those in USD. Panel C Figure 3.6: Currency Choices for Saving shows the distribution of the ratio of foreign currency denominated savings to total savings of individuals, and Panel D gives the average level of currency composition of savings by area. When we analyze the regional differences for choice of currencies, the popularity of KHR in terms of number of households using it remained the same in all areas (Panel C), but in terms of the level of savings, foreign currencies dominated in all areas (Panel D). It is noted that in the Northwest Area, the Thai Baht makes up a significant part of total savings. Finally, Panel E shows average level of currency composition by income level. We found that the higher the level of income, the more foreign currency is saved, except for the highest income group. This may be interpreted as that the objective of saving for households with higher income levels is to purchase consumer durables or real estate often traded in USD, while for those with lower income levels it is to keep local cash on hand for emergency purposes Deposit Accounts in Financial Institutions Of a total of 2272 effective responses only 14.3% (325 households) answered that they had more than one account in financial institutions. Table 3.2: Currency Choice for Accounts gives respondents currency choice for accounts. This turned out to be different from what was observed in terms of savings in general; when it comes to accounts in financial institutions, KHR and USD had comparable levels of choice. Table 3.2: Currency Choice for Accounts Currency Type Total KHR account only 151 USD account only 120 Other Currency only 1 KHR & USD 53 KHR & Other Currency 0 USD & Other Currency 1 KHR, USD and Other Currency 0 Note: Sample is reduced to households which answered Yes to the question Do you and your household head save money? (Q50). Furthermore, households which refused to answer the currency type of deposit account were excluded from the sample. The total number of respondents in the analysis was 325. But when we examine the regional differences for choice of account currencies in Table 3.2, there are observable differences in the choice (Table 3.3). In Siem Reap, USD accounts are more common than KHR ones; while in the other areas a KHR account is more common. In Phnom Penh and the Central Area, both currencies have same level of popularity. It is noted that, in general, the percentage of households with accounts is quite low, making up only 14.3% of the total sample. Even in Phnom Penh, only 19.3% of respondents possessed a bank account. This situation is far from what we saw in answers to the savings question (of 2272 respondents, 1351 households answered that they had savings). Therefore, deposit accounts are still a very minor means of saving. 14


17 Table 3.3: The Currency Composition of Accounts KHR account USD account Having account All Phnom Penh % % SiemReap % % North-East Area % % North-West Area % % Central Area % % South-East Area % % South-West Area % % Total Note: The numbers of households having KHR deposits, USD deposits, deposits, total number of households interviewed are shown in column 1-4, respectively. The percentages of households having KHR/USD deposits relative to the number of households having deposits in any type of currency are shown Currency Choice for Future Saving Respondents were asked to show their preference on currency choice for future saving (Figure 3.7). There were two types of questions: The first asked respondents to choose either currency A or currency B for saving and the second group asked them to pick up one from three choices. The results showed that gold was the most preferable choice, while the Vietnam Dong or Thai Baht were very unpopular. Comparing KHR and USD, the USD was a slightly more popular choice for saving. Figure 3.7: Currency Choice for Future Saving These results may imply that a simple restriction or ban of USDs for cash holdings or saving would result in gold holding. Since saving in the form of gold holding cannot be integrated in the formal financial system, such a ban would limit the development of the financial sector. 15

18 4.5. The Borrowing behavior of Households Currency for borrowing Respondents were asked about the details of their outstanding loans when interviewed. The questions covered type of lenders, currencies, and amounts loans. Of the 2273 respondents, 634 households answered that they had loans. Most of these had one loan, but some had two or three loans. Thus, in total we tracked the details of 673 loans. Panel A of Figure 3.8 gives the currency denominations of 673 loans by lenders. Of the 673 loans, 436 were in USD while only 210 were in KHR. It is clear that USD is the more popular choice for borrowing than other currencies. However, it should be noted that such choices differed significantly by lender type: 76% of bank loans, 66% of MFI loans, and 50% of loans from family and friends were denominated in US Dollars. In terms of regional differences in the choice of borrowing currencies, there was a difference between Phnom Penh and the other areas of the country (Figure 3.8: Currency Choices of Borrowings Panel B) If we look more closely, in Phnom Penh, regardless of lender type, households were borrowing in USD only. However, in other areas some of the households were borrowing in KHR from all type of lenders. Thus, we might say that the loan market in Phnom Penh is totally dollarized, while in other areas, households still have room to make a choice of loan currency. Therefore, it may be appropriate to start promotion of use of KHR for loans other than in Phnom Penh. Panel D gives average level of currency composition by income level. We found that the higher was the level of income the more in foreign currency they borrowed. It may be interpreted that objectives of borrowing for households with higher income level is to purchase durables or real estates which are normally traded in USD, while for those with lower income level it is to make both ends meet. Figure 3.8: Currency Choices of Borrowings Panel A: Frequency of Loans by Currencies and Lenders Currency Lender KHR USD Baht Gold Total Commercial Bank Microfinance institution Family or friends NGO Other informal lender Others Panel B: Currency Composition of Loans by Area Refused Total

19 Panel C: Lender Composition of Loans by Area Panel D: Currency Composition of Loans by Income Level Reasons for taking out local currency/foreign currency loans Households were asked for the top two reasons for currency choice in relation to loans taken out in the past three years. In response, 782 respondents said that they had borrowed in foreign currency (FX), while 476 said that they had borrowed in local currency (Table 3.4). Table 3.4: Reasons for the Loan Currency Choice I borrowed in foreign currency because (782 respondents) Yes It is easier to borrow large amounts of money in FX 146 The purpose of my loan requires FX currency amount 537 I cannnot find a loan in KHR for the amount I need 33 The interest rate of foreign currency is better 34 The transactions I am involved in require that I pay in foreign currency 211 Don't want to risk exchange rate losses 15 Others 21 I borrowed in KHR because (476 respondents) Yes I would borrow KHR if the amount was less than 1,000 dollars 57 Interest rates are better than USD 5 Transactions are in KHR 216 Don't want to risk exchange rate losses 40 Others 232 Of the 782 respondents who borrowed in a foreign currency, 537 households said that their purpose required foreign currency, and 211 of them said that their transaction needed to be done in foreign currency. This may imply that household choice of loan currencies is influenced by the type of 17
20 network externalities discussed by Valev (2010). This accords well with the fact that households normally borrow money in order to purchase real estate, cars & motorbikes, or furniture & appliances, which are normally available in foreign currency. We also observed though that accessibility or availability matter in the choice of currency. That is, 146 households gave ease of obtaining a loan as their reason for the choice, and 33 households said that they could not find the loan amount they needed in KHR. Thus, these results tell us that size of loan may affect choice of currency. It is noted however, that level of interest rates or recognition of the risks associated with exchange rate fluctuations are not major reasons for currency choice. Of the 476 respondents in this category, 216 households who had borrowed in KHR said that their transactions needed to be done in KHR. This was the most popular reason for choosing KHR. The second most popular reason was the amount of the required loan. They chose KHR because the amount was less than 1,000 dollars equivalent. Here again we can confirm that the amount of loan matters for choice of currency; in the case of using KHR markets for this, smaller loans affected the choice of currency. In the case of KHR borrowing, we observed again that the level of interest rates or exchange rate risk did not play significant role in the choice of currency. Finally, Panel B gives the average level of currency composition of loan by area. In terms of regional difference, it is clear that in Phnom Penh loans are usually in USD. However, in other areas including Siem Reap, even though USD was still dominant; loans denominated in KHR had a 20-30% share of the market. It should again be noted that in the Northwest and Coastal Areas, the Thai baht is used as loan currency together with the USD or KHR Currency mismatches in Income /Expenditure/Borrowing Panel A in Figure 3.9 shows the relationship between the ratio of foreign currency income to total income, and the ratio of foreign currency expenditure to total expenditure by households. We observe a clear relationship between them. Households having higher ratios of income in foreign currencies did not necessarily spend in foreign currencies, and vice versa. Panel B gives the distribution of the ratio of foreign currency income to total income by currency choice of loan. It is clear that those who had loans in KHR tended to have lower ratios compared to those with a foreign currency loan. We were able to confirm this with a t-test result of two groups of samples - KHR loan holders and foreign currency loan holders (Panel C). The results show the distribution of the ratio of foreign currency saving (sum of deposit in bank/mfi and cash at home) to total saving, by currency choice of loan. It is clear that those who had loans in KHR tended to have lower ratios compared to those with a foreign currency loan. Again, we confirmed this pattern using a t-test of the relationship between KHR loan holders and foreign currency loan holders (Panel E). The survey results thus show that households have currency mismatches between income and expenditure. However, in terms of financial activity, they are trying to match currency for borrowing to that of income or saving. 18

![by Borrowing Currency Two-sample t test with equal variances Group Obs Mean Std. Err. Std. Dev. [95% Conf. Interval] Local Cu 198 17.98312 2.055469 28.92301 13.92958 22.03667 Foreign 453 32.21381 1.](/docs-images/87/96025726/images/21-1.jpg "567104 33.35392 29.13409 35.29352 combined 651 27.88558 1.282079 32.71187 25.36806 30.4031 diff -14.23068 2.732487-19.59627-8.865102 diff = mean(local Cu) - mean(foreign) t = -5.")
21 Figure 3.9: Currency Mismatch of Households Panel A: Ratios of FX currency in income and expenditure Panel B: Ratios of FX currency in Income by Borrowing Currency Panel C: T-test of Foreign Currency Income by Borrowing Currency Two-sample t test with equal variances Group Obs Mean Std. Err. Std. Dev. [95% Conf. Interval] Local Cu Foreign combined diff diff = mean(local Cu) - mean(foreign) t = Ho: diff = 0 degrees of freedom = 649 Ha: diff < 0 Ha: diff!= 0 Ha: diff > 0 Pr(T < t) = Pr( T > t ) = Pr(T > t) = Panel D: Ratios of FX currency in Saving by Borrowing Currency Panel E: T-test of Foreign Currency Saving by Borrowing Currency Two-sample t test with equal variances Group Obs Mean Std. Err. Std. Dev. [95% Conf. Interval] Local Cu Foreign combined diff diff = mean(local Cu) - mean(foreign) t = Ho: diff = 0 degrees of freedom = 321 Ha: diff < 0 Ha: diff!= 0 Ha: diff > 0 Pr(T < t) = Pr( T > t ) = Pr(T > t) =

. The respondents show that the frequency of their currency exchange is in between rarely to sometimes.")
22 4.7. Currency Exchange Almost all households declared that they exchanged currency, normally at a money changer, and to lesser extent at a shop (Figure 3.10: Money Changing). A few respondents exchange currency at banks, and very few at microfinance institutions. We divided the frequency of the currency exchange of households into four categories: rarely (about 3 times per year), sometimes (every 2-3 months), frequently (every month) and very frequently (everyday/every week). The respondents show that the frequency of their currency exchange is in between rarely to sometimes. Not surprisingly, for bilateral exchange, USD and KHR are the most usual currencies involved, followed by THB and KHR (Figure 3.11). On an area basis, households would rather exchange from USD to KHR in Phnom Penh, most parts of the Central Area, and in Takeo and Sihanoukville. This pattern could reflect the fact that these regions receive more USD than other regions, or it may mean that they demand KHR in their economic and/or financial payments. We see the same in the direction of exchange between THB and KHR; households would rather exchange from THB to KHR than in the opposite direction. At the regional level, the exchange between THB-KHR is concentrated in the provinces of the Northwest and Southwest that have borders with Thailand. As for other possible exchanges, such as those from KHR to VND, or from USD to THB, VND, or another currency, we did not see any frequent operations; in fact, this rarely or never happened. The demand for currency exchange has made foreign exchange activities more profitable. This has attracted money changers. It has also intensified competition in this market, and has resulted in minimizing the spread bid-ask of the exchange rate in Cambodia. This mild spread in turn favors the usage of foreign currency (Table 3.5). Figure 3.10: Money Changing (Place of Change) Money changer Bank MFIs Shop Family/Friend Exchange Money 20
23 Figure 3.11: Money Changing (Direction of Change) 60% 50% 40% 30% 20% 10% 0% 100% 80% 60% 40% 20% 0% KHR-USD USD-KHR KHR-THB THB-KHR 120% 100% 80% 60% 40% 20% 0% 120% 100% 80% 60% 40% 20% 0% KHR-VND VND-KHR USD-THB THB-USD 120% 100% 80% 60% 40% 20% 0% USD-VND VND-USD Note: As for direction of money change, Currency A- Currency B means that currency A is converted to currency B. For example, USD-KHR stands for currency conversion from USD to KHR. 21
24 Table 3.5: Mean Value of Frequency of Currency Exchange from One Currency to the Other across Regions Region Province KHR- USD USD- KHR KHR- THB THB- KHR KHR- VND VND- KHR USD- THB THB- USD USD- VND Phnom Penh Siem Reap NE NW SE SW CA VND- USD Kratie Mondul Kiri Ratanak Kiri Stung Treng Banteay Meanchey Otdar Meanchey Preah Vihear Kampot Kep Prey Veng Svay Rieng Takeo Tbong Khmum Koh Kong Preah Sihanouk Pursat Battambang Pailin Kampong Cham Kampong Chhnang Kampong Speu Kampong Thom Kandal Note: Data are the mean value of the exchange from one currency to another currency, for example from KHR to USD (shortcut: KHR-USD). NE: Northeast Area, NW: Northwest Area, SE: Southeast Area, SW: Southwest Area, CA: Central Area. The value is from 1 to 5, 1: is never, 2: is rarely (about 3 times per year), 3: is sometimes (every 2-3 months), 4: is frequently (every month) and 5: is very frequently (every day or every week) The reaction to Payment in Different Currencies from the Currency Quotation In the situation when foreign currency circulates at the same time as the local currency, it frequently happens that the currency in which the quotation of goods and services is made is different from the currency that the buyers dispose for actual payment. To cover this situation, we asked questions about this coincidence that allowed for different possible answers, to examine the range of household reactions (Figure 3.11). According to the answers QE and QG of the households, less than 15% said that they always pay in the currency of the bill or the request of the sellers. In this case, only a minority would negotiate the exchange rate with the sellers; 80% accept the rate that is fixed by the sellers (QA and QB). At the same time, there are around 10% of respondents that change their currency before they pay to sellers, when the bill or request requires disbursements in a currency that is different from the currency that they have, because they wish to avoid exchange losses (QF). As a result, households generally tend to keep different currencies with them in order to pay in the currency of a bill or the request of the seller. Otherwise, they will make losses. This could be in the 22

25 form of time and money, and is caused by seeking currency exchange but facing an unfavorable exchange rate fixed by the sellers when using different currencies to pay. Figure 3.11 Payment in Different Currencies 100% 90% 80% 70% 60% 50% 40% 30% 20% 10% 0% 100% 100% 100% 100% 90% 92% 81% 85% 68% 32% 19% 10% 8% 15% 0% 0% 0% 0% QA QB QC QD QE QF QG QH QI Not agree Agree Note: Question: Do you ever pay goods and services in different currency from the seller s request? Answers to the above question: QA: Yes, I do and I can negotiate the exchange rate or have an arrangement on the exchange rate. QB: Yes, I do but I cannot negotiate the exchange rate. The seller fixes it. QC: Yes, I pay by ATM transfer from my bank account and the bank does the currency exchange. QD: Yes, I pay by transferring from a Mobile account and the bank does the currency exchange. QE: No, I always pay in the currency of the bill or request. QF: No, I change the currency at the market/bank/mfi, and then pay seller in the currency of the bill. QG: No, I generally have sufficient currencies needed for payments and pay in the currency they request. QH: No I pay by doing ATM transfer from my bank account to the seller in the currency they request. QI: No, I pay by doing transferring from a mobile account to the seller in the currency they request Perceptions and Opinions The Choice of Currency Respondents were asked to indicate at which point they generally start using USD instead of KHR (Figure 3.12). The responses show that 11% of them declare that they mainly use USD when it is possible to do so in all kind of payments, from amounts of 0 to 20 dollars equivalent. Some 6% of them start using USD for payment from between dollars equivalent, and 6% of them pay with USD from 50 dollars. Overall, only 24% of households show that they have used USD notes however, and this means that another 76% usually use KHR notes in their payments. The results by region show that there is not much geographical difference in the pattern of switching from KHR to USD. 23


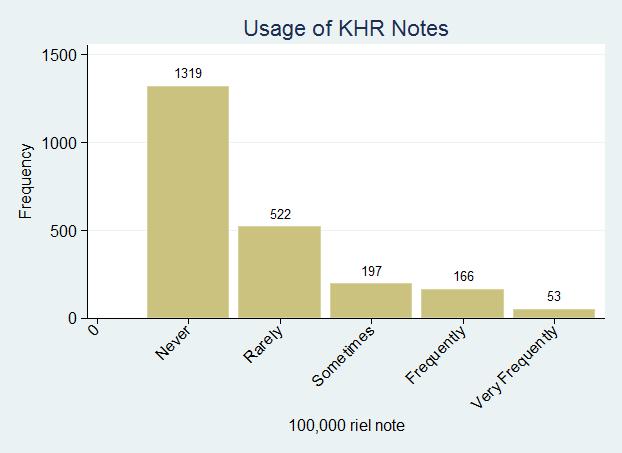
26 Figure 3.12: Choice of Currency Usage Potential Need for larger Value KHR Notes Sometimes it is said that it is inconvenient to use KHR as there is no note higher than 100,000 Riels (equivalent to USD 25), particularly for high value transactions. This inconvenience forces people to use USD notes, especially the higher value notes. Respondents were asked whether they would use more KHR if notes of higher value were issued. In the case of 200,000 Riel note, more than 60% of effective respondents answered they would use or possibly use it in all areas. In the case of 300,000 or 400,000 Riel notes, the number was less, but still a majority of respondents suggested they would use them if they became available. This confirms that the current largest KHR denomination is still small in value, and people need larger ones. However, it also shows that people would not likely to use new denominations that had values higher than USD 100 equivalent. It seems that these denominations would be inconvenient for them, perhaps because of too many zeros Usage patterns of KHR notes and USD notes To capture the usage patterns of currently available KHR notes, respondents were asked to indicate frequency of use in five levels, from never to very frequent (Figure 3.13) 5. With regard to the 50 Riel note, most respondents said they never use it, regardless of the geographical area they live in. From the 100 Riel note to the 10,000 Riel note in a high frequency of use was recorded in all areas. But from 20,000 Riel note responses began to change, ranging from never to very frequently, but showing an increasing number of negative (never or rarely) answers. In the case of the 50,000 Riel note, 39.7% of respondents answered negatively. In the case of the 100,000 Riel note, 81.5 % responded that they never, or very rarely use it. It is worth mentioning that the distribution of respondents on these questions was not so different across the regions (Table 3.6). This could show that USD notes were preferred instead of KHR for these amounts, or there are numbers of households whose living standards are too low for them to use these large values. To verify this, we also looked at those respondents who use USD notes (Figure 3.14). The numbers of respondents that sometimes, frequently and very frequently use USD notes, concentrated on the 1 dollar note (77%:1737/2258), 5 dollar note (72%:1623/2258), and the 10 dollar note (69%:1557/2258), but the numbers decrease with the 20 5 Frequency was defined as follows: never as for less than 2 or 3 times in a year, rarely as for 2 or 3 times a year, sometimes as for 2 or 3 times a month, frequently as for every month, and very frequently as for every day/every week. 24

,")

27 dollar note (61%:1377/2258), the 50-dollar note (49%:1105/2258), and the 100-dollar note (44%:983/2258), though use percentages are still relatively high. Figure 3.13: Usage of KHR Notes 25


28 26

29 Figure 3.14: Usage of USD Notes At the regional level, in the case of the 1-dollar note, the majority of respondents in Phnom Penh, Siem Reap, and the Central Area use it very frequently in their daily transactions. In Phnom Penh in particular, 78.5 % of respondents used it very frequently, while only 2.0% responded negatively, either never or rarely. 27
30 But in the Northwest Area, 43.1% of respondents responded negatively. In case of the 5 dollar or 10 dollar notes, the negative answers in Phnom Penh are 2.7% and 2.0% respectively. Those using them Very Frequently are again a majority there. In the case of the 20-dollar or higher notes, negative ratios go up to 22.8% (100-dollar), while 16.1% responded very frequently even in the case of the 100-dollar bill. It is noticeable that in the North-East area, 10.8% responded that they use the 50-dollar bill very frequently, and 11.3% said the same for the 100-dollar bill. These responses reflect the fact that the use of KHR and USD notes are in a competitive situation when the amount of payments are equal or below 10-dollars equivalent, but are also in a complementary situation to some extent as KHR banknotes exist with a wide range of denominations below 10-dollars equivalent. These two currencies are rather complementary for the amount of payments above the 10-dollar equivalent level, as the two largest denominations of KHR are not frequently used (Table 3.6). It also means that USD notes are preferable currency for paying transactions when the amounts exceed the 10-dollar equivalent level. Table 3.6: Usage of KHR High Value Notes How Frequently Do You Use 50,000 Riel Note? Refuse Don't Very Never Rarely Sometimes Frequently Know Frequently Total Phnom Penh Siem Reap North-East Area North-West Area Central Area South-East Area South-West Area Total ,273 How Frequently Do You Use 100,000 riel note? Refuse Don't Very Never Rarely Sometimes Frequently Know Frequently Total Phnom Penh Siem Reap North-East Area North-West Area Central Area South-East Area South-West Area Total , , Feelings about particular Statements When respondents were asked about their feelings on the statement all shops are required to price in KHR ; more than 90% in all areas responded positively, as either happy or very happy (Figure 3.15 and Table 3.7). In the Northeast Area, 4.2% responded negatively, as either very unhappy or unhappy. The ratios of negative answers are very low or negligible in other areas. When respondents were asked their feelings on the statement, all minimum wages are announced in KHR, negative answers, either unhappy or very unhappy, increased in all areas. The total average ratio of negative answers on this dimension was 5.0%, but was 8.6% and 6.6% in the Vietnam Border area, and in the Central Area respectively. The lowest ratio was 1.7%, observed in the Northwest area. When respondents were asked their feelings on the statement KHR is going to be the preferred currency to use in the next five years, negative answers (either unhappy or very unhappy ) were very low in 28

31 all areas, averaging 1.2%. No negative responses were recorded in Phnom Penh or in the Northwest area. The highest negative ratio was 2.1% in the Northeast, and the second highest was observed in the Central Area at 1.9%. When respondents were asked their feelings on the statement, Governments will promote the use of the KHR more, negative answers (either unhappy or very unhappy ) were also very low in all areas, 0.5% on average. No negative responses were recorded in Phnom Penh, the Northwest area, and in the Vietnam Border Area. The highest negative ratio was 1.3% in the Northeast area, and the second highest was observed in the Central Area at 0.9%. When respondents were asked about their feelings towards the statement All business transactions in Cambodia are required to be carried out in KHR, negative answers were again low in all areas, averaging 2.1%. The highest negative ratio is 3.3% in Northeast area and the second highest is observed in Central area with 2.7%. Therefore, there is a general consensus that the use of riels should be promoted by the government, and by implementing some regulatory requirements, such as currency of quotation and payment. However, there are still a very small group of people not so happy with the use of KHR for accounting the minimum wage (4.5% of households), and paying all business transactions in Cambodia (2% of households). Figure 3.15 Feelings on Statements 29
Chapter 4 Sex Composition, Age Distribution and Marital Status
 Chapter 4 Sex Composition, Age Distribution and Marital Status 4.1 Sex Composition The sex ratio of the disabled population at the national level is 129.0 as against 94.7 among the general population indicating
Dollarization in Cambodia: Behavior of Households and Enterprises in a Highly Dollarized Environment
 2 Dollarization in Cambodia: Behavior of Households and Enterprises in a Highly Dollarized Environment Ken Odajima 1 Introduction Although the Cambodian government never officially adopted dollarization,
!"#$ %&#'()%**+,-./)012343,4, )9305:,; ).<7=20"&**# ).>30,,5:,)>#3 7 8 =#D>E F** ).
%**+,-./)012343,4, )9305:,; ).<7=20&**# ).>30,,5:,)>#3 7 8 =#D>E F** ).") ! " #$ %&'(#))* !" "#$% % &# $' (&')* + * &+,!"#$ %&#'()%**+,-./)012343,4,5 61 738)9305:,; - + #.$# &+ / $, + + #.0 + / &+, ( + # %,) ).E F**
! " #$ %&'(#))* !" "#$% % &# $' (&')* + * &+,!"#$ %&#'()%**+,-./)012343,4,5 61 738)9305:,; - + #.$# &+ / $, + + #.0 + / &+, ( + # %,) ).E F**
PR Survey Results Survey on Sports and Hobbies in Mekong Five Countries (Myanmar, Cambodia, Laos, Vietnam, Thailand) SurveyMY December 2014
 SurveyMY December 2014") PR Survey Results Survey on Sports and Hobbies in Mekong Five Countries (Myanmar, Cambodia, Laos, Vietnam, Thailand) SurveyMY December 04 Basic Information of the Mekong Five Countries Myanmar Cambodia
PR Survey Results Survey on Sports and Hobbies in Mekong Five Countries (Myanmar, Cambodia, Laos, Vietnam, Thailand) SurveyMY December 04 Basic Information of the Mekong Five Countries Myanmar Cambodia
Dollarization or Dedollarization? Dollarization in Cambodia Policy to Promote the Usage of Riel
 Dollarization or Dedollarization? Dollarization in Cambodia Policy to Promote the Usage of Riel February 18, 2015 Khou Vouthy, National Bank of Cambodia Ken Odajima, JICA Research Institute 1 Deposit Dollarization-2012
KREDIT MICROFINANCE INSTITUTION PLC. FINANCIAL STATEMENTS FOR THE YEAR ENDED 31 DECEMBER 2015
 FINANCIAL STATEMENTS FINANCIAL STATEMENTS CONTENTS Pages Directors report 1-3 Independent auditor s report 4-5 Balance sheet 6 Income statement 7 Statement of changes in equity 8 Cash flow statement 9
ABA Bank Presentation Q3 2015
 ABA Bank Presentation Q3 2015 Executive Summary Shareholders 58.07% 41.93% Mr. Damir Karassayev Mr. Damir Karassayev is a private investor, managing business in South-East Asia since 2005. Currently his
ANNUAL REPORT
 ANNUAL REPORT2017 www.lolc.com.kh Map of Business Operating Areas Thailand Laos Banteay Meanchey Otdar Meanchey Oddar Meanchey Preah Vihear Rattanak Kiri Banteay Meanchey Siem Reap Siem Reap Preah Vihear
Banking and Financing in Cambodia
 Page 0 Banking and Financing in Cambodia 27 th April 2016 Agenda Page 1 1. Cambodia - Overview 2. SCB Financial Services in Cambodia 3. Our contact information Page 2 1. Cambodia - Overview 1. Cambodia
PRASAC MICROFINANCE INSTITUTION LTD FINANCIAL STATEMENTS FOR THE YEAR ENDED 31 DECEMBER 2005
 FINANCIAL STATEMENTS PRASAC MICROFINANCE INSTITUTION FINANCIAL STATEMENTS CONTENTS Pages STATEMENT OF THE SUPERVISING BOARD 1 3 AUDITORS REPORT 4 FINANCIAL STATEMENTS Balance sheet 5 Statement of changes
KREDIT MICROFINANCE INSTITUTION PLC. FINANCIAL STATEMENTS FOR THE YEAR ENDED 31 DECEMBER 2014
 FINANCIAL STATEMENTS FINANCIAL STATEMENTS CONTENTS Pages Directors report 1-4 Independent auditor s report 5-6 Balance sheet 7 Income statement 8 Statement of changes in equity 9 Cash flow statement 10
World Bank Seminar. Waivers, exemptions, and implementation issues under user fees for health care
 World Bank Seminar Waivers, exemptions, and implementation issues under user fees for health care Ricardo Bitran June 2002 1 Contents of presentation A. Rationale of user fees B. Mitigating equity problems
Co-operative Association of Cambodia (CAC)
") Co-operative Association of Cambodia (CAC) Quarterly Progress Report 1 July 2014-30 September 2014 1 Table of Contents 1. BACKGROUND... 3 2. PROJECT ACTIVITIES... 3 2.1 CREDIT AND SAVINGS... 4 2.2 CAPACITY
Co-operative Association of Cambodia (CAC) Quarterly Progress Report 1 July 2014-30 September 2014 1 Table of Contents 1. BACKGROUND... 3 2. PROJECT ACTIVITIES... 3 2.1 CREDIT AND SAVINGS... 4 2.2 CAPACITY
THANEAKEA PHUM (CAMBODIA), LTD. Financial Statements for the year ended 31 December 2012 and Report of the Independent Auditors
, LTD. Financial Statements for the year ended 31 December 2012 and Report of the Independent Auditors") THANEAKEA PHUM (CAMBODIA), LTD. Financial Statements and Report of the Independent Auditors Corporate information Company Thaneakea Phum (Cambodia), Ltd. Registration No Co. 1413/02E Registered office
THANEAKEA PHUM (CAMBODIA), LTD. Financial Statements and Report of the Independent Auditors Corporate information Company Thaneakea Phum (Cambodia), Ltd. Registration No Co. 1413/02E Registered office
Financial Dollarization: Evidence f Title Branches of Cambodian Financial Ins.
 Financial Dollarization: Evidence f Title Branches of Cambodian Financial Ins Author(s) AIBA, Daiju Citation Issue 216-1 Date Type Technical Report Text Version publisher URL http://hdl.handle.net/186/28157
PRASAC MICROFINANCE INSTITUTION LIMITED FINANCIAL STATEMENTS FOR THE YEAR ENDED 31 DECEMBER 2012
 FINANCIAL STATEMENTS FINANCIAL STATEMENTS CONTENTS Page (s) DIRECTORS REPORT 1 3 INDEPENDENT AUDITOR S REPORT 4 FINANCIAL STATEMENTS Balance sheet 5 Income statement 6 Statement of changes in shareholders
KREDIT MICROFINANCE INSTITUTION PLC. (FORMERLY KNOWN AS CREDIT LIMITED) FINANCIAL STATEMENTS FOR THE YEAR ENDED 31 DECEMBER 2013
 FINANCIAL STATEMENTS FOR THE YEAR ENDED 31 DECEMBER 2013") FINANCIAL STATEMENTS FINANCIAL STATEMENTS CONTENTS Pages Directors report 1-4 Independent auditor s report 5-6 Balance sheet 7 Income statement 8 Statement of changes in equity 9 Cash flow statement 10
FINANCIAL STATEMENTS FINANCIAL STATEMENTS CONTENTS Pages Directors report 1-4 Independent auditor s report 5-6 Balance sheet 7 Income statement 8 Statement of changes in equity 9 Cash flow statement 10
Tonle Sap Lowland Stabilisation Project PPTA: Study of Micro-Credit Systems
 Tonle Sap Lowland Stabilisation Project PPTA: Study of Micro-Credit Systems Table of Contents Summary 1 INTRODUCTION 1 1.1 Background of Micro Credit in Cambodia 1 1.2 Summary of the Banking System in
HEAD OFFICE Address: Tel: Website: Page 1
 This report has been prepared by Research and Product Development Department of NIRON Microfinance Plc., to whom any comments or requests for further information should be sent. HEAD OFFICE Address: #21-23-25,
Map of Business Operating Areas
 Map of Business Operating Areas Thailand Laos Banteay Meanchey Otdar Meanchey Oddar Meanchey Preah Vihear Rattanak Kiri Banteay Meanchey Siem Reap Siem Reap Preah Vihear Stung Treng Stung Treng Rattanak
INTEAN POALROATH RONGROEURNG LTD FINANCIAL STATEMENTS FOR THE YEAR ENDED 31 DECEMBER 2015
 LTD FINANCIAL STATEMENTS LTD FINANCIAL STATEMENTS CONTENTS Page(s) DIRECTORS REPORT 1 3 INDEPENDENT AUDITOR S REPORT 4 5 FINANCIAL STATEMENTS Balance sheet 6 Income statement 7 Statement of changes in
SACOMBANK (CAMBODIA) PLC.
 PLC.") SACOMBANK (CAMBODIA) PLC. Audited financial statements in accordance with Cambodian Accounting Standards and Regulations and Guidelines of the National Bank of Cambodia as at 31 December 2017 and for the
SACOMBANK (CAMBODIA) PLC. Audited financial statements in accordance with Cambodian Accounting Standards and Regulations and Guidelines of the National Bank of Cambodia as at 31 December 2017 and for the
Outreach Highlights with Operational Map
 Prasac Annual Report Outreach Highlights With Operational Map Outreach Highlights with Operational Map Coverage Branch network Provinces : 24 Branches : 18 Districts : 164 Sub Branches : 74 Communes :
Kyrgyz Republic: Borrowing by Individuals
 Kyrgyz Republic: Borrowing by Individuals A Review of the Attitudes and Capacity for Indebtedness Summary Issues and Observations In partnership with: 1 INTRODUCTION A survey was undertaken in September
CORPORATE PROFILE HALF YEAR 2017
 CORPORATE PROFILE HALF YEAR 2017 At ABA Bank, we have been continuously providing to our customers advanced financial products and services along with innovative technologies that make their banking experience
Proposal Report On Flood Hazard Mapping Project in Prey Veng Province
 Proposal Report On Flood Hazard Mapping Project in Prey Veng Province Prepared by CHUM Sphy. Department of Water Resources and Meteorology Prey Veng Province Cambodia FLOOD HAZARD MAPPING TRAINING COURSE
THE WOMEN OF THE WEWORK COLLECTIVE, AND THEIR HOUSEHOLDS. Baseline Survey Report
 THE WOMEN OF THE WEWORK COLLECTIVE, AND THEIR HOUSEHOLDS Baseline Survey Report WaterSHED July 2016 Table of Contents Introduction...1 The women of the WEwork Collective, and their households...2 Individual
Investment Environment and Opportunities in Cambodia
 Investment Environment and Opportunities in Cambodia Chea Vuthy Deputy Secretary General Cambodian Investment Board/ Cambodian Special Economic Zone Board Table Content Key Indicators Investment Environment
ASEAN Investment Flash Cambodia July 2013
 ASEAN Investment Flash Cambodia July 2013 2013 Reciprocus Chairman s Message Dear Readers: Over the last few months, Reciprocus has added to its track-record mandates covering India and other key Asia
QUALITY OF SOCIAL PROTECTION IN PERU
 QUALITY OF SOCIAL PROTECTION IN PERU HUGO ÑOPO 1 1 Economist, Department of Research, Inter-American Development Bank (IADB). 407 INTRODUCTION This presentation is based on the preliminary results of some
Lending Services of Local Financial Institutions in Semi-Urban and Rural Thailand
 Lending Services of Local Financial Institutions in Semi-Urban and Rural Thailand Robert Townsend Principal Investigator Joe Kaboski Research Associate June 1999 This report summarizes the lending services
Flash Eurobarometer 458. Report. The euro area
 The euro area Survey requested by the European Commission, Directorate-General for Economic and Financial Affairs and co-ordinated by the Directorate-General for Communication This document does not represent
Report Regional Microfinance Development Project NTB The Household Survey. By Ketut Budastra National Consultant
 Report Regional Microfinance Development Project NTB The Household Survey By Ketut Budastra National Consultant GTZ-PROFI PROGRAM (PN 2004.2578.9-001.00) August 2005 1. Introduction The household survey
PART 4 - ARMENIA: SUBJECTIVE POVERTY IN 2006
 PART 4 - ARMENIA: SUBJECTIVE POVERTY IN 2006 CHAPTER 11: SUBJECTIVE POVERTY AND LIVING CONDITIONS ASSESSMENT Poverty can be considered as both an objective and subjective assessment. Poverty estimates
The Impact of FAS 133 on the Risk Management Practices of End Users of Derivatives. Report of Survey Results
 The Impact of FAS 133 on the Risk Management Practices of End Users of Derivatives Report of Survey Results September 2002 Introduction Background The Financial Accounting Standards Board (FASB) issued
Chapter 2 Overview and Trends of SMEs. 2.1 Business Operation and Investment
 Chapter 2 Overview and Trends of SMEs 2.1 Business Operation and Investment 2.1.1 Manufacturing Sector SMEs in manufacturing sector accounted for 98.8 percent of all enterprises in this sector. They increased
The Role of Gold in India s Household Economy
 The Role of Gold in India s Household Economy Key findings ICE 360 SURVEY, 2014 PRICE Presentation February 2015 Copyright, People Research on India s Consumer Economy (PRICE) 1 Areas of enquiry (objectives)
Saving for Change s Research Study in Banteay Mean Chey and Kampot Provinces. Final Report Evaluation and Baseline
 Saving for Change s Research Study in Banteay Mean Chey and Kampot Provinces Final Report Evaluation and Baseline Prepared by: EMERGING MARKETS CONSULTING AND MARC WANCER Emerging Markets Consulting, Ltd.
FOREWORD Samdach Akka Moha Sena Padei Techo Hun Sen
 ANNUAL REPORT 2016 FOREWORD Cambodia still maintains the economic growth rate at average about 7% in 2016 and is estimated to grow at the same pace in the following year even the global and regional economic
Latvia - Global Financial Inclusion (Global Findex) Database 2014
 Database 2014") Microdata Library Latvia - Global Financial Inclusion (Global Findex) Database 2014 Development Research Group, Finance and Private Sector Development Unit - World Bank Report generated on: October 29,
Microdata Library Latvia - Global Financial Inclusion (Global Findex) Database 2014 Development Research Group, Finance and Private Sector Development Unit - World Bank Report generated on: October 29,
Mongolia - Global Financial Inclusion (Global Findex) Database 2014
 Database 2014") Microdata Library Mongolia - Global Financial Inclusion (Global Findex) Database 2014 Development Research Group, Finance and Private Sector Development Unit - World Bank Report generated on: October 29,
Microdata Library Mongolia - Global Financial Inclusion (Global Findex) Database 2014 Development Research Group, Finance and Private Sector Development Unit - World Bank Report generated on: October 29,
A RECURSIVE DYNAMIC CGE ASSESSMENT OF THE CAMBODIAN MILLENNIUM POVERTY REDUCTION TARGET. Sothea Oum. Centre of Policy Studies Monash University
 A RECURSIVE DYNAMIC CGE ASSESSMENT OF THE CAMBODIAN MILLENNIUM POVERTY REDUCTION TARGET Sothea Oum Centre of Policy Studies Monash University Ph: +61 3 9905 5561 Fax: +61 3 9905 2426 E-mail: sothea.oum@buseco.monash.edu.au
Issues in the Measurement and Construction of the Consumer Price Index in Pakistan
 WORKING PAPER No. 020 August 2014 Issues in the Measurement and Construction of the Consumer Price Index in Pakistan Sohail Jehangir Malik, Hina Nazli, Amina Mehmood and Asma Shahzad 8/20/2014 1. INTRODUCTION
Flash Eurobarometer 386 THE EURO AREA REPORT
 Eurobarometer THE EURO AREA REPORT Fieldwork: October 2013 Publication: November 2013 This survey has been requested by the European Commission, Directorate-General for Economic and Financial Affairs and
JICA GDT Project News
 C a p a c i t y D e v e l o p m e n t V o l. 2 JICA GDT Project News A p r. 2 0 1 3 I n d e x L i f e t i m e t o o l, C r i t i c a l T h i n k - i n g P o s t e r s a r e t h e m o s t c o s t e f f
Essays on Emerging Issues in Financ Title of a Developing Country: The Case o
 Essays on Emerging Issues in Financ Title of a Developing Country: The Case o Author(s) AIBA, Daiju Citation Issue 2017-07-31 Date Type Thesis or Dissertation Text Version ETD URL http://doi.org/10.15057/28859
A Member of PhillipCapital Group. Standard Building of KREDIT Microfinance Institution Plc.
 A Member of PhillipCapital Group Standard Building of KREDIT Microfinance Institution Plc. HIGH INTEREST RATE UP TO Pages Contents 4 Vision, Mission, and Core Values 5 Performance Highlights 7 Operating
CFPB Data Point: Becoming Credit Visible
 June 2017 CFPB Data Point: Becoming Credit Visible The CFPB Office of Research p Kenneth P. Brevoort p Michelle Kambara This is another in an occasional series of publications from the Consumer Financial
Cost of Living Survey Report
 Date: 1 April 2012 Ref: ICSC 60-1-1 VIE Cost of Living Survey Report City/Country: Hanoi, Vietnam Type of Survey: Place-to-place Date of Survey: October 2011 I. INTRODUCTION 1. A place-to-place cost-of-living
Monetary Policy Implementation and Banking Sector Development in Cambodia
 Presentation at Sophia University November 13 th, 2017, Tokyo Monetary Policy Implementation and Banking Sector Development in Cambodia Mr. Duong Sophak, Division Chief and Mr. You Vithyea, Section Chief
Capacity Building of GDT
 C a p a c i t y B u i l d i n g t h e f i r s t e d i t i o n JICA GDT Project News J a n. 2 0 1 3 I n d e x C u r r e n t P r o j e c t 2 m e m b e r s o f G D T A n n u a l P l a n f o r S e p 2 0 1
Research Library. Treasury-Federal Reserve Study of the U. S. Government Securities Market
 Treasury-Federal Reserve Study of the U. S. Government Securities Market INSTITUTIONAL INVESTORS AND THE U. S. GOVERNMENT SECURITIES MARKET THE FEDERAL RESERVE RANK of SE LOUIS Research Library Staff study
Cambodia. Impacts of Global Financial Crisis
 Cambodia Impacts of Global Financial Crisis Cambodia s economy has significant vulnerabilities to the global economic crisis. Cambodia is a small open economy with a dynamism based on a non-diversified
60% of household expenditures on housing, food and transport
 Household Budget Survey 2015/2016 17 July 2017 60% of household expenditures on housing, food and transport The Inquérito às Despesas das Famílias 2015/2016 (Household Budget Survey/HBS series) definitive
Cambridge University Press Getting Rich: America s New Rich and how they Got that Way Lisa A. Keister Excerpt More information
 PART ONE CHAPTER ONE I d Rather Be Rich This book is about wealth mobility. It is about how some people get rich while others stay poor. In particular, it is about the paths people take during their lives
Impact of fglobal lfinancial i and. Lao CBMS Sites
 Ministry of Planning and Investment Department of Statistics Impact of fglobal lfinancial i and Economic Crisis on Poverty Lao CBMS Sites 9 th Poverty and economic policy (PEP) research network policy
A Profile of Payday Loans Consumers Based on the 2014 Canadian Financial Capability Survey. Wayne Simpson. Khan Islam*
 A Profile of Payday Loans Consumers Based on the 2014 Canadian Financial Capability Survey Wayne Simpson Khan Islam* * Professor and PhD Candidate, Department of Economics, University of Manitoba, Winnipeg
A STUDY ON TRANSFORMATION OF THE BANKING SYSTEM IN CAMBODIA. CHHUN Vattana
 A STUDY ON TRANSFORMATION OF THE BANKING SYSTEM IN CAMBODIA By CHHUN Vattana THESIS Submitted to KDI School of Public Policy and Management in partial fulfillment of the requirements for the degree of
Survey of Residential Landlords
 Survey of Residential Landlords Fourth Quarter 2014 REPORT O M Carey Jones 5 Henshaw Lane, Yeadon, Leeds, LS19 7RW Telephone: 0113 250 6411 CONTENTS Page 1. INTRODUCTION & BACKGROUND 4 2. METHODOLOGY 5
PRASAC MICROFINANCE INSTITUTION LIMITED FINANCIAL STATEMENTS FOR THE YEAR ENDED 31 DECEMBER 2014
 FINANCIAL STATEMENTS FINANCIAL STATEMENTS CONTENTS Page (s) DIRECTORS REPORT 1-3 INDEPENDENT AUDITOR S REPORT 4 FINANCIAL STATEMENTS Balance sheet 5 Income statement 6 Statement of changes in shareholders
RESTRUCTURING PAPER ON A PROPOSED PROJECT RESTRUCTURING PROVINCIAL AND RURAL INFRASTRUCTURE PROJECT (CREDIT 3822-KH)
") Public Disclosure Authorized Public Disclosure Authorized Public Disclosure Authorized Public Disclosure Authorized Sustainable Development Department Southeast Asia Country Management Unit East Asia and
Public Disclosure Authorized Public Disclosure Authorized Public Disclosure Authorized Public Disclosure Authorized Sustainable Development Department Southeast Asia Country Management Unit East Asia and
Survey on the Access to Finance of Enterprises in the euro area. April to September 2017
 Survey on the Access to Finance of Enterprises in the euro area April to September 217 November 217 Contents Introduction 2 1 Overview of the results 3 2 The financial situation of SMEs in the euro area
HISTORY. Moreover, an independent writer in UK wrote a book about AMK's successful business performance. ANNUAL REPORT 2014 FINANCE AT YOUR DOORSTEP
 Table of Contents History 2 Chairman s Report 4 Chief Executive Officer s Report 6 Performance Highlights 8 Operational Coverage 10 Corporate Governance 11 Corporate Structure 12 Board of Directors & Advisory
ARLA Survey of Residential Investment Landlords
 Prepared for The Association of Residential Letting Agents ARLA Survey of Residential Investment Landlords March 2013 Prepared by O M Carey Jones 5 Henshaw Lane, Yeadon, Leeds, LS19 7RW March 2013 CONTENTS
A STUDY OF INVESTMENT AWARENESS AND PREFERENCE OF WORKING WOMEN IN JAFFNA DISTRICT IN SRI LANKA
 A STUDY OF INVESTMENT AWARENESS AND PREFERENCE OF WORKING WOMEN IN JAFFNA DISTRICT IN SRI LANKA Nagajeyakumaran Atchyuthan atchyuthan@yahoo.com Rathirani Yogendrarajah Head, Department of Financial Management,
Credit Union Members Focus Groups. Executive Summary
 Credit Union Members Focus Groups Executive Summary March, 1998 EXECUTIVE SUMMARY Top of Mind Credit union members top of mind reactions to the words credit union were overwhelmingly practical and functional
CUSTOMER AWARENESS REGARDING BANKING SERVICES
 CUSTOMER AWARENESS REGARDING BANKING SERVICES The analysis of the customer survey conducted for the present study starts with this chapter. The chapter has been organised into two sections. The first section
Cambodia Power Sector: Technical Assistance for Capacity Building of the Electricity Authority of Cambodia
 ESMAP TECHNICAL PAPER 076 Cambodia Power Sector: Technical Assistance for Capacity Building of the Electricity Authority of Cambodia December 2005 Papers in the ESMAP Technical Series are discussion documents,
CHAPTER 5: HOUSEHOLD EXPENDITURE
 CHAPTER 5: HOUSEHOLD EXPENDITURE 5.1 Introduction Household expenditure is important in any socio-economic set up because it is associated with poverty, well-being and living standards. Households can
Flash Eurobarometer 458. The euro area
 The euro area Survey requested by the European Commission, Directorate-General for Economic and Financial Affairs and co-ordinated by the Directorate-General for Communication This document does not represent
 STATEMENT OF CHANGES IN EQUITY Share Retained Capital Reverses earnings Total USD USD USD USD Balance as at 1 January 2009 270,000 7,122 56,272 333,394 Capital increase 140,000 - - 140,000 Dividend - -
Case module 10 (a): Building Trust and Assets After the Khmer Rouge CARE Community Savings Microfinance in Cambodia
: Building Trust and Assets After the Khmer Rouge CARE Community Savings Microfinance in Cambodia") Case module 10 (a): Building Trust and Assets After the Khmer Rouge CARE Community Savings Microfinance in Cambodia Decades of war have taken their toll on Cambodia s human and economic development. High
Case module 10 (a): Building Trust and Assets After the Khmer Rouge CARE Community Savings Microfinance in Cambodia Decades of war have taken their toll on Cambodia s human and economic development. High
A STUDY ON FACTORS INFLUENCING OF WOMEN POLICYHOLDER S INVESTMENT DECISION TOWARDS LIFE INSURANCE CORPORATION OF INDIA POLICIES IN CHENNAI
 www.singaporeanjbem.com A STUDY ON FACTORS INFLUENCING OF WOMEN POLICYHOLDER S INVESTMENT DECISION TOWARDS LIFE INSURANCE CORPORATION OF INDIA POLICIES IN CHENNAI Ms. S. Pradeepa, (PhD) Research scholar,
Fieldwork February March 2008 Publication October 2008
 Special Eurobarometer 298 European Commission Consumer protection in the internal market Fieldwork February March 2008 Publication October 2008 Report Special Eurobarometer 298 / Wave 69.1 TNS Opinion
1. The Armenian Integrated Living Conditions Survey
 MEASURING POVERTY IN ARMENIA: METHODOLOGICAL EXPLANATIONS Since 1996, when the current methodology for surveying well being of households was introduced in Armenia, the National Statistical Service of
November 5, Very preliminary work in progress
 November 5, 2007 Very preliminary work in progress The forecasting horizon of inflationary expectations and perceptions in the EU Is it really 2 months? Lars Jonung and Staffan Lindén, DG ECFIN, Brussels.
Payment patterns in Sweden 2018
 Payment patterns in Sweden 18 May 18 2 PAYMENT PATTERNS IN SWEDEN 18 Payment patterns in Sweden 18 Swedish households are increasingly using electronic means of payment such as bank cards and Swish, at
Household Savings in Vietnam: Insights from a 2006 Rural Household Survey
 Household Savings in Vietnam: Insights from a 2006 Rural Household Survey Carol Newman *, Finn Tarp **, Katleen Van den Broeck *** Chu Tien Quang **** and Luu Duc Khai ***** ABSTRACT The aim of this paper
In general, expenditure inequalities are lower than the income inequalities for all consumption categories as shown by the Lorenz curve for four
 In general, expenditure inequalities are lower than the income inequalities for all consumption categories as shown by the Lorenz curve for four major categories of expenditure (Figures 9 and 10). According
MONTHLY LAW UPDATE EDUCATION YOUTH AND SPORT. - Ministry of Tourism; - The Office of Council of Ministers; - Ministry of Economy and Finance;
 MONTHLY LAW UPDATE December 2015 TABLE OF CONTENTS EDUCATION YOUTH AND SPORT ENVIRONMENT HEALTH AND MEDICINES PUBLIC LAW TAXATION AND CUSTOMS TOBACCO AND DRUCG CON- TROL EDUCATION YOUTH AND SPORT Sub Decree
Economic Indicators PENARIS
 PENARIS : Table Contents Auto Sales...1 Balance of Payments...1 Balance of Trade (Merchandise Trade Balance)...1 Beige Book Fed Survey...1 Business Inventories and Sales...2 Capital Account...2 Durable
Southern Punjab Poverty Alleviation Project (SPPAP)
") Southern Punjab Poverty Alleviation Project (SPPAP) Initial Impact of Community Revolving Funds for Agriculture Input Supply (CRFAIS) ~A Pilot Activity of SPPAP National Rural Support Programme (NRSP)
Southern Punjab Poverty Alleviation Project (SPPAP) Initial Impact of Community Revolving Funds for Agriculture Input Supply (CRFAIS) ~A Pilot Activity of SPPAP National Rural Support Programme (NRSP)
PRASETHPHEAP FINANCE PLC. Financial Statements for the year ended 31 December 2017 and Report of the Independent Auditors
 PRASETHPHEAP FINANCE PLC. Financial Statements for the year ended 31 December 2017 and Report of the Independent Auditors Corporate Information Company Registration No 00003008 Registered office Shareholders
Chapter 2 Planning with Personal Financial Statements
 Chapter 2 Planning with Personal Financial Statements n Chapter Overview Among the first steps in developing a financial plan for an individual or a family is assessing one s current financial position.
Impact of SHGs on the Upliftment of Rural Women: An Economic Analysis
 EUROPEAN ACADEMIC RESEARCH Vol. II, Issue 9/ December 2014 ISSN 2286-4822 www.euacademic.org Impact Factor: 3.1 (UIF) DRJI Value: 5.9 (B+) Impact of SHGs on the Upliftment of Rural Women: An Dr. RAJANI
The Development of Government. Bond Market in Cambodia
 The Development of Government Bond Market in Cambodia Asian BondsOnline Capacity Building Workshop on Bond Market Development in Emerging East Asia 17-18 August 2016, Raffle Hotel Le Royal, Phnom Penh
Experian Consumer Credit Default Index. Monthly Update - April 2018
 Experian Consumer Credit Default Index Monthly Update - April 2018 Index Page 1 Experian Consumer Default Index () Overview What it measures? Page 2 Experian Consumer Default Index Composite & Product
Statement of Income and Expenditure for the year ended 31 December 2014 and Report of the Independent Auditors
 AGIR POUR LES FEMMES EN SITUATION PRECAIRE AFESIP CAMBODIA Statement of Income and Expenditure and Report of the Independent Auditors Contents Page 1. Statement by the management 1 2. Report of the independent
CHAPTER 6 DATA ANALYSIS AND INTERPRETATION
 208 CHAPTER 6 DATA ANALYSIS AND INTERPRETATION Sr. No. Content Page No. 6.1 Introduction 212 6.2 Reliability and Normality of Data 212 6.3 Descriptive Analysis 213 6.4 Cross Tabulation 218 6.5 Chi Square
Other MSAs Rochester Other MSAs 2017
 Q1. Which of the following industry categories best describes the type of business your company is engaged in? Total Total Total Total Engineering and Construction 10% 17% 19% 20% 18% 17% 16% 16% 18% 17%
Financial Statements for the year ended 31 December 2015 and Report of the Independent Auditors
 MAXIMA MICROFINANCE PLC. Financial Statements and Report of the Independent Auditors Corporate Information Company Maxima Microfinance Plc. Registration No Co. 7897E/2005 Registered office #21AB, Street
Cambodia: Water Resources Management Sector Development Program (Second Tranche)
") Progress Report on Tranche Release Project Number: 38558-013 Loan Number: 2673 April 2017 Cambodia: Water Resources Management Sector Development Program (Second Tranche) This consultant s document report
Progress Report on Tranche Release Project Number: 38558-013 Loan Number: 2673 April 2017 Cambodia: Water Resources Management Sector Development Program (Second Tranche) This consultant s document report
Introduction of the euro in the new member states
 EOS Gallup Europe Introduction of the euro in the new member states - Report p. 1 Introduction of the euro in the new member states Conducted by EOS Gallup Europe upon the request of the European Commission.
Incre/(Decre) % (2012 vs2011)
 % (2012 vs2011)") financial HIGHLIGHTS simplified FINANCIAL RESULTS 31.12.09-31.12.12 Year ended 31st of December F.Y. 2009 F.Y. 2010 F.Y. 2011 F.Y. 2012 Incre/(Decre) % (2012 vs2011) Assets Dynamics, mm, $ 265 Deposits
financial HIGHLIGHTS simplified FINANCIAL RESULTS 31.12.09-31.12.12 Year ended 31st of December F.Y. 2009 F.Y. 2010 F.Y. 2011 F.Y. 2012 Incre/(Decre) % (2012 vs2011) Assets Dynamics, mm, $ 265 Deposits
Microfinance in Cambodia
 Microfinance in Cambodia Presenter: Mr. Lam Roviay HITOTSUBASHI UNIVERSITY, 24 JUNE 2017 Contents-6C Cambodia the country Cambodia Banking Cambodia Microfinance Development Cambodia Microfinance Association
Assessing The Financial Literacy Level Among Women in India: An Empirical Study
 Assessing The Financial Literacy Level Among Women in India: An Empirical Study Bernadette D Silva *, Stephen D Silva ** and Roshni Subodhkumar Bhuptani *** Abstract Financial Inclusion cannot be achieved
Cambodia: Telecommunication I
 Cambodia: Telecommunication I Ex-post evaluation OECD sector 22020 / Telekommunication BMZ project ID 1995 65 805 Project-executing agency Consultant Ministry of Post and Telecommunication (MPTC) Weidleplan
Fieldwork: September 2008 Publication: October 2008
 Flash Eurobarometer 247 The Gallup Organization Flash EB N o 23 Animal Cloning Analytical report Flash Eurobarometer European Commission Family life and the needs of an ageing population Fieldwork: September
Microfinance Structure of Thailand *
 Chinese Business Review, ISSN 1537-1506 December 2013, Vol. 12, No. 12, 807-813 D DAVID PUBLISHING Microfinance Structure of Thailand * Ravipan Saleepon Srinakarinwirot University, Bangkok, Thailand This
Other MSAs Buffalo Other MSAs 2017
 Q1. Which of the following industry categories best describes the type of business your company is engaged in? Total Total Total Total Engineering and Construction 13% 17% 19% 12% 18% 20% 11% 16% 12% 17%