Dassault Systèmes Q2 & H Earnings Presentation. Bernard Charlès, Vice-Chairman & CEO Pascal Daloz, EVP, CFO & Corporate Strategy Officer
|
|
|
- Victor Gray
- 5 years ago
- Views:
Transcription


1 Dassault Systèmes Q2 & H Earnings Presentation Bernard Charlès, Vice-Chairman & CEO Pascal Daloz, EVP, CFO & Corporate Strategy Officer
2 H Highlights Non-IFRS (under IAS 18) Good H in terms of: Performance Strategy Implementation Organic licenses* revenue up +10% exfx 3DEXPERIENCE licenses revenue up +27% exfx Double-digit licenses revenue growth in all major brands: CATIA, SOLIDWORKS, ENOVIA, SIMULIA, DELMIA, GEOVIA High-growth countries software revenue up +21% exfx Double-digit software growth in Transportation & Mobility, CPG-Retail**, Marine & Offshore, AEC***, Natural Resources SOCIAL INDUSTRY EXPERIENCE 3DEXPERIENCE platform for companies to become platform companies Digital transformation of Fashion, Retail and Consumer Goods Companies Centric Software Acquisition Connected Experiences No Magic Acquisition Reconfirming FY18 guidance, adding No Magic and Centric Software acquisitions, updating FY18 EPS for Q2 currency upside and for FY lower tax rate * ** *** Licenses and other software revenue CPG-Retail: Consumer Packaged Goods-Retail AEC: Architecture, Engineering & Construction 5
3 Agenda 1 2 Strategy at Work Q2 & H1 18 Business Review 3 Q2 & H1 18 Financial Highlights 4 Q3 & FY18 Financial Objectives 5 Financial Information Appendix 6


4 7


5 The Industry Renaissance is here Yesterday Today Tomorrow 8

6 Platform for Knowledge and Know-How As an OPERATING SYSTEM As a BUSINESS MODEL Powers Industry Solution Experiences Powers Value Networks 9

7 Empowering the Workforce of the Future Made Difference Smart Industry Produktion 2030 Industrial Internet Business Revolution National Technology Initiative TECHNET Roadmap Manufacturing USA Catapult/High Value Manufacturing Industrie du Futur Industria Conectada 4.0 Operational Program Digital Manufacturing for SME Produktion der Zukunft Industry rd Modernization Connected Industries Robot Revolution Initiative 4 th Industrial Revolution Smart Manufacturing Mexico 4.0 Industry 2027 ROTA 2030 IMPRESA 4.0 Dubai Industrial strategy 2030 Kenya Vision 2030 Make in India RIE 2020 Making Indonesia 4.0 Made In China 2025 Thailand

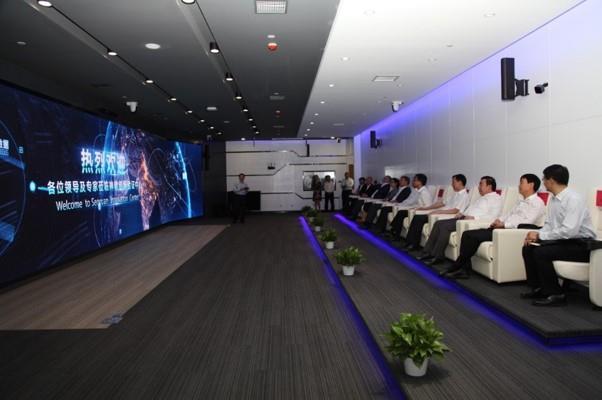
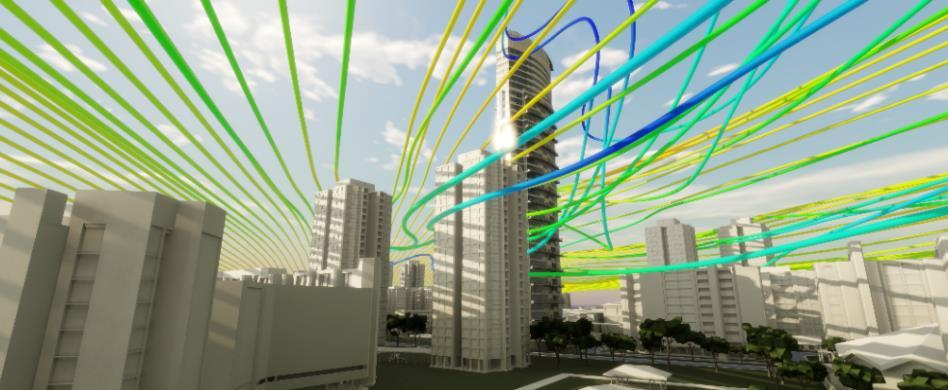
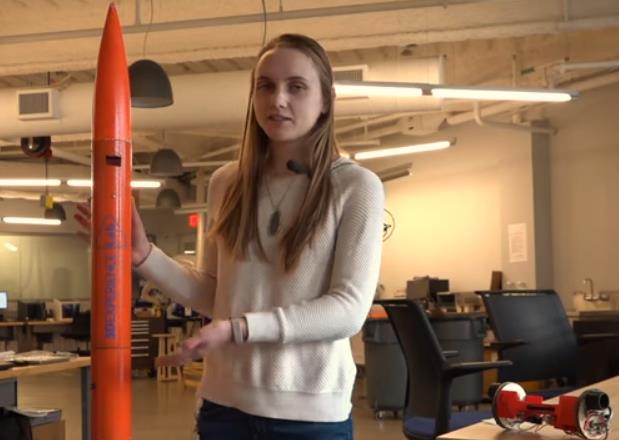
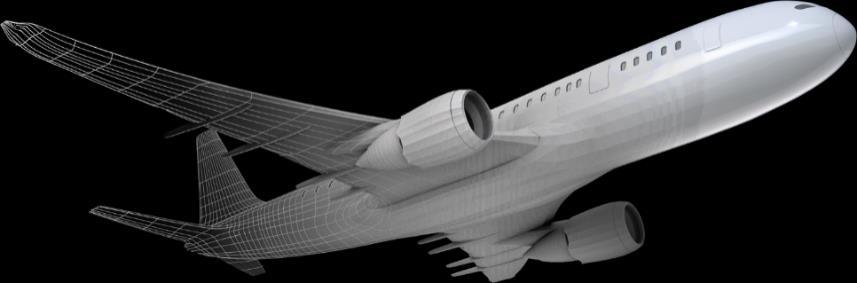
8 3DEXPERIENCE Innovation Centers China 3DEXPERIENCE Innovation Center Aerospace 3DEXPERIENCE Innovation Center 11
9 12
10 H Performance millions H1 18 Revenue 1,611 Growth +2% Growth exfx +9% Software Growth exfx +9% Licenses* Growth exfx +10% Operating Margin 28.7% EPS ( ) 1.30 EPS Evolution +13% EPS Evolution exfx +23% * Licenses and other software revenue 29% +4 pts in H1 18 H H DEXPERIENCE % V6 / Licenses Revenue* 33% 3DEXPERIENCE licenses revenue up +27% exfx * Excluding SOLIDWORKS and acquisitions 13


11 3DEXPERIENCE Momentum Energy, Process & Utilities Capital Projects Management Capital Assets Management Engineering, Procurement & Construction Owners & Operators 14

12 15


13 EDF Group Adopts 3DEXPERIENCE Platform Integrated electricity company, active in all areas of the business: generation, transmission, distribution, energy supply and trading, energy services. ~35 million customers (26 in France); 2017 sales: 70 billion Business Values: 20 year-partnership for digital transformation of EDF s nuclear engineering and its ecosystem: strengthen EDF plant performance and competitiveness of nuclear power Accessing real-time project data Designing the digital twins of nuclear plants whether they are at the design, construction or operational phase Teaming up with Capgemini Ramp-up starting in 2019 Solution: 3DEXPERIENCE Platform and nuclear engineering experiences 16

14 ExxonMobil Adopts the 3DEXPERIENCE Platform ExxonMobil is the largest publicly traded Oil & Gas company in the world, with industry leading refining, chemical manufacturing, upstream production and capital projects capabilities. Business Values: Leverage engineering data across the Upstream and Downstream business units over the full asset lifecycle Workflows to manage change in engineering artifacts to maintain accuracy over the full asset lifecycle Solution: 3DEXPERIENCE Platform with Capital Facilities Information Excellence Industry Solution Experience Digitalized framework to manage global practices such as design, procurement, and construction standards Utilizing 3D models of equipment 17


15 SOLIDWORKS POWER BY 3DEXPERIENCE CONNECT PLM Collaboration Services As an OPERATING SYSTEM As a BUSINESS MODEL Organize, share and leverage assets INDUSTRY INNOVATION BUSINESS INNOVATION REVEAL Share & reuse intellectual property Dashboard & Analytics LEVERAGE Marketplace Services GROW 3DEXPERIENCE Portfolio Power value networks 18


16 INDUSTRY Centric Software Acquisition Accelerate Digital Transformation of Fashion, Retail and Consumer Goods Companies in next generation #1 PLM for fashion, apparel, luxury and retail FY17 revenue: ~ US$ 61m up ~60% Headquartered in California 275 employees 19


17 Centric PLM in 3DS Strategy Framework Brands User Experience & Communities Industries Solution Experience 12 Geo Field Operations Customer Experience CentricPLM BT VS PS Dedicated Business Transformation Channel Consulting - Direct Sales APPLICATIONS + CONTENT + 3DEXPERIENCE platform SERVICES 20


18 PLM for Fashion, Retail and all companies launching products by collection Quality management 14 mobile apps OWNERSHIP MARKETING & SALES Calendar management Collection management MANUFACTURING VIP : visual innovation platform UPSTREAM THINKING Cost scenario Product sourcing DESIGN & ENGINEERING Material management Merchandise planning Product specifications 21


19 No Magic Strengthen foothold in Systems Engineering for new connected experiences Cyber Physical System Architecture Mechatronics Systems Cyber Physical Systems Cyber Physical Systems: Multitude of softwareintensive connected systems interacting together in an unpredictable world Cyber Physical System Architecture 22
20 Centric Software Acquisition Acquiring for cash 63% ownership of Centric Software Closed on July 24 th 2018 Payment in cash: ~$350m for 63% equity stake, including an advance payment to shareholders keeping their shares Expected to be slightly dilutive to FY18 non-ifrs earnings (due to sales seasonality) Acquisition of the remainder of the shares to take place in 2020 and 2021 Price will depend on Centric Software s revenue growth and profitability in 2019 and times 2019 or 2020 revenues 23

21 No Magic Acquisition Company profile Recognized provider of software for model-based systems engineering Privately-held company headquartered in Texas, USA ~ 170 employees Acquisition completed on June 20 th, 2018 Opportunity H2 outlook: Revenue of ~ 6m - Neutral to non-ifrs earnings New connected experiences for Aerospace & Defense, Transportation & Mobility and High-tech industries Enabling the adoption of industry standard languages such as UML, SysML, UPDM UML: Unified Modeling Language - SysML: Systems Modeling Language - UPDM: Unified Profile for for DoDAF/MODAF, USA Department of Defense Architecture Framework (DoDAF) / UK Ministry of Defense Architecture Framework (MODAF) 24
22 Agenda 1 2 Strategy at Work Q2 & H1 18 Business Review 3 Q2 & H1 18 Financial Highlights 4 Q3 & FY18 Financial Objectives 5 Financial Information Appendix 25
23 Q2 & H1 18 Non-IFRS (under IAS 18) millions Q2 18 H1 18 Revenue ,611.4 Growth +4% +2% Growth exfx +8% +9% Software Growth exfx +9% +9% Operating Margin 30.2% 28.7% Operating Margin Growth +0.1 pt +0.5 pt EPS ( ) EPS Evolution +16% +13% EPS Evolution exfx +22% +23% Top line growth Operating margin expansion And lower income tax resulting in strong EPS growth 26
24 Software Revenue by Region Non-IFRS (under IAS 18) Software Revenue Growth exfx by Region Q2 18 H1 18 Americas +7% +9% Europe +6% +6% Asia +14% +15% Strong base of comparison in Q2 (Q2 17 double-digit licenses growth in North America) Driven by Southern Europe and Russia Double-digit software revenue in all geos in H1: China, Japan, South Korea, India and AP South Software Revenue +9% +9% 27
25 Software Revenue by Brand Non-IFRS (under IAS 18) Software Revenue Growth exfx by Brand Q2 18 H1 18 CATIA +5% +5% ENOVIA +9% +7% SOLIDWORKS +11% +12% Other Software +11% +13% Double-digit licenses growth exfx Double-digit licenses growth exfx Double-digit licenses growth exfx Strong DELMIA and good SIMULIA Software Revenue +9% +9% 28

26 Safran Electronics & Defense Adopts 3DEXPERIENCE Platform World leader in optronics, avionics, electronics and critical software for both civil and defense applications. Business Values: Improve product quality & customer satisfaction Increase product innovation while managing product complexity Reduce product development costs Accelerate time to market Solution: 3DEXPERIENCE Platform with Business Operation Excellence, Co-design to target and Smarter, Faster, Lighter Industry Solution Experiences leveraging CATIA, DELMIA, ENOVIA and EXALEAD brands 29
27 DELMIA Performance * Global Industrial Operations H1 DELMIA organic software revenue up 17% exfx Performance driven by Strong performance in Manufacturing Execution System and Digital Manufacturing Tires OEMs and EV new entrants OEMs and suppliers * Non-IFRS (under IAS 18) 30


28 Bridgestone Europe Adopts DELMIA and Quintiq to support its Smart Factory concept Bridgestone Europe is responsible for the EMEA business of the world s number one tire and rubber company Key Challenges: Master tire production across 8 sites and allow plants to schedule and execute production across all departments in one integrated Scheduling and Execution application: Reduce the current planning cycle from weeks into days React in real time to disruptions in production Increase asset utilization and direct productivity Solution: DELMIA for Manufacturing Execution System QUINTIQ Scheduling & Optimization Solution 31
29 Agenda 1 2 Strategy at Work Q2 & H1 18 Business Review 3 Q2 & H1 18 Financial Highlights 4 Q3 & FY18 Financial Objectives 5 Financial Information Appendix 32
30 Software Revenue Growth Non-IFRS (under IAS 18) +3.0% +9% ex FX Software Revenue in MEUR 1, , % +9% ex FX Organic software revenue +6% exfx in Q2 and +7% in H YTD 17 YTD 18 2Q17 2Q18 33
31 Software Revenue Growth Non-IFRS (under IAS 18) Licenses and Other software revenue Subscription and Support +3,8% +10% ex FX in MEUR +2.7% +9% ex FX in MEUR % +8% ex FX 1, , % +9% ex FX YTD 17 YTD 18 2Q17 2Q18 YTD 17 YTD 18 2Q17 2Q18 Organic licenses* revenue up +8% exfx in Q2 and +10% in H1 Organic recurring revenue (Subscription and Support) up 6% exfx in Q2 and H1 reflecting solid support revenue * Licenses and other software revenue 34
32 Service Revenue & Margin Evolution Non-IFRS (under IAS 18) -3.5% +2% ex FX Service Revenue in MEUR % +4% ex FX Strong growth in 3DEXPERIENCE services activity YTD 17 YTD 18 2Q17 2Q18 Serv. Gross Margin 9.5% 6.5% 10.8% 7.4% 35
33 Operating Margin Evolution Non-IFRS (under IAS 18) +1.6% 28.7% 28.7% -0.4% 28.2% -0.7% YTD 17 Margin Currencies Organic performance Acquisitions YTD 18 Margin 36
34 EPS Non-IFRS (under IAS 18) Diluted EPS in EUR +13% % EPS up 22% exfx in Q2 and 23% in H1: top line growth, margin expansion and lower tax rate Tax rate Q217: 34.5% Q218: 27.8% H117: 33.3% H118: 28.3% YTD 17 YTD 18 2Q17 2Q18 37
35 Change in Net Financial Position IFRS (under IAS 18) ,460 Operating cash flow: +645 M, up 9% compared to H ,044 Net Financial Position Q Net Income Non cash P&L items Change in operating working capital Change in nonoperating working capital Capital expenditure Acquisitions and other investing and financing DS stock option exercise Cash dividend paid Treasury shares FX Impact Net Financial Position Q
36 Operating Cash Flow Evolution IFRS (under IAS 18) million YTD 18 YTD 17 Changes Operating Cash Flow Net income adjusted for non cash items Decrease in trade accounts receivable Increase in unearned revenue Unearned revenue up 8% exfx at constant perimeter Decrease in accrued compensation Decrease in accounts payable Decrease (increase) in income taxes payable Higher 2017 taxable income in France paid in Q and lower 2018 tax charges in the US Other
37 Agenda 1 2 Strategy at Work Q2 & H1 18 Business Review 3 Q2 & H1 18 Financial Highlights 4 Q3 & FY18 Financial Objectives 5 Financial Information Appendix 40
38 FY18 Objectives Changes from April to July Revenue variation EPS variation exfx Growth exfx Growth +8-9% % Growth Growth +0,07 +0, % +6-8% +0, ,355-3,385 3,410-3, Initial Obj. Q2 FX Q2 Services H2 Services Software Centric Software & No Magic Acquisitions* July Obj. Initial Obj. Q2 FX Activity Tax rate Centric Software July Obj. * Software & Services 41
39 Proposed Objectives Non-IFRS IAS 18 Q FY 2018 Revenue (M ) ,410-3,440 Growth +7-10% +5-6% Growth ex FX +8-11% +9-10% Operating Margin 29-30% % Operating Margin Growth -3 to -2 pts -1 to -0.5 pts EPS ( ) EPS Growth +0-6% % /$ rates / rates FY 2018 Software +9-10% exfx Q Operating margin -1 to -0.5 pt: acquisitions -1 to -0.8 pt, currencies -0.3 pt Software +9-10% exfx Licenses +9-11% exfx Licenses +6-9% exfx Tax rate of ~29.1% Operating margin -3 to -2 pts: acquisitions ~-1.5 pts Recurring ~+9% exfx EPS % (+15-17% exfx) Recurring ~+10% exfx Reminder: Q317 software revenue reflecting SOLIDWORKS revenue up 16% exfx 42
40 Agenda 1 2 Strategy at Work Q2 & H1 18 Business Review 3 Q2 & H1 18 Financial Highlights 4 Q3 & FY18 Financial Objectives 5 Financial Information Appendix 43
41 Table of Content IAS 18 Reconciliation of IFRS 15 & IAS 18 IFRS 15 Due to rounding, numbers presented throughout this and other documents may not add up precisely to the totals provided and percentages may not precisely reflect the absolute figures. 44
42 Software Revenue by Region (IAS18) IFRS in MEUR 2Q18 2Q17 Growth Growth Growth YTD 18 YTD 17 Growth ex FX ex FX Americas % +7% % +9% Europe % +7% % +7% Asia % +14% % +15% Software revenue % +9% % +10% 2Q18 2Q17 YTD 18 YTD 17 Americas Europe Asia 29% 29% 27% 31% 29% 29% 28% 31% 42% 42% 42% 41% 45
43 Software by Region (IAS18) Non-IFRS in MEUR 2Q18 2Q17 Growth Growth Growth YTD 18 YTD 17 Growth ex FX ex FX Americas % +7% % +9% Europe % +6% % +6% Asia % +14% % +15% Software revenue % +9% 1, , % +9% 2Q18 2Q17 YTD 18 YTD 17 Americas Europe Asia 28% 30% 27% 31% 29% 29% 27% 31% 42% 42% 42% 42% 46
44 Revenue by Product Line (IAS18) IFRS in MEUR 2Q18 2Q17 Growth Growth Growth YTD 18 YTD 17 Growth ex FX ex FX CATIA SW % +5% % +5% ENOVIA SW % +9% % +7% SOLIDWORKS SW % +11% % +12% Other SW % +12% % +15% Services % +4% % +2% Total revenue % +8% % +9% 2Q18 2Q17 YTD 18 YTD 17 CATIA SW ENOVIA SW SOLIDWORKS SW 26% 11% 30% 26% 11% 31% 26% 11% 31% 25% 11% 31% Other SW Services 22% 11% 22% 10% 22% 10% 23% 10% 47
45 Revenue by Product Line (IAS18) Non-IFRS in MEUR 2Q18 2Q17 Growth Growth Growth YTD 18 YTD 17 Growth ex FX ex FX CATIA SW % +5% % +5% ENOVIA SW % +9% % +7% SOLIDWORKS SW % +11% % +12% Other SW % +11% % +13% Services % +4% % +2% Total revenue % +8% 1, , % +9% 2Q18 2Q17 YTD 18 YTD 17 CATIA SW ENOVIA SW SOLIDWORKS SW 27% 10% 30% 26% 11% 31% 26% 11% 31% 26% 11% 31% Other SW Services 22% 11% 22% 10% 22% 10% 22% 10% 48
46 Software Revenue Evolution (IAS18) Non-IFRS 28% 28% 72% 72% 29% 29% 71% 71% Recurring Non-recurring YTD 17 YTD 18 2Q17 2Q18 49
47 IFRS P&L (IAS18) Three months ended June 30, Six months ended June 30, (In millions of, except per share data) YoY YoY Software revenue % 1, , % Licenses and Other software revenue % % Subscription and Support revenue % 1, , % Services revenue % % Total revenue % 1, , % Cost of Software revenue (38.2) (37.9) +0.6% (79.0) (78.4) +0.8% Cost of Services revenue (81.8) (78.9) +3.6% (161.2) (161.8) -0.4% Research and development (161.4) (156.2) +3.3% (314.0) (305.9) +2.6% Marketing and sales (262.8) (258.5) +1.7% (515.8) (518.3) -0.5% General and administrative (69.8) (61.6) +13.4% (139.6) (121.8) +14.5% Amortization of acquired intangibles (40.7) (39.3) +3.6% (82.5) (80.5) +2.5% Other operating income and expense, net (4.4) (4.5) -3.3% (6.9) (10.6) -35.3% Total operating expenses (659.0) (637.0) +3.5% (1,299.0) (1,277.3) +1.7% Operating income % % Financial revenue and other, net % % Income tax expense (46.7) (61.8) -24.4% (80.2) (102.2) -21.5% Non-controlling interest N/A 0.4 (1.3) - Net Income (to equity holders of the parent) % % Diluted net income per share (EPS) % % Average diluted shares (Million)
48 IFRS P&L (%) (IAS18) Three months ended June 30, Six months ended June 30, % of revenue % of revenue Software revenue 89.5% 89.1% 89.3% 88.7% Licenses and Other software revenue 26.1% 26.3% 24.9% 24.6% Subscription and Support revenue 63.4% 62.8% 64.5% 64.1% Services revenue 10.5% 10.9% 10.7% 11.3% Total revenue 100.0% 100.0% 100.0% 100.0% Cost of Software revenue 4.6% 4.7% 4.9% 5.0% Cost of Services revenue 9.8% 9.8% 10.0% 10.3% Research and development 19.3% 19.4% 19.5% 19.5% Marketing and sales 31.4% 32.1% 32.1% 33.1% General and administrative 8.3% 7.6% 8.7% 7.8% Amortization of acquired intangibles 4.9% 4.9% 5.1% 5.1% Other operating income and expense, net 0.5% 0.6% 0.4% 0.7% Total operating expenses 78.7% 79.0% 80.9% 81.6% Operating income 21.3% 21.0% 19.1% 18.4% Financial revenue and other, net 0.5% 1.9% 0.6% 1.4% Income tax rate (% of EBIT) 25.6% 33.5% 25.3% 32.8% Non-controlling interest 0.0% 0.0% 0.0% -0.1% Net Income (to equity holders of the parent) 16.3% 15.2% 14.7% 13.3% 51
49 Non-IFRS P&L (IAS18) Three months ended June 30, Six months ended June 30, (In millions of, except per share data) YoY YoY Software revenue % 1, , % Licenses and Other software revenue % % Subscription and Support revenue % 1, , % Services revenue % % Total revenue % 1, , % Cost of Software revenue (37.7) (37.4) +0.8% (78.1) (77.3) +1.0% Cost of Services revenue (81.2) (78.4) +3.6% (160.0) (160.6) -0.4% Research and development (150.5) (145.0) +3.8% (291.0) (282.9) +2.8% Marketing and sales (255.3) (249.6) +2.3% (501.9) (500.2) +0.4% General and administrative (61.9) (56.3) +9.9% (118.4) (110.7) +6.9% Total operating expenses (586.6) (566.8) +3.5% (1,149.5) (1,131.8) +1.6% Operating income % % Financial revenue and other, net 5.0 (0.7) N/A 10.3 (0.2) N/A Income tax expense (72.0) (83.8) -14.0% (133.7) (147.9) -9.6% Non-controlling interest N/A 0.4 (1.3) - Net Income (to equity holders of the parent) % % Diluted net income per share (EPS) % % Average diluted shares (Million)
50 Non-IFRS P&L (%) (IAS18) Three months ended June 30, Six months ended June 30, Software revenue 89.6% 89.2% 89.4% 88.7% Licenses and Other software revenue 26.0% 26.1% 24.8% 24.4% Subscription and Support revenue 63.5% 63.0% 64.6% 64.3% Services revenue 10.4% 10.8% 10.6% 11.3% Total revenue 100.0% 100.0% 100.0% 100.0% Cost of Software revenue 4.5% 4.6% 4.8% 4.9% Cost of Services revenue 9.7% 9.7% 9.9% 10.2% Research and development 17.9% 17.9% 18.1% 17.9% Marketing and sales 30.4% 30.8% 31.1% 31.7% General and administrative 7.4% 7.0% 7.3% 7.0% Total operating expenses 69.8% 69.9% 71.3% 71.8% Operating income 30.2% 30.1% 28.7% 28.2% Financial revenue and other, net 0.6% -0.1% 0.6% 0.0% Income tax rate (% of EBIT) 27.8% 34.5% 28.3% 33.3% Non-controlling interest 0.0% 0.0% 0.0% -0.1% Net Income (to equity holders of the parent) 22.2% 19.7% 21.0% 18.7% 53
51 IFRS Non-IFRS Reconciliation QTD (IAS18) Revenue and Gross Margin ( million, except % and per share data) 2018 IFRS Adjustment * No amortization of acquired intangibles is included in Software Gross margin calculation Three months ended June 30, 2018 Non-IFRS 2017 IFRS Adjustment 2017 Non-IFRS Increase (Decrease) IFRS Non-IFRS Total Revenue % 3.7% Total Revenue breakdown by activity Software revenue % 4.1% Licenses and Other software revenue % 3.3% Subscription and Support revenue % 4.5% Recurring portion of Software revenue 71% 71% 71% 71% Services revenue % -0.3% Total Revenue breakdown by product line CATIA SW revenue % 2.1% ENOVIA SW revenue % 4.1% SOLIDWORKS SW revenue % 5.9% Other SW revenue % 5.1% Services revenue % -0.3% Total Revenue breakdown by geography Americas revenue % -2.2% Europe revenue % 4.8% Asia revenue % 9.0% Gross Margin Cost of Software revenue ( 38.2) 0.5 ( 37.7) ( 37.9) 0.5 ( 37.4) 0.6% 0.8% Software Gross margin* 94.9% 95.0% 94.7% 94.8% Cost of Services revenue ( 81.8) 0.6 ( 81.2) ( 78.9) 0.5 ( 78.4) 3.6% 3.6% Services Gross margin 6.7% 7.4% 10.2% 10.8% 54
52 IFRS Non-IFRS Reconciliation YTD (IAS18) Revenue and Gross Margin ( million, except % and per share data) 2018 IFRS * No amortization of acquired intangibles is included in Software Gross margin calculation Adjustment Six months ended June 30, 2018 Non-IFRS 2017 IFRS Adjustment 2017 Non-IFRS Increase (Decrease) IFRS Non-IFRS Total Revenue 1, , , , % 2.2% Total Revenue breakdown by activity Software revenue 1, , , , % 3.0% Licenses and Other software revenue % 3.8% Subscription and Support revenue 1, , , , % 2.7% Recurring portion of Software revenue 72% 72% 72% 72% Services revenue % -3.5% Total Revenue breakdown by product line CATIA SW revenue % 1.2% ENOVIA SW revenue % 1.7% SOLIDWORKS SW revenue % 2.7% Other SW revenue % 5.8% Services revenue % -3.5% Total Revenue breakdown by geography Americas revenue % -3.3% Europe revenue % 3.0% Asia revenue % 7.6% Gross Margin Cost of Software revenue (79.0) 0.9 (78.1) (78.4) 1.0 (77.3) 0.8% 1.0% Software Gross margin* 94.5% 94.6% 94.4% 94.5% Cost of Services revenue (161.2) 1.2 (160.0) (161.8) 1.1 (160.6) -0.4% -0.4% Services Gross margin 5.9% 6.5% 8.9% 9.5% 55
53 Financial Revenue and Other Non-IFRS (IAS18) MEUR 2Q18 2Q17 var YTD 18 YTD 17 var Interest Income Interest Expense (3.9) (3.4) (0.5) (7.7) (6.7) (1.0) Financial net Income Exchange Gain / (Loss) (0.6) (4.6) (5.1) 5.2 Other Income / (Loss) (0.1) 0.8 (0.9) Total 5.0 (0.7) (0.2)
54 Exchange Rate evolution From assumptions to actual data Breakdown of P&L by currency for YTD 18 Average Exchange rates Revenue Operating Expenses % change USD 35.5% 32.2% QTD EUR/USD % EUR/JPY % JPY 12.7% 5.1% YTD EUR/USD % EUR/JPY % EUR/$ 2Q18/2Q17 Variance EUR/ 2Q18/2Q17 Variance Average EUR/$ rate > Q18 2Q in average Average EUR/ rate > Q18 2Q in average in average in average 57
55 Comparing 2Q18 with mid-range Objectives Non-IFRS Revenue Operating Operating Operating Expenses Profit Margin 2Q18 Guidances mid-range (579.9) % Growth YoY +1.5% +2.3% -0.5% -0.6pt USD impact 15.7 (8.8) pt JPY impact including hedging 2.7 (1.1) pt Other currencies and other hedging impact 2.5 (0.1) pt Total FX 20.9 (10.0) pt Activity / Cost Control / Other (3.1) pt Delta: Reported vs guidances 17.8 (6.7) pt 2Q18 Reported (586.6) % Growth YoY +3.7% +3.5% +4.0% +0.1pt 2Q17 Reported (566.8) % 58
56 Estimated FX impact on 2Q18 Op. Results Non-IFRS millions QTD Total Revenue Operating Expenses Operating Income Operating Margin 2Q18 Reported (586.6) % 2Q17 Reported (566.8) % Growth as reported +3.7% +3.5% +4.0% +0.1 pt Impact of Actual Currency Rates USD impact (23.9) 14.2 (9.7) JPY impact including hedging (3.9) 1.8 (2.1) Other currencies and other hedging impact (6.0) 4.7 (1.3) Total FX Impact adjustment (33.8) 20.7 (13.1) 2Q17 ex FX (546.1) % Growth exfx +8% +7% +10% +0.5 pt 59
57 Estimated FX impact on YTD18 Op. Results Non-IFRS millions YTD Total Revenue Operating Expenses Operating Income Operating Margin YTD2018 Reported 1,611.4 (1,149.5) % YTD2017 Reported 1,576.3 (1,131.8) % Growth as reported +2.2% +1.6% +3.9% +0.5 pt Impact of Actual Currency Rates USD impact (67.4) 40.6 (26.8) JPY impact including hedging (11.3) 4.6 (6.7) Other currencies and other hedging impact (14.2) 11.1 (3.1) Total FX Impact adjustment (92.9) 56.3 (36.6) YTD2017 ex FX 1,483.4 (1,075.5) % Growth exfx +9% +7% +13% +1.2 pt 60
58 Consolidated Statement of Cash Flows (IAS 18) (in millions of ) 2Q18 2Q17 Variation 2Q18 YTD 2Q17 YTD Variation Net income attributable to equity holders of the parent Non-controlling interest (0.1) (0.1) 0.0 (0.4) 1.3 (1.7) Net income Depreciation of property & equipment Amortization of intangible assets Other non-cash P&L items Changes in working capital (38.2) (4.5) Net Cash Provided by (Used in) Operating Activities (I) (6.0) Additions to property, equipment and intangibles (19.3) (27.4) 8.1 (31.3) (45.8) 14.5 Payment for acquisition of businesses, net of cash acquired (51.6) (7.6) (44.0) (51.6) (8.0) (43.6) Sale (Purchase) of short-term investments, net (3.0) Investments, loans and others (1.5) 0.0 (1.5) (1.5) 6.4 (7.9) Net Cash Provided by (Used in) Investing Activities (II) (31.6) (22.5) (9.1) (83.7) (43.7) (40.0) Acquisition of non-controlling interests (26.2) (14.1) (12.1) (26.2) (14.1) (12.1) (Purchase) Sale of treasury stock (10.6) (47.9) 37.3 (2.3) (44.8) 42.5 Proceeds from exercise of stock-options Cash dividend paid (38.0) (51.3) 13.3 (38.0) (51.3) 13.3 Net Cash Provided by (Used in) Financing Activities (III) (43.4) (96.8) 53.4 (22.8) (88.4) 65.6 Effect of exchange rate changes on cash and cash equivalents (IV) 75.8 (121.5) (127.8) Increase (Decrease) in Cash (V) = (I)+(II)+(III)+(IV) Cash and cash equivalents at Beginning of Period Cash and cash equivalents at End of Period Cash and cash equivalents variation
59 Balance Sheet (IAS 18) IFRS End of End of Variation End of Variation (in millions of ) Jun-18 Mar-18 Jun-18 / Mar-18 Dec-17 Jun-18 / Dec-17 Cash and cash equivalents 3, , , Short-term investments Accounts receivable, net Other current assets Total current assets 4, , , Property and equipment, net Goodwill and Intangible assets, net 3, , , Other non current assets Total Assets 7, , , Accounts payable Unearned revenue 1, , Other current liabilities Total current liabilities 1, , , Long-term debt 1, , , Other non current obligations Total long-term liabilities 1, , , Non-controlling interest Parent Shareholders' equity 4, , , Total Liabilities and Shareholders' Equity 7, , ,


60 63 Trade Accounts Receivable DSO (IAS 18)
61 Headcount by destination Closing H/C - June 2018 At Closing - TOTAL 2Q18 2Q17 % growth 4Q17 % growth 1Q18 % growth M&S + COR Ser % % % R&D + COR SW % % % G&A % % % Total % % % 41% 10% 49% At Closing - PAYROLL 2Q18 2Q17 % growth 4Q17 % growth 1Q18 % growth M&S + COR Ser % % % R&D + COR SW % % % G&A % % % Total % % % M&S + COR Ser R&D + COR SW G&A 64 At Closing - SUBCONTRACTORS 2Q18 2Q17 % growth 4Q17 % growth 1Q18 % growth
62 IFRS 2018 Objectives (IAS 18) Accounting elements not included in the non-ifrs 2018 Objectives FY 2018 estimated deferred revenue write-down of ~ 5m FY 2018 estimated share-based compensation expenses, including related social charges: ~121m FY 2018 estimated amortization of acquired intangibles: ~ 163m The non-ifrs 2018 objectives do not include any impact from other operating income and expense, net principally comprised of acquisition, integration and restructuring expenses, and from one-time items included in financial revenue and one-time tax restructuring gains and losses These estimates do not include any new stock option or share grants, or any new acquisitions or restructurings completed after July 25,
63 Table of Content IAS 18 Reconciliation of IFRS 15 & IAS 18 IFRS 15 Due to rounding, numbers presented throughout this and other documents may not add up precisely to the totals provided and percentages may not precisely reflect the absolute figures. 66
64 Summary of Principal Differences of IFRS 15 Compared to IAS 18 The Company has adopted IFRS 15 as of January 1, 2018 using the modified retrospective transition method (also called the cumulative effect method). Under this method, the transition effect is accounted for within the consolidated equity at the date of initial application, i.e. January 1, 2018, without any adjustment to the prior year comparative information. The main differences between IFRS15 and IAS18 standards are described below: Recurring software: Recurring software is comprised of subscription and support revenue. IFRS 15 has an impact on the timing of the quarterly recognition of subscription revenue but on a full year basis there is essentially no difference between IFRS 15 and IAS 18 for subscription contracts of one year in length. For the 2018 second quarter, non-ifrs recurring software revenue was million in non-ifrs under IFRS 15 and was 14.6 million higher compared to the prior IAS 18 standard. Previously, under IAS 18, we showed a ratable quarterly amount based upon the annual contract level of our on-premise subscription software. Under IFRS 15, for new contracts entered into or for contracts renewing, we have assigned an upfront value as required which is recognized in the first quarter of the contract, and the remainder which is recognized ratably during the four quarters. We continue to report both of these amounts within recurring revenue, specifically as subscription revenue (previously called periodic revenue). Historically, a higher proportion of subscription contracts are renewed in the first quarter of the year than in the other three quarters of the year. Operating expenses and sales commissions: The Company continues to expense sales commissions under the IFRS 15 standard as was done under IAS 18. Therefore, there are no capitalized sales commissions. As a result, the Company s operating expenses are identical under IFRS 15 and IAS 18. One-time permanent difference: The implementation of IFRS 15 on January 1, 2018 resulted in a one-time permanent difference between IFRS 15 and IAS 18, where the deferred portion of rental agreements concluded in prior years will not be recognized into revenue. As a result, the corresponding amount of 110 million before income taxes or 80 million net of taxes, was recorded in stockholders equity as of January 1, Initial impact on unearned revenue: At June 30, 2018 unearned revenue on the Balance Sheet under IFRS 15 is not directly comparable to December 31, 2017 balance sheet under the prior standard IAS 18. This is due to the fact that June 30, 2018 balance sheet line item unearned revenue has been reduced by 134 million, reflecting (i) the one-time permanent difference of 94 million noted above, and (ii) the higher amount of recurring revenue recognized in the first semester under IFRS 15 compared to IAS 18 in the amount of 40 million. Contract Assets: Under IFRS 15, The company classifies the right to consideration in exchange for products or services transferred to a client as either a receivable or a contract asset. Contract assets amounted to 32 million as at January 1st, 2018 (1st application impact) and to 34 million as at June 30,
65 IFRS15 IAS18 Non GAAP Reconciliation 2018 Non-IFRS 2018 Non-IFRS In millions of Euros, except per share data and percentages QTD Difference QTD YTD Difference YTD IFRS15 IAS18 IFRS15 IAS18 Total Revenue ,651.3 (39.8) 1,611.4 Total Revenue breakdown by activity Software revenue ,480.0 (39.8) 1,440.2 Licenses and Other software revenue Subscription and Support revenue ,083.4 (42.5) 1,040.9 Recurring portion of Software revenue 71% 71% 73% 72% Services revenue Total Software Revenue breakdown by product line CATIA software revenue (9.2) ENOVIA software revenue (1.2) SOLIDWORKS software revenue Other software revenue (34.0) Total Revenue breakdown by geography Americas (0.5) Europe (29.0) Asia (10.8) (10.3) Total Operating Expenses (586.6) (586.6) (1,149.5) (1,149.5) Share-based compensation expense Amortization of acquired intangibles Other operating income and expense, net Operating Income (39.8) Operating Margin 29.4% +0.8pts 30.2% 30.4% -1.7pts 28.7% Financial revenue & other, net Income tax expense (69.3) (2.7) (72.0) (144.9) 11.2 (133.7) Non-controlling interest Net Income attributable to shareholders (28.6) Diluted Net Income Per Share (3) (0.11) Non-IFRS 2018 Non-IFRS In millions of Euros QTD Difference QTD YTD Difference YTD IFRS15 IAS18 IFRS15 IAS18 Cost of revenue (118.9) (118.9) (238.1) (238.1) Research and development (150.5) (150.5) (291.0) (291.0) Marketing and sales (255.3) (255.3) (501.9) (501.9) General and administrative (61.9) (61.9) (118.4) (118.4) Total share-based compensation expense
66 Balance Sheet IFRS15 / IAS 18 Reconciliation IFRS (in millions of ) IFRS15 Difference IAS 18 Cash and cash equivalents 3, ,043.2 Short-term investments Accounts receivable, net Contract assets Other current assets Total current assets 4, ,012.3 Property and equipment, net Goodwill and Intangible assets, net 3, ,023.6 Other non current assets Total Assets 7, ,497.5 Accounts payable Contract liabilities - Unearned revenue ,016.0 Other current liabilities Total current liabilities 1, ,631.1 Long-term debt 1, ,000.0 Other non current obligations Total long-term liabilities 1, ,494.6 Non-controlling interest Parent Shareholders' equity 4, ,370.4 Total Liabilities and Shareholders' Equity 7, ,497.5 Difference in Accounts receivable, net: + 18m, of which: + 36m from Contract assets; (16)m upfront licenses opening adjustment; (2)m carve in. Difference in Contract assets: (36)m, of which: (32)m opening adjustment; (4)m 2018 first half variation. Difference in Deferred revenue: +134m, of which: + 94m opening adjustment; + 40m 2018 first half P&L. Difference in Tax: (41)m, of which: (8)m in Other non-current assets; (27)m in Other current liabilities; (6)m in Other non-current liabilities. 69
67 Table of Content IAS 18 Reconciliation of IFRS 15 & IAS 18 IFRS 15 Due to rounding, numbers presented throughout this and other documents may not add up precisely to the totals provided and percentages may not precisely reflect the absolute figures. 70
68 IFRS Non-IFRS Reconciliation QTD (IFRS15) Revenue and Gross Margin * No amortization of acquired intangibles is included in Software Gross margin calculation ( million, except % and per share data) Three months ended June 30, 2018 IFRS Adjustment 2018 Non-IFRS Total Revenue Total Revenue breakdown by activity Software revenue Licenses and Other software revenue Subscription and Support revenue Recurring portion of Software revenue 71% 71% Services revenue Total Revenue breakdown by product line CATIA SW revenue ENOVIA SW revenue SOLIDWORKS SW revenue Other SW revenue Services revenue Total Revenue breakdown by geography Americas revenue Europe revenue Asia revenue Gross Margin Cost of Software revenue ( 38.2) 0.5 ( 37.7) Software Gross margin* 94.8% 94.9% Cost of Services revenue ( 81.8) 0.6 ( 81.2) Services Gross margin 6.7% 7.4% As set forth in DS-17Q4 Earnings Presentation, prior year financial data could not be restated in IFRS15 due to the transition methodology used. Therefore, there is no available comparison with Q figures under IFRS15. 71
69 IFRS Non-IFRS Reconciliation QTD (IFRS15) Expenses & Earnings Three months ended June 30, ( million, except % and per share data) Adjustment IFRS Non-IFRS Total Operating Expenses ( 659.0) 72.4 ( 586.6) Share-based compensation expense ( 27.3) Amortization of acquired intangibles ( 40.7) Other operating income and expense, net ( 4.4) Operating Income Operating Margin 20.4% 29.4% Financial revenue & other, net Income tax expense ( 44.0) ( 25.3) ( 69.3) Non-controlling interest Net Income attributable to shareholders Diluted net income per share, in EUR As set forth in DS-17Q4 Earnings Presentation, prior year financial data could not be restated in IFRS15 due to the transition methodology used. Therefore, there is no available comparison with Q figures under IFRS15. Three months ended June 30, ( million) Adjust. IFRS Non-IFRS Cost of revenue ( 120.0) 1.1 ( 118.9) Research and development ( 161.4) 10.8 ( 150.5) Marketing and sales ( 262.8) 7.5 ( 255.3) General and administrative ( 69.8) 7.9 ( 61.9) Total Share-based compensation expense
70 IFRS Non-IFRS Reconciliation YTD (IFRS15) Revenue and Gross Margin * No amortization of acquired intangibles is included in Software Gross margin calculation ( million, except % and per share data) Six months ended June 30, 2018 IFRS Adjustment 2018 Non-IFRS Total Revenue 1, ,651.3 Total Revenue breakdown by activity Software revenue 1, ,480.0 Licenses and Other software revenue Subscription and Support revenue 1, ,083.4 Recurring portion of Software revenue 73% 73% Services revenue Total Revenue breakdown by product line CATIA SW revenue ENOVIA SW revenue SOLIDWORKS SW revenue Other SW revenue Services revenue Total Revenue breakdown by geography Americas revenue Europe revenue Asia revenue Gross Margin Cost of Software revenue (79.0) 0.9 (78.1) Software Gross margin* 94.6% 94.7% Cost of Services revenue (161.2) 1.2 (160.0) Services Gross margin 5.9% 6.5% As set forth in DS-17Q4 Earnings Presentation, prior year financial data could not be restated in IFRS15 due to the transition methodology used. Therefore, there is no available comparison with Q figures under IFRS15. 73
71 IFRS Non-IFRS Reconciliation YTD (IFRS15) Expenses & Earnings Six months ended June 30, ( million, except % and per share data) Adjustment IFRS Non-IFRS Total Operating Expenses (1,299.0) (1,149.5) Share-based compensation expense ( 60.2) Amortization of acquired intangibles ( 82.5) Other operating income and expense, net ( 6.9) Operating Income Operating Margin 21.1% 30.4% Financial revenue & other, net Income tax expense ( 91.5) ( 53.5) ( 144.9) Non-controlling interest Net Income attributable to shareholders Diluted net income per share, in EUR As set forth in DS-17Q4 Earnings Presentation, prior year financial data could not be restated in IFRS15 due to the transition methodology used. Therefore, there is no available comparison with Q figures under IFRS15. Six months ended June 30, ( million) Adjust. IFRS Non-IFRS Cost of revenue ( 240.2) 2.1 ( 238.1) Research and development ( 314.0) 23.1 ( 291.0) Marketing and sales ( 515.8) 13.9 ( 501.9) General and administrative ( 139.6) 21.1 ( 118.4) Total Share-based compensation expense
72 IFRS - Non-IFRS P&L QTD (IFRS15) Three months ended June 30, (In millions of, except per share data) 2018 IFRS Adjustment 2018 Non-IFRS Software revenue Licenses and Other software revenue Subscription and Support revenue Services revenue Total revenue As set forth in DS-17Q4 Earnings Presentation, prior year financial data could not be restated in IFRS15 due to the transition methodology used. Therefore, there is no available comparison with Q figures under IFRS15. Cost of Software revenue (38.2) 0.5 (37.7) Cost of Services revenue (81.8) 0.6 (81.2) Research and development (161.4) 10.8 (150.5) Marketing and sales (262.8) 7.5 (255.3) General and administrative (69.8) 7.9 (61.9) Amortization of acquired intangibles (40.7) Other operating income and expense, net (4.4) Total operating expenses (659.0) 72.4 (586.6) Operating income Financial revenue and other, net Income tax expense (44.0) (25.3) (69.3) Non-controlling interest Net Income (to equity holders of the parent) Diluted net income per share (EPS) Average diluted shares (Million)
73 IFRS - Non-IFRS P&L YTD (IFRS15) Six months ended June 30, (In millions of, except per share data) 2018 IFRS Adjustment 2018 Non-IFRS Software revenue 1, ,480.0 Licenses and Other software revenue Subscription and Support revenue 1, ,083.4 Services revenue Total revenue 1, ,651.3 As set forth in DS-17Q4 Earnings Presentation, prior year financial data could not be restated in IFRS15 due to the transition methodology used. Therefore, there is no available comparison with Q figures under IFRS15. Cost of Software revenue (79.0) 0.9 (78.1) Cost of Services revenue (161.2) 1.2 (160.0) Research and development (314.0) 23.1 (291.0) Marketing and sales (515.8) 13.9 (501.9) General and administrative (139.6) 21.1 (118.4) Amortization of acquired intangibles (82.5) Other operating income and expense, net (6.9) Total operating expenses (1,299.0) (1,149.5) Operating income Financial revenue and other, net Income tax expense (91.5) (53.5) (144.9) Non-controlling interest Net Income (to equity holders of the parent) Diluted net income per share (EPS) Average diluted shares (Million)
74 IFRS - Non-IFRS P&L (%) (IFRS15) IFRS QTD NON-IFRS QTD IFRS YTD NON-IFRS YTD % of revenue Software revenue 89.4% 89.4% 89.6% 89.6% Licenses and Other software revenue 26.3% 26.2% 24.1% 24.0% Subscription and Support revenue 63.1% 63.3% 65.5% 65.6% Services revenue 10.6% 10.6% 10.4% 10.4% Total revenue 100.0% 100.0% 100.0% 100.0% 2018 % of revenue 2018 As set forth in DS-17Q4 Earnings Presentation, prior year financial data could not be restated in IFRS15 due to the transition methodology used. Therefore, there is no available comparison with Q figures under IFRS15. Cost of Software revenue 4.6% 4.5% 4.8% 4.7% Cost of Services revenue 9.9% 9.8% 9.8% 9.7% Research and development 19.5% 18.1% 19.1% 17.6% Marketing and sales 31.8% 30.7% 31.3% 30.4% General and administrative 8.4% 7.5% 8.5% 7.2% Amortization of acquired intangibles 4.9% 0.0% 5.0% 0.0% Other operating income and expense, net 0.5% 0.0% 0.4% 0.0% Total operating expenses 79.6% 70.6% 78.9% 69.6% Operating income 20.4% 29.4% 21.1% 30.4% Financial revenue and other, net 0.5% 0.6% 0.6% 0.6% Income tax rate (% of EBIT) 25.4% 27.8% 25.6% 28.3% Non-controlling interest 0.0% 0.0% 0.0% 0.0% Net Income (to equity holders of the parent) 15.6% 21.7% 16.1% 22.3% 77
75 Balance Sheet (IFRS15) IFRS (in millions of ) End of Jun-18 Cash and cash equivalents 3,043.2 Short-term investments 0.5 Accounts receivable, net Contract assets 36.3 Other current assets Total current assets 4,030.3 Property and equipment, net Goodwill and Intangible assets, net 3,023.6 Other non current assets Total Assets 7,507.2 Accounts payable Contract liabilities Other current liabilities Total current liabilities 1,524.3 Long-term debt 1,000.0 Other non current obligations Total long-term liabilities 1,500.3 Non-controlling interest 1.5 Parent Shareholders' equity 4,481.1 New items: Contract Assets / Contract Liabilities The company classifies the right to consideration in exchange for products or services transferred to a client as either a receivable or a contract asset. A receivable is a right to consideration that is unconditional as compared to a contract asset, which is a right to consideration that is conditional upon factors other than the passage of time. The majority of the company s contract assets represent unbilled amounts related to Fixed price services contracts when revenue recognized exceeds the amount billed to the client, and the right to consideration is subject to milestone completion or client acceptance. The amount of billing in excess of revenue recognized is classified as contract liabilities. Total Liabilities and Shareholders' Equity 7,
76 Consolidated Statement of Cash Flows (IFRS 15) IFRS (in millions of ) 2Q18 2Q18 YTD Net income attributable to equity holders of the parent Non-controlling interest (0.1) (0.4) Net income Depreciation of property & equipment Amortization of intangible assets Other non-cash P&L items Changes in working capital Net Cash Provided by (Used in) Operating Activities (I) Additions to property, equipment and intangibles (19.3) (31.3) Payment for acquisition of businesses, net of cash acquired (51.6) (51.6) Sale (Purchase) of short-term investments, net Investments, loans and others (1.5) (1.5) Net Cash Provided by (Used in) Investing Activities (II) (31.6) (83.7) Acquisition of non-controlling interests (26.2) (26.2) (Purchase) Sale of treasury stock (10.6) (2.3) Proceeds from exercise of stock-options Cash dividend paid (38.0) (38.0) Net Cash Provided by (Used in) Financing Activities (III) (43.4) (22.8) Effect of exchange rate changes on cash and cash equivalents (IV) Increase (Decrease) in Cash (V) = (I)+(II)+(III)+(IV) Cash and cash equivalents at Beginning of Period Cash and cash equivalents at End of Period Cash and cash equivalents variation

77 80
Q Earnings Presentation. Bernard Charlès, Vice-Chairman of the Board of Directors & CEO Pascal Daloz, CFO & Corporate Strategy Officer
 Q1 2018 Earnings Presentation Bernard Charlès, Vice-Chairman of the Board of Directors & CEO Pascal Daloz, CFO & Corporate Strategy Officer Forward Looking Information Statements herein that are not historical
Analysts Meeting Q Bernard Charlès, President and CEO Thibault de Tersant, Senior EVP, CFO
 Analysts Meeting Q3 2015 Bernard Charlès, President and CEO Thibault de Tersant, Senior EVP, CFO 1 Forward Looking Information Statements herein that are not historical facts but express expectations or
Analysts Meeting Q2 & H1 2016
 Analysts Meeting Q2 & H1 2016 Forward Looking Information Statements herein that are not historical facts but express expectations or objectives for the future, including but not limited to statements
Analysts Meeting Q Bernard Charlès, President and CEO Thibault de Tersant, Senior EVP, CFO
 Analysts Meeting Q3 2014 Bernard Charlès, President and CEO Thibault de Tersant, Senior EVP, CFO 1 Forward Looking Information Statements herein that are not historical facts but express expectations or
Dassault Systèmes Q4 & FY 2018 Earnings Presentation. Bernard Charlès, Vice-Chairman & CEO Pascal Daloz, EVP, CFO & Corporate Strategy Officer
 Dassault Systèmes Q4 & FY 2018 Earnings Presentation Bernard Charlès, Vice-Chairman & CEO Pascal Daloz, EVP, CFO & Corporate Strategy Officer Forward Looking Information Statements herein that are not
Dassault Systèmes Reports Q3 and YTD EPS Up Double-Digits and Reaffirms 2018 Growth Objectives
 Dassault Systèmes Reports Q3 and YTD EPS Up Double-Digits and Reaffirms 2018 Growth Objectives VÉLIZY-VILLACOUBLAY, France October 24, 2018 Dassault Systèmes (Euronext Paris: #13065, DSY.PA), announces
Analysts Meeting Q2 2014
 Analysts Meeting Q2 2014 Bernard Charlès, President and CEO Thibault de Tersant, Senior EVP, CFO 1 Forward Looking Information Statements herein that are not historical facts but express expectations or
Analysts Meeting FY & Q4 2015
 1 Analysts Meeting FY & Q4 2015 Forward Looking Information Such forward-looking statements are based on Dassault Systèmes management's current views and assumptions and involve known and unknown risks
Dassault Systèmes Q3 & YTD 2018 Earnings Presentation. Bernard Charlès, Vice-Chairman & CEO Pascal Daloz, EVP, CFO & Corporate Strategy Officer
 Dassault Systèmes Q3 & YTD 2018 Earnings Presentation Bernard Charlès, Vice-Chairman & CEO Pascal Daloz, EVP, CFO & Corporate Strategy Officer Forward Looking Information Statements herein that are not
Analysts Meeting Q1 2013
 Analysts Meeting Q1 2013 Bernard Charlès, President and CEO Thibault de Tersant, Senior EVP and CFO 1 Forward Looking Information Statements herein that are not historical facts but express expectations
Analysts Meeting FY12 & Q412
 3DS.COM Dassault Systèmes Q4 & FY2012 Earnings Presentation Analysts Meeting FY12 & Q412 Building Up 3DEXPERIENCE Bernard Charlès, President and CEO Thibault de Tersant, Senior EVP and CFO 1 Forward Looking
Analysts Meeting Q Bernard Charlès, President and CEO Thibault de Tersant, Senior EVP, CFO
 Analysts Meeting Q2 2015 Bernard Charlès, President and CEO Thibault de Tersant, Senior EVP, CFO 1 Forward Looking Information Statements herein that are not historical facts but express expectations or
Analysts Meeting Q4 & FY Bernard Charlès, Vice-Chairman of the Board of Directors & CEO Thibault de Tersant, Senior EVP, CFO
 Analysts Meeting Q4 & FY 2016 Bernard Charlès, Vice-Chairman of the Board of Directors & CEO Thibault de Tersant, Senior EVP, CFO Forward Looking Information Statements herein that are not historical facts
Analysts Meeting Q1 2012
 Analysts Meeting Q1 2012 A Strategic Move Towards Natural Resources Bernard Charles, President and CEO Thibault de Tersant, Senior EVP and CFO 1 Forward Looking Information Statements herein that are not
Dassault Systèmes Raises EPS Guidance for 2018
 Dassault Systèmes Raises EPS Guidance for 2018 VÉLIZY-VILLACOUBLAY, France July 25, 2018 Dassault Systèmes (Euronext Paris: #13065, DSY.PA), announces IFRS unaudited financial results for the second quarter
Analysts Meeting Q1 2014
 Analysts Meeting Q1 2014 Bernard Charlès, President and CEO Thibault de Tersant, Senior EVP, CFO 1 Important Information This presentation is neither an offer to purchase nor a solicitation of an offer
Dassault Systèmes Analysts Meeting Q2 2011
 Dassault Systèmes Analysts Meeting Q2 2011 Bernard Charlès, President and CEO Thibault de Tersant, Senior EVP and CFO 1 Forward Looking Information Statements herein that are not historical facts but express
Dassault Systèmes Reports Strong 3DEXPERIENCE-driven Growth with Fourth Quarter Total Revenue up 13% and Software Revenue up 11% at constant currency
 Dassault Systèmes Reports Strong 3DEXPERIENCE-driven Growth with Fourth Quarter Total Revenue up 13% and Software Revenue up 11% at constant currency VÉLIZY-VILLACOUBLAY, France February 6, 2019 Dassault
Dassault Systèmes Reports Solid Third Quarter Led by Large Accounts Industry Solutions Engagements
 Dassault Systèmes Reports Solid Third Quarter Led by Large Accounts Industry Solutions Engagements VÉLIZY-VILLACOUBLAY, France October 23, 2014 Dassault Systèmes (Euronext Paris: #13065, DSY.PA), the 3DEXPERIENCE
Dassault Systèmes Reports Strong Third Quarter EPS Growth
 Dassault Systèmes Reports Strong Third Quarter EPS Growth VÉLIZY-VILLACOUBLAY, France October 22, 2015 Dassault Systèmes (Euronext Paris: #13065, DSY.PA), the 3DEXPERIENCE Company, world leader in 3D design
Dassault Systèmes Reports Double-digit Software Revenue and EPS Growth for 2012
 Dassault Systèmes Reports Double-digit Software Revenue and EPS Growth for 2012 Paris, France February 7, 2013 Dassault Systèmes (Euronext Paris: #13065, DSY.PA), the 3DEXPERIENCE Company, world leader
Dassault Systèmes Reports Solid Second Quarter Performance and Reconfirms Full Year Outlook
 Dassault Systèmes Reports Solid Second Quarter Performance and Reconfirms Full Year Outlook VÉLIZY-VILLACOUBLAY, France July 24, 2014 Dassault Systèmes (Euronext Paris: #13065, DSY.PA), the 3DEXPERIENCE
Dassault Systèmes Reports Revenue Growth of 4% in Q3 and 6% YTD in Constant Currencies
 Dassault Systèmes Reports Revenue Growth of 4% in Q3 and 6% YTD in Constant Currencies Paris, France - October 24, 2013 Dassault Systèmes (Euronext Paris: #13065, DSY.PA), the 3DEXPERIENCE Company, world
DS Reports 2008 Second Quarter Software Revenue Growth Above 15% in Constant Currencies
 DS Reports 2008 Second Quarter Software Revenue Growth Above 15% in Constant Currencies Paris, France, July 31, 2008 Dassault Systèmes (DS) (Nasdaq: DASTY; Euronext Paris: #13065, DSY.PA) reported U.S.
DASSAULT SYSTEMES HALF-YEAR FINANCIAL REPORT
 DASSAULT SYSTEMES HALF-YEAR FINANCIAL REPORT June 30, 2009 Public limited liability company Common stock, nominal value 1 per share: 117,866,151 euros Registered Office: 10, rue Marcel Dassault 78140 Vélizy-Villacoublay
DASSAULT SYSTEMES HALF-YEAR FINANCIAL REPORT
 DASSAULT SYSTEMES HALF-YEAR FINANCIAL REPORT June 30, 2012 Public limited liability company Common stock, nominal value 1 per share: 125,059,208 euros Registered Office: 10, rue Marcel Dassault 78140 Vélizy-Villacoublay
KONE Q APRIL 25, 2018 HENRIK EHRNROOTH, PRESIDENT & CEO ILKKA HARA, CFO
 KONE 2018 APRIL 25, 2018 HENRIK EHRNROOTH, PRESIDENT & CEO ILKKA HARA, CFO 2018 Highlights Solid growth in orders received with stabilizing margins Profitability continued to be burdened Good progress
DASSAULT SYSTEMES HALF-YEAR FINANCIAL REPORT
 DASSAULT SYSTEMES HALF-YEAR FINANCIAL REPORT June 30, 2013 Public limited liability company Common stock, nominal value 1 per share: 126,130,441 euros Registered Office: 10, rue Marcel Dassault 78140 Vélizy-Villacoublay
Financial results & business update. Quarter and year ended 31 December February 2016
 Financial results & business update Quarter and year ended 31 December 2015 11 February 2016 Disclaimer 3 Any remarks that we may make about future expectations, plans and prospects for the company constitute
PTC PREPARED REMARKS SECOND QUARTER FISCAL 2018 APRIL 18, 2018
 PTC PREPARED REMARKS SECOND QUARTER FISCAL 2018 APRIL 18, 2018 Please refer to the Important Disclosures section of these prepared remarks for important information about our operating metrics (including
2008 First Quarter Newswire Conference Call Tuesday, April 29, Final
 2008 First Quarter Newswire Conference Call Tuesday, April 29, 2008 Final Thibault de Tersant Senior Executive Vice President and CFO Introduction Good morning. I am pleased to speak with you to give an
AIRBUS 9m Results 2017
 AIRBUS 9m Results 2017 31 October 2017 Harald Wilhelm Chief Financial Officer SAFE HARBOUR STATEMENT 2 DISCLAIMER This presentation includes forward-looking statements. Words such as anticipates, believes,
AIRBUS FY Results 2017
 AIRBUS FY Results 2017 15 February 2018 Tom Enders Chief Executive Officer Harald Wilhelm Chief Financial Officer SAFE HARBOUR STATEMENT 2 DISCLAIMER This presentation includes forward-looking statements.
AIRBUS Q1 Results 2018
 AIRBUS Q1 Results 2018 27 April 2018 Harald Wilhelm Chief Financial Officer SAFE HARBOUR STATEMENT 2 DISCLAIMER This presentation includes forward-looking statements. Words such as anticipates, believes,
2017 Half year results 26 July 2017
 2017 Half year results 26 July 2017 www.thalesgroup.com H1 2017 business environment Aerospace Avionics: continued positive dynamics for cockpit avionics and in-flight entertainment and connectivity Space:
AIRBUS H1 Results 2018
 AIRBUS H1 Results 2018 26 July 2018 Tom Enders Chief Executive Officer Harald Wilhelm Chief Financial Officer SAFE HARBOUR STATEMENT 2 DISCLAIMER This presentation includes forward-looking statements.
Financial results & business update. Quarter and year ended 31 December February 2017
 Financial results & business update Quarter and year ended 31 December 2016 14 February 2017 Disclaimer 3 Any remarks that we may make about future expectations, plans and prospects for the company constitute
PTC THIRD QUARTER FISCAL 2016 PREPARED REMARKS JULY 20, 2016
 PTC THIRD QUARTER FISCAL 2016 PREPARED REMARKS JULY 20, 2016 Please refer to the Important Disclosures section of these prepared remarks for important information about our operating metrics (including
Financial results & business update. Quarter ended 30 September October 2016
 Financial results & business update Quarter ended 30 September 2016 19 October 2016 Disclaimer 3 Any remarks that we may make about future expectations, plans and prospects for the company constitute forward-looking
Second Quarter 2018 Earnings
 Second Quarter 2018 Earnings John Visentin, CEO Bill Osbourn, CFO July 26, 2018 http://www.xerox.com/investor Forward-Looking Statements This presentation, and other written or oral statements made from
ZEBRA TECHNOLOGIES FIRST QUARTER 2016 RESULTS May 10, 2016
 ZEBRA TECHNOLOGIES FIRST QUARTER 2016 RESULTS May 10, 2016 Anders Gustafsson Chief Executive Officer Mike Smiley Chief Financial Officer 2 Safe Harbor Statement Statements made in this presentation which
Financial results & business update. Quarter ended 31 March April 2018
 Financial results & business update Quarter ended 31 March 2018 18 April 2018 Disclaimer 3 Any remarks that we may make about future expectations, plans and prospects for the company constitute forward-looking
Second Quarter 2017 Earnings
 Second Quarter 2017 Earnings Jeff Jacobson, CEO Bill Osbourn, CFO August 1, 2017 http://www.xerox.com/investor Forward Looking Statements This presentation contains forward-looking statements as defined
2017 Full Year Results
 2017 Full Year Results Title of the presentation 2 lines Location, Date, Author Paris February 15 th, 2018 Disclaimer This presentation may contain forward-looking statements, Such statements may include
PTC PREPARED REMARKS THIRD QUARTER FISCAL 2018 JULY 18, 2018
 PTC PREPARED REMARKS THIRD QUARTER FISCAL 2018 JULY 18, 2018 Please refer to the updated Important Disclosures section of these prepared remarks for important information about our operating metrics (including
Q in brief. Strong organic sales development. Electromechanical products up 30% Strong EBIT growth of 12%
 Q4 Report 20 Q4 20 in brief Strong organic sales development Very strong growth in Americas and APAC Strong growth in Global Technologies Good growth in EMEA Growth in Entrance Systems Electromechanical
Temenos announces very strong Q3 results, full year guidance raised
 Temenos announces very strong Q3 results, full year guidance raised GENEVA, Switzerland, 17 October 2018 Temenos AG (SIX: TEMN), the banking software company, today reports its third quarter 2018 results.
Xerox Investor Handout as of Q Third Quarter 2018 Earnings
 Xerox Investor Handout as of Q4 2018 Third Quarter 2018 Earnings http://www.xerox.com/investor Forward-Looking Statements This presentation, and other written or oral statements made from time to time
AIRBUS 9m Results 2018
 AIRBUS 9m Results 2018 31 October 2018 Harald Wilhelm Chief Financial Officer SAFE HARBOUR STATEMENT 2 DISCLAIMER This presentation includes forward-looking statements. Words such as anticipates, believes,
Financial results & business update
 Financial results & business update Quarter ended 31 March 2019 16 April 2019 Disclaimer Any remarks that we may make about future expectations, plans and prospects for the company constitute forward-looking
Investor Presentation
 Investor Presentation Fourth Quarter 2017 Safe Harbor and Other Information This presentation contains forward looking statements that are based on our management s beliefs and assumptions and on information
Fourth quarter and full-year report 2017 Stockholm, January 31, 2018
 Fourth quarter and full-year report Stockholm, January 31, 2018 FOURTH QUARTER HIGHLIGHTS See page > > Reported sales decreased by -12%. Sales adjusted for comparable units and currency declined by -7%
2018 Half year results 20 July 2018
 2018 Half year results 20 July 2018 www.thalesgroup.com H1 2018 business environment Aerospace Ground transportation Defence & Security Aeronautics: positive dynamics for cockpit avionics and in-flight
PTC SECOND QUARTER FISCAL 2017 PREPARED REMARKS APRIL 19, 2017
 PTC SECOND QUARTER FISCAL 2017 PREPARED REMARKS APRIL 19, 2017 Please refer to the Important Disclosures section of these prepared remarks for important information about our operating metrics (including
Financial results & business update. Quarter ended 30 June July 2017
 Financial results & business update Quarter ended 30 June 2017 19 July 2017 Disclaimer 3 Any remarks that we may make about future expectations, plans and prospects for the company constitute forward-looking
Earnings Presentation. First Quarter 2012 April 24, 2012
 Earnings Presentation First Quarter 2012 April 24, 2012 Forward Looking Statements and GAAP Reconciliations The contents of this presentation that are not statements of historical fact are forward-looking
Financial results & business update. Quarter ended 30 September October 2017
 Financial results & business update Quarter ended 30 September 2017 18 October 2017 Disclaimer 3 Any remarks that we may make about future expectations, plans and prospects for the company constitute forward-looking
Capgemini records an excellent performance in 2017 with growth acceleration fueled by Digital and Cloud
 Press relations: Florence Lièvre Tel.: +33 1 47 54 50 71 florence.lievre@capgemini.com Investor relations: Vincent Biraud Tel.: +33 1 47 54 50 87 vincent.biraud@capgemini.com Capgemini records an excellent
Q order intake and sales 19 October 2017
 Q3 2017 order intake and sales 19 October 2017 www.thalesgroup.com Q3 order intake and sales Update on implementation of IFRS 15 standard 2017 outlook Q3 2017 highlights New London underground signaling
ASSA ABLOY is the global leader in door opening solutions, dedicated to satisfying end-user needs for security, safety and convenience.
 ASSA ABLOY is the global leader in door opening solutions, dedicated to satisfying end-user needs for security, safety and convenience Q3 Report 20 Q3 20 in brief Organic growth in all divisions Strong
Financial Information
 Financial Information H1 revenues reached 12.8bn up 9.8%, flat org. in Q2 Adj. EBITA reached 1.6bn, up 6.4%, Adj. EBITA margin flat excl. Invensys in a challenging environment 2015 targets: Around flat
AVEVA GROUP PLC RESULTS FOR THE SIX MONTHS ENDED 30 SEPTEMBER November 2017
 AVEVA GROUP PLC RESULTS FOR THE SIX MONTHS ENDED 30 SEPTEMBER 2017 14 November 2017 This presentation may include predictions, estimates, intentions, beliefs and other statements that are or may be construed
PTC PREPARED REMARKS FOURTH QUARTER AND FULL YEAR FISCAL 2017 OCTOBER 25, 2017
 PTC PREPARED REMARKS FOURTH QUARTER AND FULL YEAR FISCAL 2017 OCTOBER 25, 2017 Please refer to the Important Disclosures section of these prepared remarks for important information about our operating
Third Quarter 2017 Earnings Review
 Citi Investor Relations Third Quarter 2017 Earnings Review October 12, 2017 Overview 3Q 17 showed strong results and balanced performance across the franchise Revenue growth and positive operating leverage
ASSA ABLOY is the global leader in door opening solutions, dedicated to satisfying end-user needs for security, safety and convenience.
 ASSA ABLOY is the global leader in door opening solutions, dedicated to satisfying end-user needs for security, safety and convenience Q4 Report 20 Q4 20 in brief Organic growth in all divisions Strong
Second Quarter 2016 Earnings Results
 POLARIS INDUSTRIES INC. Second Quarter 2016 Earnings Results July 20, 2016 SAFE HARBOR Except for historical information contained herein, the matters set forth in this document, including but not limited
4Q17 EARNINGS FEBRUARY 2018
 4Q17 EARNINGS FEBRUARY 218 2 FORWARD-LOOKING STATEMENTS The statements contained in this release that refer to plans and expectations for the next quarter, the full year or the future are forward-looking
AIRBUS FY Results 2016
 AIRBUS FY Results 2016 22 February 2017 Tom Enders Chief Executive Officer Harald Wilhelm Chief Financial Officer SAFE HARBOUR STATEMENT 2 DISCLAIMER This presentation includes forward-looking statements.
Rockwell Automation Bank of America Merrill Lynch Global Industrials & EU Autos Conference
 Rockwell Automation Bank of America Merrill Lynch Global Industrials & EU Autos Conference Patrick Goris Chief Financial Officer March 21, 2017 PUBLIC Copyright 2017 Rockwell Automation, Inc. All Rights
TCS Financial Results
 TCS Financial Results Quarter IV & Year Ended FY 2014-15 April 16, 2015 1 Copyright 2014 Tata Consultancy Services Limited Disclaimer Certain statements in this release concerning our future prospects
Financial Information
 Accelerating & profit in H1: Revenue up +4% reported, Adj. EBITA +8%, Net Income +18%, FCF +15% H1 revenue of 12.2bn, +2.7% organic, +4.1% outside Infrastructure H1 adj. EBITA margin up 60bps 1 org., to
BLACKBERRY INVESTOR PRESENTATION
 BLACKBERRY INVESTOR PRESENTATION Q2 FY 19 BlackBerry Public investorinfo@blackberry.com SAFE HARBOR STATEMENT Forward-looking statements in this presentation are made pursuant to the "safe harbor" provisions
AUTODESK, INC. (ADSK) SECOND QUARTER FISCAL 2019 EARNINGS ANNOUNCEMENT AUGUST 23, 2018 PREPARED REMARKS
 SECOND QUARTER FISCAL 2019 EARNINGS ANNOUNCEMENT AUGUST 23, 2018 PREPARED REMARKS") AUTODESK, INC. (ADSK) SECOND QUARTER FISCAL 2019 EARNINGS ANNOUNCEMENT AUGUST 23, 2018 PREPARED REMARKS Autodesk posts its prepared remarks and press release to its IR website to provide shareholders and
AUTODESK, INC. (ADSK) SECOND QUARTER FISCAL 2019 EARNINGS ANNOUNCEMENT AUGUST 23, 2018 PREPARED REMARKS Autodesk posts its prepared remarks and press release to its IR website to provide shareholders and
ASC605 to ASC606 Transition
 ASC605 to ASC606 Transition Summary Workday Adoption Background Workday has elected early adoption of ASC606 (as of 2/1/2017) Full retrospective adoption method (FY16 & FY17 restated) FY17 has also been
Normal Q2, strategic priorities are delivering, solid view on H2
 Amer Sports Q2/2018 Normal Q2, strategic priorities are delivering, solid view on H2 July 26, 2018 Heikki Takala, President and CEO Normal Q2 Net sales EUR 483.0 million (495.8), +2%* Top line mostly in-season
Cheuvreux Technology and IT Day
 Nicolas DUFOURCQ, CFO March 3 rd, 2009 Capgemini is fully equipped to face the downturn 2008: a solid performance predicted and delivered Meeting our guidance on growth and margin, despite a challenging
Quarter ended 30 September Financial results & business update
 Quarter ended 30 September 2014 Financial results & business update 21 October 2014 Disclaimer Any remarks that we may make about future expectations, plans and prospects for the company constitute forward-looking
PTC Announces Third Quarter Fiscal Year 2018 Results
 PTC Announces Third Quarter Fiscal Year 2018 Results Revenue at High End of Guidance and EPS Above Guidance NEEDHAM, MA, July 18, 2018 - PTC (NASDAQ: PTC) today reported financial results for its fiscal
Fourth Quarter & Year-End 2018 Earnings Conference Call February 27, 2019
 Philip Mezey President and Chief Executive Officer Joan Hooper Senior Vice President and Chief Financial Officer Tom Deitrich Executive Vice President and Chief Operating Officer Kenneth Gianella Vice
2Q17 EARNINGS AUGUST 2017
 2Q17 EARNINGS AUGUST 2017 FORWARD-LOOKING STATEMENTS The statements contained in this release that refer to plans and expectations for the next quarter, the full year or the future are forward-looking
KONE s interim report for January June 2016 JULY 19, 2016 HENRIK EHRNROOTH, PRESIDENT & CEO
 KONE s interim report for January June 2016 JULY 19, 2016 HENRIK EHRNROOTH, PRESIDENT & CEO Figures Key figures for for January June 2016 Q2 2016 Key figures STRONG EXECUTION AND PROFITABLE SALES GROWTH
Temenos announces very strong start to 2018 with Q1 total software licensing growth of 40%
 Temenos announces very strong start to 2018 with Q1 total software licensing growth of 40% GENEVA, Switzerland, 18 April 2018 Temenos Group AG (SIX: TEMN), the banking software company, today reports its
Luxoft Holding, Inc Q2 FY2018 Call
 Luxoft Holding, Inc Q2 FY2018 Call November 17, 2017 Dmitry Loschinin, CEO & President Evgeny Fetisov, CFO Disclaimer Safe Harbor Forward-Looking Statements 2 Non-GAAP Financial Measures To supplement
Fourth Quarter 2017 Earnings Review
 Citi Investor Relations On February 23, 2018, Citi announced that it was adjusting downward its fourth quarter and full year 2017 financial results, from those reported on January 16, 2018, due to an updated
PTC Announces Fourth Quarter and Fiscal Year 2018 Results
 PTC Announces Fourth Quarter and Fiscal Year 2018 Results Bookings Near End of Guidance; Strong Recurring Software Revenue Growth NEEDHAM, MA, October 24, 2018 - PTC (NASDAQ: PTC) today reported financial
Fourth Quarter 2018 Earnings
 Fourth Quarter 2018 Earnings John Visentin, CEO Bill Osbourn, CFO January 29, 2019 http://www.xerox.com/investor Forward-Looking Statements This presentation, and other written or oral statements made
Third Quarter 2018 Earnings Review
 Citi Investor Relations Third Quarter 2018 Earnings Review October 12, 2018 Overview Solid operating results in 3Q 18 Continued momentum in Institutional accrual businesses and strong results in Fixed
Siemens Gamesa Renewable Energy Q3 18 Results
 Siemens Gamesa Renewable Energy Q3 18 Results 27 July 2018 Disclaimer This material has been prepared by Siemens Gamesa Renewable Energy, and is disclosed solely for information purposes. This document
FULL-YEAR 2017 RESULTS
 Nanterre (France), February 16, 2018 FULL-YEAR 2017 RESULTS STRONG PERFORMANCE IN 2017 WITH OPERATING MARGIN AT 7% OF SALES IN H2 2018 GUIDANCE AHEAD OF ROADMAP RECORD ORDER INTAKE AT 62BN, UP 9BN ACCELERATION
AEGIS GROUP PLC 2008 ANNUAL RESULTS. 19 March 2009
 AEGIS GROUP PLC 2008 ANNUAL RESULTS 19 March 2009 AGENDA OVERVIEW OF RESULTS John Napier FINANCIAL REVIEW Alicja Lesniak OUTLOOK John Napier Q&A Aegis Group plc Page 2 OVERVIEW OF RESULTS John Napier,
First Quarter 2018 Earnings. May 2,
 First Quarter 2018 Earnings May 2, 2018 http://www.xerox.com/investor Cautionary Statement Regarding Forward-Looking Statements This presentation, and other written or oral statements made from time to
Q1 18 Results and Conference Call
 Q1 18 Results and Conference Call May 2, 2018 Materials posted at: investors.fireeye.com/results.cfm 2 Safe Harbor Statement This presentation contains forward-looking statements within the meaning of
Quarter and year ended 31 December Financial results & business update
 Quarter and year ended 31 December 2014 Financial results & business update 10 February 2015 Disclaimer Any remarks that we may make about future expectations, plans and prospects for the company constitute
AUTODESK, INC. (ADSK) THIRD QUARTER FISCAL 2019 EARNINGS ANNOUNCEMENT NOVEMBER 20, 2018 PREPARED REMARKS
 THIRD QUARTER FISCAL 2019 EARNINGS ANNOUNCEMENT NOVEMBER 20, 2018 PREPARED REMARKS") AUTODESK, INC. (ADSK) THIRD QUARTER FISCAL 2019 EARNINGS ANNOUNCEMENT NOVEMBER 20, 2018 PREPARED REMARKS Autodesk posts its prepared remarks and press release to its investor relations website to provide
AUTODESK, INC. (ADSK) THIRD QUARTER FISCAL 2019 EARNINGS ANNOUNCEMENT NOVEMBER 20, 2018 PREPARED REMARKS Autodesk posts its prepared remarks and press release to its investor relations website to provide
FORWARD-LOOKING STATEMENT
 Fourth Quarter Results February 2, 2018 FORWARD-LOOKING STATEMENT This presentation contains statements, including financial projections, that are forwardlooking in nature. These statements are based on
Q Financial Results. July 22, 2010
 Q2 2010 Financial Results July 22, 2010 Q2 2010 Non-GAAP Results Q2 10 Q2 09 Y/Y % growth Q1 10 Billings (1) $90M $69M 31% $79M Revenue $76M $61M 24% $70M Non-GAAP Gross Margin (%) (2) 74% 74% -- 73% Non-GAAP
Sabre reports fourth quarter and full-year 2018 results
 Sabre reports fourth quarter and full-year 2018 results Fourth quarter 2018 highlights: Revenue increased 4.8% Net income attributable to common stockholders increased 2.8% to $84.4 million Diluted net
Fourth Quarter 2018 Earnings Review
 Citi Investor Relations Fourth Quarter 2018 Earnings Review January 14, 2019 Overview 4Q 18 showed continued progress in a challenging environment Continued momentum in Institutional accrual businesses
KONE Q JULY 19, 2017 HENRIK EHRNROOTH, PRESIDENT & CEO ILKKA HARA, CFO
 KONE Q2 2017 JULY 19, 2017 HENRIK EHRNROOTH, PRESIDENT & CEO ILKKA HARA, CFO Q2 2017 highlights Good overall execution Profitability burdened by several headwinds Stabilization in China Good improvement
PRESS RELEASE. BE Semiconductor Industries N.V. Announces Q3-18 Results
 PRESS RELEASE BE Semiconductor Industries N.V. Announces Q3-18 Results Revenue and Net Income of 116.7 Million and 29.3 Million, Respectively Operating Profit Exceeds Expectations. Orders Up 25.0% vs.