Q Earnings Presentation. Bernard Charlès, Vice-Chairman of the Board of Directors & CEO Pascal Daloz, CFO & Corporate Strategy Officer
|
|
|
- Eleanor McGee
- 5 years ago
- Views:
Transcription
1 Q Earnings Presentation Bernard Charlès, Vice-Chairman of the Board of Directors & CEO Pascal Daloz, CFO & Corporate Strategy Officer
2 Forward Looking Information Statements herein that are not historical facts but express expectations or objectives for the future, including but not limited to statements regarding the Company s non-ifrs financial performance objectives, are forward-looking statements. Such forward-looking statements are based on Dassault Systèmes management's current views and assumptions and involve known and unknown risks and uncertainties. Actual results or performances may differ materially from those in such statements due to a range of factors. The Company s current outlook for 2018 takes into consideration, among other things, an uncertain global economic environment. In light of the continuing uncertainties regarding economic, business, social and geopolitical conditions at the global level, the Company s revenue, net earnings and cash flows may grow more slowly, whether on an annual or quarterly basis. While the Company makes every effort to take into consideration this uncertain macroeconomic outlook, the Company s business results, however, may not develop as anticipated. Further, there may be a substantial time lag between an improvement in global economic and business conditions and an upswing in the Company s business results. The Company s actual results or performance may also be materially negatively affected by numerous risks and uncertainties, as described in the Risk Factors section of the 2017 Document de Référence (Annual Report) filed with the AMF (French Financial Markets Authority) on March 21, 2018 and also available on the Company s website In preparing such forward-looking statements, the Company has in particular assumed an average US dollar to euro exchange rate of US$1.25 per 1.00 for the 2018 second quarter and US$1.20 per 1.00 for the 2018 second half as well as an average Japanese yen to euro exchange rate of JPY135 to 1.00 for the 2018 second quarter and JPY134.5 to 1.00 for the full year 2018 before hedging; however, currency values fluctuate, and the Company s results of operations may be significantly affected by changes in exchange rates. 2
3 Non-IFRS Information Readers are cautioned that the supplemental non-ifrs information presented in this press release is subject to inherent limitations. It is not based on any comprehensive set of accounting rules or principles and should not be considered as a substitute for IFRS measurements. Also, the Company s supplemental non-ifrs financial information may not be comparable to similarly titled non-ifrs measures used by other companies. Further specific limitations for individual non-ifrs measures, and the reasons for presenting non-ifrs financial information, are set forth in the Company s 2017 Document de Référence filed with the AMF on March 21, In the tables accompanying this press release the Company sets forth its supplemental non-ifrs figures for revenue, operating income, operating margin, net income and diluted earnings per share, which exclude the effect of adjusting the carrying value of acquired companies deferred revenue, share-based compensation expense and related social charges, the amortization of acquired intangible assets, other operating income and expense, net, certain one-time items included in financial revenue and other, net, and the income tax effect of the non-ifrs adjustments and certain one-time tax effects. The tables also set forth the most comparable IFRS financial measure and reconciliations of this information with non-ifrs information. IFRS 15 & IAS 18 The Company has adopted IFRS 15 as of January 1, The appendix of this presentation includes 2018 first quarter results under IFRS 15 as well as under the prior IAS 18 standard and includes a summary explanation of the major differences for the Company. In addition, this presentation also includes financial information on a non-ifrs basis (both IFRS 15 and IAS 18) with reconciliations included in the Appendix to this communication. 3
4 Glossary of Definitions Information in Constant Currencies We have followed a long-standing policy of measuring our revenue performance and setting our revenue objectives exclusive of currency in order to measure in a transparent manner the underlying level of improvement in our total revenue and software revenue by type, industry, region and product lines. We believe it is helpful to evaluate our growth exclusive of currency impacts, particularly to help understand revenue trends in our business. Therefore, we provide percentage increases or decreases in our revenue and EPS (in both IFRS as well as non-ifrs) to eliminate the effect of changes in currency values, particularly the U.S. dollar and the Japanese yen, relative to the euro. When trend information is expressed by us "in constant currencies", the results of the "prior" period have first been recalculated using the average exchange rates of the comparable period in the current year, and then compared with the results of the comparable period in the current year. While constant currency calculations are not considered to be an IFRS measure, we do believe these measures are critical to understanding our global revenue results and to compare with many of our competitors who report their financial results in U.S. dollars. Therefore, we are including this calculation for comparing IFRS revenue figures for comparable periods as well as for comparing non-ifrs revenue figures for comparable periods. All constant currency information is provided on an approximate basis. Unless otherwise indicated, the impact of exchange rate fluctuations is approximately the same for both the Company s IFRS and supplemental non-ifrs financial data. We have followed a long-standing policy of setting our revenue growth objectives in constant currencies and calculating a reported revenue range based upon the key currency exchange rate assumptions outlined in our quarterly earnings reports and in our half-year and annual regulatory documents. We also set our non-ifrs revenue objectives in constant currencies in order to provide transparency on our activities as compared to the impact of currency exchange rates. Information on Growth excluding acquisitions ( organic growth ) In addition to discussing total growth, we also provide financial information where we discuss growth excluding acquisitions or growth on an organic basis as used alternatively. In both cases, growth excluding acquisitions have been calculated using the following restatements of the scope of consolidation: for entities entering the consolidation scope in the current year, subtracting the contribution of the acquisition from the aggregates of the current year, and for entities entering the consolidation scope in the previous year, subtracting the contribution of the acquisition from January 1st of the current year, until the last day of the month of the current year when the acquisition was made the previous year. Information on Industrial Sectors The Company s global customer base includes companies in 12 industrial sectors: Transportation & Mobility; Industrial Equipment; Aerospace & Defense; Financial & Business Services; High-Tech; Life Sciences; Energy, Process & Utilities; Consumer Goods & Retail; Natural Resources; Architecture, Engineering & Construction; Consumer Packaged Goods & Retail and Marine & Offshore. Commencing in 2012 we implemented an industry go-to-market strategy with the dual objectives of broadening and deepening our presence in our largest industries as well as increasing the contribution from a diversified set of industrial sectors. Diversification Industries include: Architecture, Engineering & Construction; Consumer Goods & Retail; Consumer Packaged Goods & Retail; Energy, Process & Utilities; Finance Business Services; High-Tech; Life Sciences; Marine & Offshore; and Natural Resources. Core Industries include: Transportation & Mobility, Industrial Equipment, Aerospace & Defense and a portion of Business Services. 3DEXPERIENCE Licenses and Software Contribution To measure the progressive penetration of 3DEXPERIENCE software, the Company utilizes the following ratios: a) for new licenses revenue, the Company calculates the percentage contribution by comparing total 3DEXPERIENCE new licenses revenue to new licenses revenue for all product lines except SOLIDWORKS and acquisitions ( related new licenses revenue ); and, b) for software revenue, the Company calculates the percentage contribution by comparing total 3DEXPERIENCE software revenue to software revenue for all product lines except SOLIDWORKS and acquisitions ( related software revenue ). 4
5 Q Highlights Non-IFRS (under IAS 18) Good software revenue, margin and EPS supporting well full year objectives Breadth and Balance of Financial Performance: Strategy at Work: Organic licenses revenue up +14% exfx 3DEXPERIENCE licenses revenue up +53% exfx Social Cloud Adoption - 3DEXPERIENCE for SOLIDWORKS Community Strong licenses growth: - 3 sales channels - all major brands - 9 of 12 geos T&M, A&D, IE* software revenue up double-digit exfx NR, CG-Retail and AEC** software revenue up double-digit exfx ² Industry Experience Game changer for Electric Vehicles, Airlines Companies, Mining Customer / Citizen / Patient- Centric Innovation Reconfirming FY18 guidance with licenses revenue growth up 8-10% exfx 5 * ** T&M: Transportation & Mobility A&D: Aerospace & Defense IE: Industrial Equipment NR: Natural Resources CG-Retail : Consumer Goods-Retail AEC: Architecture, Engineering & Construction
6 Agenda 1 2 Strategy at Work Q1 18 Business Review 3 Q1 18 Financial Highlights 4 Q2 & FY18 Financial Objectives 5 Financial Information Appendix 6

7 INDUSTRY REFERENCES INDUSTRY SHAKERS 7


8 The Industry Renaissance is Here INDUSTRY 4.0 YESTERDAY DIGITALIZATION TODAY MAKERS & INNOVATORS TOMORROW 8

9 Dassault Systèmes, Catalyst and Enabler of this Transformation As an OPERATING SYSTEM As a BUSINESS MODEL Powers our software portfolio Powers our marketplace portfolio 9
, DELMIA (exclud.")
10 3DEXPERIENCE Q1 Performance % V6 / Licenses Revenue* Non-IFRS (under IAS 18) +9 points in Q % 34% 3DEXPERIENCE licenses revenue up +53% exfx Q Q * Excluding SOLIDWORKS and acquisitions It includes 3DEXPERIENCE Platform, CATIA, ENOVIA, SIMULIA (exclud.exa), DELMIA (exclud. Ortems & Apriso) and NETVIBES


11 Our Strategy Social Industry Experiences Ease of use, Online, Mobile Business Solutions Software, Services, Content 11

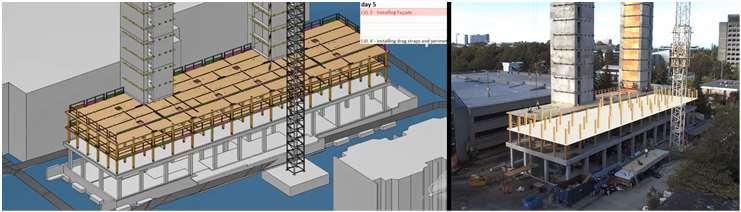
12 Kärcher Adopts 3DEXPERIENCE Platform on the Cloud Kärcher Renowned member of the German Mittelstand (Germany s midsize companies, world leaders in their market segments) - Family-owned enterprise, 2.5 bn revenue in 2017, 12,300 people in 67 countries Business Values: 1,200 users to adopt the 3DEXPERIENCE platform to: - collaborate and quickly introduce new products, services - reduce product development and production costs We support our enterprise-wide strategy to digitally transform to the cloud while gaining the flexibility and agility to innovate for customers. said Michael Stritzelberger, Executive Vice President, Kärcher. Solution: 3DEXPERIENCE Platform on the cloud, with Single Source For Speed Industry Solution Experience 12

13 3DEXPERIENCE for SOLIDWORKS Community SOLIDWORKS WORLD DEXPERIENCE Social Collaborative Services 2. SOLIDWORKS 3DEXPERIENCE PLM Services 3. SOLIDWORKS Product Designer 4. SOLIDWORKS xdesign 5. 3DEXPERIENCE Marketplace Make SOLIDWORKS now connected to 3DEXPERIENCE 13


14 Transportation & Mobility Electric, Connected & Autonomous Vehicles Regulations Quality & Cost 14

15 EVELOZCITY Adopts 3DEXPERIENCE Platform EVelozcity founders: CEO Stefan Krause, left, design chief Richard Kim, center, and technology chief Ulrich Kranz. Stefan Krause is the former CFO of BMW and Ulrich Kranz is the former head of the "i" program at BMW. EVELOZCITY Electric vehicle company - Designing, developing & delivering competitive, capable and connected electric vehicles developed for urban needs Business Values: Accelerate innovation - All-in-one collaborative cloud environment to imagine, design, simulate and deliver new mobility concepts and services Enable better productivity, save costs - Tracking ideas from initial concept to customer delivery, with integrated governance Minimize cost of infrastructure and streamline IT process to provide the best engineering and development platform Solution: 3DEXPERIENCE Platform on the cloud, with Electro Mobility Accelerator Industry Solution Experience leveraging CATIA, ENOVIA and SIMULIA 120 users (1st phase) 15


16 Aerospace & Defense Production Rates Mechatronics Customer Experience OEMs - Suppliers OEMs - Suppliers Airports - Airlines 16

17 Lufthansa Cargo Adopts QUINTIQ Lufthansa Cargo Lufthansa Cargo ranks among the world s leading air freight carriers. In the 2016 business year, the airline transported around 1.6 million tons of freight and mail. Business Values: Improve delivery performance - Respect organization's unique constraints (contract-specific requirements, labor regulations, resource availability and capabilities ) - Define efficiency, customer service and profitability targets - Handle last-minute schedule changes Solution: QUINTIQ 17


18 BioPharma BioPharma companies shifting to patient-centric innovation Dassault Systèmes delivering experiences to support them Manufacturing Quality 18

19 Gilead Sciences Adopts BIOVIA Gilead Sciences Gilead Sciences is a biopharmaceutical company that discovers, develops, and commercializes therapeutics in areas of unmet medical needs Business Values: - Reduce manufacturing waste and rework by removing inefficient error-prone manual processes and automated report creation - Achieve operations efficiency through automated aggregation and analysis of laboratory, quality and manufacturing information - Gain actionable insights with intelligent dashboards, trending, and alerting Solution: Made to Cure for BioPharma Industry Solution Experience (Continued Process Verification) 19
20 Agenda 1 2 Strategy at Work Q1 18 Business Review 3 Q1 18 Financial Highlights 4 Q2 & FY18 Financial Objectives 5 Financial Information Appendix 20
21 Q1 18 Non-IFRS (under IAS 18) Top line growth, operating margin expansion and lower income tax resulting in good EPS growth Currency depreciation impacting EPS progression, up 26% exfx millions Q1 18 Revenue Growth +1% Growth exfx +9% Software Growth exfx +10% Operating Margin 27.0% Operating Margin Growth +0.8 pts EPS ( ) 0.59 EPS Evolution +11% 21
22 Software Revenue by Region Non-IFRS (under IAS 18) Software Revenue Growth exfx by Region Strong licenses growth in the Americas Europe driven by France and Southern Europe Strong growth in Asia in all major countries: Japan, China, South Korea and India Q1 18 Americas +11% Europe +6% Asia +16% Software Revenue +10% 22
23 Software Revenue by Brand Non-IFRS (under IAS 18) Software Revenue Growth exfx by Brand CATIA: double-digit licenses growth exfx ENOVIA: strong dynamic in Asia and Europe SOLIDWORKS: driven by double-digit licenses revenue growth Other Software: Good SIMULIA, DELMIA and GEOVIA growth Q1 18 CATIA +5% ENOVIA +11% SOLIDWORKS +13% Other Software +14% Software Revenue +10% 23
, Life Sciences (Medical Devices) Strong performance of EXA for Fluid Dynamics Expanding market leadership in Simulation * Non-IFRS (under IAS")
24 SIMULIA * Simulation for Product, Nature & Life SIMULIA, over 15% of Q1 software revenue SIMULIA organic software revenue up 9% exfx Performance driven by Transportation & Mobility (OEMs), High Tech (Consumer Electronics, Semiconductors), Life Sciences (Medical Devices) Strong performance of EXA for Fluid Dynamics Expanding market leadership in Simulation * Non-IFRS (under IAS 18) 24
25 Agenda 1 2 Strategy at Work Q1 18 Business Review 3 Q1 18 Financial Highlights 4 Q2 & FY18 Financial Objectives 5 Financial Information Appendix 25

26 Software Revenue Growth Non-IFRS (under IAS 18) Software Revenue +1.7% +10% ex FX in MEUR Organic software revenue up +8% exfx 26

 up 6% exfx reflecting solid")
27 Software Revenue Growth Non-IFRS (under IAS 18) Licenses and Other software revenue Subscription and Support +4.3% +14% ex FX in MEUR +0.8% +9% ex FX in MEUR Organic licenses revenue up 14% exfx Organic recurring revenue (Subscription and Support) up 6% exfx reflecting solid support revenue 27

28 Service Revenue & Margin Evolution Non-IFRS (under IAS 18) Service Revenue -6.8% +0% ex FX in MEUR Serv. Gross Margin 8.2% 5.6% 28

29 Operating Margin Evolution Non-IFRS (under IAS 18) 29.0% 28.0% +2.4% 27.0% -0.5% 27.0% 26.0% 26.2% 25.0% -1.1% 24.0% 23.0% 1Q17 Margin Currencies Activity Acquisitions 1Q18 Margin 29

30 EPS Non-IFRS (under IAS 18) Diluted EPS +11% EPS up 26% exfx 30
31 Change in Net Financial Position IFRS (under IAS 18) ,460 Operating cash flow: + 407m compared to + 348m in Q1 17, up 17% 1,845 Net Financial Position Q Net Income Non cash P&L items Change in operating working capital Change in non-operating working capital Capital expenditure DS stock option exercise and treasury shares FX Impact Net Financial Position Q
32 Operating Cash Flow Evolution IFRS (under IAS 18) million Q1 18 Q1 17 Changes Operating Cash Flow Net income adjusted for non cash items Decrease in trade accounts receivable Good cash collection Increase in unearned revenue Unearned revenue up 9% exfx consistent with Subscription & Support revenue growth Decrease in accrued compensation Decrease in accounts payable Decrease in income taxes payable Other
33 Agenda 1 2 Strategy at Work Q1 18 Business Review 3 Q1 18 Financial Highlights 4 Q2 & FY18 Financial Objectives 5 Financial Information Appendix 33
34 Reconfirming FY18 Objectives Non-IFRS (under IAS 18) For the year, reconfirming: FY18 revenue growth up 8-9% exfx with license revenue growth up 8-10% exfx FY18 operating margin of 31%-31.5% FY18 EPS of up 6-8% Leaving exchange rate assumptions unchanged for the 3 remaining quarters: Q2: US$1.25 per 1.00, H2: US$1.20 per 1.00 Q2, Q3, Q4: JPY135 per
35 Proposed objectives Non-IFRS IAS 18 Q FY 2018 Revenue (M ) ,355-3,385 Growth +1-2% ~+4% Growth ex FX +8-10% +8-9% Operating Margin % % Operating Margin Growth -1 pt to stable -1 to -0.5 pt EPS ( ) EPS Growth +5-10% +6-8% /$ rates / rates Unchanged with initial guidance Q Licenses revenue up +6-10% exfx Recurring revenue up +8-9% exfx Services revenue up +9-14% exfx EPS up +5-10% (+16-22% exfx) FY 2018 Services revenue up ~+9% exfx (+12% in initial guidance), compensated by slightly better recurring revenue Total Revenue up 8-9% exfx with Licenses revenue up +8-10% exfx Recurring revenue up +7-8% exfx Operating margin -1 to -0.5 pt Acquisitions -0.6 pt, currencies -0.4 pt Tax rate of ~29.7% EPS up +6-8% (+11-13% exfx) 35
36 Agenda 1 2 Strategy at Work Q1 18 Business Review 3 Q1 18 Financial Highlights 4 Q2 & FY18 Financial Objectives 5 Financial Information Appendix 36
37 Table of Content IAS 18 Reconciliation of IFRS 15 & IAS 18 IFRS 15 37

38 Software Revenue by Region (IAS 18) IFRS in MEUR 1Q18 1Q17 Growth Growth ex FX Americas % +12% Europe % +7% Asia % +16% Software revenue % +11% Americas Europe Asia 38
39 Software Revenue by Region (IAS 18) Non-IFRS in MEUR 1Q18 1Q17 Growth Growth ex FX Americas % +11% Europe % +6% Asia % +16% Software revenue % +10% Americas Europe Asia 39
40 Revenue by Product Line (IAS 18) IFRS in MEUR 1Q18 1Q17 Growth Growth ex FX CATIA SW % +5% ENOVIA SW % +11% SOLIDWORKS SW % +13% Other SW % +17% Services % +0% Total revenue % +10% CATIA SW ENOVIA SW SOLIDWORKS SW Other SW Services 40

41 Revenue by Product Line (IAS 18) Non-IFRS in MEUR 1Q18 1Q17 Growth Growth ex FX CATIA SW % +5% ENOVIA SW % +11% SOLIDWORKS SW % +13% Other SW % +14% Services % +0% Total revenue % +9% CATIA SW ENOVIA SW SOLIDWORKS SW Other SW Services 41

42 Software Revenue Evolution (IAS 18) Non-IFRS Recurring Non-recurring 42
43 IFRS P&L (IAS 18) Three months ended March 31, (In millions of, except per share data) YoY Software revenue % Licenses and Other software revenue % Subscription and Support revenue % Services revenue % Total revenue % Cost of Software revenue (40.9) (40.4) +1.0% Cost of Services revenue (79.4) (82.8) -4.2% Research and development (152.7) (149.7) +2.0% Marketing and sales (253.0) (259.8) -2.6% General and administrative (69.7) (60.3) +15.7% Amortization of acquired intangibles (41.8) (41.2) +1.5% Other operating income and expense, net (2.5) (6.1) -59.0% Total operating expenses (639.9) (640.3) -0.1% Operating income % Financial revenue and other, net % Income tax expense (33.5) (40.3) -17.0% Non-controlling interest 0.3 (1.4) N/A Net Income (to equity holders of the parent) % Diluted net income per share (EPS) % Average diluted shares (Million)
44 IFRS P&L (%) (IAS 18) Three months ended March 31, % of revenue Software revenue 89.1% 88.2% Licenses and Other software revenue 23.5% 22.8% Subscription and Support revenue 65.7% 65.4% Services revenue 10.9% 11.8% Total revenue 100.0% 100.0% Cost of Software revenue 5.3% 5.3% Cost of Services revenue 10.3% 10.9% Research and development 19.8% 19.7% Marketing and sales 32.9% 34.2% General and administrative 9.1% 7.9% Amortization of acquired intangibles 5.4% 5.4% Other operating income and expense, net 0.3% 0.8% Total operating expenses 83.2% 84.3% Operating income 16.8% 15.7% Financial revenue and other, net 0.6% 1.0% Income tax rate (% of EBIT) 25.0% 31.8% Non-controlling interest 0.0% -0.2% Net Income (to equity holders of the parent) 13.1% 11.2% 44
45 Non-IFRS P&L (IAS 18) Three months ended March 31, (In millions of, except per share data) YoY Software revenue % Licenses and Other software revenue % Subscription and Support revenue % Services revenue % Total revenue % Cost of Software revenue (40.4) (39.9) +1.2% Cost of Services revenue (78.9) (82.2) -4.1% Research and development (140.4) (137.9) +1.8% Marketing and sales (246.6) (250.5) -1.6% General and administrative (56.5) (54.4) +3.8% Total operating expenses (562.8) (565.0) -0.4% Operating income % Financial revenue and other, net Income tax expense (61.6) (64.1) -3.9% Non-controlling interest 0.3 (1.4) N/A Net Income (to equity holders of the parent) % Diluted net income per share (EPS) % Average diluted shares (Million)
46 Non-IFRS P&L (%) (IAS 18) Three months ended March 31, Software revenue 89.2% 88.3% Licenses and Other software revenue 23.4% 22.6% Subscription and Support revenue 65.8% 65.7% Services revenue 10.8% 11.7% Total revenue 100.0% 100.0% Cost of Software revenue 5.2% 5.2% Cost of Services revenue 10.2% 10.7% Research and development 18.2% 18.0% Marketing and sales 32.0% 32.7% General and administrative 7.3% 7.1% Total operating expenses 73.0% 73.8% Operating income 27.0% 26.2% Financial revenue and other, net 0.7% 0.1% Income tax rate (% of EBIT) 28.9% 31.9% Non-controlling interest 0.0% -0.2% Net Income (to equity holders of the parent) 19.7% 17.7% 46
47 IFRS Non-IFRS Reconciliation QTD (IAS 18) Revenue and Gross Margin ( million, except % and per share data) 2018 IFRS Adjustment Three months ended March 31, 2018 Non-IFRS 2017 IFRS Adjustment 2017 Non-IFRS Increase (Decrease) IFRS Non-IFRS Total Revenue % 0.7% Total Revenue breakdown by activity Software revenue % 1.7% Licenses and Other software revenue % 4.3% Subscription and Support revenue % 0.8% Recurring portion of Software revenue 74% 74% 74% 74% Services revenue % -6.8% Total Revenue breakdown by product line CATIA SW revenue % 0.2% ENOVIA SW revenue % -1.0% SOLIDWORKS SW revenue % -0.6% Other SW revenue % 6.7% Services revenue % -6.8% Total Revenue breakdown by geography Americas revenue % -4.5% Europe revenue % 1.1% Asia revenue % 6.0% Gross Margin Cost of Software revenue ( 40.9) 0.5 ( 40.4) ( 40.4) 0.5 ( 39.9) 1.0% 1.2% Software Gross margin* 94.0% 94.1% 94.0% 94.1% Cost of Services revenue ( 79.4) 0.5 ( 78.9) ( 82.8) 0.6 ( 82.2) -4.2% -4.1% Service Gross margin 4.9% 5.6% 7.5% 8.2% * No amortization of acquired intangibles is included in Software Gross margin calculation 47
48 IFRS Non-IFRS Reconciliation QTD (IAS 18) Expenses & Earnings ( million, except % and per share data) 2018 IFRS Adjustment Three months ended March 31, 2018 Non-IFRS 2017 IFRS Adjustment 2017 Non-IFRS Increase (Decrease) IFRS Non-IFRS Total Operating Expenses ( 639.9) 77.1 ( 562.8) ( 640.3) 75.2 ( 565.0) -0.1% -0.4% Share-based compensation expense ( 32.8) ( 27.9) Amortization of acquired intangibles ( 41.8) ( 41.2) Other operating income and expense, net ( 2.5) ( 6.1) Operating Income % 3.8% Operating Margin 16.8% 27.0% 15.7% 26.2% Financial revenue & other, net ( 6.7) % - Income tax expense ( 33.5) ( 28.2) ( 61.6) ( 40.3) ( 23.8) ( 64.1) -17.0% -3.9% Non-controlling interest ( 1.4) ( 1.4) N/A N/A Net Income attributable to shareholders % 12.1% Diluted net income per share, in EUR % 11.3% ( million) 2018 IFRS Adjust. Three months ended March 31, 2018 Non-IFRS 2017 IFRS Adjust Non-IFRS Cost of revenue ( 120.3) 1.0 ( 119.3) ( 123.3) 1.1 ( 122.2) Research and development ( 152.7) 12.2 ( 140.4) ( 149.7) 11.8 ( 137.9) Marketing and sales ( 253.0) 6.4 ( 246.6) ( 259.8) 9.2 ( 250.5) General and administrative ( 69.7) 13.2 ( 56.5) ( 60.3) 5.9 ( 54.4) Total Share-based compensation expense
49 Financial Revenue and Other (IAS 18) Non-IFRS MEUR 1Q18 1Q17 var Interest Income Interest Expense (3.8) (3.3) (0.5) Financial net Income Exchange Gain / (Loss) 0.7 (0.5) 1.2 Other Income / (Loss) 1.0 (0.1) 1.1 Total
50 Exchange Rate evolution (IAS 18) From assumptions to actual data Breakdown of P&L by currency for YTD 18 Average Exchange rates Revenue Operating Expenses % change USD 35.1% 33.6% QTD EUR/USD % EUR/JPY % JPY 13.7% 5.1% YTD EUR/USD % EUR/JPY % EUR/$ 1Q18/1Q17 Variance EUR/ 1Q18/1Q17 Variance Average EUR/$ rate > Q18 1Q in average Average EUR/ rate > Q18 1Q in average in average in average 50
51 Comparing 1Q18 with mid-range Objectives (IAS 18) Non-IFRS Revenue Operating Operating Operating Expenses Profit Margin 1Q18 Guidances mid-range (558.6) % Growth YoY -0.7% -1.1% +0.3% +0.3pt USD impact 3.5 (3.0) pt JPY impact including hedging 0.7 (0.4) pt Other currencies and other hedging impact pt Total FX 5.9 (2.7) pt Activity / Cost Control / Other 5.3 (1.5) pt Delta: Reported vs guidances 11.2 (4.2) pt 1Q18 Reported (562.8) % Growth YoY +0.7% -0.4% +3.8% +0.8pt 1Q17 Reported (565.0) % 51
52 Estimated FX impact on 1Q18 Op. Results (IAS 18) Non-IFRS millions QTD Total Revenue Operating Expenses Operating Income Operating Margin 1Q18 Reported (562.8) % 1Q17 Reported (565.0) % Growth as reported +0.7% -0.4% +3.8% +0.8 pt Impact of Actual Currency Rates USD impact (43.5) 26.4 (17.1) JPY impact including hedging (7.4) 2.8 (4.6) Other currencies and other hedging impact (8.2) 6.4 (1.8) Total FX Impact adjustment (59.1) 35.6 (23.5) 1Q17 ex FX (529.4) % Growth exfx +9% +6% +18% +1.9 pt 52
53 Consolidated Statement of Cash Flows (IAS 18) (in millions of ) 1Q18 1Q17 Variation Net income attributable to equity holders of the parent Non-controlling interest (0.3) 1.4 (1.7) Net income Depreciation of property & equipment Amortization of intangible assets Other non-cash P&L items Changes in working capital Net Cash Provided by (Used in) Operating Activities (I) Additions to property, equipment and intangibles (11.9) (18.3) 6.4 Payment for acquisition of businesses, net of cash acquired - (0.4) 0.4 Sale (Purchase) of short-term investments, net (40.1) (8.8) (31.3) Investments, loans and others (0.1) 6.3 (6.4) Net Cash Provided by (Used in) Investing Activities (II) (52.1) (21.2) (30.9) (Purchase) Sale of treasury stock Proceeds from exercise of stock-options Net Cash Provided by (Used in) Financing Activities (III) Effect of exchange rate changes on cash and cash equivalents (IV) (31.1) (6.3) (24.8) Increase (Decrease) in Cash (V) = (I)+(II)+(III)+(IV) Cash and cash equivalents at Beginning of Period Cash and cash equivalents at End of Period Cash and cash equivalents variation
54 Balance Sheet (IAS 18) IFRS End of End of Variation (in millions of ) Mar-18 Dec-17 Mar-18 / Dec-17 Cash and cash equivalents 2, , Short-term investments Accounts receivable, net Other current assets Total current assets 3, , Property and equipment, net Goodwill and Intangible assets, net 2, , Other non current assets Total Assets 7, , Accounts payable Unearned revenue 1, Other current liabilities Total current liabilities 1, , Long-term debt 1, , Other non current obligations Total long-term liabilities 1, , Non-controlling interest Parent Shareholders' equity 4, , Total Liabilities and Shareholders' Equity 7, ,

55 55 Trade Accounts Receivable DSO (IAS 18)
56 Headcount by destination Closing H/C - March 2018 At Closing - TOTAL 1Q18 1Q17 % growth 4Q17 % growth M&S + COR Ser % % R&D + COR SW % % G&A % % Total % % 41% 10% 49% M&S + COR Ser R&D + COR SW G&A 56
57 IFRS 2018 Objectives (IAS 18) Accounting elements not included in the non-ifrs 2018 Objectives FY 2018 estimated deferred revenue write-down of ~ 5m FY 2018 estimated share-based compensation expenses, including related social charges: ~78m FY 2018 estimated amortization of acquired intangibles: ~ 160m The non-ifrs 2018 objectives do not include any impact from other operating income and expense, net principally comprised of acquisition, integration and restructuring expenses, and from one-time items included in financial revenue and one-time tax restructuring gains and losses These estimates do not include any new stock option or share grants, or any new acquisitions or restructurings completed after April 25,
58 Table of Content IAS 18 Reconciliation of IFRS 15 & IAS 18 IFRS 15 58
59 Summary of Principal Differences of IFRS 15 Compared to IAS 18 The Company has adopted IFRS 15 as of January 1, 2018 using the modified retrospective transition method (also called the cumulative effect method). Under this method, the transition effect is accounted for within the consolidated equity at the date of initial application, i.e. January 1, 2018, without any adjustment to the prior year comparative information. The main differences between IFRS15 and IAS18 standards are described below: Recurring software: Recurring software is comprised of subscription and support revenue. IFRS 15 has an impact on the timing of the quarterly recognition of subscription revenue but on a full year basis there is essentially no difference between IFRS 15 and IAS 18 for subscription contracts of one year in length. For the 2018 first quarter, recurring software revenue was million in non-ifrs under IFRS 15 and was 50.8 million higher compared to the prior IAS 18 standard. Previously, under IAS 18, we showed a ratable quarterly amount based upon the annual contract level of our on-premise subscription software. Under IFRS 15, for new contracts entered into or for contracts renewing, we have assigned an upfront value as required which is recognized in the first quarter of the contract, and the remainder which is recognized ratably during the four quarters. We continue to report both of these amounts within recurring revenue, specifically as subscription revenue (previously called periodic revenue). Historically, a higher proportion of subscription contracts are renewed in the first quarter of the year than in the other three quarters of the year. Operating expenses and sales commissions: The Company continues to expense sales commissions under the IFRS 15 standard as was done under IAS 18. Therefore, there are no capitalized sales commissions. As a result, the Company s operating expenses are identical under IFRS 15 and IAS 18. One-time permanent difference: The implementation of IFRS 15 on January 1, 2018 resulted in a one-time permanent difference between IFRS 15 and IAS 18, where the deferred portion of rental agreements concluded in prior years will not be recognized into revenue. As a result, the corresponding amount of 110 million before income taxes or 80 million net of taxes, was recorded in stockholders equity as of January 1, Initial impact on unearned revenue: At March 31, 2018 unearned revenue on the Balance Sheet under IFRS 15 is not directly comparable to the year-ago March 31, 2017 balance sheet under the prior standard IAS 18. This is due to the fact that the March 31, 2018 balance sheet line item unearned revenue has been reduced by million, reflecting (i) the one-time permanent difference of 110 million noted above, and (ii) the higher amount of recurring revenue recognized in the first quarter under IFRS 15 compared to IAS 18 in the amount of 49.4 million. 59
60 IFRS15 IAS18 Non GAAP Reconciliation 2018 Non-IFRS In millions of Euros, except per share data and percentages QTD Difference QTD IFRS15 IAS18 Total Revenue (49.4) Total Revenue breakdown by activity Software revenue (49.4) Licenses and Other software revenue Subscription and Support revenue (50.8) Recurring portion of Software revenue 76% 74% Services revenue Total Software Revenue breakdown by product line CATIA software revenue (13.8) ENOVIA software revenue 74.7 (1.8) 72.9 SOLIDWORKS software revenue Other software revenue (37.0) Total Revenue breakdown by geography Americas (13.8) Europe (36.1) Asia Total Operating Expenses (562.8) (562.8) Share-based compensation expense Amortization of acquired intangibles Other operating income and expense, net Operating Income (49.4) Operating Margin 31.4% -4.4pts 27.0% Financial revenue & other, net Income tax expense (75.6) 14.0 (61.6) Non-controlling interest Net Income attributable to shareholders (35.4) Diluted Net Income Per Share (3) 0.72 (0.13) Non-IFRS In millions of Euros 2018 Difference 2018 IFRS15 IAS18 Cost of revenue (119.3) (119.3) Research and development (140.4) (140.4) Marketing and sales (246.6) (246.6) General and administrative (56.5) (56.5) Total share-based compensation expense - 60
61 Balance Sheet IFRS15 / IAS 18 Reconciliation IFRS (in millions of ) IFRS15 Difference IAS 18 Cash and cash equivalents 2, ,803.8 Short-term investments Accounts receivable, net Other current assets Total current assets 3, ,809.9 Property and equipment, net Goodwill and Intangible assets, net 2, ,899.2 Other non current assets Total Assets 7, ,161.1 Accounts payable Contract liabilities - Unearned revenue ,001.0 Other current liabilities Total current liabilities 1, ,586.9 Long-term debt 1, ,000.0 Other non current obligations Total long-term liabilities 1, ,499.4 Non-controlling interest Parent Shareholders' equity 4, ,073.2 Difference in Contract liabilities / Unearned revenue: + 158m including Initial IFRS 15 implementation impact: 110m; Q impact: 49m. Difference in tax: + (44)m including (14)m in other non-current assets; (29)m in other current liabilities. Total Liabilities and Shareholders' Equity 7, ,
62 Table of Content IAS 18 Reconciliation of IFRS 15 & IAS 18 IFRS 15 62
63 IFRS Non-IFRS Reconciliation QTD (IFRS15) Revenue and Gross Margin ( million, except % and per share data) Three months ended March 31, 2018 IFRS Adjustment 2018 Non-IFRS Total Revenue Total Revenue breakdown by activity Software revenue Licenses and Other software revenue Subscription and Support revenue Recurring portion of Software revenue 76% 76% Services revenue Total Revenue breakdown by product line CATIA SW revenue ENOVIA SW revenue SOLIDWORKS SW revenue Other SW revenue Services revenue Total Revenue breakdown by geography Americas revenue Europe revenue Asia revenue Gross Margin Cost of Software revenue ( 40.9) 0.5 ( 40.4) Software Gross margin* 94.4% 94.5% Cost of Services revenue ( 79.4) 0.5 ( 78.9) Services Gross margin 5.0% 5.6% As set forth in DS-17Q4 Earnings Presentation, prior year financial data were not restated in IFRS15 due to the transition methodology used. Therefore, there is no available comparison with Q figures under IFRS15. 63
64 IFRS Non-IFRS Reconciliation QTD (IFRS15) Expenses & Earnings ( million, except % and per share data) Three months ended March 31, 2018 IFRS Adjustment 2018 Non-IFRS Total Operating Expenses ( 639.9) 77.1 ( 562.8) Share-based compensation expense ( 32.8) Amortization of acquired intangibles ( 41.8) Other operating income and expense, net ( 2.5) Operating Income Operating Margin 21.8% 31.4% Financial revenue & other, net Income tax expense ( 47.5) ( 28.2) ( 75.6) Non-controlling interest Net Income attributable to shareholders Diluted net income per share, in EUR As set forth in DS-17Q4 Earnings Presentation, prior year financial data were not restated in IFRS15 due to the transition methodology used. Therefore, there is no available comparison with Q figures under IFRS15. ( million) Three months ended March 31, 2018 IFRS Adjust Non-IFRS Cost of revenue ( 120.3) 1.0 ( 119.3) Research and development ( 152.7) 12.2 ( 140.4) Marketing and sales ( 253.0) 6.4 ( 246.6) General and administrative ( 69.7) 13.2 ( 56.5) Total Share-based compensation expense
65 IFRS - Non-IFRS P&L (IFRS15) (In millions of, except per share data) Three months ended March 31, 2018 IFRS Adjustment 2018 Non-IFRS Software revenue Licenses and Other software revenue Subscription and Support revenue Services revenue Total revenue As set forth in DS-17Q4 Earnings Presentation, prior year financial data were not restated in IFRS15 due to the transition methodology used. Therefore, there is no available comparison with Q figures under IFRS15. Cost of Software revenue (40.9) 0.5 (40.4) Cost of Services revenue (79.4) 0.5 (78.9) Research and development (152.7) 12.2 (140.4) Marketing and sales (253.0) 6.4 (246.6) General and administrative (69.7) 13.2 (56.5) Amortization of acquired intangibles (41.8) Other operating income and expense, net (2.5) Total operating expenses (639.9) 77.1 (562.8) Operating income Financial revenue and other, net Income tax expense (47.5) (28.2) (75.6) Non-controlling interest Net Income (to equity holders of the parent) Diluted net income per share (EPS) Average diluted shares (Million)
66 IFRS - Non-IFRS P&L (%) (IFRS15) IFRS QTD NON IFRS QTD Software revenue 89.8% 89.8% Licenses and Other software revenue 21.9% 21.8% Subscription and Support revenue 67.9% 68.0% Services revenue 10.2% 10.2% Total revenue 100.0% 100.0% 2018 % of revenue As set forth in DS-17Q4 Earnings Presentation, prior year financial data were not restated in IFRS15 due to the transition methodology used. Therefore, there is no available comparison with Q figures under IFRS15. Cost of Software revenue 5.0% 4.9% Cost of Services revenue 9.7% 9.6% Research and development 18.6% 17.1% Marketing and sales 30.9% 30.1% General and administrative 8.5% 6.9% Amortization of acquired intangibles 5.1% 0.0% Other operating income and expense, net 0.3% 0.0% Total operating expenses 78.2% 68.6% Operating income 21.8% 31.4% Financial revenue and other, net 0.6% 0.6% Income tax rate (% of EBIT) 25.9% 28.8% Non-controlling interest 0.0% 0.0% Net Income (to equity holders of the parent) 16.6% 22.9% 66
67 Balance Sheet (IFRS15) IFRS (in millions of ) End of Mar-18 Cash and cash equivalents 2,803.8 Short-term investments 41.3 Accounts receivable, net Other current assets Total current assets 3,809.9 Property and equipment, net Goodwill and Intangible assets, net 2,899.2 Other non current assets Total Assets 7,146.8 Accounts payable Contract liabilities Other current liabilities Total current liabilities 1,457.9 Long-term debt 1,000.0 Other non current obligations Total long-term liabilities 1,499.4 Non-controlling interest 1.6 Parent Shareholders' equity 4,187.9 Total Liabilities and Shareholders' Equity 7,
68 Consolidated Statement of Cash Flows (IFRS 15) IFRS 1Q18 (in millions of ) Net income attributable to equity holders of the parent Non-controlling interest (0.3) Net income Depreciation of property & equipment 13.7 Amortization of intangible assets 43.9 Other non-cash P&L items 16.7 Changes in working capital Net Cash Provided by (Used in) Operating Activities (I) Additions to property, equipment and intangibles (11.9) Payment for acquisition of businesses, net of cash acquired 0.0 Sale (Purchase) of short-term investments, net (40.1) Investments, loans and others (0.1) Net Cash Provided by (Used in) Investing Activities (II) (52.1) (Purchase) Sale of treasury stock 8.4 Proceeds from exercise of stock-options 12.3 Net Cash Provided by (Used in) Financing Activities (III) 20.7 Effect of exchange rate changes on cash and cash equivalents (IV) (31.1) Increase (Decrease) in Cash (V) = (I)+(II)+(III)+(IV) Cash and cash equivalents at Beginning of Period Cash and cash equivalents at End of Period Cash and cash equivalents variation
69 69
Analysts Meeting Q Bernard Charlès, President and CEO Thibault de Tersant, Senior EVP, CFO
 Analysts Meeting Q3 2015 Bernard Charlès, President and CEO Thibault de Tersant, Senior EVP, CFO 1 Forward Looking Information Statements herein that are not historical facts but express expectations or
Analysts Meeting FY & Q4 2015
 1 Analysts Meeting FY & Q4 2015 Forward Looking Information Such forward-looking statements are based on Dassault Systèmes management's current views and assumptions and involve known and unknown risks
Dassault Systèmes Reports Q3 and YTD EPS Up Double-Digits and Reaffirms 2018 Growth Objectives
 Dassault Systèmes Reports Q3 and YTD EPS Up Double-Digits and Reaffirms 2018 Growth Objectives VÉLIZY-VILLACOUBLAY, France October 24, 2018 Dassault Systèmes (Euronext Paris: #13065, DSY.PA), announces
Analysts Meeting Q Bernard Charlès, President and CEO Thibault de Tersant, Senior EVP, CFO
 Analysts Meeting Q3 2014 Bernard Charlès, President and CEO Thibault de Tersant, Senior EVP, CFO 1 Forward Looking Information Statements herein that are not historical facts but express expectations or
Analysts Meeting Q2 2014
 Analysts Meeting Q2 2014 Bernard Charlès, President and CEO Thibault de Tersant, Senior EVP, CFO 1 Forward Looking Information Statements herein that are not historical facts but express expectations or
Analysts Meeting Q2 & H1 2016
 Analysts Meeting Q2 & H1 2016 Forward Looking Information Statements herein that are not historical facts but express expectations or objectives for the future, including but not limited to statements
Dassault Systèmes Q4 & FY 2018 Earnings Presentation. Bernard Charlès, Vice-Chairman & CEO Pascal Daloz, EVP, CFO & Corporate Strategy Officer
 Dassault Systèmes Q4 & FY 2018 Earnings Presentation Bernard Charlès, Vice-Chairman & CEO Pascal Daloz, EVP, CFO & Corporate Strategy Officer Forward Looking Information Statements herein that are not
Dassault Systèmes Q2 & H Earnings Presentation. Bernard Charlès, Vice-Chairman & CEO Pascal Daloz, EVP, CFO & Corporate Strategy Officer
 Dassault Systèmes Q2 & H1 2018 Earnings Presentation Bernard Charlès, Vice-Chairman & CEO Pascal Daloz, EVP, CFO & Corporate Strategy Officer H1 2018 Highlights Non-IFRS (under IAS 18) Good H1 2018 in
Analysts Meeting Q4 & FY Bernard Charlès, Vice-Chairman of the Board of Directors & CEO Thibault de Tersant, Senior EVP, CFO
 Analysts Meeting Q4 & FY 2016 Bernard Charlès, Vice-Chairman of the Board of Directors & CEO Thibault de Tersant, Senior EVP, CFO Forward Looking Information Statements herein that are not historical facts
Dassault Systèmes Reports Solid Third Quarter Led by Large Accounts Industry Solutions Engagements
 Dassault Systèmes Reports Solid Third Quarter Led by Large Accounts Industry Solutions Engagements VÉLIZY-VILLACOUBLAY, France October 23, 2014 Dassault Systèmes (Euronext Paris: #13065, DSY.PA), the 3DEXPERIENCE
Analysts Meeting Q1 2012
 Analysts Meeting Q1 2012 A Strategic Move Towards Natural Resources Bernard Charles, President and CEO Thibault de Tersant, Senior EVP and CFO 1 Forward Looking Information Statements herein that are not
Analysts Meeting Q Bernard Charlès, President and CEO Thibault de Tersant, Senior EVP, CFO
 Analysts Meeting Q2 2015 Bernard Charlès, President and CEO Thibault de Tersant, Senior EVP, CFO 1 Forward Looking Information Statements herein that are not historical facts but express expectations or
Dassault Systèmes Q3 & YTD 2018 Earnings Presentation. Bernard Charlès, Vice-Chairman & CEO Pascal Daloz, EVP, CFO & Corporate Strategy Officer
 Dassault Systèmes Q3 & YTD 2018 Earnings Presentation Bernard Charlès, Vice-Chairman & CEO Pascal Daloz, EVP, CFO & Corporate Strategy Officer Forward Looking Information Statements herein that are not
Analysts Meeting FY12 & Q412
 3DS.COM Dassault Systèmes Q4 & FY2012 Earnings Presentation Analysts Meeting FY12 & Q412 Building Up 3DEXPERIENCE Bernard Charlès, President and CEO Thibault de Tersant, Senior EVP and CFO 1 Forward Looking
Dassault Systèmes Raises EPS Guidance for 2018
 Dassault Systèmes Raises EPS Guidance for 2018 VÉLIZY-VILLACOUBLAY, France July 25, 2018 Dassault Systèmes (Euronext Paris: #13065, DSY.PA), announces IFRS unaudited financial results for the second quarter
Analysts Meeting Q1 2013
 Analysts Meeting Q1 2013 Bernard Charlès, President and CEO Thibault de Tersant, Senior EVP and CFO 1 Forward Looking Information Statements herein that are not historical facts but express expectations
Dassault Systèmes Reports Strong 3DEXPERIENCE-driven Growth with Fourth Quarter Total Revenue up 13% and Software Revenue up 11% at constant currency
 Dassault Systèmes Reports Strong 3DEXPERIENCE-driven Growth with Fourth Quarter Total Revenue up 13% and Software Revenue up 11% at constant currency VÉLIZY-VILLACOUBLAY, France February 6, 2019 Dassault
Dassault Systèmes Reports Strong Third Quarter EPS Growth
 Dassault Systèmes Reports Strong Third Quarter EPS Growth VÉLIZY-VILLACOUBLAY, France October 22, 2015 Dassault Systèmes (Euronext Paris: #13065, DSY.PA), the 3DEXPERIENCE Company, world leader in 3D design
Dassault Systèmes Reports Double-digit Software Revenue and EPS Growth for 2012
 Dassault Systèmes Reports Double-digit Software Revenue and EPS Growth for 2012 Paris, France February 7, 2013 Dassault Systèmes (Euronext Paris: #13065, DSY.PA), the 3DEXPERIENCE Company, world leader
Dassault Systèmes Reports Solid Second Quarter Performance and Reconfirms Full Year Outlook
 Dassault Systèmes Reports Solid Second Quarter Performance and Reconfirms Full Year Outlook VÉLIZY-VILLACOUBLAY, France July 24, 2014 Dassault Systèmes (Euronext Paris: #13065, DSY.PA), the 3DEXPERIENCE
Dassault Systèmes Analysts Meeting Q2 2011
 Dassault Systèmes Analysts Meeting Q2 2011 Bernard Charlès, President and CEO Thibault de Tersant, Senior EVP and CFO 1 Forward Looking Information Statements herein that are not historical facts but express
Analysts Meeting Q1 2014
 Analysts Meeting Q1 2014 Bernard Charlès, President and CEO Thibault de Tersant, Senior EVP, CFO 1 Important Information This presentation is neither an offer to purchase nor a solicitation of an offer
DS Reports 2008 Second Quarter Software Revenue Growth Above 15% in Constant Currencies
 DS Reports 2008 Second Quarter Software Revenue Growth Above 15% in Constant Currencies Paris, France, July 31, 2008 Dassault Systèmes (DS) (Nasdaq: DASTY; Euronext Paris: #13065, DSY.PA) reported U.S.
Dassault Systèmes Reports Revenue Growth of 4% in Q3 and 6% YTD in Constant Currencies
 Dassault Systèmes Reports Revenue Growth of 4% in Q3 and 6% YTD in Constant Currencies Paris, France - October 24, 2013 Dassault Systèmes (Euronext Paris: #13065, DSY.PA), the 3DEXPERIENCE Company, world
DASSAULT SYSTEMES HALF-YEAR FINANCIAL REPORT
 DASSAULT SYSTEMES HALF-YEAR FINANCIAL REPORT June 30, 2009 Public limited liability company Common stock, nominal value 1 per share: 117,866,151 euros Registered Office: 10, rue Marcel Dassault 78140 Vélizy-Villacoublay
DASSAULT SYSTEMES HALF-YEAR FINANCIAL REPORT
 DASSAULT SYSTEMES HALF-YEAR FINANCIAL REPORT June 30, 2012 Public limited liability company Common stock, nominal value 1 per share: 125,059,208 euros Registered Office: 10, rue Marcel Dassault 78140 Vélizy-Villacoublay
2008 First Quarter Newswire Conference Call Tuesday, April 29, Final
 2008 First Quarter Newswire Conference Call Tuesday, April 29, 2008 Final Thibault de Tersant Senior Executive Vice President and CFO Introduction Good morning. I am pleased to speak with you to give an
DASSAULT SYSTEMES HALF-YEAR FINANCIAL REPORT
 DASSAULT SYSTEMES HALF-YEAR FINANCIAL REPORT June 30, 2013 Public limited liability company Common stock, nominal value 1 per share: 126,130,441 euros Registered Office: 10, rue Marcel Dassault 78140 Vélizy-Villacoublay
Financial results & business update
 Financial results & business update Quarter ended 31 March 2019 16 April 2019 Disclaimer Any remarks that we may make about future expectations, plans and prospects for the company constitute forward-looking
Financial results & business update. Quarter ended 30 September October 2017
 Financial results & business update Quarter ended 30 September 2017 18 October 2017 Disclaimer 3 Any remarks that we may make about future expectations, plans and prospects for the company constitute forward-looking
Helping Clients Win with Digital
 First Quarter 2018 Earnings Supplement Helping Clients Win with Digital May 7, 2018 2017 Cognizant Forward Looking Statements and Non-GAAP Financial Measures This earnings supplement includes statements
Financial results & business update. Quarter and year ended 31 December February 2016
 Financial results & business update Quarter and year ended 31 December 2015 11 February 2016 Disclaimer 3 Any remarks that we may make about future expectations, plans and prospects for the company constitute
Financial results & business update. Quarter and year ended 31 December February 2017
 Financial results & business update Quarter and year ended 31 December 2016 14 February 2017 Disclaimer 3 Any remarks that we may make about future expectations, plans and prospects for the company constitute
Financial results & business update. Quarter ended 31 March April 2018
 Financial results & business update Quarter ended 31 March 2018 18 April 2018 Disclaimer 3 Any remarks that we may make about future expectations, plans and prospects for the company constitute forward-looking
ANSYS, INC. FIRST QUARTER 2011 EARNINGS ANNOUNCEMENT PREPARED REMARKS May 5, 2011
 ANSYS, INC. FIRST QUARTER 2011 EARNINGS ANNOUNCEMENT PREPARED REMARKS May 5, 2011 ANSYS is providing a copy of its prepared remarks in combination with its earnings announcement. This process and these
Capgemini records an excellent performance in 2017 with growth acceleration fueled by Digital and Cloud
 Press relations: Florence Lièvre Tel.: +33 1 47 54 50 71 florence.lievre@capgemini.com Investor relations: Vincent Biraud Tel.: +33 1 47 54 50 87 vincent.biraud@capgemini.com Capgemini records an excellent
Financial results & business update. Quarter ended 30 September October 2016
 Financial results & business update Quarter ended 30 September 2016 19 October 2016 Disclaimer 3 Any remarks that we may make about future expectations, plans and prospects for the company constitute forward-looking
Temenos announces very strong start to 2018 with Q1 total software licensing growth of 40%
 Temenos announces very strong start to 2018 with Q1 total software licensing growth of 40% GENEVA, Switzerland, 18 April 2018 Temenos Group AG (SIX: TEMN), the banking software company, today reports its
Second Quarter 2018 Earnings
 Second Quarter 2018 Earnings John Visentin, CEO Bill Osbourn, CFO July 26, 2018 http://www.xerox.com/investor Forward-Looking Statements This presentation, and other written or oral statements made from
Temenos announces very strong Q3 results, full year guidance raised
 Temenos announces very strong Q3 results, full year guidance raised GENEVA, Switzerland, 17 October 2018 Temenos AG (SIX: TEMN), the banking software company, today reports its third quarter 2018 results.
ANSYS, INC. SECOND QUARTER 2018 EARNINGS ANNOUNCEMENT PREPARED REMARKS August 6, 2018
 ANSYS, INC. SECOND QUARTER 2018 EARNINGS ANNOUNCEMENT PREPARED REMARKS August 6, 2018 ANSYS is providing a copy of its prepared remarks in connection with its earnings announcement. These remarks are offered
Q order intake and sales 19 October 2017
 Q3 2017 order intake and sales 19 October 2017 www.thalesgroup.com Q3 order intake and sales Update on implementation of IFRS 15 standard 2017 outlook Q3 2017 highlights New London underground signaling
Accelerating the Shift to Digital
 Fourth Quarter 2017 Earnings Supplement Accelerating the Shift to Digital February 7, 2018 2017 Cognizant Forward Looking Statements and Non-GAAP Financial Measures This earnings supplement includes statements
Financial results & business update. Quarter ended 30 June July 2017
 Financial results & business update Quarter ended 30 June 2017 19 July 2017 Disclaimer 3 Any remarks that we may make about future expectations, plans and prospects for the company constitute forward-looking
REXEL. Q3 & 9-month 2009 results. November 12, 2009
 REXEL Q3 & 9-month 2009 results November 12, 2009 Q3 2009 & 9-month results Q3 and 9-month 2009 at a glance Financial review Outlook 3 Q3 & 9-month 2009 at a glance Q3 & 9-month 2009 highlights: Quarter-on-quarter
PTC PREPARED REMARKS SECOND QUARTER FISCAL 2018 APRIL 18, 2018
 PTC PREPARED REMARKS SECOND QUARTER FISCAL 2018 APRIL 18, 2018 Please refer to the Important Disclosures section of these prepared remarks for important information about our operating metrics (including
KONE Q APRIL 25, 2018 HENRIK EHRNROOTH, PRESIDENT & CEO ILKKA HARA, CFO
 KONE 2018 APRIL 25, 2018 HENRIK EHRNROOTH, PRESIDENT & CEO ILKKA HARA, CFO 2018 Highlights Solid growth in orders received with stabilizing margins Profitability continued to be burdened Good progress
ZEBRA TECHNOLOGIES FIRST QUARTER 2016 RESULTS May 10, 2016
 ZEBRA TECHNOLOGIES FIRST QUARTER 2016 RESULTS May 10, 2016 Anders Gustafsson Chief Executive Officer Mike Smiley Chief Financial Officer 2 Safe Harbor Statement Statements made in this presentation which
Financial Results for Q April 25, 2018
 Financial Results for Q1 2018 April 25, 2018 SAFE HARBOR This presentation contains forward-looking statements regarding Teradyne s future business prospects, results of operations, market conditions,
2017 Full Year Results
 2017 Full Year Results Title of the presentation 2 lines Location, Date, Author Paris February 15 th, 2018 Disclaimer This presentation may contain forward-looking statements, Such statements may include
AVEVA GROUP PLC RESULTS FOR THE SIX MONTHS ENDED 30 SEPTEMBER November 2017
 AVEVA GROUP PLC RESULTS FOR THE SIX MONTHS ENDED 30 SEPTEMBER 2017 14 November 2017 This presentation may include predictions, estimates, intentions, beliefs and other statements that are or may be construed
Trimble Second Quarter 2018 Results Summary
 Trimble Second Quarter 2018 Results Summary Forward-looking statements Certain statements made in this presentation and any subsequent Q&A period are forward-looking statements, within the meaning of Section
2018 Half year results 20 July 2018
 2018 Half year results 20 July 2018 www.thalesgroup.com H1 2018 business environment Aerospace Ground transportation Defence & Security Aeronautics: positive dynamics for cockpit avionics and in-flight
PTC SECOND QUARTER FISCAL 2017 PREPARED REMARKS APRIL 19, 2017
 PTC SECOND QUARTER FISCAL 2017 PREPARED REMARKS APRIL 19, 2017 Please refer to the Important Disclosures section of these prepared remarks for important information about our operating metrics (including
Financial Information
 Accelerating & profit in H1: Revenue up +4% reported, Adj. EBITA +8%, Net Income +18%, FCF +15% H1 revenue of 12.2bn, +2.7% organic, +4.1% outside Infrastructure H1 adj. EBITA margin up 60bps 1 org., to
2017 Half year results 26 July 2017
 2017 Half year results 26 July 2017 www.thalesgroup.com H1 2017 business environment Aerospace Avionics: continued positive dynamics for cockpit avionics and in-flight entertainment and connectivity Space:
AUTODESK, INC. (ADSK) SECOND QUARTER FISCAL 2019 EARNINGS ANNOUNCEMENT AUGUST 23, 2018 PREPARED REMARKS
 SECOND QUARTER FISCAL 2019 EARNINGS ANNOUNCEMENT AUGUST 23, 2018 PREPARED REMARKS") AUTODESK, INC. (ADSK) SECOND QUARTER FISCAL 2019 EARNINGS ANNOUNCEMENT AUGUST 23, 2018 PREPARED REMARKS Autodesk posts its prepared remarks and press release to its IR website to provide shareholders and
AUTODESK, INC. (ADSK) SECOND QUARTER FISCAL 2019 EARNINGS ANNOUNCEMENT AUGUST 23, 2018 PREPARED REMARKS Autodesk posts its prepared remarks and press release to its IR website to provide shareholders and
Q results. April 27, 2018
 Q1 2018 results April 27, 2018 Consolidated financial statements as of March 31, 2018 were authorized for issue by the Board of Directors held on April 26, 2018. Q118 KEY HIGHLIGHTS Q1 2018 in line with
REUTERS / Vasily Fedosenko REUTERS / Mike Blake THOMSON REUTERS 2018 FIRST-QUARTER RESULTS. May 11, 2018
 REUTERS / Vasily Fedosenko REUTERS / Mike Blake THOMSON REUTERS 2018 FIRST-QUARTER RESULTS May 11, 2018 Agenda Welcome / Introduction Frank Golden First Quarter 2018 Highlights F&R Strategic Partnership
Wolters Kluwer 2018 Full-Year Results
 Wolters Kluwer 2018 Full-Year Results Nancy McKinstry CEO Kevin Entricken CFO February 20, 2019 2018 Full-Year Results 1 Forward-looking Statements This presentation contains forward-looking statements.
Xerox Investor Handout as of Q Third Quarter 2018 Earnings
 Xerox Investor Handout as of Q4 2018 Third Quarter 2018 Earnings http://www.xerox.com/investor Forward-Looking Statements This presentation, and other written or oral statements made from time to time
ANSYS, INC. FOURTH QUARTER 2017 EARNINGS ANNOUNCEMENT PREPARED REMARKS February 21, 2018
 ANSYS, INC. FOURTH QUARTER 2017 EARNINGS ANNOUNCEMENT PREPARED REMARKS February 21, 2018 ANSYS is providing a copy of its prepared remarks in connection with its earnings announcement. These remarks are
EVRY ASA Q PRESENTATION CEO BJÖRN IVROTH CFO HENRIK SCHIBLER
 1 EVRY ASA Q1 2018 PRESENTATION CEO BJÖRN IVROTH CFO HENRIK SCHIBLER Agenda Group highlights Business update Financial highlights Business area performance Targets and Concluding remarks Q&A 2 Group highlights
Q3 Fiscal Year 2016 Financial Results January 20, 2016
 Q3 Fiscal Year 2016 Financial Results January 20, 2016 FORWARD-LOOKING STATEMENTS This presentation contains forward-looking statements within the meaning of the federal securities laws, including, without
Q Earnings Call. November 5, 2012
 Q4 2012 Earnings Call November 5, 2012 Forward-Looking Statements and Non-GAAP Measures Forward-Looking Statements -- This presentation contains certain forward-looking statements within the meaning of
AIRBUS 9m Results 2017
 AIRBUS 9m Results 2017 31 October 2017 Harald Wilhelm Chief Financial Officer SAFE HARBOUR STATEMENT 2 DISCLAIMER This presentation includes forward-looking statements. Words such as anticipates, believes,
Q Earnings Call February 20, 2019
 Q4 2018 Earnings Call February 20, 2019 1 Forward-looking statements Safe Harbor Statement This release contains forward-looking statements, which may concern our plans, objectives, outlook, goals, strategies,
AIRBUS FY Results 2017
 AIRBUS FY Results 2017 15 February 2018 Tom Enders Chief Executive Officer Harald Wilhelm Chief Financial Officer SAFE HARBOUR STATEMENT 2 DISCLAIMER This presentation includes forward-looking statements.
Tupperware Brands Reports First Quarter Results
 Tupperware Brands Corp. 14901 S. Orange Blossom Trail Orlando, FL 32837 Investor Contact: Teresa Burchfield (407) 826-4475 Tupperware Brands Reports First Quarter Results First quarter sales up slightly
Excellent 2016 results, net income +22% yoy Well on track for Altran Ignition
 Press release March 9 th, 2017 Publication of the 2016 results Excellent 2016 results, net income +22% yoy Well on track for Altran 2020. Ignition Consolidated revenues: 2.120bn (+9.0% yoy and +5.9% organic
AUTODESK, INC. (ADSK) THIRD QUARTER FISCAL 2019 EARNINGS ANNOUNCEMENT NOVEMBER 20, 2018 PREPARED REMARKS
 THIRD QUARTER FISCAL 2019 EARNINGS ANNOUNCEMENT NOVEMBER 20, 2018 PREPARED REMARKS") AUTODESK, INC. (ADSK) THIRD QUARTER FISCAL 2019 EARNINGS ANNOUNCEMENT NOVEMBER 20, 2018 PREPARED REMARKS Autodesk posts its prepared remarks and press release to its investor relations website to provide
AUTODESK, INC. (ADSK) THIRD QUARTER FISCAL 2019 EARNINGS ANNOUNCEMENT NOVEMBER 20, 2018 PREPARED REMARKS Autodesk posts its prepared remarks and press release to its investor relations website to provide
Financial Information
 Financial Information H1 revenues reached 12.8bn up 9.8%, flat org. in Q2 Adj. EBITA reached 1.6bn, up 6.4%, Adj. EBITA margin flat excl. Invensys in a challenging environment 2015 targets: Around flat
Rogers Corporation Q Earnings Call April 27, 2017
 Rogers Corporation Q1-2017 Earnings Call April 27, 2017 Forward-looking statements Safe Harbor Statement This presentation contains forward-looking statements, which may concern our plans, objectives,
EVRY ASA Q PRESENTATION CEO BJÖRN IVROTH CFO HENRIK SCHIBLER
 1 EVRY ASA Q3 2018 PRESENTATION CEO BJÖRN IVROTH CFO HENRIK SCHIBLER Agenda Group highlights Business update Financial highlights Business area performance Concluding remarks Q&A 2 Group highlights Q3
2014 Full-Year Results
 2014 Full-Year Results February 18, 2015 Amsterdam Nancy McKinstry Chief Executive Officer and Chairman Kevin Entricken Chief Financial Officer Forward-looking Statements This presentation contains forward-looking
Q4 and Full Year 2007 Earnings. February 8, 2008
 Q4 and Full Year 2007 Earnings February 8, 2008 Safe Harbor For Forward Looking Statements Except for historical information, all other information in this presentation consists of forwardlooking statements
PTC THIRD QUARTER FISCAL 2016 PREPARED REMARKS JULY 20, 2016
 PTC THIRD QUARTER FISCAL 2016 PREPARED REMARKS JULY 20, 2016 Please refer to the Important Disclosures section of these prepared remarks for important information about our operating metrics (including
Renesas Electronics Reports Third Quarter 2018 Financial Results
 Renesas Electronics Reports Third Quarter 2018 Financial Results Third Quarter Sales Decreased Year-on-Year, from Weakening End Demand Mainly in Industrial Business. Temporary Decrease in Gross Margin
Sabre reports fourth quarter and full-year 2018 results
 Sabre reports fourth quarter and full-year 2018 results Fourth quarter 2018 highlights: Revenue increased 4.8% Net income attributable to common stockholders increased 2.8% to $84.4 million Diluted net
Fourth Quarter & Year-End 2018 Earnings Conference Call February 27, 2019
 Philip Mezey President and Chief Executive Officer Joan Hooper Senior Vice President and Chief Financial Officer Tom Deitrich Executive Vice President and Chief Operating Officer Kenneth Gianella Vice
Wolters Kluwer 2016 Full-Year Results
 Wolters Kluwer 2016 Full-Year Results Nancy McKinstry CEO Kevin Entricken CFO February 22, 2017 2016 Full-Year Results 1 Forward-looking Statements This presentation contains forward-looking statements.
PTC PREPARED REMARKS THIRD QUARTER FISCAL 2018 JULY 18, 2018
 PTC PREPARED REMARKS THIRD QUARTER FISCAL 2018 JULY 18, 2018 Please refer to the updated Important Disclosures section of these prepared remarks for important information about our operating metrics (including
2016 Full Year Results Building on its 2016 performance, Capgemini strengthens its growth strategy in Digital and Cloud
 2016 Full Year Results Building on its 2016 performance, Capgemini strengthens its growth strategy in Digital and Cloud Paris, February 16, 2017 Disclaimer This presentation may contain forward-looking
Third Fiscal Quarter FY19 Financial Results. November 28, 2018
 Third Fiscal Quarter FY19 Financial Results November 28, 2018 2 Forward-Looking Statements and Non-GAAP Financial Measures This presentation contains forward-looking statements that involve risks and uncertainties,
1 Actuate Corporation Q2 FY2013 Earnings Call
 1 Q2 FY2013 Earnings Call Safe Harbor Statement The statements contained in this presentation that are not purely historical are forward looking statements within the meaning of Section 21E of the Securities
Investor Presentation
 Investor Presentation Fourth Quarter 2017 Safe Harbor and Other Information This presentation contains forward looking statements that are based on our management s beliefs and assumptions and on information
Earnings Presentation. First Quarter 2012 April 24, 2012
 Earnings Presentation First Quarter 2012 April 24, 2012 Forward Looking Statements and GAAP Reconciliations The contents of this presentation that are not statements of historical fact are forward-looking
News Release. Intel Reports Record Quarterly Revenue of $15.8 Billion, Up 9 Percent Year-Over-Year; Operating Profit of $4.
 Intel Corporation 2200 Mission College Blvd. Santa Clara, CA 95054-1549 News Release Intel Reports Record Quarterly Revenue of $15.8 Billion, Up 9 Percent Year-Over-Year; Operating Profit of $4.5 Billion
Luxoft Holding, Inc Q2 FY2018 Call
 Luxoft Holding, Inc Q2 FY2018 Call November 17, 2017 Dmitry Loschinin, CEO & President Evgeny Fetisov, CFO Disclaimer Safe Harbor Forward-Looking Statements 2 Non-GAAP Financial Measures To supplement
CFO Commentary on Second Quarter 2017 Preliminary Financial Results
 Juniper Networks, Inc. 1133 Innovation Way Sunnyvale, CA 94089 July 25, 2017 CFO Commentary on Second Quarter 2017 Preliminary Financial Results Related Information The following commentary is provided
XYLEM INC. Q EARNINGS RELEASE MAY 1, 2018
 XYLEM INC. Q1 2018 EARNINGS RELEASE MAY 1, 2018 Q1 2018 EARNINGS RELEASE FORWARD-LOOKING STATEMENTS This presentation contains information that may constitute forward-looking statements. Forward-looking
Wolters Kluwer 2017 Full-Year Results
 Wolters Kluwer 2017 Full-Year Results Nancy McKinstry CEO Kevin Entricken CFO February 21, 2018 2017 Full-Year Results 1 Forward-looking Statements This presentation contains forward-looking statements.
H a l f - y e a r r e p o r t
 Half-year Report Company Overview INFICON provides world-class instruments for gas analysis, measurement and control. These analysis, measurement and control products are essential for gas leak detection
4 th Quarter 2017 Earnings Conference Call. January 30, 2018
 4 th Quarter 2017 Earnings Conference Call January 30, 2018 Safe Harbor Today s presentation includes forward-looking statements that reflect management s current expectations about the Company s future
H Interim Results 31 August 2017
 H1 2017 Interim Results 31 August 2017 Disclaimer The following presentation is being made only to, and is only directed at, persons to whom such presentation may lawfully be communicated ( relevant persons
2013 Full-Year Results
 2013 Full-Year Results February 19, 2014 Amsterdam Nancy McKinstry Chief Executive Officer and Chairman Kevin Entricken Chief Financial Officer Forward-looking Statements This presentation contains forward-looking
AVEVA Group plc. Results for the year ended 31 March May 2015
 AVEVA Group plc Results for the year ended 31 March 2015 19 May 2015 This presentation may include predictions, estimates, intentions, beliefs and other statements that are or may be construed as being
CFO Commentary on Fourth Quarter and Fiscal Year 2015 Preliminary Financial Results
 Juniper Networks, Inc. 1133 Innovation Way Sunnyvale, CA 94089 January 27, 2016 CFO Commentary on Fourth Quarter and Fiscal Year 2015 Preliminary Financial Results Related Information The following commentary
Wolters Kluwer 2018 Half-Year Results
 Wolters Kluwer 2018 Half-Year Results Nancy McKinstry CEO Kevin Entricken CFO August 1, 2018 2018 Half-Year Results 1 Forward-looking Statements This presentation contains forward-looking statements. These
RESULTS 2 nd QUARTER 2018
 RESULTS 2 nd QUARTER (IFRS, UNAUDITED) July 18, Software AG. All rights reserved. SAFE HARBOR This presentation includes forward-looking statements based on the beliefs of Software AG management. Such