Analysts Meeting FY & Q4 2015
|
|
|
- May Ramsey
- 6 years ago
- Views:
Transcription


1 1 Analysts Meeting FY & Q4 2015
2 Forward Looking Information Such forward-looking statements are based on Dassault Systèmes management's current views and assumptions and involve known and unknown risks and uncertainties. Actual results or performances may differ materially from those in such statements due to a range of factors. The Company s current outlook for 2016 takes into consideration, among other things, an uncertain global economic environment. In light of the continuing uncertainties regarding economic, business, social and geopolitical conditions at the global level, the Company s revenue, net earnings and cash flows may grow more slowly, whether on an annual or quarterly basis. While the Company makes every effort to take into consideration this uncertain macroeconomic outlook, the Company s business results, however, may not develop as anticipated. Furthermore, due to factors affecting sales of the Company s products and services as described above, there may be a substantial time lag between an improvement in global economic and business conditions and an upswing in the Company s business results. In preparing such forward-looking statements, the Company has in particular assumed an average US dollar to euro exchange rate of US$1.10 per 1.00 for the 2016 first quarter and US$1.14 per 1.00 for the full year as well as an average Japanese yen to euro exchange rate of JPY130.0 to 1.00 for the first quarter and full year; however, currency values fluctuate, and the Company s results of operations may be significantly affected by changes in exchange rates. The Company s actual results or performance may also be materially negatively affected by numerous risks and uncertainties, as described in the Risk Factors section of the 2014 Document de Référence, filed with the AMF on March 24, 2015, and also available on the Company s website 2
3 Non-IFRS Information Readers are cautioned that the supplemental non-ifrs financial information presented in this press release is subject to inherent limitations. It is not based on any comprehensive set of accounting rules or principles and should not be considered as a substitute for IFRS measurements. Also, the Company s supplemental non-ifrs financial information may not be comparable to similarly titled non- IFRS measures used by other companies. Further specific limitations for individual non-ifrs measures, and the reasons for presenting non-ifrs financial information, are set forth in the Company s annual report for the year ended December 31, 2014 included in the Company s 2014 Document de Référence filed with the AMF on March 24, In the tables accompanying this press release the Company sets forth its supplemental non-ifrs figures for revenue, operating income, operating margin, net income and diluted earnings per share, which exclude the effect of adjusting the carrying value of acquired companies deferred revenue, share-based compensation expense and related social charges, the amortization of acquired intangible assets, other operating income and expense, net, certain one-time items included in financial revenue and other, net, and the income tax effect of the non-ifrs adjustments and certain one-time tax effects. The tables also set forth the most comparable IFRS financial measure and reconciliations of this information with non-ifrs information. When the Company believes it would be helpful for understanding trends in its business, the Company provides percentage increases or decreases in its revenue (in both IFRS as well as non-ifrs) to eliminate the effect of changes in currency values, particularly the U.S. dollar and the Japanese yen, relative to the euro. When trend information is expressed herein "in constant currencies", the results of the "prior" period have first been recalculated using the average exchange rates of the comparable period in the current year, and then compared with the results of the comparable period in the current year. 3
4 Delivering on All 2015 Objectives Non-IFRS Double-digit organic new licenses revenue growth exfx EPS growth above 20% Organic operating margin expansion by over 100 basis point Large accounts sales transformation Industry vertical diversification 3DEXPERIENCE V6 revenue acceleration And we gained over 22,000 customers in
5 Agenda 1 2 Q4 & FY15 Business Review & Strategy Update Q4 & FY15 Financial Highlights 3 Q1 & FY16 Financial Objectives 4 Financial Information Appendix 5
6 Q4 & FY15 Business Review & Strategy Update 1. Business Review 2. Strategy Update 6
7 Q4 & FY15 Performance Non-IFRS Strong new licenses growth driving top line growth Operating margin leverage Excellent EPS growth millions Q4 15 FY 15 Revenue 802 2,877 Growth +16% +23% Growth exfx +8% +12% New Licenses Revenue Growth exfx +11% +15% Operating Margin 35.8% 30.8% Operating Margin Growth +3.3 pts +1.0 pt EPS ( ) EPS Evolution +22% +24% 7
8 Software Revenue by Brands Non-IFRS Software Revenue Growth exfx by Brands 3DEXPERIENCE deployments in Q4 supporting well CATIA and ENOVIA growth Strong recurring revenue driving SOLIDWORKS performance Strong SIMULIA growth Q4 15 FY 15 CATIA +8% +5% ENOVIA +14% +5% SOLIDWORKS +11% +12% Other Software +6% +26% Total Software +9% +12% 8
9 Revenue by Region Non-IFRS Revenue Growth exfx by Region Good dynamic in the Americas driven by Business Transformation Channel Good performance in Europe in 2015 in spite of strong base of comparison in Germany Good broad-based growth in Asia in 2015 Q4 15 FY 15 Americas +9% +14% Europe +5% +11% Asia +12% +12% Total Revenue +8% +12% 9
10 Strong Large Accounts Sales Growth FY15 large accounts new licenses revenue up ~+19% exfx Increasing average deal size by ~+15% New licenses sales productivity* increasing by ~15% More than 80 successful 3DEXPERIENCE deployments demonstrating the business value for customers with significant productivity gains * New license revenue / salespersons with quota and sales managers headcount 10


11 Industry Vertical Diversification FY15 Software Revenue Diversified industries* representing 30% of 2015 software revenue +2 percentage points YoY Life Sciences, Energy Process & Utilities, Consumer Packaged Goods and Natural Resources driving diversification Core industries software revenue growth up 9% exfx * Architecture, Engineering & Construction; Consumer Goods & Retail; Consumer Packaged Goods & Retail; Energy, Process & Utilities; Finance Business Services; High-Tech; Life Sciences; Marine & Offshore; Natural Resources 11


12 AMGEN Business Values Solution 12


13 Business Values: Solution: 13


14 Business Values: Solution: 14
15 3DEXPERIENCE V6 Revenue Acceleration % V6 / New licenses Revenue* Non-IFRS +5 points in 2015 Acceleration in H % 29% 20% 36% H H * Excluding SOLIDWORKS and acquisitions


16 Business Values: Solution: 16


17 Business Values: Solution: 17

 Global presence: 21 factories and 15 R&D centers and 51 branches in 22 countries")
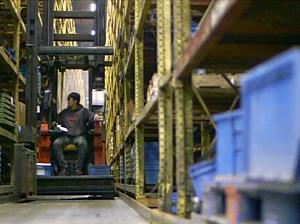
18 Successfully Deploying 3DEXPERIENCE Doosan Infracore Designs anywhere, builds anywhere with 3DEXPERIENCE Products: construction machinery, machine tools, automation systems, diesel and gas engines Employees: 15,200 Revenue: US$7.69 billion (2014) Global presence: 21 factories and 15 R&D centers and 51 branches in 22 countries 18
19 Q4 & FY15 Business Review & Strategy Update 1. Business Review 2. Strategy Update 19


20 20 A New World to Imagine, Create and Make


21 Our Purpose Dassault Systèmes provides business and people with 3DEXPERIENCE universes to imagine sustainable innovations capable of harmonizing product, nature and life. Dassault Systèmes Clients 21


22 Providing with the 3DEXPERIENCE Platform Breakthrough for Open Innovation Connecting disciplines inside and outside companies Connecting innovation and business Vehicle to deliver applications, content, services 22

23 23

24 Managing and Giving Meaning to Big Data Developing Virtual Singapore, the digital twin experience of the city-state based on 3DEXPERIENCE Platform Cities modeling and simulation requiring to manage and give meaning to a large amount of data 24


25 Connecting People, Innovators, Objects, Makers Acting on All the Data that Matters People Innovators Objects Makers 25

26 Increasing Customer Choice with 3DEXPERIENCE Upfront Rental On premise Cloud Enterprise Collaborative Hub Apps in Store Software as a Service 26


27 The First Aircraft Designed on the Cloud Having an integrated environment on the cloud, is very reassuring because we don't have to manage the data backup. We can focus on the airplane design without worrying about anything else. The 3DEXPERIENCE platform on the cloud saved us huge amounts of money both reducing operating costs and enabling capital savings. Technology is not a stumbling block for small companies like ours any more. We can get started quickly without making a major investment. 27


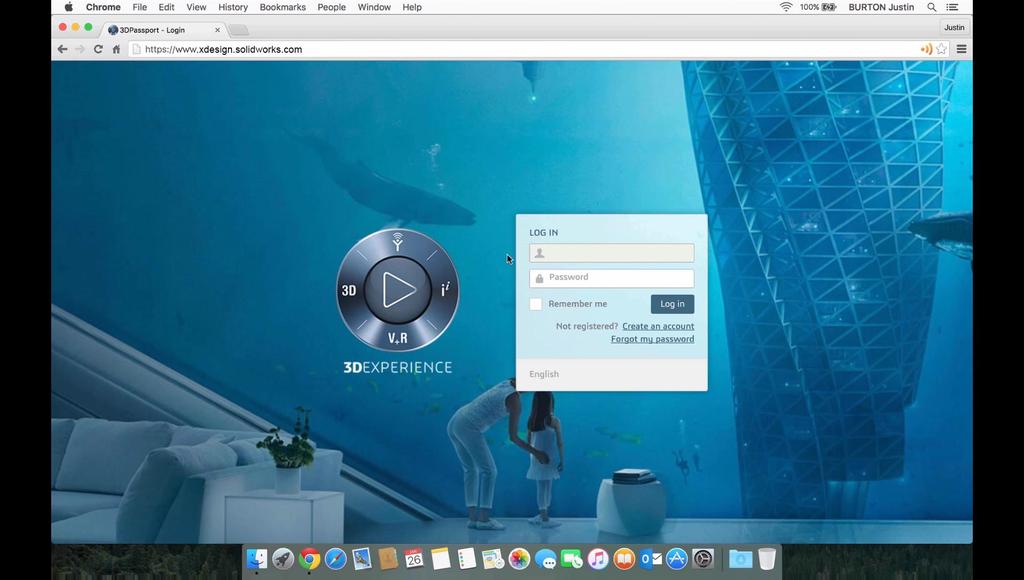
28 SOLIDWORKS Xdesign is a new, browser based, full SaaS, product design offering based on 3DEXPERIENCE Platform Built on the best in class technologies, SOLIDWORKS Xdesign: Delivers capability to design and collaborate Anywhere, Anytime on Any device Expands and introduces new design paradigms - Design Guidance, Single Modeling Environment, etc. Provides a single SOLIDWORKS ecosystem where all SOLIDWORKS products work seamlessly together Provides customers with flexibility to choose - online offering in addition to existing SOLIDWORKS desktop and connected product Is fully integrated in the 3DEXPERIENCE Platform ecosystem 28
29 29
30 30

31 31
32 32


33 Multi-scale Our Technology Vision Multi-physics Discipline 33
34 34
35 35


36 36 Moving to Real-time Manufacturing as a Service


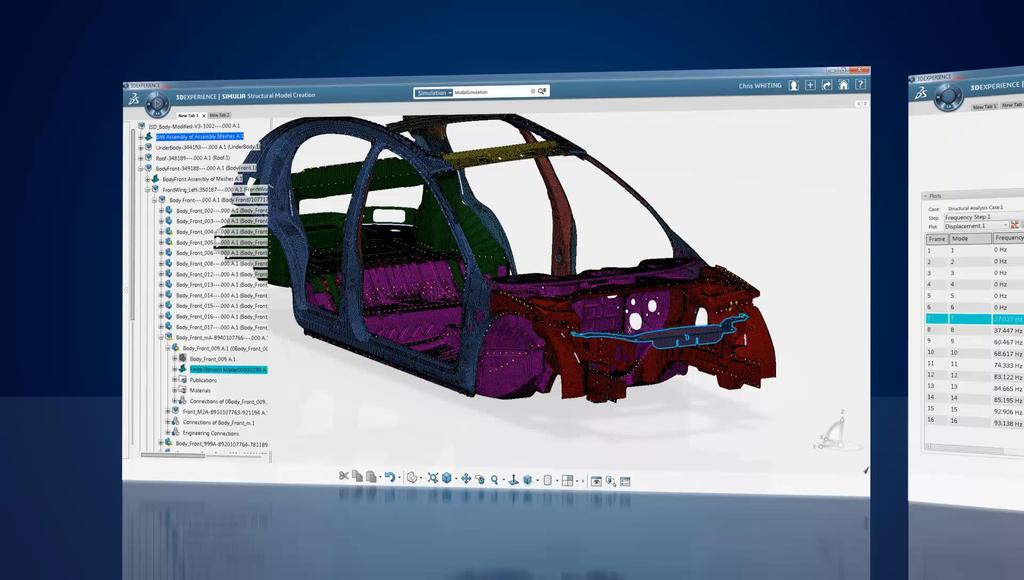
37 Digital Continuity from Product to Manufacturing Engineering Body in White Virtual Build


38 Digital Continuity from Production Engineering to Operations


39 Digital Continuity throughout Global Manufacturing Operations Global Manufacturing Visibility PRODUCTION QUALITY WAREHOUSE MAINTENANCE LABOR

40 Supply Chain & Logistics


41 41

42 42
43 Agenda 1 2 Q4 & FY15 Business Review & Strategy Update Q4 & FY15 Financial Highlights 3 Q1 & FY16 Financial Objectives 4 Financial Information Appendix 43
44 Software Revenue Growth Non-IFRS Software Revenue % +12% ex FX in MEUR +16.4% +9% ex FX YTD 14 YTD 15 4Q14 4Q15 Q4 software revenue up +9% exfx (+9% organic) YTD software revenue up +12% exfx (+8% organic) 44

45 Software Revenue Growth Non-IFRS New Licenses Revenue +26.5% +15% ex FX in MEUR +19.9% +11% ex FX YTD 14 YTD 15 4Q14 4Q15 Q4 new licenses revenue up +11% exfx (+11% organic) YTD new licenses revenue up +15% exfx (+11% organic) 45
46 Software Revenue Growth Non-IFRS Periodic License & Maintenance and Other Software Revenue % +10% ex FX % +7% ex FX Q4 recurring and other software revenue up +7% exfx (+7% organic) YTD recurring and other software revenue up +10% exfx (+7% organic) in MEUR YTD 14 YTD 15 4Q14 4Q15 46
47 Service Revenue & Margin Evolution Non-IFRS Service Revenue % +17% ex FX in MEUR +9.5% +3% ex FX YTD 14 YTD 15 4Q14 4Q15 Service Gross Margin 15.8% 13.2% 14.2% 17.5% 47

48 48 Operating Margin Evolution Non-IFRS

49 EPS Non-IFRS Diluted EPS % 2.25 in EUR % YTD 14 YTD 15 4Q14 4Q15 Strong EPS growth 49
50 YTD Change in Net Financial Position , Operating cash flow: million compared to million, up +27% Net Financial Position Q Net Income Non cash P&L items Change in working capital Capital expenditure Acquisitions and other investing net DS stock option exercise Cash dividend paid Other financing activity FX Impact Net Financial Position Q
51 Q4 Operating Cash Flow Evolution IFRS million Q4 15 Q4 14 Changes Operating Cash Flow Net income adjusted for non cash items Increase in trade accounts receivable Trade accounts up 11% exfx compared to Q Increase in unearned revenue Unearned revenue up 13% exfx compared to Q Increase in accrued compensation Increase in accounts payable Increase (Decrease) in income taxes payable Other Derived mainly from higher down payments on 2014 income tax expense 51
52 Agenda 1 2 Q4 & FY15 Business Review & Strategy Update Q4 & FY15 Financial Highlights 3 Q1 & FY16 Financial Objectives 4 Financial Information Appendix 52
53 2016 Financial Objectives Non-IFRS Macro environment slightly weaker in 2016 and more volatile Significant 3DEXPERIENCE potential driven by customers deployments R&D and Sales investments thus requested to support customers adoption in 12 targeted industries Revenue to increase in a range of ~+6-7% exfx Double-digit organic new licenses revenue growth exfx for a third year in a row Stable operating margin (~+50 bps exfx)* EPS to increase by ~+7% (~+10% exfx)* * Assuming in 2016 guidance, several currencies headwinds: US Dollar, Korean Won, Chinese Yuan, British Pound, Australian Dollar, Brazilian Real, Indian Rupee 53
54 Proposed objectives Non-IFRS Q FY 2016 Revenue (M ) ,985-3,015 Growth +3-5% +4-5% Growth ex FX +3-5% +6-7% Operating Margin 24-25% ~31.0% Operating Margin Growth -2 to -1 pt Stable EPS ( ) ~2.40 EPS Growth -2% to +5% ~ +7% /$ rates / rates Q Strong base of comparison with new licenses revenue overperformance of ~ 11 million in Q1 15 In 2016, in a more volatile environment, clients to spend majority of their budget in H2 FY 2016 In 2016, double-digit organic new licenses revenue growth exfx for a third year in a row 54
55 Agenda 1 2 Q4 & FY15 Business Review & Strategy Update Q4 & FY15 Financial Highlights 3 Q1 & FY16 Financial Objectives 4 Financial Information Appendix 55
56 Revenue by Region IFRS in MEUR 4Q15 4Q14 Growth Growth ex FX YTD 15 YTD 14 Growth Americas % +12% % +14% Europe % +7% % +13% Asia % +15% % +14% Total Revenue % +11% % +13% Growth ex FX 4Q15 4Q14 YTD 15 YTD 14 Americas 25% 32% 23% 29% 25% 25% 31% 29% Europe Asia 43% 48% 44% 46% 56
57 Revenue by Region Non-IFRS in MEUR 4Q15 4Q14 Growth Growth ex FX YTD15 YTD14 Growth Americas % +9% % +14% Europe % +5% % +11% Asia % +12% % +12% Total Revenue % +8% % +12% Growth ex FX 4Q15 4Q14 YTD 15 YTD 14 Americas 25% 32% 23% 30% 25% 32% 25% 29% Europe Asia 43% 47% 43% 46% 57

58 Revenue by Product Line IFRS in MEUR 4Q15 4Q14 Growth Growth ex FX YTD15 YTD14 Growth Growth ex FX CATIA SW % +7% % +5% ENOVIA SW % +14% % +5% SOLIDWORKS SW % +11% % +12% Other SW % +15% % +31% Services % +8% % +20% Total Revenue % +11% % +13% 4Q15 4Q14 YTD 15 YTD 14 12% 12% 12% 11% CATIA SW ENOVIA SW 24% 33% 23% 34% 24% 33% 21% 37% Other SW SOLIDWORKS SW 19% 12% 19% 12% 20% 11% 20% 11% Services 58
59 Revenue by Product Line Non-IFRS in MEUR 4Q15 4Q14 Growth Growth ex FX YTD15 YTD14 Growth CATIA SW % +8% % +5% ENOVIA SW % +14% % +5% SOLIDWORKS SW % +11% % +12% Other SW % +6% % +26% Services % +3% % +17% Total Revenue % +8% % +12% Growth ex FX 4Q15 4Q14 YTD 15 YTD 14 12% 12% 12% 11% CATIA SW ENOVIA SW Other SW 25% 32% 25% 34% 25% 33% 23% 35% SOLIDWORKS SW Services 19% 12% 18% 11% 20% 10% 20% 11% 59


60 SOLIDWORKS Price & Units Evolution Number of Units ASP (EUR) 70,000 +5% 8, % +4% exfx +15.2% +7% exfx 60,000 55,009 57,728 7,000 5,871 6,824 6,059 6,981 50,000 40,000 6,000 5,000 Note: assuming in 2014 and 2015 a 48% average VAR margin 30,000-1% 4,000 3,000 20,000 15,312 15,157 2,000 10,000 1,000 0 YTD14 YTD15 4Q14 4Q15 - YTD14 YTD15 4Q14 4Q15 As reported exfx 60

61 Software Revenue Evolution Non-IFRS % % % 70% % 34% % 66% - YTD 14 YTD 15 4Q14 4Q15 Recurring Non-recurring 61
62 IFRS P&L Three months ended December 31, Twelve months months ended December 31, (In millions of, except per share data) YoY YoY Software revenue % 2, , % New licenses % % Other software revenue % % Periodic licenses and Maintenance % 1, , % Service and other revenue % % Total revenue % 2, , % Cost of Software revenue (37.8) (36.5) +3.7% (143.2) (117.3) +22.1% Cost of Service and other revenue (77.5) (73.2) +5.9% (294.7) (225.9) +30.5% Research and development (126.0) (111.6) +12.9% (492.5) (409.7) +20.2% Marketing and sales (235.1) (203.8) +15.3% (892.2) (748.5) +19.2% General and administrative (59.2) (50.4) +17.4% (211.7) (189.4) +11.8% Amortization of acquired intangibles (39.2) (41.2) -4.9% (159.6) (133.4) +19.6% Other operating income and expense, net (5.6) (7.9) -29.1% (12.4) (39.3) -68.4% Total operating expenses (580.4) (524.6) +10.6% (2,206.3) (1,863.5) +18.4% Operating income % % Financial revenue and other, net (2.8) (0.1) Income tax expense (85.9) (50.2) +71.1% (227.1) (153.3) +48.1% Non-controlling interest (0.9) (1.0) -10.0% (3.8) (1.2) - Net Income (to equity holders of the parent) % % Diluted net income per share (EPS) % % Average diluted shares (Million)
63 IFRS P&L (%) Three months ended December 31, Twelve months months ended December 31, % of revenue % of revenue Software revenue 88.3% 88.0% 88.1% 88.7% New licenses 29.7% 29.6% 25.2% 25.3% Other software revenue 0.5% 0.7% 0.7% 0.5% Periodic licenses and Maintenance 58.0% 57.7% 62.2% 63.0% Service and other revenue 11.7% 12.0% 11.9% 11.3% Total revenue 100.0% 100.0% 100.0% 100.0% Cost of Software revenue 4.7% 5.4% 5.0% 5.1% Cost of Service and other revenue 9.7% 10.9% 10.4% 9.8% Research and development 15.8% 16.6% 17.3% 17.9% Marketing and sales 29.5% 30.3% 31.4% 32.6% General and administrative 7.4% 7.5% 7.5% 8.3% Amortization of acquired intangibles 4.9% 6.1% 5.6% 5.8% Other operating income and expense, net 0.7% 1.2% 0.4% 1.7% Total operating expenses 72.9% 77.9% 77.7% 81.2% Operating income 27.1% 22.1% 22.3% 18.8% Financial revenue and other, net -0.4% 0.3% 0.0% 0.7% Income tax rate (% of IBIT) 40.3% 33.3% 35.9% 34.4% Non-controlling interest -0.1% -0.1% -0.1% -0.1% Net Income (to equity holders of the parent) 15.9% 14.8% 14.2% 12.7% 63
64 Non-IFRS P&L Three months ended December 31, Twelve months months ended December 31, (In millions of, except per share data) YoY YoY Software revenue % 2, , % New licenses % % Other software revenue % % Periodic licenses and Maintenance % 1, , % Service and other revenue % % Total revenue % 2, , % Cost of Software revenue (37.5) (36.3) +3.3% (142.6) (116.4) +22.5% Cost of Service and other revenue (77.1) (73.2) +5.3% (294.0) (225.7) +30.3% Research and development (117.3) (109.1) +7.5% (474.8) (392.8) +20.9% Marketing and sales (227.8) (200.8) +13.4% (876.8) (734.6) +19.4% General and administrative (55.3) (49.3) +12.2% (203.6) (178.0) +14.4% Total operating expenses (515.0) (468.7) +9.9% (1,991.8) (1,647.5) +20.9% Operating income % % Financial revenue and other, net (2.8) (0.1) Income tax expense (102.3) (77.3) +32.3% (304.4) (245.2) +24.1% Non-controlling interest (0.9) (1.1) -18.2% (3.8) (1.7) - Net Income (to equity holders of the parent) % % Diluted net income per share (EPS) % % Average diluted shares (Million)
65 Non-IFRS P&L (%) Three months ended December 31, Twelve months months ended December 31, Software revenue 88.4% 87.7% 88.2% 88.6% New licenses 29.9% 28.8% 25.6% 24.8% Other software revenue 0.5% 0.6% 0.7% 0.5% Periodic licenses and Maintenance 57.9% 58.2% 61.9% 63.3% Service and other revenue 11.6% 12.3% 11.8% 11.4% Total revenue 100.0% 100.0% 100.0% 100.0% Cost of Software revenue 4.7% 5.2% 5.0% 5.0% Cost of Service and other revenue 9.6% 10.5% 10.2% 9.6% Research and development 14.6% 15.7% 16.5% 16.7% Marketing and sales 28.4% 28.9% 30.5% 31.3% General and administrative 6.9% 7.1% 7.1% 7.6% Total operating expenses 64.2% 67.5% 69.2% 70.2% Operating income 35.8% 32.5% 30.8% 29.8% Financial revenue and other, net -0.3% 0.3% 0.0% 0.6% Income tax expense 36.0% 34.0% 34.4% 34.4% Non-controlling interest -0.1% -0.2% -0.1% -0.1% Net Income (to equity holders of the parent) 22.6% 21.5% 20.0% 19.8% 65
66 IFRS Non-IFRS Reconciliation QTD Revenue and Gross Margin ( million, except % and per share data) 2015 IFRS Adjustment (1) Three months ended December 31, 2015 Non-IFRS 2014 IFRS Adjustment (1) 2014 Non-IFRS Increase (Decrease) IFRS Non-IFRS Total Revenue % 15.6% Total Revenue breakdown by activity Software revenue % 16.4% New Licenses revenue % 19.9% Other software revenue % Periodic and Maintenance revenue % 14.9% Recurring portion of Software revenue 66% 66% 66% 66% Service and other revenue % 9.5% Total Revenue breakdown by product line CATIA SW revenue % 13.9% ENOVIA SW revenue % SOLIDWORKS SW revenue % Other SW revenue % 14.3% Service and other revenue % 9.5% Total Revenue breakdown by geography Americas revenue % 24.6% Europe revenue % 7.1% Asia revenue % 21.0% Gross Margin Cost of Software revenue ( 37.8) 0.3 ( 37.5) ( 36.5) 0.2 ( 36.3) 3.7% 3.3% Software Gross margin* 94.6% 94.7% 93.8% 94.0% Cost of Service and other revenue ( 77.5) 0.4 ( 77.1) ( 73.2) 0.0 ( 73.2) 5.9% 5.3% Service Gross margin 16.8% 17.5% 9.6% 14.2% * No amortization of acquired intangibles is included in Software Gross margin calculation 66
67 IFRS Non-IFRS Reconciliation QTD Expenses & Earnings ( million, except % and per share data) 2015 IFRS Adjustment (1) Three months ended December 31, 2015 Non-IFRS 2014 IFRS Adjustment (1) 2014 Non-IFRS Total Operating Expenses ( 580.4) 65.4 ( 515.0) ( 524.6) 55.9 ( 468.7) 10.6% 9.9% Share-based compensation expense ( 20.6) ( 6.8) Amortization of acquired intangibles ( 39.2) ( 41.2) Increase (Decrease) IFRS Non-IFRS Other operating income and expense, net ( 5.6) ( 7.9) Operating Income % 27.4% Operating Margin 27.1% 35.8% 22.1% 32.5% Financial revenue & other, net ( 2.8) ( 2.8) 2.0 ( 0.1) Income tax expense ( 85.9) ( 16.4) ( 102.3) ( 50.2) ( 27.1) ( 77.3) 71.1% 32.3% Non-controlling interest ( 0.9) ( 0.9) ( 1.0) ( 0.1) ( 1.1) -10.0% -18.2% Net Income attributable to shareholders % 21.6% Diluted net income per share, in EUR % 22.4% ( million) Three months ended December 31, 2015 IFRS Adjust IFRS Adjust. Non-IFRS Non-IFRS Cost of revenue ( 115.3) 0.7 ( 114.6) ( 109.7) 0.2 ( 109.5) Research and development ( 126.0) 8.7 ( 117.3) ( 111.6) 2.5 ( 109.1) Marketing and sales ( 235.1) 7.3 ( 227.8) ( 203.8) 3.0 ( 200.8) General and administrative ( 59.2) 3.9 ( 55.3) ( 50.4) 1.1 ( 49.3) Total Share-based compensation expense
68 IFRS Non-IFRS Reconciliation YTD Revenue and Gross Margin ( million, except % and per share data) 2015 IFRS * No amortization of acquired intangibles is included in Software Gross margin calculation Twelve months months ended December 31, Adjustment (1) 2015 Non-IFRS 2014 IFRS Adjustment (1) 2014 Non-IFRS Increase (Decrease) IFRS Non-IFRS Total Revenue % 22.6% Total Revenue breakdown by activity Software revenue % 22.1% New Licenses revenue % 26.5% Other software revenue % Periodic and Maintenance revenue % 19.9% Recurring portion of Software revenue 71% 70% 71% 71% Service and other revenue % 26.4% Total Revenue breakdown by product line CATIA SW revenue % 12.0% ENOVIA SW revenue % SOLIDWORKS SW revenue % Other SW revenue % 37.4% Service and other revenue % 26.4% Total Revenue breakdown by geography Americas revenue % 34.3% Europe revenue % 15.1% Asia revenue % 22.8% Gross Margin Cost of Software revenue ( 143.2) 0.6 ( 142.6) ( 117.3) 0.9 ( 116.4) 22.1% 22.5% Software Gross margin* 94.3% 94.4% 94.2% 94.4% Cost of Service and other revenue ( 294.7) 0.7 ( 294.0) ( 225.9) 0.2 ( 225.7) 30.5% 30.3% Service Gross margin 12.5% 13.2% 12.9% 15.8% 68
69 IFRS Non-IFRS Reconciliation YTD Expenses & Earnings ( million, except % and per share data) 2015 IFRS Twelve months months ended December 31, Adjustment (1) 2015 Non-IFRS 2014 IFRS Adjustment (1) 2014 Non-IFRS IFRS Non-IFRS Total Operating Expenses ( ) ( ) ( ) ( ) 18.4% 20.9% Share-based compensation expense ( 42.5) ( 43.3) Amortization of acquired intangibles ( 159.6) ( 133.4) Increase (Decrease) Other operating income and expense, net ( 12.4) ( 39.3) Operating Income % 26.6% Operating Margin 22.3% 30.8% 18.8% 29.8% Financial revenue & other, net ( 0.1) ( 0.1) 15.0 ( 1.8) Income tax expense ( 227.1) ( 77.3) ( 304.4) ( 153.3) ( 91.9) ( 245.2) 48.1% 24.1% Non-controlling interest ( 3.8) ( 3.8) ( 1.2) ( 0.5) ( 1.7) - - Net Income attributable to shareholders % 23.9% Diluted net income per share, in EUR % 23.6% ( million) Twelve months months ended December 31, 2015 IFRS Adjust IFRS Adjust. Non-IFRS Non-IFRS Cost of revenue ( 437.9) 1.3 ( 436.6) ( 343.2) 1.1 ( 342.1) Research and development ( 492.5) 17.7 ( 474.8) ( 409.7) 16.9 ( 392.8) Marketing and sales ( 892.2) 15.4 ( 876.8) ( 748.5) 13.9 ( 734.6) General and administrative ( 211.7) 8.1 ( 203.6) ( 189.4) 11.4 ( 178.0) Total Share-based compensation expense
70 Financial Revenue and Other Non-IFRS MEUR 4Q15 4Q14 var YTD 15 YTD 14 var Interest Income (2.5) (4.3) Interest Expense (2.8) (1.7) (1.1) (7.4) (6.1) (1.3) Financial net Income (3.6) (5.6) Exchange Gain / (Loss) (3.9) (2.2) (1.7) (12.0) (3.8) (8.2) Other Income / (Loss) Total (2.8) 1.9 (4.7) (0.1) 13.2 (13.3) 70
71 Exchange Rate evolution From assumptions to actual data Breakdown of P&L by currency for YTD15 Average Exchange rates USD JPY % change Revenue (As a % of Revenue) 37.1% 11.7% YTD USD % JPY % Operating Expenses (As a % of Expenses) 36.5% 4.3% QTD USD % JPY % $/EUR 4Q15 / 4Q14 Variance /EUR 4Q15 / 4Q14 Variance 4Q14: 1.25 in average Average $/EUR rate Q15: 1.10 in average 4Q14: in average Average /EUR rate Q15: in average 71
72 Comparing 4Q15 with mid-range Objectives Non-IFRS Revenue Operating Operating Operating Expenses Profit Margin 4Q15 Guidances mid-range (495.0) % Growth YoY +8.1% +5.6% +13.1% +1.5pt $ Impact on Rev./Exp (8.8) pt JPY Impact on Rev./Exp. 1.3 (0.3) pt Other incl. GBP, WON, and other currencies and Hedging 12.1 (4.5) pt Total FX 28.4 (13.6) pt Activity / Cost Control / Other 23.7 (6.4) pt Delta: Reported vs guidances 52.1 (20.0) pt 4Q15 Reported (515.0) % Growth YoY +15.6% +9.9% +27.4% +3.3pt 4Q14 Reported (468.7) % 72
73 Estimated FX impact on 4Q15 Op. Results Non-IFRS millions QTD Total Revenue Operating Expenses Operating Income Operating Margin 4Q15 Reported (515.0) % 4Q14 Reported (468.7) % Growth as reported +15.6% +9.9% +27.4% +3.3 pt Impact of Actual Currency Rates USD impact 37.3 (24.2) 13.1 JPY impact 5.4 (1.5) 3.9 Other currencies impact and Hedging 5.6 (1.5) 4.1 Total FX Impact adjustment 48.3 (27.2) Q14 ex FX (495.9) % Growth exfx +8% +4% +16% +2.6 pt 73
74 Estimated FX impact on YTD15 Op. Results Non-IFRS millions FY Total Revenue Operating Expenses Operating Income Operating Margin FY2015 Reported 2,876.7 (1,991.8) % FY2014 Reported 2,346.7 (1,647.5) % Growth as reported +22.6% +20.9% +26.6% +1.0 pt Impact of Actual Currency Rates USD impact (109.2) 56.8 JPY impact 13.1 (3.5) 9.6 Other currencies impact and Hedging 35.3 (11.4) 23.9 Total FX Impact adjustment (124.1) 90.3 FY2014 ex FX 2,561.1 (1,771.6) % Growth exfx +12% +12% +12% +0.0 pt 74
75 Balance Sheet IFRS End of End of Variation End of Variation (in millions of ) Dec-15 Sep-15 Dec-15 / Sep-15 Dec-14* Dec-15 / Dec-14* Cash and cash equivalents 2, , , ,176.3 Short-term investments Accounts receivable, net Other current assets Total current assets 3, , , ,260.7 Property and equipment, net Goodwill and Intangible assets, net 2, , , Other non current assets Total Assets 6, , , ,349.0 Accounts payable Unearned revenue Other current liabilities Total current liabilities 1, , , Long-term debt 1, Other non current obligations Total long-term liabilities 1, Non-controlling interest Parent Shareholders' equity 3, , , Total Liabilities and Shareholders' Equity 6, , , ,349.0 * The consolidated balance sheet as of December 31, 2014 has been restated to reflect the finalized purchase price allocation for prior year business combinations 75
76 Consolidated Statement of Cash Flows (in millions of ) 4Q15 4Q14 Variation YTD15 YTD14 Variation Net income attributable to equity holders of the parent Non-controlling interest (0.1) Net income Depreciation of property & equipment Amortization of intangible assets Other non cash P&L items (7.9) 11.4 (19.3) Changes in working capital (92.4) (106.7) Net Cash Provided by (Used in) Operating Activities (I) Additions to property, equipment and intangibles (12.8) (18.2) 5.4 (43.6) (45.4) 1.8 Payment for acquisition of businesses, net of cash acquired (2.1) (17.9) 15.8 (20.2) (952.9) Sale (Purchase) of short-term investments, net (11.9) (2.4) (9.5) 5.8 (0.4) 6.2 Investments, loans and others 0.8 (1.2) 2.0 (2.5) (2.2) (0.3) Net Cash Provided by (Used in) Investing Activities (II) (26.0) (39.7) 13.7 (60.5) (1,000.9) Proceeds of short term and long term debt Repayment of short term and long term debt 0.0 (10.4) 10 (10.8) (20.6) 9.8 (Purchase) Sale of treasury stock (0.3) (20.4) 20.1 (28.3) (171.7) Proceeds from exercise of stock-options (22.0) Cash dividend paid 0.0 (0.0) 0.0 (98.4) (35.9) (62.5) Net Cash Provided by (Used in) Financing Activities (III) (21.2) (170.3) Effect of exchange rate changes on cash and cash equivalents (IV) Increase (Decrease) in Cash (V) = (I)+(II)+(III)+(IV) ,176.3 (633.7) 1,810.0 Cash and cash equivalents at Beginning of Period 1, , , ,737.9 Cash and cash equivalents at End of Period 2, , , ,104.2 Cash and cash equivalents variation ,176.3 (633.7) 76

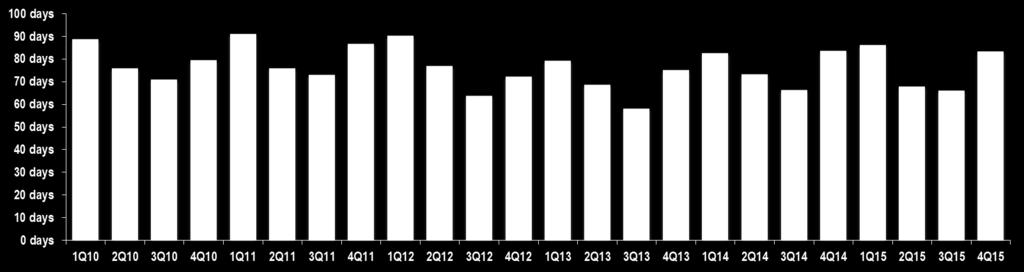
77 77 Trade Accounts Receivable / DSO IFRS

78 Headcount by destination Closing H/C December 2015 At Closing - TOTAL 4Q15 4Q14 % growth 3Q15 % growth M&S + COR Ser 6,906 6,596 +5% 6,864 +1% R&D + COR SW 5,853 5,562 +5% 5,756 +2% G&A 1,212 1,187 +2% 1,194 +2% Total 13,971 13,345 +5% 13,813 +1% 78
79 IFRS 2016 Objectives Accounting elements not included in the non-ifrs 2016 Objectives FY 2016 estimated deferred revenue write-down of ~ 2m FY 2016 estimated share-based compensation expenses: ~ 62m FY 2016 estimated amortization of acquired intangibles: ~ 147m The above objectives do not include any impact from other operating income and expense, net principally comprised of acquisition, integration and restructuring expenses. These estimates do not include any new stock option or share grants, or any new acquisitions or restructurings completed after February 4,

80 80
Analysts Meeting Q Bernard Charlès, President and CEO Thibault de Tersant, Senior EVP, CFO
 Analysts Meeting Q3 2015 Bernard Charlès, President and CEO Thibault de Tersant, Senior EVP, CFO 1 Forward Looking Information Statements herein that are not historical facts but express expectations or
Analysts Meeting Q Bernard Charlès, President and CEO Thibault de Tersant, Senior EVP, CFO
 Analysts Meeting Q3 2014 Bernard Charlès, President and CEO Thibault de Tersant, Senior EVP, CFO 1 Forward Looking Information Statements herein that are not historical facts but express expectations or
Analysts Meeting Q2 & H1 2016
 Analysts Meeting Q2 & H1 2016 Forward Looking Information Statements herein that are not historical facts but express expectations or objectives for the future, including but not limited to statements
Analysts Meeting Q2 2014
 Analysts Meeting Q2 2014 Bernard Charlès, President and CEO Thibault de Tersant, Senior EVP, CFO 1 Forward Looking Information Statements herein that are not historical facts but express expectations or
Q Earnings Presentation. Bernard Charlès, Vice-Chairman of the Board of Directors & CEO Pascal Daloz, CFO & Corporate Strategy Officer
 Q1 2018 Earnings Presentation Bernard Charlès, Vice-Chairman of the Board of Directors & CEO Pascal Daloz, CFO & Corporate Strategy Officer Forward Looking Information Statements herein that are not historical
Analysts Meeting FY12 & Q412
 3DS.COM Dassault Systèmes Q4 & FY2012 Earnings Presentation Analysts Meeting FY12 & Q412 Building Up 3DEXPERIENCE Bernard Charlès, President and CEO Thibault de Tersant, Senior EVP and CFO 1 Forward Looking
Analysts Meeting Q Bernard Charlès, President and CEO Thibault de Tersant, Senior EVP, CFO
 Analysts Meeting Q2 2015 Bernard Charlès, President and CEO Thibault de Tersant, Senior EVP, CFO 1 Forward Looking Information Statements herein that are not historical facts but express expectations or
Dassault Systèmes Reports Q3 and YTD EPS Up Double-Digits and Reaffirms 2018 Growth Objectives
 Dassault Systèmes Reports Q3 and YTD EPS Up Double-Digits and Reaffirms 2018 Growth Objectives VÉLIZY-VILLACOUBLAY, France October 24, 2018 Dassault Systèmes (Euronext Paris: #13065, DSY.PA), announces
Analysts Meeting Q1 2013
 Analysts Meeting Q1 2013 Bernard Charlès, President and CEO Thibault de Tersant, Senior EVP and CFO 1 Forward Looking Information Statements herein that are not historical facts but express expectations
Analysts Meeting Q4 & FY Bernard Charlès, Vice-Chairman of the Board of Directors & CEO Thibault de Tersant, Senior EVP, CFO
 Analysts Meeting Q4 & FY 2016 Bernard Charlès, Vice-Chairman of the Board of Directors & CEO Thibault de Tersant, Senior EVP, CFO Forward Looking Information Statements herein that are not historical facts
Analysts Meeting Q1 2012
 Analysts Meeting Q1 2012 A Strategic Move Towards Natural Resources Bernard Charles, President and CEO Thibault de Tersant, Senior EVP and CFO 1 Forward Looking Information Statements herein that are not
Dassault Systèmes Reports Solid Third Quarter Led by Large Accounts Industry Solutions Engagements
 Dassault Systèmes Reports Solid Third Quarter Led by Large Accounts Industry Solutions Engagements VÉLIZY-VILLACOUBLAY, France October 23, 2014 Dassault Systèmes (Euronext Paris: #13065, DSY.PA), the 3DEXPERIENCE
Dassault Systèmes Q4 & FY 2018 Earnings Presentation. Bernard Charlès, Vice-Chairman & CEO Pascal Daloz, EVP, CFO & Corporate Strategy Officer
 Dassault Systèmes Q4 & FY 2018 Earnings Presentation Bernard Charlès, Vice-Chairman & CEO Pascal Daloz, EVP, CFO & Corporate Strategy Officer Forward Looking Information Statements herein that are not
Analysts Meeting Q1 2014
 Analysts Meeting Q1 2014 Bernard Charlès, President and CEO Thibault de Tersant, Senior EVP, CFO 1 Important Information This presentation is neither an offer to purchase nor a solicitation of an offer
Dassault Systèmes Analysts Meeting Q2 2011
 Dassault Systèmes Analysts Meeting Q2 2011 Bernard Charlès, President and CEO Thibault de Tersant, Senior EVP and CFO 1 Forward Looking Information Statements herein that are not historical facts but express
Dassault Systèmes Q2 & H Earnings Presentation. Bernard Charlès, Vice-Chairman & CEO Pascal Daloz, EVP, CFO & Corporate Strategy Officer
 Dassault Systèmes Q2 & H1 2018 Earnings Presentation Bernard Charlès, Vice-Chairman & CEO Pascal Daloz, EVP, CFO & Corporate Strategy Officer H1 2018 Highlights Non-IFRS (under IAS 18) Good H1 2018 in
Dassault Systèmes Reports Double-digit Software Revenue and EPS Growth for 2012
 Dassault Systèmes Reports Double-digit Software Revenue and EPS Growth for 2012 Paris, France February 7, 2013 Dassault Systèmes (Euronext Paris: #13065, DSY.PA), the 3DEXPERIENCE Company, world leader
Dassault Systèmes Q3 & YTD 2018 Earnings Presentation. Bernard Charlès, Vice-Chairman & CEO Pascal Daloz, EVP, CFO & Corporate Strategy Officer
 Dassault Systèmes Q3 & YTD 2018 Earnings Presentation Bernard Charlès, Vice-Chairman & CEO Pascal Daloz, EVP, CFO & Corporate Strategy Officer Forward Looking Information Statements herein that are not
Dassault Systèmes Reports Strong Third Quarter EPS Growth
 Dassault Systèmes Reports Strong Third Quarter EPS Growth VÉLIZY-VILLACOUBLAY, France October 22, 2015 Dassault Systèmes (Euronext Paris: #13065, DSY.PA), the 3DEXPERIENCE Company, world leader in 3D design
Dassault Systèmes Raises EPS Guidance for 2018
 Dassault Systèmes Raises EPS Guidance for 2018 VÉLIZY-VILLACOUBLAY, France July 25, 2018 Dassault Systèmes (Euronext Paris: #13065, DSY.PA), announces IFRS unaudited financial results for the second quarter
Dassault Systèmes Reports Solid Second Quarter Performance and Reconfirms Full Year Outlook
 Dassault Systèmes Reports Solid Second Quarter Performance and Reconfirms Full Year Outlook VÉLIZY-VILLACOUBLAY, France July 24, 2014 Dassault Systèmes (Euronext Paris: #13065, DSY.PA), the 3DEXPERIENCE
Dassault Systèmes Reports Strong 3DEXPERIENCE-driven Growth with Fourth Quarter Total Revenue up 13% and Software Revenue up 11% at constant currency
 Dassault Systèmes Reports Strong 3DEXPERIENCE-driven Growth with Fourth Quarter Total Revenue up 13% and Software Revenue up 11% at constant currency VÉLIZY-VILLACOUBLAY, France February 6, 2019 Dassault
Dassault Systèmes Reports Revenue Growth of 4% in Q3 and 6% YTD in Constant Currencies
 Dassault Systèmes Reports Revenue Growth of 4% in Q3 and 6% YTD in Constant Currencies Paris, France - October 24, 2013 Dassault Systèmes (Euronext Paris: #13065, DSY.PA), the 3DEXPERIENCE Company, world
DS Reports 2008 Second Quarter Software Revenue Growth Above 15% in Constant Currencies
 DS Reports 2008 Second Quarter Software Revenue Growth Above 15% in Constant Currencies Paris, France, July 31, 2008 Dassault Systèmes (DS) (Nasdaq: DASTY; Euronext Paris: #13065, DSY.PA) reported U.S.
DASSAULT SYSTEMES HALF-YEAR FINANCIAL REPORT
 DASSAULT SYSTEMES HALF-YEAR FINANCIAL REPORT June 30, 2009 Public limited liability company Common stock, nominal value 1 per share: 117,866,151 euros Registered Office: 10, rue Marcel Dassault 78140 Vélizy-Villacoublay
DASSAULT SYSTEMES HALF-YEAR FINANCIAL REPORT
 DASSAULT SYSTEMES HALF-YEAR FINANCIAL REPORT June 30, 2012 Public limited liability company Common stock, nominal value 1 per share: 125,059,208 euros Registered Office: 10, rue Marcel Dassault 78140 Vélizy-Villacoublay
Financial results & business update. Quarter and year ended 31 December February 2016
 Financial results & business update Quarter and year ended 31 December 2015 11 February 2016 Disclaimer 3 Any remarks that we may make about future expectations, plans and prospects for the company constitute
Financial results & business update. Quarter and year ended 31 December February 2017
 Financial results & business update Quarter and year ended 31 December 2016 14 February 2017 Disclaimer 3 Any remarks that we may make about future expectations, plans and prospects for the company constitute
Financial results & business update
 Financial results & business update Quarter ended 31 March 2019 16 April 2019 Disclaimer Any remarks that we may make about future expectations, plans and prospects for the company constitute forward-looking
Financial results & business update. Quarter ended 30 September October 2016
 Financial results & business update Quarter ended 30 September 2016 19 October 2016 Disclaimer 3 Any remarks that we may make about future expectations, plans and prospects for the company constitute forward-looking
Financial results & business update. Quarter ended 30 September October 2017
 Financial results & business update Quarter ended 30 September 2017 18 October 2017 Disclaimer 3 Any remarks that we may make about future expectations, plans and prospects for the company constitute forward-looking
2008 First Quarter Newswire Conference Call Tuesday, April 29, Final
 2008 First Quarter Newswire Conference Call Tuesday, April 29, 2008 Final Thibault de Tersant Senior Executive Vice President and CFO Introduction Good morning. I am pleased to speak with you to give an
DASSAULT SYSTEMES HALF-YEAR FINANCIAL REPORT
 DASSAULT SYSTEMES HALF-YEAR FINANCIAL REPORT June 30, 2013 Public limited liability company Common stock, nominal value 1 per share: 126,130,441 euros Registered Office: 10, rue Marcel Dassault 78140 Vélizy-Villacoublay
Capgemini records an excellent performance in 2017 with growth acceleration fueled by Digital and Cloud
 Press relations: Florence Lièvre Tel.: +33 1 47 54 50 71 florence.lievre@capgemini.com Investor relations: Vincent Biraud Tel.: +33 1 47 54 50 87 vincent.biraud@capgemini.com Capgemini records an excellent
Financial results & business update. Quarter ended 30 June July 2017
 Financial results & business update Quarter ended 30 June 2017 19 July 2017 Disclaimer 3 Any remarks that we may make about future expectations, plans and prospects for the company constitute forward-looking
2017 Full Year Results
 2017 Full Year Results Title of the presentation 2 lines Location, Date, Author Paris February 15 th, 2018 Disclaimer This presentation may contain forward-looking statements, Such statements may include
AUTODESK, INC. (ADSK) SECOND QUARTER FISCAL 2019 EARNINGS ANNOUNCEMENT AUGUST 23, 2018 PREPARED REMARKS
 SECOND QUARTER FISCAL 2019 EARNINGS ANNOUNCEMENT AUGUST 23, 2018 PREPARED REMARKS") AUTODESK, INC. (ADSK) SECOND QUARTER FISCAL 2019 EARNINGS ANNOUNCEMENT AUGUST 23, 2018 PREPARED REMARKS Autodesk posts its prepared remarks and press release to its IR website to provide shareholders and
AUTODESK, INC. (ADSK) SECOND QUARTER FISCAL 2019 EARNINGS ANNOUNCEMENT AUGUST 23, 2018 PREPARED REMARKS Autodesk posts its prepared remarks and press release to its IR website to provide shareholders and
ANSYS, INC. FIRST QUARTER 2011 EARNINGS ANNOUNCEMENT PREPARED REMARKS May 5, 2011
 ANSYS, INC. FIRST QUARTER 2011 EARNINGS ANNOUNCEMENT PREPARED REMARKS May 5, 2011 ANSYS is providing a copy of its prepared remarks in combination with its earnings announcement. This process and these
Temenos announces very strong Q3 results, full year guidance raised
 Temenos announces very strong Q3 results, full year guidance raised GENEVA, Switzerland, 17 October 2018 Temenos AG (SIX: TEMN), the banking software company, today reports its third quarter 2018 results.
AUTODESK, INC. (ADSK) THIRD QUARTER FISCAL 2019 EARNINGS ANNOUNCEMENT NOVEMBER 20, 2018 PREPARED REMARKS
 THIRD QUARTER FISCAL 2019 EARNINGS ANNOUNCEMENT NOVEMBER 20, 2018 PREPARED REMARKS") AUTODESK, INC. (ADSK) THIRD QUARTER FISCAL 2019 EARNINGS ANNOUNCEMENT NOVEMBER 20, 2018 PREPARED REMARKS Autodesk posts its prepared remarks and press release to its investor relations website to provide
AUTODESK, INC. (ADSK) THIRD QUARTER FISCAL 2019 EARNINGS ANNOUNCEMENT NOVEMBER 20, 2018 PREPARED REMARKS Autodesk posts its prepared remarks and press release to its investor relations website to provide
Trimble Second Quarter 2018 Results Summary
 Trimble Second Quarter 2018 Results Summary Forward-looking statements Certain statements made in this presentation and any subsequent Q&A period are forward-looking statements, within the meaning of Section
H Interim Results 31 August 2017
 H1 2017 Interim Results 31 August 2017 Disclaimer The following presentation is being made only to, and is only directed at, persons to whom such presentation may lawfully be communicated ( relevant persons
ZEBRA TECHNOLOGIES FIRST QUARTER 2016 RESULTS May 10, 2016
 ZEBRA TECHNOLOGIES FIRST QUARTER 2016 RESULTS May 10, 2016 Anders Gustafsson Chief Executive Officer Mike Smiley Chief Financial Officer 2 Safe Harbor Statement Statements made in this presentation which
Temenos announces very strong start to 2018 with Q1 total software licensing growth of 40%
 Temenos announces very strong start to 2018 with Q1 total software licensing growth of 40% GENEVA, Switzerland, 18 April 2018 Temenos Group AG (SIX: TEMN), the banking software company, today reports its
Bank of America Merrill Lynch The Future of Financials Conference. November 6, Citi Investor Relations
 Citi Investor Relations Bank of America Merrill Lynch The Future of Financials Conference November 6, 2018 Francisco Aristeguieta CEO, Citigroup Asia Pacific Agenda Franchise Overview Asia Institutional
Financial results & business update. Quarter ended 31 March April 2018
 Financial results & business update Quarter ended 31 March 2018 18 April 2018 Disclaimer 3 Any remarks that we may make about future expectations, plans and prospects for the company constitute forward-looking
Second Quarter 2018 Earnings
 Second Quarter 2018 Earnings John Visentin, CEO Bill Osbourn, CFO July 26, 2018 http://www.xerox.com/investor Forward-Looking Statements This presentation, and other written or oral statements made from
XYLEM INC. Q EARNINGS RELEASE FEBRUARY 1, 2018
 XYLEM INC. Q4 2017 EARNINGS RELEASE FEBRUARY 1, 2018 Q4 2017 EARNINGS RELEASE FORWARD-LOOKING STATEMENTS This presentation contains information that may constitute forward-looking statements. Forward-looking
EFI Q Earnings Call. July 20, 2015
 EFI Q2 2015 Earnings Call July 20, 2015 Safe Harbor For Forward-Looking Statements Certain statements in this press release are forward-looking statements within the meaning of Section 27A of the Securities
REXEL. Q3 & 9-month 2009 results. November 12, 2009
 REXEL Q3 & 9-month 2009 results November 12, 2009 Q3 2009 & 9-month results Q3 and 9-month 2009 at a glance Financial review Outlook 3 Q3 & 9-month 2009 at a glance Q3 & 9-month 2009 highlights: Quarter-on-quarter
Q results. April 27, 2018
 Q1 2018 results April 27, 2018 Consolidated financial statements as of March 31, 2018 were authorized for issue by the Board of Directors held on April 26, 2018. Q118 KEY HIGHLIGHTS Q1 2018 in line with
Wolters Kluwer 2018 Full-Year Results
 Wolters Kluwer 2018 Full-Year Results Nancy McKinstry CEO Kevin Entricken CFO February 20, 2019 2018 Full-Year Results 1 Forward-looking Statements This presentation contains forward-looking statements.
2014 Full-Year Results
 2014 Full-Year Results February 18, 2015 Amsterdam Nancy McKinstry Chief Executive Officer and Chairman Kevin Entricken Chief Financial Officer Forward-looking Statements This presentation contains forward-looking
Science Applications International Corporation (SAIC) Third Quarter Fiscal Year 2018 Earnings Call. December 7, 2017
 Third Quarter Fiscal Year 2018 Earnings Call. December 7, 2017") Science Applications International Corporation (SAIC) Third Quarter Fiscal Year 2018 Earnings Call December 7, 2017 Supplemental Financial Information Conference Call Information Date: December 7, 2017
Science Applications International Corporation (SAIC) Third Quarter Fiscal Year 2018 Earnings Call December 7, 2017 Supplemental Financial Information Conference Call Information Date: December 7, 2017
IBM 2Q 2018 Earnings. July 18, ibm.com/investor
 IBM 2Q 2018 Earnings July 18, 2018 ibm.com/investor Forward Looking Statements and Non-GAAP Information 2 Certain comments made in this presentation may be characterized as forward looking under the Private
ANSYS, INC. SECOND QUARTER 2018 EARNINGS ANNOUNCEMENT PREPARED REMARKS August 6, 2018
 ANSYS, INC. SECOND QUARTER 2018 EARNINGS ANNOUNCEMENT PREPARED REMARKS August 6, 2018 ANSYS is providing a copy of its prepared remarks in connection with its earnings announcement. These remarks are offered
RESULTS 2 nd QUARTER 2018
 RESULTS 2 nd QUARTER (IFRS, UNAUDITED) July 18, Software AG. All rights reserved. SAFE HARBOR This presentation includes forward-looking statements based on the beliefs of Software AG management. Such
2014 Half Year Results. Paris, July 31 st, 2014
 2014 Half Year Results Paris, July 31 st, 2014 Disclaimer This presentation does not contain or constitute an offer of securities for sale or an invitation or inducement to invest in securities in France,
CFO Commentary on Fourth Quarter and Fiscal Year 2015 Preliminary Financial Results
 Juniper Networks, Inc. 1133 Innovation Way Sunnyvale, CA 94089 January 27, 2016 CFO Commentary on Fourth Quarter and Fiscal Year 2015 Preliminary Financial Results Related Information The following commentary
Temenos reports very strong Q3 results, full year guidance raised and share buyback announced
 Temenos reports very strong Q3 results, full year guidance raised and share buyback announced GENEVA, Switzerland, 18 October 2017 Temenos Group AG (SIX: TEMN), the software specialist for banking and
Horizon Global Third Quarter 2017 Earnings Presentation
 Horizon Global Third Quarter 2017 Earnings Presentation October 31, 2017 Q1 2016 Earnings 1 Safe Harbor Statement Forward-Looking Statements This presentation may contain "forward-looking statements" as
Results for Quarter III FY
 Results for Quarter III FY 2012-13 Copyright 2012 Tata Consultancy Services Limited 1 Disclaimer Certain statements in this release concerning our future prospects are forward-looking statements. Forward-looking
2017 SECOND QUARTER RESULTS. Ended June 30, 2017
 2017 SECOND QUARTER RESULTS Ended June 30, 2017 Forward Looking Statements Disclaimer This presentation contains statements, including statements about future plans and expectations, which constitute forwardlooking
IBM 3Q 2017 Earnings. October 17, ibm.com/investor
 IBM 3Q 2017 Earnings October 17, 2017 ibm.com/investor Forward Looking Statements and Non-GAAP Information 2 Certain comments made in this presentation may be characterized as forward looking under the
Bruker Corporation (NASDAQ: BRKR)
") Bruker Corporation (NASDAQ: BRKR) Q4 2017 Earnings Presentation February 8, 2018 Frank Laukien, President & CEO Anthony Mattacchione, SVP & CFO Miroslava Minkova, Head of Investor Relations Innovation
Bruker Corporation (NASDAQ: BRKR) Q4 2017 Earnings Presentation February 8, 2018 Frank Laukien, President & CEO Anthony Mattacchione, SVP & CFO Miroslava Minkova, Head of Investor Relations Innovation
2017 THIRD QUARTER RESULTS. Ended September 30, 2017
 2017 THIRD QUARTER RESULTS Ended September 30, 2017 Forward Looking Statements Disclaimer This presentation contains statements, including statements about future plans and expectations, which constitute
2015 Half-Year Results
 2015 Half-Year Results July 29, 2015 Nancy McKinstry Chief Executive Officer and Chairman Kevin Entricken Chief Financial Officer Forward-looking Statements This presentation contains forward-looking statements.
2017 FIRST QUARTER RESULTS. Ended March 31, 2017
 2017 FIRST QUARTER RESULTS Ended March 31, 2017 Forward Looking Statements Disclaimer This presentation contains statements, including statements about future plans and expectations, which constitute forwardlooking
IBM 4Q 2017 Earnings. January 18, ibm.com/investor
 IBM 4Q 2017 Earnings January 18, 2018 ibm.com/investor Forward Looking Statements and Non-GAAP Information 2 Certain comments made in this presentation may be characterized as forward looking under the
XYLEM INC. Q EARNINGS RELEASE MAY 1, 2018
 XYLEM INC. Q1 2018 EARNINGS RELEASE MAY 1, 2018 Q1 2018 EARNINGS RELEASE FORWARD-LOOKING STATEMENTS This presentation contains information that may constitute forward-looking statements. Forward-looking
CRITEO REPORTS STRONG RESULTS FOR THE THIRD QUARTER 2016
 CRITEO REPORTS STRONG RESULTS FOR THE THIRD QUARTER 2016 NEW YORK - November 2, 2016 - Criteo S.A. (NASDAQ: CRTO), the performance marketing technology company, today announced financial results for the
RESULTS 1 st QUARTER 2018 (IFRS, UNAUDITED)
") RESULTS 1 st QUARTER (IFRS, UNAUDITED) April 19, SAFE HARBOR This presentation includes forward-looking statements based on the beliefs of Software AG management. Such statements reflect current views
RESULTS 1 st QUARTER (IFRS, UNAUDITED) April 19, SAFE HARBOR This presentation includes forward-looking statements based on the beliefs of Software AG management. Such statements reflect current views
Quarter ended 30 September Financial results & business update
 Quarter ended 30 September 2014 Financial results & business update 21 October 2014 Disclaimer Any remarks that we may make about future expectations, plans and prospects for the company constitute forward-looking
Driving Profitable Growth
 Driving Profitable Growth Frank Calderoni EVP and Chief Financial Officer December 7, 2012 Forward-Looking Statements This presentation contains projections and other forward-looking statements regarding
Wolters Kluwer 2016 Full-Year Results
 Wolters Kluwer 2016 Full-Year Results Nancy McKinstry CEO Kevin Entricken CFO February 22, 2017 2016 Full-Year Results 1 Forward-looking Statements This presentation contains forward-looking statements.
2017 Annual Results Presentation. 8 March 2018
 2017 Annual Results Presentation 8 March 2018 Disclaimer The following presentation is being made only to, and is only directed at, persons to whom such presentation may lawfully be communicated ( relevant
CFO Commentary on Second Quarter 2017 Preliminary Financial Results
 Juniper Networks, Inc. 1133 Innovation Way Sunnyvale, CA 94089 July 25, 2017 CFO Commentary on Second Quarter 2017 Preliminary Financial Results Related Information The following commentary is provided
ROADSHOW POST-Q2 & H RESULTS. September 2016
 ROADSHOW POST-Q2 & H1 2016 RESULTS September 2016 1. COMPANY OVERVIEW Rexel at a glance : Strategic partner for suppliers and customers Energy Providers Suppliers Customers Endusers Economies of scale
Wolters Kluwer 2018 Half-Year Results
 Wolters Kluwer 2018 Half-Year Results Nancy McKinstry CEO Kevin Entricken CFO August 1, 2018 2018 Half-Year Results 1 Forward-looking Statements This presentation contains forward-looking statements. These
Fourth Quarter and Full Year Earnings Call March 1, 2019
 Fourth Quarter and Full Year Earnings Call March 1, 2019 Safe Harbor & Non-GAAP Financial Measures Cautionary Notice Statements in this news release and the schedules hereto that are not purely historical
Horizon Global First Quarter 2016 Earnings Presentation
 Horizon Global First Quarter 2016 Earnings Presentation May 3, 2016 1 Safe Harbor Statement Forward-Looking Statements This presentation may contain "forward-looking statements" as defined in the Private
Temenos delivers good results across all metrics and reaffirms full year guidance
 Temenos delivers good results across all metrics and reaffirms full year guidance GENEVA, Switzerland, 22 October 2013 Temenos Group AG (SIX: TEMN), the market leading provider of mission-critical software
Intuit Investor Presentation. March 2013
 Intuit Investor Presentation March 2013 Forward Looking Statements These presentation materials include forward-looking statements. There are a number of factors that could cause our results to differ
PTC SECOND QUARTER FISCAL 2017 PREPARED REMARKS APRIL 19, 2017
 PTC SECOND QUARTER FISCAL 2017 PREPARED REMARKS APRIL 19, 2017 Please refer to the Important Disclosures section of these prepared remarks for important information about our operating metrics (including
2017 Half year results 26 July 2017
 2017 Half year results 26 July 2017 www.thalesgroup.com H1 2017 business environment Aerospace Avionics: continued positive dynamics for cockpit avionics and in-flight entertainment and connectivity Space:
Full-year results 2018
 Full-year results 2018 Investor Call 1 Disclaimer This presentation contains forward looking statements which reflect Management s current views and estimates. The forward looking statements involve certain
Allegion Second-Quarter 2016 Results. July 28, 2016
 Allegion Second-Quarter 2016 Results July 28, 2016 Safe Harbor This presentation contains "forward-looking statements" within the meaning of the Private Securities Litigation Reform Act of 1995, including
Progress Reports 2018 Third Quarter Results, Announces 11% Dividend Increase
 Progress Reports Third Quarter Results, Announces 11% Dividend Increase September 27, Solid Revenue and EPS Performance, Generates Strong Cash Flows BEDFORD, Mass.--(BUSINESS WIRE)--Sep. 27, -- Progress
FOR IMMEDIATE RELEASE Contact: Sridhar Ramasubbu Wipro Limited Results for the quarter ended December 31, 2009 under IFRS
 FOR IMMEDIATE RELEASE Contact: Sridhar Ramasubbu Wipro Limited 408-242-6285 Results for the quarter ended December 31, 2009 under IFRS Wipro Records 19% YoY Growth in Profit After Tax IT Services Business
Temenos Q results reflect outstanding quarter
 Temenos Q3 2015 results reflect outstanding quarter GENEVA, Switzerland, 20 October 2015 Temenos Group AG (SIX: TEMN), the market leading provider of mission-critical software to financial institutions
Q4 and Full Year 2007 Earnings. February 8, 2008
 Q4 and Full Year 2007 Earnings February 8, 2008 Safe Harbor For Forward Looking Statements Except for historical information, all other information in this presentation consists of forwardlooking statements
XYLEM INC. Q EARNINGS RELEASE OCTOBER 30, 2018
 XYLEM INC. Q3 2018 EARNINGS RELEASE OCTOBER 30, 2018 Q3 2018 EARNINGS RELEASE FORWARD-LOOKING STATEMENTS This presentation contains information that may constitute forward-looking statements. within the
TCS Financial Results
 TCS Financial Results Quarter IV & Year Ended FY 2014-15 April 16, 2015 1 Copyright 2014 Tata Consultancy Services Limited Disclaimer Certain statements in this release concerning our future prospects
Q1 FY17 FINANCIAL RESULTS CONFERENCE CALL November 7, 2016 at 5:00 pm ET
 Q1 FY17 FINANCIAL RESULTS CONFERENCE CALL November 7, 2016 at 5:00 pm ET SAFE HARBOR AND NON-GAAP Safe Harbor Statement This presentation contains certain comments that are forward-looking statements,
CRITEO REPORTS RECORD RESULTS FOR THE FOURTH QUARTER AND FISCAL YEAR 2017
 CRITEO REPORTS RECORD RESULTS FOR THE FOURTH QUARTER AND FISCAL YEAR 2017 NEW YORK - February 14, 2018 - Criteo S.A. (NASDAQ: CRTO), the leading commerce marketing technology company, today announced financial
Q EARNINGS 8/1/2018 CONFERENCE CALL. Copyright 2017 ARRIS Enterprises, LLC. All rights reserved
 Q2 2018 EARNINGS 8/1/2018 CONFERENCE CALL Copyright 2017 ARRIS Enterprises, LLC. All rights reserved Safe Harbor FORWARD-LOOKING STATEMENTS Statements made in this presentation, including those related
Wolters Kluwer 2017 Full-Year Results
 Wolters Kluwer 2017 Full-Year Results Nancy McKinstry CEO Kevin Entricken CFO February 21, 2018 2017 Full-Year Results 1 Forward-looking Statements This presentation contains forward-looking statements.
MANAGEMENT S DISCUSSION AND ANALYSIS
 MANAGEMENT S DISCUSSION AND ANALYSIS Q1 2017 February 1, 2017 Basis of Presentation This Management s Discussion and Analysis of the Financial Position and Results of Operations ( MD&A ) is the responsibility
4Q and Full Year 2016 Earnings Presentation. February 8, 2017
 4Q and Full Year 2016 Earnings Presentation February 8, 2017 Cautionary Language Regarding Forward-Looking Statements & Non-GAAP Measures This presentation contains forward-looking statements within the
February 21, Conduent Q4 & FY 2017 Earnings Results
 February 21, 2018 Conduent Q4 & FY 2017 Earnings Results Cautionary Statements Forward-Looking Statements This report contains forward-looking statements that involve risks and uncertainties. These statements