AIRBUS 9m Results 2018
|
|
|
- Susan Murphy
- 5 years ago
- Views:
Transcription

1 AIRBUS 9m Results October 2018 Harald Wilhelm Chief Financial Officer
2 SAFE HARBOUR STATEMENT 2 DISCLAIMER This presentation includes forward-looking statements. Words such as anticipates, believes, estimates, expects, intends, plans, projects, may and similar expressions are used to identify these forward-looking statements. Examples of forward-looking statements include statements made about strategy, ramp-up and delivery schedules, introduction of new products and services and market expectations, as well as statements regarding future performance and outlook. By their nature, forward-looking statements involve risk and uncertainty because they relate to future events and circumstances and there are many factors that could cause actual results and developments to differ materially from those expressed or implied by these forward-looking statements. These factors include but are not limited to: Changes in general economic, political or market conditions, including the cyclical nature of some of Airbus businesses; Significant disruptions in air travel (including as a result of terrorist attacks); Currency exchange rate fluctuations, in particular between the Euro and the U.S. dollar; The successful execution of internal performance plans, including cost reduction and productivity efforts; Product performance risks, as well as programme development and management risks; Customer, supplier and subcontractor performance or contract negotiations, including financing issues; Competition and consolidation in the aerospace and defence industry; Significant collective bargaining labour disputes; The outcome of political and legal processes including the availability of government financing for certain programmes and the size of defence and space procurement budgets; Research and development costs in connection with new products; Legal, financial and governmental risks related to international transactions; Legal and investigatory proceedings and other economic, political and technological risks and uncertainties. As a result, Airbus actual results may differ materially from the plans, goals and expectations set forth in such forward-looking statements. For a discussion of factors that could cause future results to differ from such forward-looking statements, see the Airbus Registration Document dated 28 March 2018, including the Risk Factors section. Any forward-looking statement contained in this presentation speaks as of the date of this presentation. Airbus undertakes no obligation to publicly revise or update any forward-looking statements in light of new information, future events or otherwise. Rounding disclaimer: Due to rounding, numbers presented may not add up precisely to the totals provided and percentages may not precisely reflect the absolute figures. IFRS 15 Disclaimer: The Company has adopted the IFRS 15 standard as of 1st January figures are pro forma, amended with IFRS15 restatements and new segment reporting.


3 9m Results 2018 Company Highlights Divisional Highlights Guidance Highlights
4 9M 2018 HIGHLIGHTS 4 Focus on deliveries and securing ramp-up 9m financials reflect A350 performance and aircraft delivery profile 2018 Guidance updated to reflect latest delivery outlook Progress in management succession
5 9M 2018 COMMERCIAL POSITIONING 5 Consolidated Airbus Order Book by Division Consolidated Airbus External Revenue by Division Airbus (in units) Helicopters (in m) 9m 2018 Order Intake (net) 256 Order book 7,383 Order Intake (net) 3,523 Order book 12,594 9% 17% 40.4 bn t/o defence 6 bn 74% Defence and Space (in m) Order Intake (net) 4,988 Order book 35,880 Airbus Helicopters Defence and Space AIRBUS: 311 gross orders; 256 net orders; Backlog: 7,383 a/c HELICOPTERS: 230 net orders for 3.5 bn, including 6 H225 and 36 H145 in Q3 DEFENCE AND SPACE: Order Intake 5.0 bn supported by Heron TP drones for Germany
6 9M 2018 FINANCIAL PERFORMANCE 6 Revenues in bn EBIT Adjusted in bn / RoS (%) 6.8% % m m m m 2018 EPS (1) Adjusted in FCF before M&A and Customer Financing in bn m m 2018 (3.3) (4.2) 9m m 2018 (1) 9m 2018 Average number of shares: 774,762,268 compared to 773,574,878 in 9m 2017 Capitalised R&D: 61 m in 9m 2018 and 203 m in 9m figures are amended with IFRS15 restatements
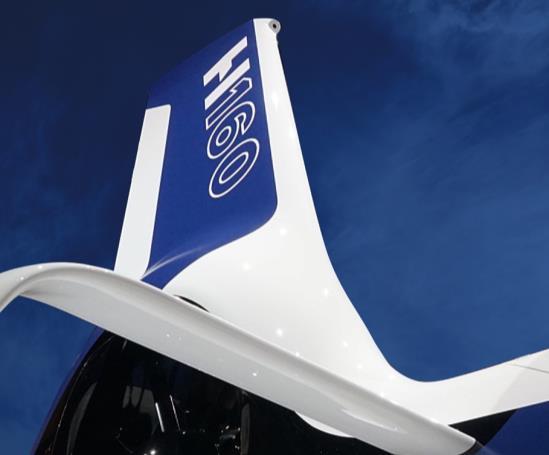
7 9M 2018 PROFITABILITY EBIT Performance in bn EBIT Adjusted m m 2018 EBIT Reported 9m 2018 EBIT Reported of 2.7 bn 9m 2018 Adjustments resulting from: - 105m A400M provision - 23m First H160s - 109m Compliance / Others + 26m PDP mismatch / BS revaluation + 156m Airbus DS Capital Gain - 55m Net Adjustments EPS Performance in m 2018 Net Income of 1,453 m 9m 2018 Net Income Adjusted of 1,792 m 9m 2018 tax rate on core business is 28% EPS Adjusted EPS Reported 9m m 2018 Average number of shares: 9m 2018 = 774,762,268 ; 9m 2017 = 773,574, figures are amended with IFRS15 restatements
8 CURRENCY HEDGE POLICY 8 IN $ BILLION Forward Sales as of September 2018 Collars as of September 2018 Forward Sales and Collars as of Dec Average hedge rates 2018 remaining 3 months 1.20 vs $ Forwards/Collars (2) ( 1.25 in Dec. 17 ) ( 1.24 in Dec. 17 ) ( 1.22 in Dec. 17 ) ( 1.23 in Dec. 17 ) 2022 and beyond 1.27 ( 1.24 in Dec. 17) vs $ In 9m 2018, $ 13.2 bn (1) of new Forwards were added at an average rate of 1 = $ 1.26 $ 17.7 bn (1) of hedges matured at an average rate of 1 = $ 1.26 Hedge portfolio (1) 30 September 2018 at $ 84.1 bn (vs. $ 88.7 bn in Dec. 2017), at an average rate of $ 1.23 (2) In 9m, $ 3.6 bn of hedges rolled-over intra-year in 2018 to align with backloaded delivery profile Approximately 60% of Airbus US$ revenues are naturally hedged by US$ procurement. Graph shows US$ Forward Sales and Collars (1) Total hedge amount contains $/ and $/ designated hedges; (2) Blended Forwards and Collars rate includes Collars at least favourable rate Mark-to-market value incl. in AOCI = bn Closing 1.16 vs. $

9 9M 2018 CASH EVOLUTION 9 IN BILLION Free Cash Flow incl. A220 before M&A : bn t/o Customer Financing: bn Free Cash Flow before M&A and Customer Financing bn 7.2 Net Cash position Dec. Dec Gross Cash Flow from Operations Change in Working Capital Cash used for investing activities before M&A(1) (3) M&A (2) Shareholder Pensions & Returns Others(4) Net Cash position Sep.2018 Pension funding of 1.0 bn in Q3 Early debt repayments of 1.6 bn, no impact to net cash Net cash impact of A220 integration covered by C-SALP funding agreement (1) Thereof Capex of bn; (2) M&A transactions include acquisitions and disposals of subsidiaries and businesses (3) Thereof Customer Financing of bn; (4) Including C-Series A/C Ltd. Partnership (C-SALP) funding arrangement


10 9m Results 2018 Company Highlights Divisional Highlights Guidance Highlights
11 11 IN MILLION 9m m 2017 Change Order Intake (net) % Units Order book 7,383 6, % Deliveries by Programme (units) 2% 2% 12% 6% Deliveries (Units) (1) 10.8% Revenues 30,478 27, % R&D Expenses 1,456 1,303 in % of Revenues 4.8% 4.7% EBIT Adjusted 2, in % of Revenues 7.7% 2.9% EBIT 2, in % of Revenues 7.3% 2.8% 11.7% 190.3% 187.3% A220 A320 A350 External Revenue Split 7% 78% A330 A380 Airbus combines former Commercial Division and HQ function, excluding Transversal activities 9m 2018 figures include A220 93% Platforms Services Revenues and EBIT Adjusted reflect the backloaded delivery profile A320neo: 222 a/c delivered in 9m. Ramp up on-going, challenges remain A330neo: EASA certification, first delivery targeted Q4 EBIT Adjusted reflects A350 progress and higher deliveries (1) 452 a/c with Revenue Recognition (2 A330 on Operating Lease) Capitalised R&D: 36 m in 9m 2018 and 97 m in 9m figures are pro forma, amended with IFRS15 restatements and new segment reporting
12 HELICOPTERS 12 IN MILLION 9m m 2017 Change External Revenue Split Order Intake (net) % Units Order book % Order Intake (net) 3,523 4, % Value Order Book 12,594 11, % 47% Defence 53% Civil Deliveries (Units) % Revenues 3,755 4, % R&D Expenses in % of Revenues 5.7% 4.9% EBIT Adjusted in % of Revenues 5.4% 3.8% EBIT in % of Revenues 4.8% 3.8% 4.4% 25.5% 11.2% 56% Platforms 44% Services Revenues stable on a comparable basis Perimeter change impact on Revenues ~ 450 m from sale of Vector Aerospace EBIT Adjusted reflects solid underlying programme execution Capitalised R&D: 16 m in 9m 2018 and 89 m in 9m figures are pro forma, amended with IFRS15 restatements and new segment reporting (except for Order Intake and Order Book)
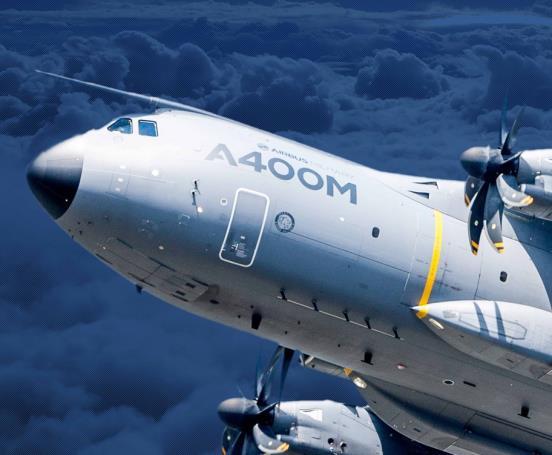
13 DEFENCE AND SPACE 13 IN MILLION 9m m 2017 (1) Change External Revenue Split Order Intake (net) 4,988 5, % Order Book 35,880 38, % 67% 33% Revenues 7,051 7, % R&D Expenses in % of Revenues 3.1% 3.1% EBIT Adjusted in % of Revenues 5.8% 5.6% EBIT in % of Revenues 6.8% 12.6% -0.5% 3.0% -46.1% Platforms 23% Services 28% 49% Revenues and EBIT Adjusted reflect stable core business & solid programme execution Perimeter change impact on Revenues ~ 190 m Net Capital Gains from disposals: 9M m, 9M m A400M: 12 a/c delivered in 9M 2018, 105 m provision update mainly for escalation Space Systems CIS (2) & Others Military Aircraft (1) 2017 IFRS 15 restatements updated for Q3/Q4 phasing. No impact on FY 2017 restatements (2) Communications, Intelligence, & Security Capitalised R&D: 9 m in 9m 2018 and 17 m in 9m figures are pro forma, amended with IFRS15 restatements and new segment reporting (except for Order Intake and Order Book)


14 9m Results 2018 Company Highlights Divisional Highlights Guidance Highlights
15 2018 GUIDANCE 15 As the basis for its 2018 guidance, Airbus expects the world economy and air traffic to grow in line with prevailing independent forecasts, which assume no major disruptions Airbus 2018 Earnings and guidance are prepared under IFRS 15 Airbus 2018 Earnings and FCF guidance is before M&A. It now includes the A220 integration Airbus targets to deliver around 800 commercial aircraft in 2018, now including around 18 A220 aircraft and the updated commercial aircraft delivery schedule On that basis: Before M&A, Airbus maintains expected EBIT Adjusted of approximately 5 bn in 2018 This includes a lower expected reduction in EBIT Adjusted from A220 than estimated in H1 Airbus expects Free Cash Flow before M&A and Customer Financing to be lower than the 2017 level of 2.95 bn. This also reflects an expected reduction of approximately -0.3bn from A220 In 2018, Airbus expects the net cash impact of the A220 integration to be largely covered by the funding arrangement as laid out in the terms of the C-Series A/C Ltd. Partnership, meaning limited cash dilution

16 WRAP UP 16 Focus on 2018 deliveries Preparing the future: Ramp up Innovation Management transition EPS / FCF growth


17 9m Results 2018 Appendix
18 EXPECTED AIRBUS AVERAGE HEDGE RATES VS. $ 18 Active exposure management Average Hedge Rates 1.32 FY FY 2018E Q1 Q2 Q3 Q4 (1) 2018 E FY 2017 (1) Q3 actual
19 9M 2018 DETAILED INCOME STATEMENT AND ADJUSTMENTS 19 IN MILLION thereof Adjustments Impact on EBIT 9m 2018 Operational FX Financial Result 9m 2018 Adjusted Airbus Defence and Space (1) Helicopters Airbus & ADS (2) EBIT 2,683 (109) 51 (23) 26 2,738 in % of revenues 6.6% 6.8% Interest income Interest expenses (367) (367) Other Financial Result (190) (154) (36) Finance Result (413) (154) (259) Income before taxes 2,270 (109) 51 (23) 26 (154) 2,479 Non-controlling interest 7 7 Net Income reported 1,453 1,792 Number of shares 774,762, ,762,268 EPS reported (in ) Net Income Adjusted excludes the following items: Adjustments impacting the EBIT line (as reported in the EBIT Adjusted) The Other Financial Result, except for the unwinding of discount on provisions The tax effect on Adjusted Income before taxes is calculated at 28%. The effective tax rate on Income before taxes is 36% (1) Thereof m A400M provision update mainly for escalation, m net capital gains from disposals (2) Thereof + 7 m Airbus, + 19 m ADS
20 9M 2017 DETAILED INCOME STATEMENT AND ADJUSTMENTS 20 IN MILLION thereof Adjustments Impact on EBIT 9m 2017 Operational FX Financial Result 9m 2017 Adjusted Defence and Space (1) Airbus & ADS (2) EBIT 1, ,208 in % of revenues 4.4% 3.2% Interest income Interest expenses (385) (385) Other Financial Result (51) Finance Result (302) Income before taxes 1, Non-controlling interest 0 0 Net Income reported 1, Number of shares 773,574, ,574,878 EPS reported (in ) Net Income Adjusted excludes the following items: Adjustments impacting the EBIT line (as reported in the EBIT Adjusted) The Other Financial Result, except for the unwinding of discount on provisions The tax effect on Adjusted Income before taxes is calculated at 28% 2017 figures are amended with IFRS15 restatements (1) Thereof m Defence Electronics net capital gain, + 19 m Other AD portfolio, m A400M LMC (2) Thereof - 27 m Airbus, + 70 m ADS
21 Q KEY FIGURES 21 IN MILLION Q Q (1) Revenues 15,451 12,832 EBIT Adjusted 1, EBIT 1, Net Income FCF before M&A (273) (1,234) FCF before M&A and Customer Financing (201) (1,251) IN MILLION Q Q Q Q Q Q Revenues EBIT Adjusted EBIT Airbus 11,932 9,397 1, , Helicopters 1,367 1, Defence and Space (1) 2,399 2, Transversal & Elim. (247) (198) (64) (74) (64) (74) Consolidated Airbus (1) 15,451 12,832 1, , (1) 2017 IFRS 15 restatements updated for Q3/Q4 phasing. No impact on FY 2017 restatements 2017 figures are pro forma, amended with IFRS15 restatements and new segment reporting
22 AIRBUS: STRONG LIQUIDITY POSITION AS OF 30 SEPTEMBER bn Credit Facility (RSCF) Credit Facility: Maturity 2021, undrawn Fully committed by 40 banks No financial covenants, no MAC clause 18.3 bn Total Gross Cash Invested in highly rated securities 11.1 bn Financing Liabilities 7.2 bn Net Cash Financing Liabilities: of which long-term : 7.5 bn Includes 3.0 bn EMTN, 0.5 bn Convertible Bond, 1.1 bn exchangeable bond and $ 2.5 bn USD 144A/RegS Credit Ratings: Short-term rating: S & P: A-1+ Moody s: P-1 Long-term rating: S & P: A+ stable Moody s: A2 stable
23 DETAILED FREE CASH FLOW 23 IN MILLION 9m m 2017 Net Cash position at the beginning of the period 13,390 11,113 Gross Cash Flow from Operations (1) 2,517 1,856 Change in working capital (5,687) (4,400) Cash used for investing activities (2) (758) (664) of which Industrial Capex (additions) (3) (1,378) (1,655) Free Cash Flow (4) (5) (3,928) (3,208) of which M&A Free Cash Flow before M&A (4,342) (3,781) of which Customer Financing (173) (437) Free Cash Flow before M&A and Customer Financing (4,169) (3,344) Change in capital and non-controlling interests Change in treasury shares / share buyback (52) 0 Contribution to plan assets of pension schemes (1,152) (171) Cash distribution to shareholders / non - controlling interests (1,161) (1,047) Others (6) (21) (48) Net cash position at the end of the period 7,188 6, figures are amended with IFRS15 restatements (1) Excluding working capital change, contribution to plan assets of pension schemes and realised FX results on Treasury swaps (2) Excluding change in securities and change in cash from changes in consolidation and excluding bank activities; (3) Excluding leased and financial assets; (4) Excluding change in securities, change in cash from changes in consolidation, contribution to plan assets, realised FX results on Treasury swaps and bank activities (5) Including A220 integration ; (6) Including C-Series A/C Ltd. Partnership (C-SALP) funding arrangement
24 NET CASH POSITION 24 IN MILLION Sept Dec Gross Cash 18,325 24,587 Financing Debts (11,137) (11,197) Short-term Financing Debts (3,638) (2,213) Long-term Financing Debts (7,499) (8,984) Reported Net Cash 7,188 13,390 Airbus non-recourse debt Net Cash excl. non-recourse 7,223 13, figures are amended with IFRS15 restatements
25 CUSTOMER FINANCING EXPOSURE 25 IN MILLION Sept Dec Sept Dec Airbus Helicopters Closing rate 1 = $1.16 $1.20 $ 1.16 $ 1.20 Total Gross Exposure 1,067 1, of which off-balance sheet Estimated value of collateral (814) (953) (58) (64) Net Exposure Provision and asset impairment (253) (311) (85) (71) Net Exposure after provision
26 AIRBUS CUSTOMER FINANCING 26 IN BILLION Additions Sell Down Amortization Net change Airbus Customer Financing Gross Exposure 0.4 (2.2) (0.2) (0.1) (1.1) (0.1) (0.3) (0.2) (0.7) (0.7) (0.1) (0.1) (0.2) (0.1) (0.7) (0.7) (0.6) (0.1) (0.2) (0.1) 0.9 (0.5) (0.2) 0.7 (0.7) (0.1) 0.1 (0.3) (0.1) (0.2) Gross Exposure in $ bn m Net Exposure fully provisioned Net Exposure fully provisioned Gross Exposure 1.1 bn ($ 1.2 bn) Net Exposure 0.3 bn) Estimated Collateral 0.8 bn ($ 0.9 bn) 30 September 2018 /$ = 1.16 Gross Exposure 1.3 bn ($ 1.5 bn) Net Exposure Estimated Collateral 1.0 bn ($ 1.1 bn) 31 December 2017 /$ = bn
27 BALANCE SHEET HIGHLIGHTS: ASSETS 27 IN MILLION Sept Dec Non-current Assets 57,527 53,526 of which Intangible & Goodwill 16,988 11,629 of which Property, plant & equipment 16,659 16,611 of which Investments & Financial assets 5,768 5,821 of which positive hedge mark-to-market 1,598 2,901 of which Non-current securities 10,321 10,944 Current Assets 58,484 57,346 of which Inventory 35,052 29,737 of which Cash 5,603 12,016 of which Current securities 2,401 1,627 of which positive hedge mark-to-market Assets of disposal groups classified as held for sale Total Assets 116, ,074 Closing rate vs. $ figures are amended with IFRS15 restatements
28 BALANCE SHEET HIGHLIGHTS: LIABILITIES 28 IN MILLION Sept Dec Total Equity 9,526 10,742 of which OCI (Other Comprehensive Income) 944 2,742 of which Non-controlling interests (5) 2 Non-current liabilities 44,909 42,162 of which pensions 7,452 8,025 of which other provisions 4,094 1,754 of which financing debts 7,499 8,984 of which European governments refundable advances 5,752 5,537 of which Customer advances 15,895 16,659 of which negative hedge mark-to-market 977 1,127 Current liabilities 61,611 58,064 of which pensions of which other provisions 5,285 5,936 of which financing debts 3,638 2,213 of which European governments refundable advances of which Customer advances 34,954 30,921 of which negative hedge mark-to-market 1,434 1,144 Liabilities of disposal groups classified as held for sale 106 Total Liabilities and Equity 116, , figures are amended with IFRS15 restatements
29 SHAREHOLDING STRUCTURE AS AT 30 SEPTEMBER % 11.0% 4.2% 0.1% Free Float Shareholder Agreement SOGEPA GZBV 73.6% 26.3% 11.1% 11.0% 73.6% SEPI 4.2% Treasury Shares 0.1% 775,873,527 shares issued as at 30 September 2018
30 QUARTERLY REVENUES BREAKDOWN (CUMULATIVE) 30 IN MILLION Q1 H1 9m FY Airbus 7,222 8,166 18,546 18,182 30,478 27,579 43,486 Helicopters 961 1,176 2,388 2,716 3,755 4,197 6,335 Defence and Space (1) 2,217 2,340 4,652 4,900 7,051 7,052 10,596 (1) Transversal & Elim. (281) (240) (616) (623) (863) (821) (1,395) Consolidated Airbus 10,119 11,442 24,970 25,175 40,421 38,007 59,022 (1) (1) 2017 IFRS 15 restatements updated for Q3/Q4 phasing. No impact on FY 2017 restatements Helicopters and Defence and Space figures reflect perimeter change impact 2017 figures are pro forma, amended with IFRS15 restatements and new segment reporting
31 QUARTERLY EBIT ADJUSTED BREAKDOWN (CUMULATIVE) 31 IN MILLION Q1 H1 9m FY Airbus (41) (103) , ,383 Helicopters (3) (6) Defence and Space (1) (1) Transversal & Elim. (54) (28) (149) (82) (213) (156) (255) Consolidated Airbus 14 (19) 1, ,738 1,208 3,190 (1) (1) 2017 IFRS 15 restatements updated for Q3/Q4 phasing. No impact on FY 2017 restatements Helicopters and Defence and Space figures reflect perimeter change impact 2017 figures are pro forma, amended with IFRS15 restatements and new segment reporting
32 QUARTERLY EBIT BREAKDOWN (CUMULATIVE) 32 IN MILLION Q1 H1 9m FY Airbus (2) (48) , ,257 Helicopters (10) (6) Defence and Space (1) (1) Transversal & Elim. (54) (28) (149) (82) (213) (156) (301) Consolidated Airbus ,120 1,211 2,683 1,673 2,665 (1) (1) 2017 IFRS 15 restatements updated for Q3/Q4 phasing. No impact on FY 2017 restatements Helicopters and Defence and Space figures reflect perimeter change impact 2017 figures are pro forma, amended with IFRS15 restatements and new segment reporting
33 9M 2018 IFRS VS. APM CASH FLOW RECONCILIATION 33 IN MILLION 9m 2018 IN BILLION 9m 2018 Cash provided by (used for) operating activities (4,326) t/o Reimbursement from / contribution to plan assets (1,152) t/o Treasury swaps (4) t/o Change in working capital (5,687) Gross Cash Flow from Operations (1) 2,517 Cash provided by (used for) operating activities (4,326) Cash provided by (used for) investing activities (951) t/o Net proceeds (payment) (17) Others 1,332 Free Cash Flow (1) (3,928) t/o M&A transactions 414 Free Cash Flow before M&A (1) (4,342) t/o Customer Financing (173) FCF before M&A and Customer Financing (1) (4,169) As of 1 July 2018, A220 consolidated into Commercial Aircraft. (1) Including A220 integration - Net cash impact of A220 integration covered by C-SALP funding agreement
34 GLOSSARY ON ALTERNATIVE PERFORMANCE MEASURES (APM) The following Presentation also contains certain non-gaap financial measures, i.e. financial measures that either exclude or include amounts that are not excluded or included in the most directly comparable measure calculated and presented in accordance with IFRS. For example, Airbus makes use of the non- GAAP measures EBIT Adjusted, EPS Adjusted and Free Cash Flow. Airbus uses these non-gaap financial measures to assess its consolidated financial and operating performance and believes they are helpful in identifying trends in its performance. These measures enhance management s ability to make decisions with respect to resource allocation and whether Airbus is meeting established financial goals. Non-GAAP financial measures have certain limitations as analytical tools, and should not be considered in isolation or as substitutes for analysis of Airbus results as reported under IFRS. Because of these limitations, they should not be considered substitutes for the relevant IFRS measures. EBIT: Airbus continues to use the term EBIT (Earnings before interest and taxes). It is identical to Profit before finance cost and income taxes as defined by IFRS Rules. Adjustment is an alternative performance measure used by Airbus which includes material charges or profits caused by movements in provisions related to programmes, restructuring or foreign exchange impacts as well as capital gains/losses from the disposal and acquisition of businesses. EBIT Adjusted: Airbus uses an alternative performance measure, EBIT Adjusted as a key indicator capturing the underlying business margin by excluding material charges or profits caused by movements in provisions related to programmes, restructuring or foreign exchange impacts as well as capital gains/losses from the disposal and acquisition of businesses. EPS Adjusted is an alternative performance measure of a basic EPS as reported whereby the net income as the numerator does include Adjustments. For reconciliation see slide 19. Gross Cash position: Airbus defines its consolidated gross cash position as the sum of (i) cash and cash equivalents and (ii) securities (all as recorded in the consolidated statement of financial position). Net cash position: Airbus defines its consolidated net cash position as the sum of (i) cash and cash equivalents and (ii) securities, minus (iii) financing liabilities (all as recorded in the consolidated statement of financial position) as defined in MD&A section Gross cash flow from operations: Gross cash flow from operations is an alternative performance measure and an indicator used by Airbus to measure its operating cash performance before changes in working capital. It is defined in Registration Document, MD&A section as cash provided by operating activities, excluding (i) changes in other operating assets and liabilities (working capital), (ii) contribution to plan assets of pension schemes and (iii) realised foreign exchange results on Treasury swaps. Change in working capital: it is identical to changes in other operating assets and liabilities as defined by IFRS Rules. It is comprised of inventories, trade receivables, other assets and prepaid expenses netted against trade liabilities, other liabilities (including customer advances), deferred income and customer financing. FCF: For the definition of the alternative performance measure free cash flow, see Registration Document, MD&A section It is a key indicator which allows the Company to measure the amount of cash flow generated from operations after cash used in investing activities. FCF before M&A refers to FCF as defined in the Registration Document, MD&A section adjusted for net proceeds from disposals and acquisitions. It is an alternative performance measure and indicator that is important in order to measure FCF excluding those cash flows from the disposal and acquisition of businesses. FCF before M&A and Customer Financing refers to free cash flow before mergers and acquisitions adjusted for cash flow related to aircraft financing activities. It is an alternative performance measure and indicator that may be used from time to time by the Company in its financial guidance, esp. when there is higher uncertainty around customer financing activities, such as during the suspension of ECA financing support. 34
AIRBUS H1 Results 2018
 AIRBUS H1 Results 2018 26 July 2018 Tom Enders Chief Executive Officer Harald Wilhelm Chief Financial Officer SAFE HARBOUR STATEMENT 2 DISCLAIMER This presentation includes forward-looking statements.
AIRBUS Q1 Results 2018
 AIRBUS Q1 Results 2018 27 April 2018 Harald Wilhelm Chief Financial Officer SAFE HARBOUR STATEMENT 2 DISCLAIMER This presentation includes forward-looking statements. Words such as anticipates, believes,
AIRBUS 9m Results 2017
 AIRBUS 9m Results 2017 31 October 2017 Harald Wilhelm Chief Financial Officer SAFE HARBOUR STATEMENT 2 DISCLAIMER This presentation includes forward-looking statements. Words such as anticipates, believes,
AIRBUS Q1 Results 2017
 AIRBUS Q1 Results 2017 27 April 2017 Harald Wilhelm Chief Financial Officer SAFE HARBOUR STATEMENT 2 DISCLAIMER This presentation includes forward-looking statements. Words such as anticipates, believes,
AIRBUS FY Results 2017
 AIRBUS FY Results 2017 15 February 2018 Tom Enders Chief Executive Officer Harald Wilhelm Chief Financial Officer SAFE HARBOUR STATEMENT 2 DISCLAIMER This presentation includes forward-looking statements.
AIRBUS FY Results 2016
 AIRBUS FY Results 2016 22 February 2017 Tom Enders Chief Executive Officer Harald Wilhelm Chief Financial Officer SAFE HARBOUR STATEMENT 2 DISCLAIMER This presentation includes forward-looking statements.
HARALD WILHELM Chief Financial Officer AIRBUS GROUP Q1 RESULTS 2016
 HARALD WILHELM Chief Financial Officer AIRBUS GROUP Q1 RESULTS 2016 SAFE HARBOUR STATEMENT 2 DISCLAIMER This presentation includes forward-looking statements. Words such as anticipates, believes, estimates,
AIRBUS GROUP H1 RESULTS 2016
 AIRBUS GROUP H1 RESULTS 2016 27 JULY 2016 TOM ENDERS Chief Executive Officer HARALD WILHELM Chief Financial Officer SAFE HARBOUR STATEMENT 2 DISCLAIMER This presentation includes forward-looking statements.
AIRBUS GROUP ANNUAL RESULTS 2015
 AIRBUS GROUP ANNUAL RESULTS 2015 LONDON, 24 FEBRUARY 2016 TOM ENDERS Chief Executive Officer HARALD WILHELM Chief Financial Officer SAFE HARBOUR STATEMENT 2 DISCLAIMER This presentation includes forward-looking
ANNUAL RESULTS , FEBRUARY Tom Enders I Chief Executive Officer Harald Wilhelm I Chief Financial Officer
 ANNUAL RESULTS 26, FEBRUARY 2014 Tom Enders I Chief Executive Officer Harald Wilhelm I Chief Financial Officer Safe Harbour Statement 2 Disclaimer This presentation includes forward-looking statements.
9m Results Harald Wilhelm. Chief Financial Officer
 9m Results Harald Wilhelm Chief Financial Officer Safe Harbour Statement 2 DISCLAIMER This presentation includes forward-looking statements. Words such as anticipates, believes, estimates, expects, intends,
H1 Results Tom Enders. Harald Wilhelm. Chief Executive Officer. Chief Financial Officer
 H1 Results Tom Enders Chief Executive Officer Harald Wilhelm Chief Financial Officer Safe Harbour Statement 2 DISCLAIMER This presentation includes forward-looking statements. Words such as anticipates,
AIRBUS. IFRS 15 and New Segment Reporting: 2017 Quarterly Restatements. 9 th April 2018
 AIRBUS and Reporting: 2017 Quarterly Restatements 9 th April 2018 SAFE HARBOUR STATEMENT 2 DISCLAIMER This presentation includes forward-looking statements. Words such as anticipates, believes, estimates,
Airbus reports strong Full-Year 2018 results, delivers on guidance
 Airbus reports strong Full-Year results, delivers on guidance Strong performance, guidance delivered Revenues 64 billion; EBIT Adjusted 5.8 billion; Free Cash Flow Before M&A and Customer Financing 2.9
Airbus reports First Quarter (Q1) 2018 results, confirms guidance
 2018 results, confirms guidance") Airbus reports First Quarter () results, confirms guidance Backlog and commercial momentum support ramp-up plans financials reflect engine and aircraft delivery phasing Revenues 10 billion; EBIT Adjusted
Airbus reports First Quarter () results, confirms guidance Backlog and commercial momentum support ramp-up plans financials reflect engine and aircraft delivery phasing Revenues 10 billion; EBIT Adjusted
Airbus reports Half-Year 2018 (H1) financial results
 financial results") Airbus reports Half-Year () financial results Commercial aircraft environment robust, backlog underpins ramp-up plans financials reflect mainly A350 XWB performance and delivery phasing Revenues 25 billion;
Airbus reports Half-Year () financial results Commercial aircraft environment robust, backlog underpins ramp-up plans financials reflect mainly A350 XWB performance and delivery phasing Revenues 25 billion;
AIRBUS GROUP 2016 CAPITAL MARKETS UPDATE
 AIRBUS GROUP 2016 CAPITAL MARKETS UPDATE LONDON, 24 FEBRUARY 2016 HARALD WILHELM Chief Financial Officer SAFE HARBOUR STATEMENT 2 DISCLAIMER This presentation includes forward-looking statements. Words
Full-Year 2017 results: Airbus overachieved on all key performance indicators
 Full-Year results: Airbus overachieved on all key performance indicators Strong underlying business performance Revenues 67bn; EBIT Adjusted 4.3bn; EBIT (reported) 3.4bn; EPS (reported) 3.71 Proposed dividend
Airbus reports Nine-Month (9m) 2017 results
 2017 results") Airbus reports Nine-Month () results Revenues 43bn; EBIT Adjusted 1.8bn; EBIT (reported) 2.3bn; EPS (reported) 2.39 Commercial aircraft market healthy, robust backlog supports ramp-up plans Engine delays
Airbus reports Nine-Month () results Revenues 43bn; EBIT Adjusted 1.8bn; EBIT (reported) 2.3bn; EPS (reported) 2.39 Commercial aircraft market healthy, robust backlog supports ramp-up plans Engine delays
AIRBUS Investor Meeting London 2018
 AIRBUS Investor Meeting London 2018 18 July 2018 Tom Enders Chief Executive Officer Eric Schulz Chief Commercial Officer Guillaume Faury President Commercial Aircraft Harald Wilhelm Chief Financial Officer
Growth and the Bottom Line Harald Wilhelm Chief Financial Officer
 Growth and the Bottom Line Harald Wilhelm Chief Financial Officer Page 1 Safe Harbour Statement Disclaimer This presentation includes forward-looking statements. Words such as anticipates, believes, estimates,
AIRBUS IFRS 15 Update
 AIRBUS IFRS 15 Update 15 February 2018 Harald Wilhelm Chief The Financial actual IFRS Officer 15 impacts may differ from the estimates when adopting the standard as of 1 st January 2018. SAFE HARBOUR STATEMENT
Airbus reports Half-Year (H1) 2017 results
 2017 results") Airbus reports Half-Year () results Revenues 29bn; EBIT Adjusted 1.1bn; EBIT (reported) 1.8bn; EPS (reported) 1.94 Commercial aircraft environment healthy, robust backlog supports ramp-up plans financials
Airbus reports Half-Year () results Revenues 29bn; EBIT Adjusted 1.1bn; EBIT (reported) 1.8bn; EPS (reported) 1.94 Commercial aircraft environment healthy, robust backlog supports ramp-up plans financials
Airbus reports First Quarter (Q1) 2017 results
 2017 results") Airbus reports First Quarter () results Revenues 13bn; EBIT Adjusted 240m; EBIT (reported) 852m; EPS (reported) 0.79 financials reflect delivery phasing and divestments Strong commercial aircraft backlog
Airbus reports First Quarter () results Revenues 13bn; EBIT Adjusted 240m; EBIT (reported) 852m; EPS (reported) 0.79 financials reflect delivery phasing and divestments Strong commercial aircraft backlog
Global Investor Forum Finance. Harald Wilhelm, CFO EADS London, 11th/12th December 2013
 - Finance Harald Wilhelm, CFO EADS London, 11th/12th December 2013 Safe Harbour Statement Disclaimer This presentation includes forward-looking statements. Words such as anticipates, believes, estimates,
9m 2005 Earnings. Hans Peter Ring. Safe Harbor Statement. Place for. Date of presentation, place. Chief Financial Officer
 9m 2005 Earnings Hans Peter Ring Chief Financial Officer Place for Earnings conference call 9th November 2005 Date of presentation, place 1 Safe Harbor Statement Certain of the statements contained in
Airbus delivers Full-Year 2016 results in line with guidance
 (For its Full-Year financial reporting, Airbus has implemented the European Securities and Markets Authority s guidelines on Alternative Performance Measures. As a result, certain items will no longer
Airbus Group Reports Solid 2015 Results, With Guidance Achieved
 Airbus Group Reports Solid Results, With Guidance Achieved Revenues up six percent to 64 billion; EBIT* before one-off 4.1 billion Earnings per share rise 15 percent to 3.43 Proposed dividend 1.30 per
Profitability drivers
 Profitability drivers Global Investor Forum, Toulouse 15-16 November Hans-Peter Ring CFO 1 2 Disclaimer Disclaimer This presentation includes forward-looking statements. Words such as anticipates, believes,
Full Year 2009 Earnings
 Full Year 2009 Earnings Conference Call, 9th March 2010 Louis Gallois CEO Hans Peter Ring CFO Safe Harbour Statement 2 Disclaimer This presentation includes forward-looking statements. Words such as anticipates,
Q Earnings. Safe Harbour Statement. Hans Peter Ring CFO. Conference Call, 12th May 2009
 Q1 Earnings Conference Call, 12th May Hans Peter Ring CFO Safe Harbour Statement 2 Disclaimer This presentation includes forward-looking statements Words such as anticipates, believes, estimates, expects,
Airbus Group Reports Robust First Quarter 2015 Results
 Airbus Group Reports Robust First Quarter Results Solid operational performance supports EPS and cash flow, further enhanced by divestments Revenues 12.1 billion, EBIT* before one-off 651 million Earnings
9m 2006 Earnings. Hans Peter Ring COO Finance. Earnings Conference Call 8th November 2006
 9m 2006 Earnings Hans Peter Ring COO Finance Earnings Conference Call 8th November 2006 1 Safe Harbor Statement Certain of the statements contained in this document are not historical facts but rather
Airbus Group Reports First Quarter (Q1) 2016 Results
 2016 Results") Airbus Group Reports First Quarter () Results guidance maintained, commercial aircraft order backlog robust Revenues 12 billion; EBIT* before one-off 501 million; Earnings per share 0.51 financials driven
Airbus Group Reports First Quarter () Results guidance maintained, commercial aircraft order backlog robust Revenues 12 billion; EBIT* before one-off 501 million; Earnings per share 0.51 financials driven
Airbus Group Reports Solid Half-Year (H1) 2015 Results
 2015 Results") Airbus Group Reports Solid Half-Year () Results Revenues 28.9 billion, EBIT* before one-off 1.88 billion: Both rise 6% Earnings per share up 34 percent to 1.94 Free cash flow 549 million, including sale
Airbus Group Reports Solid Half-Year () Results Revenues 28.9 billion, EBIT* before one-off 1.88 billion: Both rise 6% Earnings per share up 34 percent to 1.94 Free cash flow 549 million, including sale
H Earnings. Conference Call, 26th July 2007
 H1 2007 Earnings Hans Peter Ring CFO Conference Call, 26th July 2007 "Work in progress" 1 Safe Harbor Statement Certain of the statements contained in this document are not historical facts but rather
Q Earnings. Conference Call, 10th May 2007
 Q1 2007 Earnings Hans Peter Ring COO for Finance Conference Call, 10th May 2007 1 Safe Harbor Statement Certain of the statements contained in this document are not historical facts but rather are statements
Airbus Group Reports Half-Year (H1) 2016 Results
 2016 Results") Airbus Group Reports Half-Year () Results Robust and diversified commercial backlog supporting ramp-up financials driven by back-loaded aircraft delivery schedule Revenues 29 billion; EBIT* before one-off
Airbus Group Reports Half-Year () Results Robust and diversified commercial backlog supporting ramp-up financials driven by back-loaded aircraft delivery schedule Revenues 29 billion; EBIT* before one-off
Airbus Defence & Space
 1 Airbus Defence & Space Bernhard Gerwert Airbus DS, CEO London 10 December 2014 Safe Harbour Statement 2 Disclaimer This presentation includes forward-looking statements. Words such as anticipates, believes,
EADS: Rising to the challenge
 EADS: Rising to the challenge Pierre de Bausset Investor Relations and Financial Communication Jean-Baptiste Pons Corporate Finance & Treasury Barcelona 13th May 05 Page 1 EADS Highlights Global leader
EADS North America. North America Investor Forum 2010 New York, 18 th March Sean O Keefe CEO, EADS North America
 EADS North America North America Investor Forum 2010 New York, 18 th March 2010 Sean O Keefe CEO, EADS North America Safe Harbour Statement 2 Disclaimer This presentation includes forward-looking statements.
H Earnings. Thomas Enders & Louis Gallois. Hans Peter Ring COO Finance. CEOs. Earnings Conference Call 27th July 2006
 H1 2006 Earnings Thomas Enders & Louis Gallois CEOs Hans Peter Ring COO Finance Earnings Conference Call 27th July 2006 1 Safe Harbor Statement Certain of the statements contained in this document are
Eurocopter in the US. North America Investor Forum 2010 New York, 18 th March Marc Paganini CEO, American Eurocopter
 Eurocopter in the US North America Investor Forum 2010 New York, 18 th March 2010 Marc Paganini CEO, American Eurocopter Safe Harbour Statement 2 Disclaimer This presentation includes forward-looking statements.
Global Helicopter Forecast
 Global Helicopter Forecast C&P untapped demand is rising Key world economies are still underequipped TOP 10 Countries in 2016 ( H/C fleet in service) U.S.A. Russia Canada Brazil Australia United Kingdom
EADS N.V. Unaudited Condensed IFRS Consolidated Financial Information for the year ending December 31, Year 2004 Report
 Year 2004 Report Unaudited Condensed IFRS Consolidated Financial Information of EADS N.V. for the year 2004 Unaudited Condensed IFRS Consolidated Income Statements....... 2 Unaudited Condensed IFRS Consolidated
First Quarter Report 2003
 First Quarter Report 2003 Condensed Interim Consolidated Financial Statements of EADS N.V. for the first quarter of 2003 Consolidated Income Statements... 2 Consolidated Balance Sheets... 3 Consolidated
First Quarter 2017 Financial Results
 First Quarter 2017 Financial Results AerCap Holdings N.V. May 9, 2017 Disclaimer Incl. Forward Looking Statements & Safe Harbor This presentation contains certain statements, estimates and forecasts with
New Revenue Rules ASC 606. September 5, 2017
 New Revenue Rules ASC 606 September 5, 2017 2 Welcome Safe Harbor Non-GAAP Financial Measures and Other Key Performance Measures To supplement our condensed consolidated financial statements, which are
EADS N.V. Unaudited Condensed Consolidated Financial Information for the year ending December 31, Year 2003 Report
 Year 2003 Report Unaudited Condensed Consolidated Financial Information of EADS N.V. for the year 2003 Unaudited Condensed Consolidated Income Statements... 2 Unaudited Condensed Consolidated Balance Sheets...
THIRD QUARTER 2016 CONFERENCE CALL AND WEBCAST. November 1, 2016
 THIRD QUARTER 2016 CONFERENCE CALL AND WEBCAST November 1, 2016 AGENDA Introduction Business Overview Financial Overview Roger Hendriksen Director, Investor Relations Jeff Edwards Chairman and Chief Executive
Transition to U.S. GAAP and U.S. dollar as reporting currency
 Transition to U.S. GAAP and U.S. dollar as reporting currency A summary document for investors and analysts Safe Harbor Statement Certain statements contained in this document that are not statements of
Fourth Quarter 2017 Financial Results
 Fourth Quarter 2017 Financial Results AerCap Holdings N.V. February 14, 2018 Disclaimer Incl. Forward Looking Statements & Safe Harbor This presentation contains certain statements, estimates and forecasts
2002 Results. Performance & Discipline Philippe Camus - Rainer Hertrich, CEOs Hans Peter Ring, CFO Analysts meeting - Paris - March 10th, 2003
 2002 Results Performance & Discipline Philippe Camus - Rainer Hertrich, CEOs Hans Peter Ring, CFO Analysts meeting - Paris - March 10th, 2003 Safe Harbor Statement Certain of the statements contained in
Siemens Gamesa Renewable Energy Q3 18 Results
 Siemens Gamesa Renewable Energy Q3 18 Results 27 July 2018 Disclaimer This material has been prepared by Siemens Gamesa Renewable Energy, and is disclosed solely for information purposes. This document
2018 Half Year Results Rolls-Royce Half Year Results Data Appendix
 Data Appendix Contents 01 The Group 03 02 Civil Aerospace 17 03 Defence 24 04 Power Systems 27 2 01 The Group 3 Group results H1 2018 H1 2017 Group underlying revenue ( m) 7,040 6,041 Group underlying
l 2018 l 1. Airbus SE IFRS Consolidated Financial Statements 2. Notes to the IFRS Consolidated Financial Statements
 Financial Statements l 2018 l 1. Airbus SE IFRS Consolidated Financial Statements 2. Notes to the IFRS Consolidated Financial Statements 3. Airbus SE IFRS Company Financial Statements 4. Notes to the IFRS
Fourth quarter and full year 2017 results
 Fourth quarter and full year 207 results FINANCIAL AND OPERATIONAL HIGHLIGHTS Financial summary Q4 '7 Revenue of 220 million (Q4 '6: 266 million) Gross margin of 59% (Q4 '6: 58%) EBITDA of 37 million (Q4
Q results : On-track for Year-End Profitability and Cash targets. Analysts conference call - Hans-Peter Ring, CFO November 14 th, 2002
 Q3 2002 results : On-track for Year-End Profitability and Cash targets Analysts conference call - Hans-Peter Ring, CFO November 14 th, 2002 1 Welcome from new CFO and new Head of IR Hans-Peter Ring EADS
Siemens Gamesa Renewable Energy Q Results
 Siemens Gamesa Renewable Energy Q2 208 Results 04 May 208 Disclaimer This material has been prepared by Siemens Gamesa Renewable Energy, and is disclosed solely for information purposes. This document
2Q 2017 Highlights and Operating Results
 2Q 2017 Highlights and Operating Results July 25, 2017 1 2Q 2017 Highlights and Operating Results Table of Contents Page(s) 1 Sales Overview and Highlights 4-5 2 NSS Overview 6-7 3 EES Overview 8-9 4 UPS
Consolidated Statement of Profit or Loss (in million Euro)
") Consolidated Statement of Profit or Loss (in million Euro) Q1 2016 Q1 2017 % change Revenue 603 588-2.5% Cost of sales (408) (396) -2.9% Gross profit 195 192-1.5% Selling expenses (84) (86) 2.4% Research
Consolidated Statement of Profit or Loss (in million Euro) Q1 2016 Q1 2017 % change Revenue 603 588-2.5% Cost of sales (408) (396) -2.9% Gross profit 195 192-1.5% Selling expenses (84) (86) 2.4% Research
Q4 AND FY 2018 RESULTS
 Q4 AND FY 2018 RESULTS Harold Goddijn CEO Taco Titulaer CFO 6 FEBRUARY 2019 Operational highlights Divestment of Telematics Capital repayment of 750 million announced Extended Microsoft partnership; now
Earnings Call Presentation Q4 2018
 Earnings Call Presentation Q4 2018 February 14, 2019 Safe Harbor Statement Statements in this presentation may contain forward-looking statements as contemplated by the 1995 Private Securities Litigation
Consolidated Statement of Profit or Loss (in million Euro)
") Consolidated Statement of Profit or Loss (in million Euro) Q3 2015 Q3 2016 % change 9m 2015 9m 2016 % change Revenue 661 625-5.4% 1,974 1,873-5.1% Cost of sales (453) (415) -8.4% (1,340) (1,239) -7.5%
Consolidated Statement of Profit or Loss (in million Euro) Q3 2015 Q3 2016 % change 9m 2015 9m 2016 % change Revenue 661 625-5.4% 1,974 1,873-5.1% Cost of sales (453) (415) -8.4% (1,340) (1,239) -7.5%
FIRST-HALF 2017 EARNINGS
 FIRST-HALF 2017 EARNINGS Disclaimer > IMPORTANT ADDITIONAL INFORMATION This document is not intended to and does not constitute an offer to sell or the solicitation of an offer to subscribe for or buy
First quarter 2007 Report
 First quarter 2007 Report Unaudited Condensed Consolidated Financial Information of EADS N.V. for the first quarter 2007 Unaudited Condensed IFRS Consolidated Income Statements....... 2 Unaudited Condensed
TE CONNECTIVITY THE OPPORTUNITY HAS NEVER BEEN GREATER. Terrence Curtin Chief Executive Officer
 TE CONNECTIVITY THE OPPORTUNITY HAS NEVER BEEN GREATER Terrence Curtin Chief Executive Officer Forward-Looking Statements and Non-GAAP Measures Forward-Looking Statements This presentation contains certain
First Quarter 2018 Financial Results
 First Quarter 2018 Financial Results AerCap Holdings N.V. May 3, 2018 Disclaimer Incl. Forward Looking Statements & Safe Harbor This presentation contains certain statements, estimates and forecasts with
Third Quarter 2017 Financial Results
 Third Quarter 2017 Financial Results AerCap Holdings N.V. November 2, 2017 Disclaimer Incl. Forward Looking Statements & Safe Harbor This presentation contains certain statements, estimates and forecasts
Q Earnings. April 25, 2018
 Q2 2018 Earnings April 25, 2018 Forward-Looking Statements and Non-GAAP Measures Forward-Looking Statements This presentation contains certain forward-looking statements within the meaning of the U.S.
Consolidated Statement of Profit or Loss (in million Euro)
") Consolidated Statement of Profit or Loss (in million Euro) Unaudited, consolidated figures following IFRS accounting policies. Q2 2017 Q2 2018 H1 2017 H1 2018 Revenue 622 559 1,210 1,108 Cost of sales
Consolidated Statement of Profit or Loss (in million Euro) Unaudited, consolidated figures following IFRS accounting policies. Q2 2017 Q2 2018 H1 2017 H1 2018 Revenue 622 559 1,210 1,108 Cost of sales
Second Quarter 2017 Financial Results
 Second Quarter 2017 Financial Results AerCap Holdings N.V. August 3, 2017 Disclaimer Incl. Forward Looking Statements & Safe Harbor This presentation contains certain statements, estimates and forecasts
Second Quarter 2018 Financial Results
 Second Quarter 2018 Financial Results AerCap Holdings N.V. July 30, 2018 Disclaimer Incl. Forward Looking Statements & Safe Harbor This presentation contains certain statements, estimates and forecasts
Fiscal 2019 First Quarter Results. October 30, 2018
 Fiscal 2019 First Quarter Results October 30, 2018 Safe Harbor This presentation contains forward-looking statements within the meaning of Section 27A of the Securities Act of 1933, as amended, and Section
Fourth Quarter Earnings Call January 25, 2018
 Fourth Quarter Earnings Call January 25, 2018 Financial Data Charts This presentation consists of L3, Inc. general capabilities and administrative information that does not contain controlled technical
Q Earnings Call. November 5, 2012
 Q4 2012 Earnings Call November 5, 2012 Forward-Looking Statements and Non-GAAP Measures Forward-Looking Statements -- This presentation contains certain forward-looking statements within the meaning of
Third Quarter 2018 Financial Results
 Third Quarter 2018 Financial Results AerCap Holdings N.V. October 30, 2018 Disclaimer Incl. Forward Looking Statements & Safe Harbor This presentation contains certain statements, estimates and forecasts
Q3 Fiscal Year 2018 Investor Presentation Financial Results Conference Call
 February Sept 6, 2018 2017 Q3 Fiscal Year 2018 Investor Presentation Financial Results Conference Call Mark D. Morelli President and Chief Executive Officer Gregory P. Rustowicz Vice President Finance
First Quarter Earnings Call May 1, 2018 Financial Data Charts
 First Quarter Earnings Call May 1, 2018 Financial Data Charts This presentation consists of L3 Technologies, Inc. general capabilities and administrative information that does not contain controlled technical
IFRS transition. Marcel Smits CFO. IFRS conference call April 18, 2005
 transition Marcel Smits CFO conference call April 18, 2005 Safe harbor This presentation provides a general overview of the impact of on KPN s financial reporting. It does not replace any formal reporting.
First nine months 2006 Report
 First nine months 2006 Report Unaudited Condensed Consolidated Financial Information of EADS N.V. for the first nine months of 2006 Unaudited Condensed IFRS Consolidated Income Statements....... 2 Unaudited
4Q 2017 Earnings and 2018 Outlook Conference Call. January 24, 2018
 4Q 2017 Earnings and 2018 Outlook Conference Call January 24, 2018 Note: All results and expectations in this presentation reflect continuing operations unless otherwise noted. Cautionary Statement: This
CFO Commentary. Third Quarter. Third-quarter diluted earnings per. share increased 33% year over year; non- GAAP diluted. earnings per share
 Third Quarter CFO Commentary As reflected in our earnings release, there are a number of items that impact the comparability of our results with those in the trailing quarter and prior quarter of last
Q4 & FY 2018 RESULTS. 30 January 2019
 Q4 & FY 2018 RESULTS 30 January 2019 Safe harbor Alternative performance measures and management estimates This financial report contains a number of alternative performance measures (non-gaap figures)
Q RESULTS. Harold Goddijn CEO Taco Titulaer CFO 16 OCTOBER 2018
 Q3 2018 RESULTS Harold Goddijn CEO Taco Titulaer CFO 16 OCTOBER 2018 Operational highlights Groupe PSA selected TomTom s maps, navigation and live services for its next generation infotainment BMW Group
3 rd Quarter FY 2017 Conference Call
 3 rd Quarter FY 2017 Conference Call July 28, 2017 1 2017 Rockwell Collins. All rights reserved. Proprietary Information. Safe Harbor Statement This presentation contains statements, including statements
Q Earnings. January 25, 2017
 Q1 2017 Earnings January 25, 2017 Forward-Looking Statements and Non-GAAP Measures Forward-Looking Statements This presentation contains certain forward-looking statements within the meaning of the U.S.
EADS N.V. Unaudited Condensed Consolidated Financial Information for the year ended December 31, Year 2007 Report
 Year 2007 Report Unaudited Condensed Consolidated Financial Information of EADS N.V. for the year 2007 Unaudited Condensed IFRS Consolidated Income Statements... 2 Unaudited Condensed IFRS Consolidated
1Q 2017 Earnings Conference Call April 26, 2017
 1Q 2017 Earnings Conference Call April 26, 2017 Note: All results and expectations in this presentation reflect continuing operations unless otherwise noted. Cautionary Statement: This presentation contains
Sanford C. Bernstein Strategic Decisions Conference
 Sanford C. Bernstein Strategic Decisions Conference June, 2017 Terrence Curtin Chief Executive Officer Forward-Looking Statements and Non-GAAP Measures Forward-Looking Statements This presentation contains
aero-notes Letter to our Shareholders Dear Shareholders, Summary Number 17 June 2006 First quarter earnings 2006 (Q1) Annual results 2005
 Annual results 2005") Number 17 June 2006 aero-notes Letter to our Shareholders Dear Shareholders, On 13th June 2006 EADS announced a delay of six to seven months in the A380 production programme. The share price fell sharply
Number 17 June 2006 aero-notes Letter to our Shareholders Dear Shareholders, On 13th June 2006 EADS announced a delay of six to seven months in the A380 production programme. The share price fell sharply
Second Quarter 2017 Reconciliation of Non-GAAP Financial Measures
 Second Quarter 2017 Reconciliation of Non-GAAP Financial Measures Adjusted Operating Income Reconciliation Adjusted operating income is not a measure of financial performance under generally accepted accounting
First Quarter 2005 Report
 First Quarter 2005 Report Unaudited Condensed IFRS Consolidated Financial Information of EADS N.V. for the first quarter of 2005 Unaudited Condensed IFRS Consolidated Income Statements....... 2 Unaudited
Second Quarter Earnings Call July 26, Financial Data Charts
 Second Quarter Earnings Call July 26, 2018 Financial Data Charts This presentation consists of L3 Technologies, Inc. general capabilities and administrative information that does not contain controlled
Q Earnings. January 24, 2018
 Q1 2018 Earnings January 24, 2018 Forward-Looking Statements and Non-GAAP Measures Forward-Looking Statements This presentation contains certain forward-looking statements within the meaning of the U.S.
Q Earnings. November 2, 2016
 Q4 2016 Earnings November 2, 2016 Forward-Looking Statements and Non-GAAP Measures Forward-Looking Statements This presentation contains certain forward-looking statements within the meaning of the U.S.
Q Earnings. October 28, 2015
 Q4 2015 Earnings October 28, 2015 Forward-Looking Statements and Non-GAAP Measures Forward-Looking Statements This presentation contains certain forward-looking statements within the meaning of the U.S.
XYLEM INC. Q EARNINGS RELEASE FEBRUARY 1, 2018
 XYLEM INC. Q4 2017 EARNINGS RELEASE FEBRUARY 1, 2018 Q4 2017 EARNINGS RELEASE FORWARD-LOOKING STATEMENTS This presentation contains information that may constitute forward-looking statements. Forward-looking
Credit Suisse 5th Annual Industrials Conference Manalapan, FL. Technologies. November 29, Ralph D'Ambrosio SVP and CFO
 Credit Suisse 5th Annual Industrials Conference Manalapan, FL November 29, 2017 Ralph D'Ambrosio SVP and CFO This presentation consists of L3, Inc. general capabilities and administrative information that
Q order intake and sales 19 October 2017
 Q3 2017 order intake and sales 19 October 2017 www.thalesgroup.com Q3 order intake and sales Update on implementation of IFRS 15 standard 2017 outlook Q3 2017 highlights New London underground signaling