Aurobindo Pharma. Growth capsule. Detailed Report 18 February 2016 Sector: Healthcare
|
|
|
- Donna McBride
- 5 years ago
- Views:
Transcription
; +91 22 39825423 Growth capsule Investors are advised to refer through important disclosures made at the last page of the Research Report. Motilal Oswal research is available on www.motilaloswal.")
1 Detailed Report 18 February 2016 Sector: Healthcare Aurobindo Pharma Kumar Saurabh Amey Chalke Growth capsule Investors are advised to refer through important disclosures made at the last page of the Research Report. Motilal Oswal research is available on Bloomberg, Thomson Reuters, Factset and S&P Capital.
2 Aurobindo Pharma: Growth capsule Summary... 3 US business strong growth to sustain in medium term... 5 Regulatory concerns unwarranted; Buy on weakness European operations Actavis acquisition to provide scale ARV business Focus on high margin business APIs Ramping up capacities to meet demand Financial outlook Valuations: At significant discount to peers Aurobindo Pharma SWOT Analysis Story in charts Financials and Valuations February
 892/491 1, 6, 12 Rel. Per (%) -14/-4/42 M.Cap. (INR b)/(usd b) 390.1/5.7 Avg Val,(INR m)/vol 000 1,688/1,696 Free float (%) 46.")
 36.4 33.1 31.0 RoCE (%) 28.2 29.2 30.6 P/E (x) 24.0 19.3 15.3 P/BV (x) 7.5 5.6 4.1 Shareholding pattern (%) As On Dec-15 Sep-15 Dec-14 Promoter 53.9 53.9 54.1 DII 6.5 6.1 6.5 FII 28.8 28.")


 USD appreciation.")
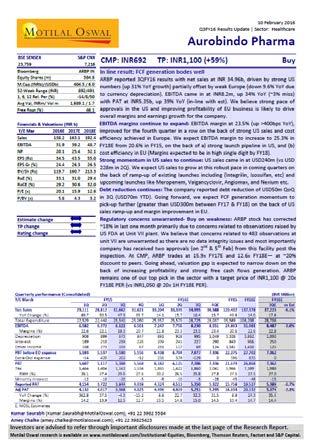
3 BSE Sensex S&P CNX 23,382 7,108 Detailed Report Aurobindo Sector: Healthcare Pharma Aurobindo Pharma CMP: INR667 TP: INR1,100(+65%) Buy Stock Info Bloomberg ARBP IN Equity Shares (m) Week Range (INR) 892/491 1, 6, 12 Rel. Per (%) -14/-4/42 M.Cap. (INR b)/(usd b) 390.1/5.7 Avg Val,(INR m)/vol 000 1,688/1,696 Free float (%) 46.1 Financial Snapshot (INR b) Y/E Mar E 2017E Net Sales EBITDA PAT EPS (INR) Gr. (%) BV/Sh (INR) RoE (%) RoCE (%) P/E (x) P/BV (x) Shareholding pattern (%) As On Dec-15 Sep-15 Dec-14 Promoter DII FII Others FII Includes depository receipts Click here for Video Link Growth capsule Rare combination of fastest growth and cheapest valuations ARBP is poised to deliver the fastest growth among Indian large cap pharma peers (27% EPS growth over FY15-18E v/s 22% for coverage universe) and is trading at attractive valuations of 15x FY17E and 12x FY18E EPS at ~20% discount to large cap peers. US business revenue is expected to more than double in three years to >INR100b (USD1.5b) in FY18 v/s ~INR47b (USD792m) in FY15, driven by (a) ramp-up of existing launches, (b) one of the largest pipeline of pending ANDAs among Indian peers in niche areas of Controlled Substances, Injectables, Penems and Peptides, and (c) USD appreciation. We believe concerns related to 483 observations at unit VII are unwarranted, as there are no data integrity issues, and most importantly, ARBP has received two approvals (on 2nd and 5th February 2016) from this facility post the inspection. We expect the valuation gap vis-à-vis peers to narrow on increasing profitability and strong free cash flow generation. ARBP remains one of our top picks in the sector. Our target price of INR1,100 (20x FY18E EPS) implies 65% upside. Our sensitivity analysis suggests significant upside in the bull case (assuming higher US sales and margins) and <10% downside in the bear case. US business to double in three years ARBP has the highest number of pending ANDAs among Indian peers (~168 pending ANDAs). It has received >30 approvals YTD FY16 v/s 3 approvals in FY15. We expect this strong approval momentum to continue, as the company has >50 pending ANDAs, which are >2.5 years old, including 168 pending ANDAs with 28 TADs till the end of August This provides us visibility of strong launch pipeline over the next months. US business revenue is expected to more than double in three years to >INR100b (USD1.5b) in FY18 v/s ~INR47b (USD792m) in FY15, driven by (a) ramp-up of existing launches, (b) strong pipeline in niche areas of Controlled Substances, Injectables, Penems and Peptides, and (c) USD appreciation. Over the next twelve months, strong growth in US sales will be driven by ramp-up of existing launches (Integrilin, Isosulfan, etc), and upcoming launches like Meropenem, Valgancyclovir, Angiomax, Nexium, etc. Improving business mix to boost margins; expect 27% EPS CAGR over FY15-18 Large exposure to API business and low margin ARV products kept ARBP s base business margins at sub-20% levels till FY15. We expect EBITDA margins to expand to >25% by FY18, driven by improved scale of operations (driving operating leverage) and scale-up of high margin US launches (Injectibles, Penems, etc). 18 February
.")
4 Stock Performance (1-year) We expect ARBP s net profit to expand at 27% CAGR over FY15-18, mainly led by strong operating performance (24% EBITDA CAGR) and increasing financial leverage. High FCF generation + declining capex = lower debt ARBP has not been able to generate significant cash flows till FY15 (because of lower margins and geographic / technological expansions). This trend is likely to change, going forward, as the investments start generating returns. In 9MFY16, ARBP generated ~USD70m of FCF (~USD50m in 3Q). We expect FCF generation of ~USD400m by FY18, which would help reduce leverage from 0.7x currently to 0.1x by FY18. Capex is expected to come down from FY18, as the 5 greenfield facilities and 3 brownfield facilities get commissioned by FY17. Consequently, RoCE is likely to improve to >30% by FY18. Regulatory concerns unwarranted; Buy on weakness The stock has corrected ~18% in the last one month, primarily due to concerns related to (1) observations raised by USFDA at unit VII plant, (2) charge sheet by Enforcement Directorate (ED), and (3) weak macro fundamentals. We believe that concerns related to 483 observations at unit VII are unwarranted, as there are no data integrity issues, and most importantly, the company has received two approvals (on 2nd and 5th February 2016) from this facility post the inspection. Unlike most other large cap peers (Sun Pharma, Dr Reddy s and Cadila), ARBP has no facilities under regulatory enforcement at this point in time. Given that ARBP s key plants have been successfully inspected (we believe issues at unit VII are non-concerning) by USFDA in the last one year, it provides comfort around stable business outlook. The ED charge sheet was filed in a four year old case. ARBP has categorically mentioned that liability from this case at company level is insignificant (~INR130m). However, promoters are directly involved in this matter. Trades at significant discount to peers; Buy ARBP trades at 15x FY17E and 12x FY18E EPS, at ~20% discount to large cap peers. Strong US ramp-up, improvement in margins coupled with FCF generation, and continuous decline in debt would help multiples expand in the medium term. We expect the valuation gap vis-à-vis peers to narrow on the back of increasing profitability and strong free cash flow generation. ARBP remains one of our top picks in the sector. Our target price of INR1,100 (20x FY18E EPS) implies 65% upside. Our sensitivity analysis suggests significant upside in the bull case (assuming higher US sales and margins) and <10% downside in the bear case. Risks: USFDA inspection is an ongoing (but critical) business risk, as every quarter 1-2 facilities are being inspected. 18 February


5 US business strong growth to sustain in medium term ARBP's US business is likely to double in three years to INR102b, driven by burst of ANDA approvals and increasing contribution of complex generic products in US sales. ARBP has 168 products pending at USFDA, of which more than 50 are Injectables. It will also be launching products in the Control Substances, Penems, Depo Injections and Peptides categories. ARBP has been traditionally strong in Beta Lactum products, with significant presence in Semi-synthetic Penicillins and Cephalosporins. However, in the last few years, it has developed a robust ANDA pipeline of 168 products (largest among Indian peers), with a fair mix of niche complex generics like Injectables, Controlled Substances, Penems, Peptides and plain vanilla generics. These niche segments are technically complex to commercialize/develop and also have entry barriers in terms of dedicated facility required (and gestation period). Consequently, competition is likely to be much lower and profitability per product higher. ARBP s low cost operating structure and vertical integration across most products (~90%) have also added to its competitiveness. Moreover, it has forayed into US OTC business with US-based subsidiary called Aurohealth and Natrol Franchise. Exhibit 1: US business US formulations (INR b) YoY growth (%) (0.5) FY10 FY11 FY12 FY13 FY14 FY15 FY16E FY17E FY18E US business to grow at a CAGR of 30%+ over FY15-18E Over FY10-15, ARBP delivered robust 42% CAGR on the back of niche oral launches (including Cymbalta), entry into Injectables, Controlled Substances and Government Tender business. Despite a strong growth phase in the last five years, we believe ARBP is well poised to maintain this growth momentum for the next few years. We expect US business to grow at a CAGR of ~30% over FY15 18 (Injectables portfolio to grow at 44%). Consequently, the contribution of US sales is expected to increase from ~38% in FY15 to ~52% in FY February
6 Exhibit 2: US sales break-up FY15 (USD m) Rx business Injectables Natrol OTC FY18E (USD m) Exhibit 3: Aurobindo s US business is divided into four key verticals Aurobindo Orals (~85% of sales) Controlled substances (~6% of US sales) Injectable business (~8% of US sales) AuroHealth Natrol Oral products Accounts for >80% of US sales 135+ pending ANDAs Primarily institutional business 7 product approvals till date 9 ANDAs pending (USD 3b) ARBP has 3 Manfacturing facilities First approval recieved in FY products approval till date 60+ pending ANDAs Deals with OTC and Nutraceutical business Revenue generation to start from FY16 Acquired this brand in FY15. FY15 sales include only 4 month sales (~USD30m) To grow at 20%+ CAGR Exhibit 4: US revenue split of USD790m (FY15) Aurohealth Natrol Aurolife (Rx 0% 4% and Controlled Substances) 24% Auromedics (Injectables ) 9% Aurobindo USA (Oral products) 63% Exhibit 5: US revenue split of USD1.5b (FY18E) Aurolife (Controlled Substances) 28% Aurohealth 4% Auromedics (Injectables) 12% Natrol 8% Aurobindo USA (Oral products) 48% 18 February
7 Largest product pipeline among peers New product launches and the quality of the products approved remain the key drivers for growth in the US generics space. The product pipeline in the US looks robust, as ARBP has the largest pipeline of pending ANDAs, including a rich mix of Oral, Injectables and Controlled Substances. Exhibit 6: Robust ANDA pipeline Exhibit 7: Highest pending ANDAs among peers ANDA filed ANDAs pending ANDA Filed ANDA Pending FY10 FY11 FY12 FY13 FY14 YTD Exhibit 8: Classification of filed products Injectables and Ophthalmic 4% Cephalospo rin & SSP 15% Penem 0% Non Betalectam 81% ARBP ALPM CDH GNP IPCA LPC SUNP Exhibit 9: Classification of pending products Injectables and Ophthalmic 32% Cephalospo rin & SSP 1% Penem 1% Non Betalectam 66% Burst of approvals provide strong visibility of future growth In the first 9 months of FY16, ARBP has received 35 approvals from USFDA, which could add USD130m-150m to annual sales. The number of approvals received in FY16 is already more than double the number received in the whole of FY15 and FY14 put together (~13 approvals). The approvals are a mix of plain vanilla generics, limited competition Injectables and complex Oral generics. We believe product approvals like Suprax, Evista, Dilantin and Baraclude could add USD20m-30m each to US annual sales, going forward. Given that out of the pending Injectable portfolio of >50 pending ANDAs, most were filed in FY12 and FY13, we expect multiple Injectable approvals to come through in the next two years. 18 February
8 Exhibit 10: ANDA approvals picking up in FY16 ANDA approvals FY05 FY06 FY07 FY08 FY09 FY10 FY11 FY12 FY13 FY14 FY15 YTD Exhibit 11: List of ARBPs approved products in US market in FY16 (YTD) Brand Name Drug Name Size Launch/ (USD m) approval date Integrilin Eptifibatide Inj 31 Dec-15 Plan B One-Step Levonorgestrel Tab 64 Dec-15 Dexamethasone Sodium Phosphate 31 Dec-15 Actonel Risedronate Sodium Tab 113 Dec-15 Imodium Loperamide Hydrochloride 10 Dec-15 Solu-Medrol Methylprednisolone Sodium Succinate 102 Dec-15 Patanol Olopatadine Hydrochloride 235 Dec-15 Pepcid Famotidine Tab 29 Dec-15 Revatio Sildenafil Citrate Tab 80 Nov-15 Ultram ER Tramadol Hydrochloride tablets <100 Oct-15 Namenda Memantine Hydrochloride tablets 1230 Oct-15 Abilify Aripiprazole Tablets 7300 Oct-15 Micardis Telmisartan 92 Sep-15 Lopid Gemfibrozil 35 Sep-15 Evista Raloxifene Hydrochloride 404 Aug-15 Baraclude Entecavir 291 Aug-15 Prilosec DR Omeprazole DR 442 Aug-15 Boniva Ibandronate Injection 15 Aug-15 Xanax Alprazolam 58 Aug-15 Methadose Methadone Hydrochloride NA Aug-15 Cetrizine Hydrochloride (OTC product) NA Aug-15 Brevibloc Esmolol HCL Injection 6 Jul-15 Tambocor Flecainide Acetate 61 Jul-15 Zithromax Azithromycin Injection 135 Jun-15 Comtan Entacapone 59 Jun-15 Dilantin Phenytoin Sodium 125 Jun-15 Flagy Metronidazole 58 May-15 Suprax Cefixime 80 Apr-15 Atracurium Atracurium Besylate Injection 10 Apr-15 Revatio Sildenafil Injection 10 Apr February
9 Exhibit 12: Break-up of US sales FY15 Incremental sales from already launched products Products approved but yet to launch Injectables More than 35 products to be launched FY17E Injectables next leg of growth US Injectables market low on competition and high on profitability: The US is the largest market for Generic Sterile Injectables, with a market size of ~USD7b in 2013 and is expected to reach ~USD10b by Injectables are a specialized and niche area within the pharmaceuticals industry due to the high complexity involved in formulating a large and complex product portfolio across various therapies based on multiple technology platforms and delivery mechanisms. High entry barriers keep competition away: Limited FDA-approved capacities, capital intensive facilities with long timelines to set up, changes in regulations (autohandling is now mandatory in the EU), and manufacturing complexities make Injectables a limited pricing pressure opportunity. The customer segment is almost exclusively hospitals, with a distinct decision-making process and criteria. This has resulted in very few generic players. Exhibit 13: Generic injectable market to expand over next years (USD b) February
10 Injectables remain key growth driver for ARBP: ARBP received its first Injectables approval in late FY12 for a product called Ceftazidime. Since then, it has received 10 product approvals in the Injectables space. The current pending filings stand at 48. ARBP has received target action date (TAD) for 27 products till August It has already received 13 Injectable approvals in FY16. We expect another Injectable approvals over the next 12 months. Besides, it will continue to benefit from the shortages in already existing products like Lidocaine and Bupivacaine (earlier benefited from shortage of Piperacillin Tazobactam also). We believe Injectables will be one of the key contributors to ARBP s US sales going forward and expect this segment to grow at a CAGR of 44% over FY Exhibit 14: Injectable portfolio to be key driver Injectable revenues (INR m) % YoY growth 12,580 1, ,710 5,940 4,216 2, FY12 FY13 FY14 FY15 FY16 FY17 FY18 Exhibit 15: Approved injectable portfolio in the US Anti-nausea 9% Others 23% Anti-biotics 45% Anaesthetic s 23% Building capabilities in niche areas within Injectables space: ARBP has dedicated facilities for Semi-synthetic Penicillins (SSPs), Penems and non-betalactam liquid Injectable products. Of 25 approved Injectable products, 10 are SSP-based approved Injectables, while the rest are a mix of plain vanilla Injectables and products under drug shortage list (including Lidocaine and Bupivacaine). ARBP s pipeline of Injectable ANDAs includes 2 Penems filings, 10 Ophthal, and few complex Injectables (like Fondaparinux). ARBP is also working on building capabilities in the niche areas of (1) Hormones / Steroids, (2) Oncology, (3) Liposomes / Microspeheres, and (4) addition to Penems / Opthalmic portfolio. Controlled Substances and Institutional Business in the US ARBP supplies Controlled Substances in the US market through its Aurolife subsidiary in the US. It has decided to establish a foothold in this market due to limited competition and high barriers to entry. For this, ARBP has set up a manufacturing facility in the US through a US-based subsidiary, Aurolife Inc. It currently has 7 approved products and generated revenue of >USD50m in FY15 from this vertical. The current ANDA pipeline of 9 Control Substances has market potential of at least USD500m. Revenue from Controlled Substances is expected to grow at a CAGR of 20% over FY The Federal VA awards, which drove revenues in FY14 and FY15, will continue to do so, as the tenure is five years. USD15m-20m of reasonably stable revenue stream can be expected from these awards in FY15. Oxycodone with Acetaminophen, Dextroamphetamine, and the Dextromphetamine combination salt are few of the key products in this segment. 18 February
11 Penems ARBP has also developed and made Penem filings for four products in the Injectables portfolio. The company is selecting difficult-to-make products and has set up a facility under brand AuroNext in Bhiwandi to manufacture high-end Penems. The company has also made a strategic acquisition of Silicon Life Sciences in FY14 (for INR116m) for backward integration into manufacturing APIs for Penems. The company has already filed two Penems with USFDA and is expected to receive approval for Meropenem in the near term. The total market size of these Penem filings is expected to be around USD200m in the US. ARBP is also expected to file for Ertapenem in FY17. Peptides Peptides is a fast growing industry and ARBP is likely to emerge as a strong player, with plans to file more than 30 Peptides, going forward. Currently, only 1-2 players are manufacturing these products. The company has set up a subsidiary called Auro Peptide and has already filed two DMFs and is expected to file one more in 4QFY16. Prior to the US, it will launch these products in emerging markets and Europe. The commercializing is likely to start from CY16. Currently, ARBP is developing four Microsphere and Liposomal Injectable products for which filing can start from FY17. The addressable market for these products is about USD3b. Specialty Drugs (Oncology & Hormones) As per IMS, Oncology is among the largest therapy segments in developed markets (USD70b-80b by FY18). Hormones are also going to be one of the fastest growing therapies over the next few years. In FY14, ARBP acquired 60% stake in Eugia, which develops and markets niche Hormonal and Oncology generic formulations for the regulated markets. ARBP has completed first exhibit batches for three Hormone products, with filing expected in FY16. It is also working on 15 Oncology products and plans to prepare exhibit batches for Oncology Injectables from FY16. Nutraceuticals As per GIA, the global Nutraceuticals market is expected to exceed USD263b by 2020, growing at a CAGR of 8%. ARBP is exploring this market and R&D facilities have been initiated to identify and develop synthetic Nutraceutical products. During , process development work to manufacture a few products has been completed. 18 February
12 Exhibit 16: Pending approvals Molecule Brand Sales (USD m) Potential Esomeprazole Nexium 2,272 FY17 Palonosetron Aloxi 450 FY17 Emtricitabine Emtriva 25 FY17 Rosuvastatin Crestor 3,164 FY17 Paricalcitol Zemplar 300 FY17 Dexmedetomidine Precedex 150 FY17 Abacavir + lamivudine Epzicom 490 FY17 Ritonavir Norvir 500 FY17 Tenofovir Disporoxil Viread 570 FY18 Emtricitabine + tenofovir Truvada 2,000 FY18 Atomoxetine Strattera 384 FY18 Atazanavir Reyataz 769 FY18 Tygecycline Tygacil 132 FY18 Bivalirudin Angiomax 450 FY20 Moxifloxacin Vigamox 266 FY20 Saxagliptin Onglyza 426 FY23 Saxagliptin+metformin Kombiglyze XR 165 FY23 Gatifloxacin Zymaxid 65 Unknown Pitavastatin Livalo 100 Unknown Prasugrel Effient 377 Unknown Minocycline Solodyn 370 Unknown Dalfampridine Ampyra 235 Unknown Efavirenz Sustiva 178 Unknown Dextromethorphan HBr+Guaifenesin Mucinex DM 90 Unknown Doribax Doripenem 10 Unknown Esomeprazole Nexium 2,272 FY17 Palonosetron Aloxi 450 FY17 Source Company, MOSL 18 February
13 Regulatory concerns unwarranted; Buy on weakness The stock has corrected ~18% in the last one month, primarily due to concerns related to (1) observations raised by USFDA at unit VII plant, (2) charge sheet by ED (Enforcement directorate), and (3) weak macro fundamentals. We believe that concerns related to 483 observations at unit VII are unwarranted, as there are no data integrity issues, and most importantly, the company has received two approvals (on 2nd and 5th February 2016) from this facility post the inspection. Unlike most other large cap peers (Sun Pharma, Dr Reddy s and Cadila), ARBP has no critical regulatory issues at this point in time. Given that ARBP s key plants have been successfully inspected (we believe issues at unit VII are nonconcerning) by USFDA in the last one year, it provides comfort around stable business outlook. The ED charge sheet was filed in a four year old case. ARBP has categorically mentioned that liability from this case at company level is insignificant (~INR130m). However, promoters are directly involved in this matter. Increase in regulatory scrutiny a concern- to benefit the sector in long term Inspection rate by US FDA outside US has increased by >75% over last 5 years What has led to this increase: Inspection rate outside US was at ~2-3 years vs ~1 year in US. US FDA is planning to bridge this gap. Increase in regulatory fees has helped FDA to invest more on quality control and increase inspection rate. Surprise visits by USFDA (unlike before) has led to increase in adverse results. Though it seems that inspection rate has increased it is in line with the asset share India accounts for ~40% of US FDA compliant facilities (outside US) and inspection rate share for India was at ~35% in recent past. 18 February
14 Exhibit 17: India's share of inspection rate in line with facility share (%) Exhibit 18: Equal % of warning letter issued to facilities in US and outside US (%) 40 6% 35 5% India's share of US FDA approved facilties outside US (%) India's share of inspection rate (%) Rate of warning letter issuance for US (%) Non-US facilties (%) 483 observations common but escalation of it is uncommon Recent history suggests that 483s observations comes at more than 70% of inspections which happen However this does not mean that every 483 observation will escalate to warning letters/ import alerts Rate of 483 observations getting converted into warning letter/ import alerts remains in low single digits Nature of 483 observations is key to assess the probability of it getting converted into warning letter- Data integrity issues etc. Exhibit 19: FDA inspections in last 7 years SUNP LPC DRRD ARBP CDH GNP TRP IPCA No of inspection issued % of 483 issued Warning Letter Import alert February
15 Exhibit 20: US FDA approved facilities status for key companies FDF API Both Total Under enforcement Pending 483s SUNP LPC DRRD CIPLA ARBP GNP CDH TRP IPCA Exhibit 21: Past warning letters to Indian companies Company Facility Issue Date of inspection Date of letter Time Gap (days) Resolution Date Time Cadila Healthcare Moraiya Warning Letter 9/5/ /23/ Not closed Gap (days) Cadila Healthcare Ahmedabad Warning Letter 12/6/ /23/ Not closed Sun Pharma Halol Warning Letter 9/16/ /17/ Not closed Dr. Reddy's Duvvada Warning Letter 3/6/ /15/ Not closed Dr. Reddy's Miryalguda Warning Letter 1/31/ /15/ Not closed Dr. Reddy's Srikakulam Warning Letter 11/27/ /15/ Not closed Cadila Healthcare Moraiya Warning Letter 2/3/2011 6/21/ /11/ Lupin Mandideep Warning Letter 11/12/2008 5/7/ /20/ Ranbaxy Dewas Warning Letter 2/12/2008 9/16/ Not closed Ranbaxy Paonta Sahib Warning Letter 3/7/2008 9/16/ Not closed Strides Agila Warning Letter 6/27/2013 9/9/ Not closed Sun Pharma Karkhadi Warning Letter 11/16/2013 5/7/ Not closed Sun Pharma Cranbury Warning Letter 4/28/2010 8/25/ /19/ Wockhardt Chikalthana Warning Letter 7/31/ /25/ Not closed Wockhardt Waluj Warning Letter 3/22/2013 7/18/ Not closed Aurobindo Unit III Warning Letter 9/24/2010 5/20/ Not closed Aurobindo Unit VI Warning Letter 12/22/2010 5/20/ /4/ February
16 One of the strongest manufacturing capabilities ARBP currently has 7 USFDA approved formulations facilities (including 2 Injectables, 1 Controlled Substance, and 1 Nutraceutical formulation facility). Apart from this, it has 8 formulations facilities under construction (including 1 Penems, 1 dedicated Oncology & Hormones, and 1 Injectable). 4-5 of these yet-to-be-operational facilities will supply formulations to the US market. It also has 6 USFDA approved API facilities, which supply Cephalosporin, Peptides, Penems and ARVs. Exhibit 22: Aurobindo- Unitwise product portfolio in US Unit Products Form Filed Approved Under review Unit 3 NPNC Oral Unit 4 NPNC Injectable Unit 6B Cephs Oral Unit 7 NPNC Oral Unit 12 SSP Oral & injectable AuroLife NPNC Oral AuroNext Penem Injectable Total Exhibit 23: US FDA approved formulations facilities Site Name Product Capabilities Location Unit III Non antibiotics, ARVs / orals India Unit IV Injectables (Non-antibiotics) India Unit VI B Cephalosporin / orals India Unit VII Non antibiotics, ARVs / orals India Unit XII Antibiotics, injectables, orals India Natrol Nutraceuticals US AuroLife Non antibiotic & controlled substances US Other formulations facilities AuroNext Penem formulations India Brazil Unit Antibiotics Brazil Eugia^ Oncology & hormones India AuroHealth^ Pharma OTC / Orals and Liquids US Unit X^ Non antibiotics, solid orals India Unit XV^ Non antibiotics, solid & liquid orals India Unit XVI^ Antibiotics, injectables India APL Healthcare^ Pharma OTC, solid orals India 18 February
17 European operations Actavis acquisition to provide scale ARBP has expanded its Europe business inorganically. Till date, it has acquired three businesses in Europe Milopharm in 2006, Pharmacin in 2007 and Actavis in European business sales grew four fold in FY15 to INR31.9b on the back of the acquisition of Actavis Europe business. As a result, Europe sales contribution has also increased from 8% in FY14 to 26% in FY15. Actavis business was making substantial losses when it was acquired by ARBP in However, the shift in manufacturing location from Europe to India is likely to bring substantial cost savings. ARBP has site transferred 28 products to its Indian facility and has achieved EBITDA breakeven in the EU region. Exhibit 24: EU growth bolstered by Actavis buy Base EU business (INR b) Actavis assets (INR b) YoY growth (%) FY12 FY13 FY14 FY15E FY16E FY17E FY18E Benefits of Actavis business Currently, Actavis business is spread over 7 countries in Europe France, Germany, Netherlands, United Kingdom, Spain, Italy, and Portugal. It is one of the leading Indian companies, with strong generics footprint in Europe. With this acquisition, ARBP has expanded its product lines and distribution network. It also includes 1,250 dossier license rights and another 200 drugs are in the pipeline. ARBP is likely to provide low cost high quality APIs that will lower COGS significantly. ARBP also has large presence in Injectables, which could be leverage to improve profitability in Europe. This acquisition would also give an opportunity to enter into institutional (Hospital) market in Europe. ARBP will strengthen its position in key therapy areas like CNS, Anti-infectives and Digestives post this acquisition. Cost optimization to help create value in European business Actavis generic Europe business had reported 8% loss of sales in CY13. By cost optimization efforts, ARBP is on track to achieve PAT breakeven by FY16 and higher single-digit margins in next two years. Currently, ARBP sources most of its products from Actavis manufacturing facilities. However, it plans to expand 50% of its portfolio to India. Till 3QFY16, it has 18 February
18 transferred 28 products to Indian facilities. Once the greenfield facility to supply to Europe is ready, the site transfer process would pick up. Acquisition to provide access to institutional business Till now, ARBP did not have presence in Hospital sales across Europe. With this acquisition, 25% of the sales channels comprise of Hospital sales. ARBP can leverage this sales channel months down the line to market its growing Injectables portfolio. Further down the line, its high value products like Penems from Auronext and Hormones from Eugia can be launched in Europe through these established channels. Exhibit 25: Wide product portfolio acquired Exhibit 26: expanding access to newer channels 44 Products Sales contribution (%) 34 Hospitals 25% OTC 2% 22 Branded Generics 9% Generics 48% France Germany Others Tender 16% 18 February
19 ARV business Focus on high margin business ARV business grew 15% in FY15 to INR9.7b, driven by improving traction in tenders. The company provides cost effective generic version of >43 ARV products catering to more than 100 countries and 2m HIV patients. ARBP plans to focus on high value triple combination products. WHO recently included Tenofovir Triples as First Line Treatment (FLT). Currently, out of USD1b Tenfovir Triples market, ARBP s share is only 4%. Exhibit 27: ARV business 61.2 ARV business (INR b) YoY growth (%) (4.6) ,783 2,875 4,044 4,642 4,953 6,936 7,866 7,503 8,402 9,639 FY06 FY07 FY08 FY09 FY10 FY11 FY12 FY13 FY14 FY15 Dolutegravir (DTG) The Next Growth Driver ARBP is the first generic company to sign license with ViiV Healthcare for the next generation Integrase Inhibitor DTG Filed an ANDA application for DTG 50mg with USFDA under the PEPFAR program. WHO announced this drug as a 1st line reserve drug in its 2015 HIV treatment guidelines. Play a collaborative role in upgrading millions of patients to the latest best in class ARV drug. Developing a Triple drug combination containing DTG. Market size is expected to be USD2b in 2017; Triple combination drug containing DTG expected to garner major share. Key ARV products: 1. Efavirenz + Lamivudine + Tenofovir 2. Lamivudine + Zidovudine Tabs 3. Abacavir Sulfate Tabs 4. Lopinavir + Ritonavir Tabs 5. Efavirenz + Emtricitabine + Tenofovir Tabs 6. Zidovudine + Lamivudine + Nevirapine Tabs 18 February
20 APIs Ramping up capacities to meet demand API sales declined 6% in FY15 to INR27b, impacted by shift in focus to formulations and growing captive consumption. Broadly, API business is divided into three categories SSPs, Cephalosporin and non-betalactum. SSP sales declined 12% to INR8.6b while Cephalosporin sales grew 6% to INR9.3b. Non-Betalactum sales declined 10% to INR9.1b, affected by weaker traction in ARV tenders in FY15. Slowdown in growth is due to increasing pricing pressures and strategy to stay out of low margin products. This focus is clearly visible from the uptick in the share of non-betalactum products from 17% in FY09 to 34% in FY15. Going ahead, the ARV segment would be the key driver of API business that will drive profitability and revenue growth. However, we expect overall API business contribution to decline from 22% in FY15 to 16% in FY18. Exhibit 28: API mix shifting toward high-margin products SSPs Ceph ARV & others FY FY FY FY FY FY FY Exhibit 29: API filings US FDA EU DMF CoS RoW FY08 FY09 FY10 FY11 FY12 FY13 FY14 YTD Exhibit 30: Declining contribution of API Formulations (INR b) API (INR b) FY09 FY10 FY11 FY12 FY13 FY14 FY15 FY16E FY17E 18 February
21 Financial outlook We forecast ARBP s core earnings to grow at 27% CAGR over FY15-18, primarily led by improved business mix (high margin formulations), financial leverage and turnaround of acquired EU business. We expect revenue to grow at 17% CAGR and expect EBITDA margins to expand cumulatively by 370bp over FY15-18 (to 25.3%). We expect moderation in capex (INR6b-7b annually) to aid cash flow generation and deleveraging, driving financial leverage. US to lead revenue growth We expect ARBP s revenues to grow at 17% CAGR over FY15-18, on a high base (gcymbalta). Key growth drivers are likely to be (a) scale-up of niche products in US (30% CAGR, 38% of sales), (b) steady growth in EU business (3% CAGR, 27% of sales), and (c) triple dose combination products driving growth in ARV segment (20% CAGR, 8% of sales). Improving business mix to boost margins; expect 27% EPS CAGR over FY15-18 Large exposure to API business and low margin ARV products has kept ARBP s base business margins at sub-20% levels over the last four years. We expect EBITDA margins to improve cumulatively by 370bp over FY15-18, driven by improved scale of operations (driving operating leverage) and scale-up of high margin US launches (Injectibles, Penems, etc). We expect ARBP s net profit to grow at 27% CAGR over FY15-18, mainly led by strong operating performance (24% EBITDA CAGR) and increasing financial leverage. Exhibit 31: Forecast 27% EPS CAGR Exhibit 32: Break-up of EPS growth (FY15E-18E) EPS (INR) 56 % 27 % 17 % FY10 FY11 FY12 FY13 FY14 FY15 FY16E FY17E FY18E EPS (FY15) Sales Growth Margin expn Financial EPS (FY18E) Leverage Despite high capex, ARBP to generate substantial cash flows High capex outlay over the years has resulted in suboptimal return ratios. We expect capex outlay to stay at least at INR10b for the next few years. However, stable working capital requirement (post integration of EU operations) and improving margin profile would result in better free cash generation. Over FY15-18, we expect ARBP to generate INR25b free cash flows, which would help reduce leverage from 0.7x to 0.2x by FY18. Consequently, RoCE is likely to improve from 28% (FY15E) to 31% by FY February
22 Exhibit 33: Capex plans Brownfield Expansions Dedictaed block for Lypholized vials at Unit IV Finished dosages blocks at Unit VII New API blocks at Unit XI Substantial capacity expansion at Aurolife Greenfield Expansions Oral solid facility at naidupet Special product facility at Eugia Finished dosage facility for European markets New formulation development center in USA Source: Company, Mosl Exhibit 34: Capex to remain elevated Exhibit 35: Asset turnover to improve 4 Capex (INR b) Gross Block (INR b) Asset turnover (x) FY10 FY11 FY12 FY13 FY14 FY15 FY16E FY17E FY18E FY10 FY11 FY12 FY13 FY14 FY15 FY16E FY17E FY18E Exhibit 36: Improving free cashflows 1.9 Free cashflow (INR m) D/E (x) FY09 FY10 FY11 FY12 FY13 FY14 FY15 FY16E FY17E FY18E 18 February
 significant improvement in operating performance post clearance of USFDA import alert, and (b) ramp-up in US launches, including high margin gcymbalta.")
23 Valuations: At significant discount to peers ARBP has outperformed most of its peers in Indian Pharma over the last 12 months. This has been driven by (a) significant improvement in operating performance post clearance of USFDA import alert, and (b) ramp-up in US launches, including high margin gcymbalta. With its recent acquisitions in the EU (Actavis assets) and the US (Natrol), the share of high margin formulations in total revenues has increased to ~80% (v/s 54% in FY10), positioning it among large cap formulations players. Our target price of INR1,100 discounts ARBP s FY18E EPS at 20x. The stock is currently trading at a premium to its 3-year average P/E multiple, which is justified, given stronger business profile and earnings outlook. It quotes at 10% discount to the sector average target P/E multiple, factoring higher leverage and potential execution-related risks. Current valuations imply a PEG of 0.66x (FY15-18E EPS CAGR of 27%). We believe re-rating of the stock from a single-digit P/E multiple to current levels partly factors transition to a formulations player, improved execution in the US, and moderation in leverage (from 1.2x D/E in FY10 to 0.7x in FY15). However, current valuations at 15.9x FY17E and 12.6x FY18E EPS are still at 30-35% discount to the sector average, which is unjustified in our view. Further re-rating is imminent, given: Strong EPS outlook expect 27% CAGR over FY15-18, backed by 17% revenue CAGR Strong free cash flow generation of INR28b over FY15-18 Deleveraging of balance sheet expect D/E to improve to 0.2x by FY18 from 0.7x now Key catalysts to drive stock performance over the medium term Improvement in EU profitability (30% of business), led by deeper penetration in existing markets and site transfer to India Launch of high margin products in the US, including Injectables (25+ launches over next 18 months), Controlled Substances, etc. Focus on high margin triple combination ARV products in Africa (from FY16E) Risks to our investment assumptions Regulatory risks could lead to stoppage of supplies to the US and Europe. ARBP has filed large number ANDAs from its unit VII facility in Hyderabad. During the last USFDA inspection, it had received four 483 observations, EIR is still awaited. There is ongoing litigation, involving ARBP s senior management in the Hyderabad court. Delay in cost rationalization efforts in the EU business could lead to lower than expected earnings growth. Deferral of key approvals in the US. 18 February
24 Valuation gap to narrow ARBP trades at 15x FY17E and 12x FY18E EPS, at 30-35% discount to large cap peers. We expect the valuation gap to narrow on the back of increasing profitability and strong free cash flows. Though ARBP is largely into generics business, a substantial part of its business still comes from mature products that generate sustainable cash flows. The risk that ARBP will face heavy competition in these products over the foreseeable future is low. Besides that, business fundamentals are also improving. ARBP has started generating FCF and leverage has declined by ~USD70m YTD (to USD610m). Net debt/equity has come down to ~0.5x at as the end of 3QFY16 from ~1.3x in FY13 (despite increase in capex, acquisition of EU business and Natrol), primarily due to strong profitability growth (PAT growth of 72% over FY13-16E). Substantial improvement in monetizing ANDA pipeline has also increased the confidence on the company s execution skills. We believe strong earnings delivery and sharp reduction in leverage would merit a re-look at the valuation gap with peers; further re-rating is imminent. We value the stock at INR1,100 (20x FY18E EPS). Exhibit 37: Compendium Company CMP TP FY16E FY17E FY18E FY16E FY17E FY18E FY16E FY17E FY18E Rating (INR) (INR) EPS (INR) P/E (x) EV/EBITDA (x) SUNP Buy LPC 1,730 2,250 Buy DRRD 2,961 3,300 Neutral CIPLA Neutral ARBP 667 1,100 Buy CDH Buy GNP Neutral TRP 1,322 1,800 Neutral ALKEM 1,320 1,750 Buy ALPM Neutral IPCA Neutral Exhibit 38: P/E bands (trading at 1 Std to its LPA P/E) 1250 Exhibit 39: P/E bands (trading at 18x) x 18x 12x 6x Std +2 Std +1 Mean Std -1 Apr-06 Apr-07 Apr-08 Apr-09 Apr-10 Apr-11 Apr-12 Apr-13 Apr-14 Apr-15 Apr-04 Apr-05 Apr-06 Apr-07 Apr-08 Apr-09 Apr-10 Apr-11 Apr-12 Apr-13 Apr-14 Apr February
25 Exhibit 40: Relative to healthcare (%) 250 Aurobindo Pharma PE Relative to Healthcare PE (%) Feb-06 May-07 Aug-08 Nov-09 Feb-11 May-12 Aug-13 Nov-14 Feb February
26 Sensitivity analysis Upside potential outweighs downside risk Exhibit 41: Scenario analysis suggests >100% upside in bull case vs <10% downside in bear case FY18E EPS Target Assumptions (INR) Multiple (x) TP (INR) Upside/ (Downside) Base Case USD1,550m of US sales in FY18E ,100 75% EU EBITDA margins of ~5% in base case in FY18E Bull Case USD100m of additional sales in US ,350 >100% EU EBITDA margins of ~10% vs 5% in base case Bear Case USD250m of lower sales in US & ROW % EU EBITDA margins of ~0% vs 5% in base case Bull case suggests >100% upside from current levels Our sensitivity analysis suggests that in the bull case, ARBP could generate EPS of ~INR65 (v/s INR57.5 in base case). Valuing ARBP at 22x forward earnings (in line with peers v/s 20x in base case 10% discount to peers) yields a fair value of INR1,425 (v/s TP of INR1,150), implying upside of >75% from CMP. Faster than expected ramp-up of US business: We have assumed US business sales for ARBP to almost double to ~USD1500m in FY18 (v/s USD792m in FY15) in our base case. However, approvals in niche segments, including Penems, Peptides, and Hormonal & Oncology Injectables could help add US sales of ~USD100m in FY18. We have also assumed EBITDA margin of 35-40% on incremental US sales of USD100m in bull case scenario (v/s ~30% in base case). Vertical integration benefits in EU could surprise positively: Site transfer of products to India should lead to margin expansion. Currently, we have assumed EBITDA margins of ~5% in FY18 from EU region. Cost optimization coupled with vertical integration benefits could lead to margin of 10% in EU market (ARBP expects margins from this region to be in low double digits in medium term). Valuation multiples in line with peers rather than at discount: In our base case, we have assumed target multiple of ~20x (10-15% discount to peers). EPS growth of ~28% coupled strong FCF generation and improvement in return ratios should allow ARBP to trade at par with large cap peers at 22x. Exhibit 42: Triggers for bull case- US ramp up coupled with margin improvement in EU and multiple re-rating TP- Base case Better ramp-up in US Faster vertical intergartion benefits in EU Valuations (vs 20x) TP- Bull case 18 February
27 Bear case analysis indicates limited downside from current levels Our bear case sensitivity analysis shows that ARBP could generate EPS of ~INR47 (v/s INR57.5 in base case). Valuing ARBP at 15x forward earnings (25-30% discount to peers v/s 20x in base case 10% discount to peers) yields a fair value of INR580 (v/s TP of INR1,100), implying downside of <10% from CMP. Slower ramp-up in US and ROW markets: We have assumed US business sales for ARBP to almost double to ~USD1,500m in FY18 (v/s USD792m in FY15) in our base case. However, slower than expected approval rate coupled with increase in competition could lead to lower sales. Also, we have assumed revenues to grow in high teens in the years ahead. In the bear case, we have lowered our FY18E revenues by ~USD250m on the back of slower ramp-up in the US and ROW markets. Status quo remains in EU business: Though there is a very high likelihood of margin improvement in EU markets, in the bear case scenario, we have assumed that cost will remain high and the company will continue to generate zero operating profit in this market. This could happen only if the site transfer plan does not result in cost benefit (which should be the ideal case). Valuation multiples discount to broaden to 25-30% discount to peers: In this case, we have assumed target multiple at ~15x v/s ~20x in the base case. This could happen if macro factors become progressively worse or there is a question mark on the company s growth outlook. Exhibit 43: Triggers for bear case- Slow ramp-up in US & ROW coupled status quo in EU and multiple downgrade TP- Base case Muted growth in US (USD250m less in FY18E) Staus quo in EU Valuations (vs 20x) TP- Bull case 18 February
.")
28 AUROBINDO PHARMA SWOT Analysis Vertically integrated business model One of the largest ANDA pipelines in US: ARBP has one of the largest pending ANDA pipelines of >165 in the US market Lower dependence on large products provides stability to base business (largest product accounts for <5% of sales). To generate ~USD950m of US sales in FY16, with lowest R&D in the industry No presence in domestic branded business Behind large cap peers in complex generics segment Higher debt - investing for future: ARBP currently has debt of ~USD610m primarily due to recent acquisitions and aggressive expansion Foraying into niche areas in US: Complex generic filings in limited competition areas including Penems, Peptides, and Hormonal & Oncology Injectables Turnaround in Europe: ARBP expects EBITDA margins for this business to be in double digits over the next three years. Currency volatility bodes well due to limited emerging market exposures: USFDA scrutiny: USFDA scrutiny has become a key risk for pharma companies. High base effect: US business will almost reach the USD1b mark in FY16.. Niche approvals will be key to drive growth INR appreciation: Steep appreciation in INR will have a negative impact on revenue and profitability. STRENGTHS WEAKNESS OPPORTUNITY THREATS 18 February
29 Story in charts Exhibit 44: Segment mix (%) FY14 FY15 FY16E FY17E FY18E CAGR (15-18E) USA Natrol EU RoW ARV APIs Total Exhibit 46: EBITDA growth to exceed revenues EBITDA (INR m) EBITDA growth (%) FY10 FY11 FY12 FY13 FY14 FY15 FY16E FY17E FY18E Exhibit 45: Segment growth (%) FY13 FY14 FY15 FY16E FY17E FY18E USA Natrol EU RoW ARV APIs Total Exhibit 47: Break-up of sales growth (FY15-18E) % 9 % 73 % 4 % 5 % 194 FY15 APIs ARVs US EU RoW FY18E Exhibit 48: Forecast 27% EPS CAGR Exhibit 49: Break-up of EPS growth (FY15E-18E) EPS (INR) 56 % 27 % 17 % FY10 FY11 FY12 FY13 FY14 FY15 FY16E FY17E FY18E EPS (FY15) Sales Growth Margin expn Financial Leverage EPS (FY18E) 18 February
30 Exhibit 50: Working capital has improved Exhibit 51: Expect improved cash flows to aid deleveraging Inventory Days Debtor Days Creditor Days Cash conv. cycle days Total Debt (INR b) Net Debt/EBITDA FY10 FY11 FY12 FY13 FY14 FY15 FY16E FY17E FY18E FY10 FY11 FY12 FY13 FY14 FY15 FY16E FY17E FY18E Exhibit 52: Rich ANDA pipeline v/s peers Exhibit 53: Return ratios ANDA Filed ANDA Pending ROE (%) ROCE (%) ARBP ALPM CDH GNP IPCA LPC SUNP FY10 FY11 FY12 FY13 FY14 FY15 FY16E FY17E FY18E 18 February
 21.9 13.2 14.7 28.2 21.2 23.1 24.0 25.")
31 Financials and Valuations Income Statement (INR Million) Y/E Mar E 2017E 2018E Net Sales 43,816 46,274 58,553 80, , , , ,362 Change (%) EBITDA 9,598 6,101 8,610 22,828 25,636 31,931 39,153 48,668 EBITDA Margin (%) Depreciation 1,715 2,005 2,487 3,125 3,326 3,862 4,483 5,072 EBIT 7,883 4,096 6,122 19,703 22,310 28,068 34,670 43,595 Interest 625 1,028 1,313 1, Other Income ,000 Extraordinary items 372-5,445-1,353-2, PBT 7,881-2,129 3,741 16,825 21,679 26,868 34,750 43,960 Tax 2, ,635 5,966 7,389 9,382 11,869 Tax Rate (%) Min. Int. & Assoc. Share Reported PAT 5,634-1,235 2,939 13,228 15,758 19,527 25,417 32,146 Adjusted PAT 5,369 1,939 3,993 14,820 16,190 20,132 25,417 32,146 Change (%) Balance Sheet (INR Million) Y/E Mar E 2017E 2018E Share Capital Reserves 23,866 22,814 25,475 36,919 50,975 69,334 93, ,977 Net Worth 24,448 23,397 26,058 37,502 51,559 69,918 93, ,561 Debt 24,143 30,959 34,355 36,339 38,636 36,023 31,771 28,345 Deferred Tax 1, ,054 2,058 2,099 2,141 2,184 Total Capital Employed 49,873 54,442 61,202 76,151 92, , , ,364 Gross Fixed Assets 24,380 30,863 37,080 41,817 55,810 66,810 77,810 85,810 Less: Acc Depreciation 6,994 8,916 11,246 14,371 17,697 21,560 26,043 31,115 Net Fixed Assets 17,386 21,947 25,834 27,445 38,112 45,250 51,766 54,694 Capital WIP 6,574 6,454 2,185 2,105 2,500 2,500 2,500 2,500 Investments Current Assets 34,334 33,536 43,982 64,386 87,647 92, , ,117 Inventory 14,553 15,456 19,236 23,675 36,113 37,075 43,265 50,436 Debtors 12,310 12,400 15,970 26,366 35,392 39,764 46,931 55,337 Cash & Bank 1, ,085 1,786 4,692 5,394 7,385 13,445 Loans & Adv, Others 5,604 4,972 6,692 12,559 11,451 9,900 11,900 13,900 Curr Liabs & Provns 8,807 7,880 11,576 18,747 36,587 32,420 36,531 35,788 Curr. Liabilities 8,193 7,174 10,685 17,389 34,161 31,495 35,606 34,863 Provisions ,358 2, Net Current Assets 25,527 25,656 32,406 45,640 51,061 59,714 72,950 97,329 Total Assets 49,872 54,442 61,202 76,151 92, , , , February
 12.1-23.6 14.9 6.6 8.3 6.0 5.7 4.5 Valuation(x) P/E 26.2 24.0 19.3 15.3 12.1 Cash P/E 21.6 19.9 16.")
32 Financials and Valuations Ratios Y/E Mar E 2017E 2018E Basic (INR) EPS Cash EPS Book Value DPS Payout (incl. Div. Tax.) Valuation(x) P/E Cash P/E Price / Book Value EV/Sales EV/EBITDA Dividend Yield (%) Profitability Ratios (%) RoE RoCE Turnover Ratios (%) Asset Turnover (x) Debtors (No. of Days) Inventory (No. of Days) Creditors (No. of Days) Leverage Ratios (%) Net Debt/Equity (x) Cash Flow Statement (INR Million) Y/E Mar E 2017E 2018E Adjusted EBITDA 9,598 6,101 8,610 22,828 25,636 31,931 39,153 48,668 Non cash opr. exp (inc) ,000 (Inc)/Dec in Wkg. Cap. -6,409-1,288-5,374-13,533-2,515-7,951-11,244-18,320 Tax Paid -2, ,635-5,966-7,389-9,382-11,869 Other operating activities 372-5,445-1,353-2, CF from Op. Activity 1, ,036 3,863 17,367 16,356 19,327 19,478 (Inc)/Dec in FA & CWIP -2,866-6,446-2,106-4,656-14,388-11,000-11,000-8,000 Free cash flows -1,304-7, ,979 5,356 8,327 11,478 (Pur)/Sale of Invt Others CF from Inv. Activity -2,483-6,446-2,269-4,681-14,388-10,998-11,000-8,000 Inc/(Dec) in Net Worth 1, Inc / (Dec) in Debt 2,645 6,828 3,403 2,131 2,298-2,607-4,247-3,421 Interest Paid ,028-1,313-1, Divd Paid (incl Tax) & Others -1, ,142-1,083-1,368-1,362 CF from Fin. Activity 2,060 5,998 1, ,656-6,335-5,419 Inc/(Dec) in Cash 1,139-1,159 1, , ,992 6,059 Add: Opening Balance 728 1, ,085 1,786 4,692 5,394 7,385 Closing Balance 1, ,084 1,786 4,691 5,394 7,385 13, February


33 AUROBINDO PHARMA AUROBINDO PHARMA GALLERY OTHER COMPANIES SECTOR UPDATES
.")
34 Disclosures Aurobindo Pharma This document has been prepared by Motilal Oswal Securities Limited (hereinafter referred to as Most) to provide information about the company(ies) and/sector(s), if any, covered in the report and may be distributed by it and/or its affiliated company(ies). This report is for personal information of the selected recipient/s and does not construe to be any investment, legal or taxation advice to you. This research report does not constitute an offer, invitation or inducement to invest in securities or other investments and Motilal Oswal Securities Limited (hereinafter referred as MOSt) is not soliciting any action based upon it. This report is not for public distribution and has been furnished to you solely for your general information and should not be reproduced or redistributed to any other person in any form. This report does not constitute a personal recommendation or take into account the particular investment objectives, financial situations, or needs of individual clients. Before acting on any advice or recommendation in this material, investors should consider whether it is suitable for their particular circumstances and, if necessary, seek professional advice. The price and value of the investments referred to in this material and the income from them may go down as well as up, and investors may realize losses on any investments. Past performance is not a guide for future performance, future returns are not guaranteed and a loss of original capital may occur. MOSt and its affiliates are a full-service, integrated investment banking, investment management, brokerage and financing group. We and our affiliates have investment banking and other business relationships with a some companies covered by our Research Department. Our research professionals may provide input into our investment banking and other business selection processes. Investors should assume that MOSt and/or its affiliates are seeking or will seek investment banking or other business from the company or companies that are the subject of this material and that the research professionals who were involved in preparing this material may educate investors on investments in such business. The research professionals responsible for the preparation of this document may interact with trading desk personnel, sales personnel and other parties for the purpose of gathering, applying and interpreting information. Our research professionals are paid on the profitability of MOSt which may include earnings from investment banking and other business. MOSt generally prohibits its analysts, persons reporting to analysts, and members of their households from maintaining a financial interest in the securities or derivatives of any companies that the analysts cover. Additionally, MOSt generally prohibits its analysts and persons reporting to analysts from serving as an officer, director, or advisory board member of any companies that the analysts cover. Our salespeople, traders, and other professionals or affiliates may provide oral or written market commentary or trading strategies to our clients that reflect opinions that are contrary to the opinions expressed herein, and our proprietary trading and investing businesses may make investment decisions that are inconsistent with the recommendations expressed herein. In reviewing these materials, you should be aware that any or all of the foregoing among other things, may give rise to real or potential conflicts of interest. MOSt and its affiliated company(ies), their directors and employees and their relatives may; (a) from time to time, have a long or short position in, act as principal in, and buy or sell the securities or derivatives thereof of companies mentioned herein. (b) be engaged in any other transaction involving such securities and earn brokerage or other compensation or act as a market maker in the financial instruments of the company(ies) discussed herein or act as an advisor or lender/borrower to such company(ies) or may have any other potential conflict of interests with respect to any recommendation and other related information and opinions.; however the same shall have no bearing whatsoever on the specific recommendations made by the analyst(s), as the recommendations made by the analyst(s) are completely independent of the views of the affiliates of MOSt even though there might exist an inherent conflict of interest in some of the stocks mentioned in the research report Reports based on technical and derivative analysis center on studying charts company's price movement, outstanding positions and trading volume, as opposed to focusing on a company's fundamentals and, as such, may not match with a report on a company's fundamental analysis. In addition MOST has different business segments / Divisions with independent research separated by Chinese walls catering to different set of customers having various objectives, risk profiles, investment horizon, etc, and therefore may at times have different contrary views on stocks sectors and markets. Unauthorized disclosure, use, dissemination or copying (either whole or partial) of this information, is prohibited. The person accessing this information specifically agrees to exempt MOSt or any of its affiliates or employees from, any and all responsibility/liability arising from such misuse and agrees not to hold MOSt or any of its affiliates or employees responsible for any such misuse and further agrees to hold MOSt or any of its affiliates or employees free and harmless from all losses, costs, damages, expenses that may be suffered by the person accessing this information due to any errors and delays. The information contained herein is based on publicly available data or other sources believed to be reliable. Any statements contained in this report attributed to a third party represent MOSt s interpretation of the data, information and/or opinions provided by that third party either publicly or through a subscription service, and such use and interpretation have not been reviewed by the third party. This Report is not intended to be a complete statement or summary of the securities, markets or developments referred to in the document. While we would endeavor to update the information herein on reasonable basis, MOSt and/or its affiliates are under no obligation to update the information. Also there may be regulatory, compliance, or other reasons that may prevent MOSt and/or its affiliates from doing so. MOSt or any of its affiliates or employees shall not be in any way responsible and liable for any loss or damage that may arise to any person from any inadvertent error in the information contained in this report. MOSt or any of its affiliates or employees do not provide, at any time, any express or implied warranty of any kind, regarding any matter pertaining to this report, including without limitation the implied warranties of merchantability, fitness for a particular purpose, and non-infringement. The recipients of this report should rely on their own investigations. This report is intended for distribution to institutional investors. Recipients who are not institutional investors should seek advice of their independent financial advisor prior to taking any investment decision based on this report or for any necessary explanation of its contents. Most and it s associates may have managed or co-managed public offering of securities, may have received compensation for investment banking or merchant banking or brokerage services, may have received any compensation for products or services other than investment banking or merchant banking or brokerage services from the subject company in the past 12 months. Most and it s associates have not received any compensation or other benefits from the subject company or third party in connection with the research report. Subject Company may have been a client of Most or its associates during twelve months preceding the date of distribution of the research report MOSt and/or its affiliates and/or employees may have interests/positions, financial or otherwise of over 1 % at the end of the month immediately preceding the date of publication of the research in the securities mentioned in this report. To enhance transparency, MOSt has incorporated a Disclosure of Interest Statement in this document. This should, however, not be treated as endorsement of the views expressed in the report. Motilal Oswal Securities Limited is registered as a Research Analyst under SEBI (Research Analyst) Regulations, SEBI Reg. No. INH There are no material disciplinary action that been taken by any regulatory authority impacting equity research analysis activities Analyst Certification The views expressed in this research report accurately reflect the personal views of the analyst(s) about the subject securities or issues, and no part of the compensation of the research analyst(s) was, is, or will be directly or indirectly related to the specific recommendations and views expressed by research analyst(s) in this report. The research analysts, strategists, or research associates principally responsible for preparation of MOSt research receive compensation based upon various factors, including quality of research, investor client feedback, stock picking, competitive factors and firm revenues Disclosure of Interest Statement AUROBINDO PHARMA Analyst ownership of the stock No Served as an officer, director or employee No A graph of daily closing prices of securities is available at and Regional Disclosures (outside India) This report is not directed or intended for distribution to or use by any person or entity resident in a state, country or any jurisdiction, where such distribution, publication, availability or use would be contrary to law, regulation or which would subject MOSt & its group companies to registration or licensing requirements within such jurisdictions. For U.S. Motilal Oswal Securities Limited (MOSL) is not a registered broker - dealer under the U.S. Securities Exchange Act of 1934, as amended (the"1934 act") and under applicable state laws in the United States. In addition MOSL is not a registered investment adviser under the U.S. Investment Advisers Act of 1940, as amended (the "Advisers Act" and together with the 1934 Act, the "Acts), and under applicable state laws in the United States. Accordingly, in the absence of specific exemption under the Acts, any brokerage and investment services provided by MOSL, including the products and services described herein are not available to or intended for U.S. persons. This report is intended for distribution only to "Major Institutional Investors" as defined by Rule 15a-6(b)(4) of the Exchange Act and interpretations thereof by SEC (henceforth referred to as "major institutional investors"). This document must not be acted on or relied on by persons who are not major institutional investors. Any investment or investment activity to which this document relates is only available to major institutional investors and will be engaged in only with major institutional investors. In reliance on the exemption from registration provided by Rule 15a-6 of the U.S. Securities Exchange Act of 1934, as amended (the "Exchange Act") and interpretations thereof by the U.S. Securities and Exchange Commission ("SEC") in order to conduct business with Institutional Investors based in the U.S., MOSL has entered into a chaperoning agreement with a U.S. registered broker-dealer, Motilal Oswal Securities International Private Limited. ("MOSIPL"). Any business interaction pursuant to this report will have to be executed within the provisions of this chaperoning agreement. The Research Analysts contributing to the report may not be registered /qualified as research analyst with FINRA. Such research analyst may not be associated persons of the U.S. registered broker-dealer, MOSIPL, and therefore, may not be subject to NASD rule 2711 and NYSE Rule 472 restrictions on communication with a subject company, public appearances and trading securities held by a research analyst account. For Hong Kong: This report is distributed in Hong Kong by Motilal Oswal capital Markets (Hong Kong) Private Limited, a licensed corporation (CE AYY-301) licensed and regulated by the Hong Kong Securities and Futures Commission (SFC) pursuant to the Securities and Futures Ordinance (Chapter 571 of the Laws of Hong Kong) SFO. As per SEBI (Research Analyst Regulations) 2014 Motilal Oswal Securities (SEBI Reg No. INH ) has an agreement with Motilal Oswal capital Markets (Hong Kong) Private Limited for distribution of research report in Kong Kong. This report is intended for distribution only to Professional Investors as defined in Part I of Schedule 1 to SFO. Any investment or investment activity to which this document relates is only available to professional investor and will be engaged only with professional investors. Nothing here is an offer or solicitation of these securities, products and services in any jurisdiction where their offer or sale is not qualified or exempt from registration. The Indian Analyst(s) who compile this report is/are not located in Hong Kong & are not conducting Research Analysis in Hong Kong. For Singapore Motilal Oswal Capital Markets Singapore Pte Limited is acting as an exempt financial advisor under section 23(1)(f) of the Financial Advisers Act(FAA) read with regulation 17(1)(d) of the Financial Advisors Regulations and is a subsidiary of Motilal Oswal Securities Limited in India. This research is distributed in Singapore by Motilal Oswal Capital Markets Singapore Pte Limited and it is only directed in Singapore to accredited investors, as defined in the Financial Advisers Regulations and the Securities and Futures Act (Chapter 289), as amended from time to time. In respect of any matter arising from or in connection with the research you could contact the following representatives of Motilal Oswal Capital Markets Singapore Pte Limited: Kadambari Balachandran kadambari.balachandran@motilaloswal.com Contact : (+65) / Office Address : 21 (Suite 31),16 Collyer Quay,Singapore Motilal Oswal Securities Ltd Motilal Oswal Tower, Level 9, Sayani Road, Prabhadevi, Mumbai February Phone: reports@motilaloswal.com
Q3 FY15-16 Unaudited Financials
 NEWS RELEASE 9 th February 2016, Hyderabad, India Q3 Unaudited Financials Amount in INR Cr Q3 Q3 % Chg Q2 % Chg 9 Months FY14-15 (YoY) (QoQ) Consolidated Net Operating Income* 3,495.5 3,166.2 10.4 3,333.5
Aurobindo Pharma Limited. Presentation to Investors
 Aurobindo Pharma Limited Presentation to Investors November 2013 Forward looking statement This presentation contains statements that constitute forward looking statements including and without limitation,
Aurobindo Pharma Limited Presentation to Investors
 Aurobindo Pharma Limited Presentation to Investors February 2013 Forward looking statement This presentation contains statements that constitute forward looking statements including and without limitation,
BUY. Aurobindo Pharma Ltd. Pharmaceuticals RETAIL EQUITY RESEARCH. Well placed to monetise the product pipeline
 COMPANY INITIATING REPORT Jun-15 Jul-15 Aug-15 Sep-15 GEOJIT BNP PARIBAS Research Oct-15 Nov-15 Dec-15 Jan-16 Feb-16 Mar-16 Apr-16 May-16 Jun-16 RETAIL EQUITY RESEARCH Aurobindo Pharma Ltd. Pharmaceuticals
Q4 FY16-17 EARNINGS PRESENTATION. 29 th May 2017
 Q4 FY16-17 EARNINGS PRESENTATION 29 th May 2017 Disclaimer This presentation contains statements that constitute forward looking statements including and without limitation, statements relating to the
INVESTOR PRESENTATION. November 2015
 INVESTOR PRESENTATION November 2015 Disclaimer This presentation contains statements that constitute forward looking statements including and without limitation, statements relating to the implementation
Aurobindo Pharma Limited. Investor Presentation
 Aurobindo Pharma Limited Investor Presentation May 2015 Forward looking statement This presentation contains statements that constitute forward looking statements including and without limitation, statements
Investor Presentation
 Aurobindo Pharma Limited Investor Presentation Investor Presentation August 2015 May 2015 Forward looking statement This presentation contains statements that constitute forward looking statements including
Verson 2.0 Bigger, Better, Stronger
 28 June 2016 CornerOffice Interaction with the CEO Verson 2.0 Bigger, Better, Stronger Size of a leader + growth of a start-up In the last four years, Aurobindo Pharma s PAT has grown 10x while its market
Q3 FY17-18 EARNINGS PRESENTATION. 7 th February 2018
 Q3 FY17-18 EARNINGS PRESENTATION 7 th February 2018 Disclaimer This presentation contains statements that constitute forward looking statements including and without limitation, statements relating to
CMP: INR692 TP: INR1,100 (+59%) Buy
 Buy") BSE SENSEX S&P CNX 23,759 7,216 Bloomberg ARBP IN Equity Shares (m) 584.8 M.Cap.(INRb)/(USDb) 404.5 / 6.0 52-Week Range (INR) 892/491 1, 6, 12 Rel. Per (%) -14/8/50 Avg Val, INRm/ Vol m 1,689.1 / 1.7 Free
BSE SENSEX S&P CNX 23,759 7,216 Bloomberg ARBP IN Equity Shares (m) 584.8 M.Cap.(INRb)/(USDb) 404.5 / 6.0 52-Week Range (INR) 892/491 1, 6, 12 Rel. Per (%) -14/8/50 Avg Val, INRm/ Vol m 1,689.1 / 1.7 Free
Aurobindo Pharma. Institutional Equities. Initiating Coverage. US Business To Drive Growth BUY
 Initiating Coverage Institutional Equities Aurobindo Pharma 7 April 16 Reuters: ARBN.BO; Bloomberg: ARBP IN US Business To Drive Growth Aurobindo Pharma (APL) has gradually transformed itself from an API
Aurobindo Pharma BUY. Performance Highlights CMP. `686 Target Price `877. 3QFY2017 Result Update Pharmaceutical. Investment Period 12 months
 3QFY2017 Result Update Pharmaceutical February 23, 2017 Aurobindo Pharma Performance Highlights Y/E march (` cr) 3QFY17 2QFY17 % chg (QoQ) 3QFY16 % chg (yoy) Net sales 3,844 3,714 3.5 3,432 12.0 Other
Aurobindo Pharma Ltd.
 . Volume No.. I Issue No. 165 Aurobindo Pharma Ltd. March 12, 2018 BSE Code: 524804 NSE Code: AUROPHARMA Reuters Code: ARBN.NS Bloomberg Code: ARBP:IN Aurobindo Pharma Ltd (Auro) is one of the largest
Aurobindo Pharma BUY. Performance Highlights CMP. `580 Target Price `823. 4QFY2017 Result Update Pharmaceutical. Investment Period 12 months
 Nov-12 Jun-13 Dec-13 Jul-14 Jan-15 Aug-15 Feb-16 Sep-16 Apr-17 4QFY2017 Result Update Pharmaceutical June 2, 2017 Aurobindo Pharma Performance Highlights Y/E march (` cr) 4QFY17 3QFY17 % chg (QoQ) 4QFY16
Q4 FY17-18 EARNINGS PRESENTATION
 Q4 FY17-18 EARNINGS PRESENTATION 28 th May 2018 Disclaimer This presentation contains statements that constitute forward looking statements including and without limitation, statements relating to the
Aurobindo Pharma BUY. Performance Highlights CMP. `109 Target Price `156. 1QFY2013 Result Update Pharmaceutical. Investment Period 12 months
 1QFY2013 Result Update Pharmaceutical August 8, 2012 Aurobindo Pharma Performance Highlights Y/E march (` cr) 1QFY2013 4QFY2012 % chg (qoq) 1QFY2012 % chg (yoy) Net sales 1197 1171 2.3 1065 12.4 Other
Q2 FY18-19 EARNINGS PRESENTATION
 Q2 FY18-19 EARNINGS PRESENTATION 12 th November 2018 Disclaimer This presentation contains statements that constitute forward looking statements including and without limitation, statements relating to
Aurobindo Pharma. Source: Company Data; PL Research
 Sales miss on few approvals, earnings beats on better revenue May 31, 2016 Surajit Pal surajitpal@plindia.com +912266322259 Rating BUY Price Rs786 Target Price Rs943 Implied Upside 2% Sensex 26,668 Nifty
Aurobindo Pharma BUY. Performance Highlights. `708 Target Price CMP `823. 2QFY2018 Result Update Pharmaceutical. Investment Period 12 months
 Aug-14 Nov-14 Feb-15 May-15 Aug-15 Nov-15 Feb-16 May-16 Aug-16 Nov-16 Feb-17 May-17 Aug-17 Nov-17 2QFY2018 Result Update Pharmaceutical November 20, 2017 Aurobindo Pharma Performance Highlights Y/E march
Aurobindo Pharma. Source: Company Data; PL Research
 1QFY17 performance in line; H2FY17 guided to be better August 24, 2016 Surajit Pal surajitpal@plindia.com +912266322259 Rating BUY Price Rs788 Target Price Rs943 Implied Upside 19.7% Sensex 28,060 Nifty
Sun Pharmaceuticals. CMP: INR554 TP: INR614 Neutral
 BSE SENSEX S&P CNX 17,849 5,416 Bloomberg SUNP IN Equity Shares (m) 1,035.6 52-Week Range (INR) 566/404 1,6,12 Rel. Perf. (%) -3/10/31 M.Cap. (INR b) 573.7 M.Cap. (USD b) 11.6 15 February 2012 3QFY12 Results
Key estimate revision. Financial summary. Year FY15 121, % 16, % FY16E 137, % 20,
 : price: EPS: How does our one year outlook change? We maintain rating on Aurobindo post the company s 3QFY16 results. Revenue growth for the quarter was 10% yoy: US sales of $238mn (vs. estimate of $251mn
To voluntarily stop supplies to US
 BSE Sensex S&P CNX 26,272 7,831 24 July 2014 Update Sector: Healthcare Ipca Laboratories CMP: INR728 TP: INR930 Buy Stock Info Bloomberg IPCA IN Equity Shares (m) 126.2 52-Week Range (INR) 907/609 1, 6,
Aurobindo Pharma ACCUMULATE. Performance Highlights. `780 Target Price CMP `855. 2QFY2019 Result Update Pharmaceutical. Investment Period 12 months
 Nov-15 Mar-16 Jul-16 Nov-16 Mar-17 Jul-17 Nov-17 Mar-18 Jul-18 Nov-18 2QFY2019 Result Update Pharmaceutical November 17, 2018 Aurobindo Pharma Performance Highlights Y/E march (` cr) 2QFY19 1QFY19 % chg
CMP: INR1,327 TP: INR1,607(+21%) Buy
 Buy") 24 May 217 4QFY17 Results Update Sector: Technology Tata Elxsi BSE SENSEX S&P CNX 3,32 9,361 Bloomberg TELX IN Equity Shares (m) 31 M.Cap.(INRb)/(USDb) 45.8 /.7 52-Week Range (INR) 1863 / 122 1, 6, 12
24 May 217 4QFY17 Results Update Sector: Technology Tata Elxsi BSE SENSEX S&P CNX 3,32 9,361 Bloomberg TELX IN Equity Shares (m) 31 M.Cap.(INRb)/(USDb) 45.8 /.7 52-Week Range (INR) 1863 / 122 1, 6, 12
CMP: INR788 TP: INR875 (+11%) Buy Halol facility receives warning letter
 Buy Halol facility receives warning letter") 21 December 2015 Update Sector: Healthcare Sun Pharma BSE SENSEX S&P CNX 25,519 7,762 Stock Info Bloomberg SUNP IN Equity Shares (m) 2,406.6 52-Week Range (INR) 1,201/706 1, 6, 12 Rel. Per (%) 6/0/3 M.Cap.
21 December 2015 Update Sector: Healthcare Sun Pharma BSE SENSEX S&P CNX 25,519 7,762 Stock Info Bloomberg SUNP IN Equity Shares (m) 2,406.6 52-Week Range (INR) 1,201/706 1, 6, 12 Rel. Per (%) 6/0/3 M.Cap.
FY2017 FY2018E FY2019E
 Jul-12 Dec-12 May-13 Oct-13 Mar-14 Aug-14 Jan-15 Jun-15 Nov-15 Apr-16 Sep-16 Feb-17 Jul-17 2QFY2018 Result Update Pharmaceutical November 20, 2017 Lupin Performance Highlights Y/E March (`cr) 2QFY2018
Strides Arcolab. CMP: INR717 TP: INR829 Buy
 BSE SENSEX S&P CNX 17,144 5,200 Bloomberg STR IN Equity Shares (m) 57.7 52-Week Range (INR) 794/276 1,6,12 Rel. Perf. (%) -2/37/98 M.Cap. (INR b) 41.4 M.Cap. (USD b) 0.7 31 July 2012 2QCY12 Results Update
Cadila Healthcare NEUTRAL. Performance Highlights CMP. `495 Target Price - 4QFY2017 Result Update Pharmaceutical.
 Feb-14 May-14 Aug-14 Nov-14 Feb-15 May-15 Aug-15 Nov-15 Feb-16 May-16 Aug-16 Nov-16 Feb-17 May-17 4QFY2017 Result Update Pharmaceutical June 5, 2017 Cadila Healthcare Performance Highlights Y/E March (`
Torrent Pharmaceuticals
 BSE SENSEX S&P CNX 21,338 6,339 Bloomberg TRP IN Equity Shares (m) 169.2 M.Cap. (INR b) / (USD b) 80.4/1.3 52-Week Range (INR) 535/324 1, 6, 12 Rel.Per (%) 4/12/32 Financials & Valuation (INR Million)
Sun Pharma BUY. Performance Highlights. `683 Target Price `847 CMP. 2QFY2017 Result Update Pharmaceutical. Investment Period 12 months
 2QFY2017 Result Update Pharmaceutical November 17, 2016 Sun Pharma Performance Highlights (` cr) 2QFY2017 1QFY2017 % chg (qoq) 2QFY2016 % chg (yoy) Net sales 7,764 8,007 (3.0) 6,858 13.2 Other income 621
Lupin 1QFY2018 Result Update
 Jul-12 Nov-12 Mar-13 Jul-13 Nov-13 Mar-14 Jul-14 Nov-14 Mar-15 Jul-15 Nov-15 Mar-16 Jul-16 Nov-16 Mar-17 Jul-17 1QFY2018 Result Update Pharmaceutical August 07, 2017 Lupin Performance Highlights Y/E March
Lupin BUY. Performance Highlights. CMP `1,493 Target Price `1,809. 2QFY2017 Result Update Pharmaceutical. 3-year price chart
 2QFY2017 Result Update Pharmaceutical November 11, 2016 Lupin Performance Highlights Y/E March (` cr) 2QFY2017 1QFY2017 % chg qoq 2QFY2016 % chg yoy Net sales 4,212 4,316 (2.4) 3,193 31.9 Other income
Cadila Healthcare NEUTRAL. Performance Highlights CMP. `390 Target Price - 2QFY2017 Result Update Pharmaceutical. Investment Period -
 2QFY2017 Result Update Pharmaceutical November 7, 2016 Cadila Healthcare Performance Highlights Y/E March (` cr) 2QFY2017 1QFY2017 % chg (qoq) 2QFY2016 % chg (yoy) Net sales 2,336 2,216 5.4 2,267 3.1 Other
Cipla REDUCE. Performance Highlights. CMP Target Price `564 `490. 2QFY2017 Result Update Pharmaceutical. Investment Period - 3-Year Daily Price Chart
 2QFY2017 Result Update Pharmaceutical November 11, 2016 Cipla Performance Highlights Y/E March (` cr) 2QFY2017 1QFY2017 % chg qoq 2QFY2016 % chg yoy Net sales 3,672 3,500 4.9 3,379 8.7 Other income 106
Dr. Reddy s Laboratories
 Mar-12 Aug-12 Jan-13 Jun-13 Nov-13 Apr-14 Sep-14 Feb-15 Jul-15 Dec-15 May-16 Oct-16 Mar-17 Aug-17 2QFY2018 Result Update Pharmaceutical November 24, 2017 Dr. Reddy s Laboratories Performance Highlights
Hardick Bora 4QFY13 Results Update Sector: Healthcare Dr Reddy's Laboratories CMP: INR2,026 TP: INR2,375 Buy
 BSE Sensex S&P CNX 19,772 5,995 Bloomberg DRRD IN Equity Shares (m) 169.2 M.Cap. (INR b)/(usd b) 344/6.3 52-Week Range (INR) 2,151/1,528 1,6,12 Rel. Perf. (%) -2/9/0 Financials & Valuation (INR b) Y/E
Cadila Healthcare NEUTRAL. Performance Highlights CMP. `440 Target Price. 3QFY2017 Result Update Pharmaceutical. Investment Period -
 3QFY2017 Result Update Pharmaceutical February 22, 2017 Cadila Healthcare Performance Highlights Y/E March (` cr) 3QFY2017 2QFY2017 % chg (qoq) 3QFY2016 % chg (yoy) Net sales 2,250 2336 (3.7) 2268 (0.8)
Cadila Healthcare ACCUMULATE. Performance Highlights. CMP 860 Target Price QFY2013 Result Update Pharmaceutical. Key financials (Consolidated)
") 2QFY2013 Result Update Pharmaceutical November 7, 2012 Cadila Healthcare Performance Highlights ACCUMULATE CMP 860 Target Price 926 Y/E March (` cr) 2QFY2013 1QFY2013 % chg (qoq) 2QFY2012 % chg (yoy) Investment
2QFY2013 Result Update Pharmaceutical November 7, 2012 Cadila Healthcare Performance Highlights ACCUMULATE CMP 860 Target Price 926 Y/E March (` cr) 2QFY2013 1QFY2013 % chg (qoq) 2QFY2012 % chg (yoy) Investment
Aurobindo Pharma. Source: Company Data; PL Research
 US injectable, OTC, EU geared for higher growth in FY19E February 09, 2018 Surajit Pal surajitpal@plindia.com +912266322259 Rating BUY Price Rs602 Target Price Rs909 Implied Upside 51.0% Sensex 34,413
Dr. Reddy s Laboratories
 2QFY2017 Result Update Pharmaceutical November 7, 2016 Dr. Reddy s Laboratories Performance Highlights Y/E March (` cr) 2QFY2017 1QFY2017 % chg (qoq) 2QFY2016 % chg (yoy) Net sales 3,586 3,235 10.9 3,989
Sanofi India ACCUMULATE. Performance Highlights. CMP `4,410 Target Price `4,738. 1QCY2016 Result Update Pharmaceutical. 3-year price chart
 1QCY2016 Result Update Pharmaceutical May 5, 2016 Sanofi India Performance Highlights Y/E Dec. (` cr) 1QCY2016 4QCY2015 % chg (qoq) 1QCY2015 % chg (yoy) Net sales 506 522 (3.1) 460 10.1 Other income 64
Sun Pharma BUY. Performance Highlights. `783 Target Price `944 CMP. 1QFY2017 Result Update Pharmaceutical. Investment Period 12 months
 1QFY2017 Result Update Pharmaceutical August 17, 2016 Sun Pharma Performance Highlights (` cr) 1QFY2017 4QFY2016 % chg QoQ 1QFY2016 % chg yoy Net sales 8,007 7,414 8.0 6,527 22.7 Other income 393 185 112.3
Lupin Investor Presentation Q3FY14
 Lupin Investor Presentation Q3FY14 Vision: To be an innovation led transnational company Safe harbor statement Materials and information provided during this presentation may contain forward looking statements.
Lupin BUY COMPANY UPDATE 12 SEP 2013
 COMPANY UPDATE 12 SEP 2013 Lupin BUY INDUSTRY PHARMA CMP (as on 12 Sep 2013) Rs 866 Target Price Rs 941 Nifty 5,851 Sensex 19,782 KEY STOCK DATA Bloomberg /Reuters LPC IN/LUPN.BO No. of Shares (mn) 448
Q4 FY15-16 and FY15-16 Financial Results. % Chg (YoY) Q3 FY FY15-16 FY14-15 % Chg Consolidated Net Operating Income*
 Q3 FY FY15-16 FY14-15 % Chg Consolidated Net Operating Income*") NEWS RELEASE 30 th May 2016, Hyderabad, India Amount in INR Cr Q4 FY15-16 Q4 FY15-16 and FY15-16 Financial Results Q4 FY14-15 % Chg (YoY) Q3 FY15-16 % Chg (QoQ) FY15-16 FY14-15 % Chg Consolidated Net Operating
NEWS RELEASE 30 th May 2016, Hyderabad, India Amount in INR Cr Q4 FY15-16 Q4 FY15-16 and FY15-16 Financial Results Q4 FY14-15 % Chg (YoY) Q3 FY15-16 % Chg (QoQ) FY15-16 FY14-15 % Chg Consolidated Net Operating
Financial integrity intact; FDA resolution the key
 BSE Sensex S&P CNX 25,842 7,843 19 November 2015 Update Sector: Healthcare Dr. Reddy s Lab CMP: INR3,287 TP: INR4,000 (+22%) Buy Stock Info Bloomberg DRRD IN Equity Shares (m) 170.4 M.Cap. (INR b)/(usd
Alembic BUY. Performance Highlights. Target Price. 1QFY2011 Result Update Pharmaceutical. Investment Period 12 months
 1QFY2011 Result Update Pharmaceutical August 2, 2010 Alembic Performance Highlights Y/E March (Rs cr) 1QFY2011 4QFY2010 % chg (qoq) 1QFY2010 % chg (yoy) Net Sales 279 267 4.6 291 (4.0) Other Income 1 1
Aurobindo Pharma Ltd Q3 FY17-18 Financial Results Q3 Q3
 NEWS RELEASE 7 th February 2018, Hyderabad, India Consolidated financial results Q3FY17-18 Aurobindo Pharma Ltd Q3 FY17-18 Financial Results Amount in INR Cr Q3 Q3 9M 9M FY17-18 FY16-17 FY17-18 FY16-17
Aurobindo Pharma Ltd Q1 FY18-19 Financial Results Q1 Q1
 NEWS RELEASE 9 th August 2018, Hyderabad, India Consolidated financial results Q1FY18-19 Aurobindo Pharma Ltd Q1 FY18-19 Financial Results Amount in INR Cr Q1 Q1 Q4 FY18-19 FY17-18 FY17-18 Revenue from
Hardick Bora
 BSE Sensex S&P CNX 19,990 6,069 Bloomberg JOL IN Equity Shares (m) 159.3 M.Cap. (INR b)/(usd b) 26.0/0.5 52-Week Range (INR) 248/154 1,6,12 Rel. Perf. (%) -18/-28/-34 Financials & Valuation (INR b) Y/E
Hardick Bora QFY13 Results Update Sector: Healthcare Lupin CMP: INR725 TP: INR851 Buy
 BSE Sensex S&P CNX 19,990 6,069 Bloomberg LPC IN Equity Shares (m) 447.6 M.Cap. (INR b)/(usd b) 324.5/6.0 52-Week Range (INR) 739/507 1,6,12 Rel. Perf. (%) 9/18/13 Financials & Valuation (INR b) Y/E March
Sanofi India NEUTRAL. Performance Highlights. CMP `4,301 Target Price - 4QCY2016 Result Update Pharmaceutical. Investment Period - 3-year price chart
 4QCY2016 Result Update Pharmaceutical March 10, 2017 Sanofi India Performance Highlights Y/E Dec. (` cr) 4QCY2016 3QCY2016 % chg (qoq) 4QCY2015 % chg (yoy) Net sales 552 583 (5.3) 522 5.6 Other income
Cadila Healthcare Ltd.
 Aug-15 Sep-15 Oct-15 Nov-15 Dec-15 Jan-16 Feb-16 Mar-16 Apr-16 May-16 Jun-16 Jul-16 Aug-16 s. Cadila Healthcare Ltd.. August 8, 216 BSE Code: 532321 NSE Code: CADILAHC Reuters Code: CADI.NS Bloomberg Code:
Lupin NEUTRAL. Performance Highlights CMP. `448 Target Price - 2QFY2011 Result Update Pharmaceutical. Investment Period -
 2QFY2011 Result Update Pharmaceutical November 8, 2010 Lupin Performance Highlights Y/E March (` cr) 2QFY11 1QFY11 % chg qoq 2QFY10 % chg yoy Net Sales 1,405 1,312 7.1 1,115 26.0 Other Income 29 23 25.6
Initiating Coverage CMP: `610/- 10 th April 2018 BUY. Sector: Pharmaceuticals. Tausif Shaikh Tel:
 Initiating Coverage CMP: `610/- 10 th April 2018 BUY Sector: Pharmaceuticals Tausif Shaikh Tel: +9122-6146 2974 tausifshaikh@way2wealth.com Company Details Key Stock Data CMP 610 Market Cap (` Crs) 35,734
Bloomberg Code: ATA IN
 Auto OEM: 3-Wheelers Atul Feb Auto 03, 2015 Ltd India Research Stock Broking Bloomberg Code: ATA IN Stable quarter led by surge in exports volumes (TP revised ) : Operating revenue, EBITDA and PAT grew
Sun Pharma BUY. Performance Highlights. `739 Target Price `944 CMP. 4QFY2016 Result Update Pharmaceutical. Investment Period 12 months
 4QFY2016 Result Update Pharmaceutical June 10, 2016 Sun Pharma Performance Highlights (` cr) 4QFY2016 3QFY2016 % chg QoQ 4QFY2015 % chg yoy Net sales 7,414 7,047 5.2 6,145 20.7 Other income 185 255 (27.2)
GlaxoSmithKline Pharmaceuticals
 3QFY2017 Result Update Pharmaceutical February 15, 2017 GlaxoSmithKline Pharmaceuticals Performance Highlights Y/E Mar (` cr) 3QFY2017 2QFY2017 % chg (QoQ) 3QFY2016 % chg (YoY) NEUTRAL CMP `2,683 Target
Dr Reddy s Laboratories
 1QFY2017 Result Update Pharmaceutical July 29, 2016 Dr Reddy s Laboratories Performance Highlights Y/E March (` cr) 1QFY2017 4QFY2016 % chg (qoq) 1QFY2016 % chg (yoy) Net sales 3,235 3,756 (13.9) 3,758
Is the tide turning positive? Lupin step in the right direction. 8 July
 8 July 216 Healthcare Motilal Oswal values your support in the Asiamoney Brokers Poll 216 for India Research, Sales and Trading team. We request your ballot. Pharma coverage universe Company TP (INR) %
Sun Pharma NEUTRAL. Performance Highlights CMP. 1QFY2013 Result Update Pharmaceutical. `676 Target Price - Investment Period -
 1QFY2013 Result Update Pharmaceutical August 10, 2012 Sun Pharma Performance Highlights (` cr) 1QFY2013 4QFY2012 % chg qoq 1QFY2012 % chg yoy Net sales 2,658 2,330 14.1 1,636 62.5 Other income (2) 218-110
Investor Presentation February 2019
 Investor Presentation February 2019 Dr. Reddy s Laboratories Limited Hyderabad, India BSE: 500124 NSE: DRREDDY NYSE: RDY Safe Harbor Statement This presentation contains forward-looking statements and
Cipla BUY. Performance Highlights CMP. `310 Target Price `369. 2QFY2012 Result Update Pharmaceutical. Investment Period 12 months
 2QFY2012 Result Update Pharmaceutical November 16, 2011 Cipla Performance Highlights Y/E March (` cr) 2QFY2012 1QFY2012 % chg qoq 2QFY2011 % chg yoy Net sales 1,731 1,550 11.7 1,580 9.6 Other income 71
Sanofi India NEUTRAL. Performance Highlights. CMP `4,007 Target Price - 3QCY2017 Result Update Pharmaceutical. Investment Period 12 months
 3QCY2017 Result Update Pharmaceutical November 20, 2017 Sanofi India Performance Highlights Y/E Dec. (` cr) 3QCY2017 2QCY2017 % chg (qoq) 3QCY2016 % chg (yoy) Net sales Other income Operating profit 627
Sanofi India NEUTRAL. Performance Highlights. CMP `4,007 Target Price - 2QCY2017 Result Update Pharmaceutical. 3-year price chart.
 2QCY2017 Result Update Pharmaceutical August 28, 2017 Sanofi India Performance Highlights Y/E Dec. (` cr) 2QCY2017 1QCY2017 % chg (qoq) 2QCY2016 % chg (yoy) Net sales Other income Operating profit 556
Financials/Valuation. 1Mn 3Mn 1Yr P/B (X) Absolute (7.8) (6.3) (5.3) P/E (x) Rel.to Nifty (6.5) (8.6) (25.0) Recent Developments:
 Absolute (7.8) (6.3) (5.3) P/E (x) Rel.to Nifty (6.5) (8.6) (25.0) Recent Developments:") Feb-17 Mar-17 Apr-17 May-17 Jun-17 Jul-17 Aug-17 Sep-17 Oct-17 Nov-17 Dec-17 Jan-18 Feb-18 08-Feb-18 Bloomberg- INDUSTRY - CIPLA IN BSE Code - 500087 NSE Code - NIFTY - PHARMACEUTICAL CIPLA 10476 Comapany
Feb-17 Mar-17 Apr-17 May-17 Jun-17 Jul-17 Aug-17 Sep-17 Oct-17 Nov-17 Dec-17 Jan-18 Feb-18 08-Feb-18 Bloomberg- INDUSTRY - CIPLA IN BSE Code - 500087 NSE Code - NIFTY - PHARMACEUTICAL CIPLA 10476 Comapany
Ipca Laboratories ACCUMULATE. Performance Highlights. `533 Target Price CMP. 2QFY2018 Result Update Pharmaceutical. Investment Period 12 Months
 May-12 Nov-12 May-13 Nov-13 May-14 Nov-14 May-15 Nov-15 May-16 Nov-16 May-17 2QFY2018 Result Update Pharmaceutical November 28, 2017 Ipca Laboratories Performance Highlights % chg % chg Y/E March (` cr)
Lupin NEUTRAL. Performance Highlights. CMP `1,838 Target Price - 2QFY2016 Result Update Pharmaceutical. Investment Period -
 2QFY2016 Result Update Pharmaceutical November 10, 2015 Lupin Performance Highlights Y/E March (` cr) 1QFY2016 4QFY2015 % chg qoq 1QFY2015 % chg yoy Net sales 3,178 3,074 3.4 3,117 2.0 Other income 184
Dr Reddy s Laboratories
 : price: EPS: How does our one year outlook change? We maintain rating on DRRD post the company s 3QFY16 results Revenue growth for the quarter was muted (3% yoy) due to disappointing performances in Russia
NATIONAL STOCK EXCHANGE OF INDIA BSE LIMITED Phiroz Jeejeebhoy Towers, Exchange Plaza,
 (? AUROBINDO Date: November 12, 2018 To To NATIONAL STOCK EXCHANGE OF INDIA BSE LIMITED LIMITED Phiroz Jeejeebhoy Towers, Exchange Plaza, 25 th floor, Dalal Street, Sandra Kurla Complex, Sandra (E), MUMBAI
Press Release. Consolidated Financial & Performance Highlights (Pharma & Biotech)
") Press Release Strides Shasun announces Q1 FY17 results Q1 FY17 Pharma Revenues* at INR 8,699 Mn, Growth of 43% YoY, Pharma EBITDA at INR 1,451 Mn, Growth of 57% YoY Bengaluru, August 17, 2016: Strides
Press Release Strides Shasun announces Q1 FY17 results Q1 FY17 Pharma Revenues* at INR 8,699 Mn, Growth of 43% YoY, Pharma EBITDA at INR 1,451 Mn, Growth of 57% YoY Bengaluru, August 17, 2016: Strides
NATCO PHARMA LTD. Result Update (PARENT BASIS): Q1 FY16
: Q1 FY16") ISIN: INE987B01018 OCTOBER 15 th, 2015 STOCK DETAILS Sector NATCO PHARMA LTD. Result Update (PARENT BASIS): Q1 FY16 BSE Code 524816 Face Value 10.00 Pharmaceuticals 52wk. High / Low (Rs.) 2709.00/1245.40
ISIN: INE987B01018 OCTOBER 15 th, 2015 STOCK DETAILS Sector NATCO PHARMA LTD. Result Update (PARENT BASIS): Q1 FY16 BSE Code 524816 Face Value 10.00 Pharmaceuticals 52wk. High / Low (Rs.) 2709.00/1245.40
Blue Star Ltd BUY. Performance Update. CMP Target Price `703 `867. 1QFY2019 Result Update Cons. Durable. 3-year price chart.
 Aug-15 Oct-15 Dec-15 Feb-16 Apr-16 Jun-16 Aug-16 Oct-16 Dec-16 Jan-17 Apr-17 May-17 Jul-17 Sep-17 Nov-17 Jan-18 Mar-18 May-18 Jul-18 1QFY2019 Result Update Cons. Durable August 10, 2018 Blue Star Ltd Performance
CMP: INR2,623 TP: INR2,875 (+10%) Neutral
 Neutral") 21 March 2017 Update Sector: Healthcare Dr Reddy s Labs BSE SENSEX S&P CNX 29,485 9,122 Bloomberg DRRD IN Equity Shares (m) 170.4 M.Cap.(INR b)/(usd b) 447.0 / 6.6 52-Week Range (INR) 3689 / 2602 1, 6,
21 March 2017 Update Sector: Healthcare Dr Reddy s Labs BSE SENSEX S&P CNX 29,485 9,122 Bloomberg DRRD IN Equity Shares (m) 170.4 M.Cap.(INR b)/(usd b) 447.0 / 6.6 52-Week Range (INR) 3689 / 2602 1, 6,
Formulations Performance Highlights Q3 FY18
 Press Release Strides announces Q3 FY18 results Continuing adjusted EBITDA at INR 1,441 Mn Revenues* at INR 7,536 Mn Adjusted PAT* at INR 630 Mn (* for continuing business) Bengaluru, February 9, 2018:
Visaka Industries Ltd
 Company Update Superior Product Mix & New Age Markets to Aid Growth New investments to aid growth: Visaka continues to give a good set of numbers. YoY EPS grew at 142% aided by a revenue growth of 1.5%
Pharmaceuticals. 4QFY18 Results Preview. 13 Apr Amey Chalke
 Pharmaceuticals FY18 Results Preview 13 Apr 2018 Amey Chalke amey.chalke@hdfcsec.com +91-22-6171-7321 1QFY17 2QFY17 3QFY17 FY17 1QFY18 2QFY18 3QFY18E 1QFY17 2QFY17 3QFY17 FY17 1QFY18 2QFY18 3QFY18E PHARMACEUTICALS
Amber Enterprises India Ltd
 3QFY2019 Result Update Consumer Durable February 16, 2019 Amber Enterprises India Ltd Performance Update (` cr) 3QFY19 3QFY18 % yoy 2QFY19 % qoq Revenue 388.8 338.4 14.9 226.3 71.8 EBITDA 22.1 24.1 (8.2)
Bird s Eye View of Indian Pharma
 Bird s Eye View of Indian Pharma Classification of Pharma Industry Pharma industry Formulations Active Pharmaceuticals Ingredients Branded Generics Bulk drugs Pfizer Abbott GSK BMS Teva Mylan Dr Reddy
Religare Investment Call
 v-17 Dec-17 Jan-18 Feb-18 Mar-18 Apr-18 May-18 Jun-18 Jul-18 Aug-18 Sep-18 Oct-18 v-18 Q2FY19 Result Update Q2FY19 Result Update BUY CMP (Rs) 5,813 Target Price (Rs) 6,519 Potential Upside 12.1% Sensex
Institutional Equities
 1QFY19 Result Update Institutional Equities Aurobindo Pharma 13 August 2018 Reuters: ARBP.NS; Bloomberg: ARBP IN One-offs Impact Margin Aurobindo Pharma (APL) reported 1QFY19 revenues of Rs42,503mn which
Goodyear India ACCUMULATE. Performance Highlights. CMP Target Price `326 `374. 1QCY2012 Result Update Tyres. Key financials
 1QCY212 Result Update Tyres June 6, 212 Goodyear India Performance Highlights Y/E December (` cr) 1QCY212 1QCY211 % chg (yoy) 4QCY211 % chg (qoq) Net sales 331 336 (1.6) 395 (16.2) EBITDA 2 24 (18.6) 34
Garware Wall Ropes ACCUMULATE. Performance Highlights CMP. `550 Target Price `618. 2QFY2017 Result Update Textile. Investment Period 12 months
 2QFY217 Result Update Textile November 16, 216 Garware Wall Ropes Performance Highlights Quarterly Data (`cr) 2QFY17 2QFY16 % yoy 1QFY17 % qoq Revenue 232 214 8.5 225 3.3 EBITDA 4 26 5.9 31 29.4 Margin
Hardick Bora 4QCY12 Results Update Sector: Healthcare Sanofi India CMP: INR2,307 TP: INR2,015 Neutral
 BSE Sensex S&P CNX 19,332 5,855 Bloomberg SANL IN Equity Shares (m) 23.0 M.Cap. (INR b)/(usd b) 53.1/1.0 52-Week Range (INR) 2,450/2,002 1,6,12 Rel. Perf. (%) 9/-1/-4 Financials & Valuation (INR b) Y/E
Cadila Healthcare 1QFY2011 Result Update
 1QFY2011 Result Update Pharmaceutical July 27, 2010 Cadila Healthcare Performance Highlights Y/E March (Rs cr) 1QFY2011 4QFY2009 % chg (qoq) 1QFY2010 % chg (yoy) Net sales 1,055 816 29.3 880 19.9 Other
Rallis India SELL. Performance Highlights. `231 Target Price 189 CMP. 2QFY2018 Result Update Agrichemical. Investment Period 12 months
 Jan-12 Jun-12 Nov-12 Apr-13 Sep-13 Feb-14 Jul-14 Dec-14 May-15 Oct-15 Mar-16 Aug-16 Jan-17 Jun-17 Nov-17 2QFY2018 Result Update Agrichemical November 21, 2017 Rallis India Performance Highlights Y/E March
J.B. Chemicals & Pharmaceuticals Ltd.
 Oct-16 Nov-16 Nov-16 Dec-16 Jan-17 Jan-17 Feb-17 Mar-17 Apr-17 Apr-17 May-17 Jun-17 Jun-17 Jul-17 Aug-17 Aug-17 Sep-17 Oct-17. Volume No.. I Issue No. 146 J.B. Chemicals & Pharmaceuticals Ltd. October
37 th Annual JP Morgan Healthcare Conference. January 8, 2019
 37 th Annual JP Morgan Healthcare Conference January 8, 2019 Safe Harbor Statement This presentation contains forward-looking statements and information that involve risks, uncertainties and assumptions.
Rallis India NEUTRAL. Performance Highlights CMP. `215 Target Price - 3QFY2017 Result Update Agrichemical. Investment Period - 3-year price chart
 3QFY2017 Result Update Agrichemical January 25, 2017 Rallis India Performance Highlights Y/E March (` cr) 3QFY2017 2QFY2017 % chg (qoq) 3QFY2016 % chg (yoy) Net sales 326 540 (39.7) 306 6.5 Other income
Near-term pressure, but long-term outlook positive
 INDUSTRY IT CMP (as on 2 Nov 2015) Rs 1,812 Target Price Rs 2,050 Nifty 8,051 Sensex 26,559 KEY STOCK DATA Bloomberg ECLX IN No. of Shares (mn) 30 MCap (Rs bn) / ($ mn) 55/843 6m avg traded value (Rs mn)
Graphite India BUY. Performance Highlights CMP. `93 Target Price `124. 4QFY2012 Result Update Capital Goods. Investment Period 12 Months
 4QFY2012 Result Update Capital Goods May 11, 2012 Graphite India Performance Highlights Y/E March (` cr) 4QFY2012 3QFY2012 % chg (qoq) 4QFY2011 % chg (yoy) Net sales 452 437 3.5 304 48.6 EBITDA 83 90 (7.7)
Asian Paints. CMP: INR2,722 TP: INR3,161 Buy
 BSE SENSEX S&P CNX 16,739 5,049 Bloomberg APNT IN Equity Shares (m) 95.9 52-Week Range (INR) 3,366/2,395 1,6,12 Rel. Perf. (%) -5/-3/14 M.Cap. (INR b) 261.1 M.Cap. (USD b) 4.9 23 January 2012 3QFY12 Results
Akorn, Inc. N a s d a q : A K R X
 Akorn, Inc. N a s d a q : A K R X Jefferies 2014 Global Healthcare Conference June 2014 DISCLAIMER This presentation includes certain forward-looking statements regarding our views with respect to our
Institutional Equities
 Company Update Institutional Equities Dr. Reddy s Laboratories 5 September 2017 Reuters: REDY.BO; Bloomberg: DRRD IN Suboxone Generic Opportunity To Be Lucrative, Can Sustain For Longer Time The district
Akorn, Inc. N a s d a q : A K R X
 Akorn, Inc. N a s d a q : A K R X Jefferies 2014 Global London Healthcare Conference November 2014 DISCLAIMER This presentation includes certain forward-looking statements regarding our views with respect
Religare Investment Call
 Q3FY18 Result Update Consumer Durables Symphony Ltd. BUY CMP (Rs) Target Price (Rs) Potential Upside Sensex Nifty Key Stock data BSE Code NSE Code Bloomberg Shares o/s, Cr (FV 2) Market Cap (Rs Cr) 3M
LUPIN LIMITED. Q3 FY18 Investor Presentation. February 06, 2018
 LUPIN LIMITED Q3 FY18 Investor Presentation February 06, 2018 Safe Harbor Statement Materials and information provided during this presentation may contain forward-looking statements. These statements
Rallis India NEUTRAL. Performance Highlights CMP. `237 Target Price - 1QFY2018 Result Update Agrichemical. Investment Period - 3-year price chart
 Jan-12 Jul-12 Jan-13 Jul-13 Jan-14 Jul-14 Jan-15 Jul-15 Jan-16 Jul-16 Jan-17 1QFY2018 Result Update Agrichemical July 26, 2017 Rallis India Performance Highlights Y/E March (` cr) 1QFY2018 4QFY2017 % chg