INSTITUTIONAL PRESENTATION
|
|
|
- Cordelia Harvey
- 5 years ago
- Views:
Transcription
1 INSTITUTIONAL PRESENTATION MARCH 2015 KLBN11 KLBN11 / 1 KLBAY
2 DISCLAIMER The statements contained in this presentation related to the business outlook, operating and financial projections, and growth prospects of Klabin S.A. are merely projections, and as such are based exclusively on the expectations of the Company s management concerning the future of the business. These forward-looking statements depend substantially on the market conditions, the performance of the Brazilian economy, the industry and international markets, and therefore are subject to change without prior notice. This presentation on Klabin s performance includes non-accounting and accounting data, such as operating and financial information, as well as projections based on Management s expectations. Note that the non-accounting data has not been reviewed by the Company s independent auditors. The Company s management believes EBITDA may provide useful information on the Company s operating performance and allow for comparisons with other companies in the same industry. Note however that EBITDA is not a measure established in accordance with generally accepted accounting principles of the International Financial Reporting Standards IFRS, and may be defined and calculated differently by other companies. 2
3 A DIFFERENTIATED COMPANY 3


4 INTEGRATION AND MARKETS STRONGLY LINKED TO THE CONSUMER MARKET SALES VOLUME DESTINATION PAPER AND PACKAGING 13% other consumer goods 68% FOREST PULP PAPER and CONVERSION 243 thousand ha 1.7 million tonnes COATED BOARDS 750 thousand tonnes food 12% 220 thousand tonnes INDUSTRIAL BAGS AND SACK KRAFT others 7% building 330 thousand tonnes CORRUGATED BOXES AND KRAFTLINER 1.0 million tonnes EUCALYPTUS AND PINE FORESTS OLD CORRUGATED CONTAINERS 4

5 LEADER IN BRAZIL, WHERE WE ALLOCATE MORE THAN 50% OF OUR CAPACITY COATED BOARDS KRAFTLINER PAPER MARKET POSITION 50% market share 637 thousand tonnes sold in thousand tonnes sold in % installed capacity sole supplier of liquid packaging board in Latin America 5
6 LEADER IN BRAZIL, WHERE WE ALLOCATE MORE THAN 95% OF OUR CAPACITY CONVERSION MARKET POSITION INDUSTRIAL BAGS CORRUGATED BOXES 50% market share 16% market share second player s market share is 16% second player s market share is 8% source: ABPO december

7 RECENT IMPROVEMENTS IN EFFICIENCY COST REDUCTION AND CHANGE IN COMMERCIAL PRACTICES MONTE ALEGRE, PR OTACÍLIO COSTA, SC CORREIA PINTO, SC FORESTRY UNIT INSOURCING MECHANIZATION OF SILVICULTURE AND HARVESTING HIGH RETURN INVESTMENTS EXPANSION OF EVAPORATION SYSTEM OTACÍLIO COSTA AND MONTE ALEGRE BIOMASS BOILER OTACÍLIO COSTA AND CORREIA PINTO HIGH VOLTAGE TRANSMISSION LINE MONTE ALEGRE EXPANSION OF CONVERSION CAPACITY NEW CORRUGATOR JUNDIAÍ DISTR. IND, SP NEW CORRUGATOR GOIANA, PE NEW INDUSTRIAL BAGS EQUIPMENTS GOIANA, PE NEW PRINTERS FOR CORRUGATED BOXES 7
8 CAGR 16% 32% 34% 35% ADJUSTED EBITDA MARGIN 26% 26% 962 milllion R$ 1,028 million R$ 1,352 million R$ 1,562 million R$ 1,718 million R$ SALES VOLUME OF 1.7 MILLION TONNES PER YEAR (EXCLUDING WOOD)
9 EXPANSION PROJECTS NEW CAPACITIES SACK KRAFT MACHINE (SC) 80 thousand tonnes per year DEBOTTLENECKING COATED BOARDS (PR) 50 thousand tonnes per year DEBOTTLENECKING ANGATUBA (SP) 35 thousand tonnes per year RECYCLED PAPER MACHINE (PE) 110 thousand tonnes per year DEBOTTLENECKING PIRACICABA (SP) PUMA PROJECT 15 thousand tonnes per year 1.5 million tonnes per year COMPLETED CURRENT DEVELOPMENT 9
10 GROWTH PERSPECTIVES values excluding energy volume 3.5 mm tonnes energy fluff 1.8 mm tonnes 2.0 mm tonnes short fiber pulp conversion papers boards PAPER EXPANSIONS GOIANA ANGATUBA PIRACICABA conversion papers boards PUMA CONCLUSION conversion papers boards
11 PUMA PROJECT 11

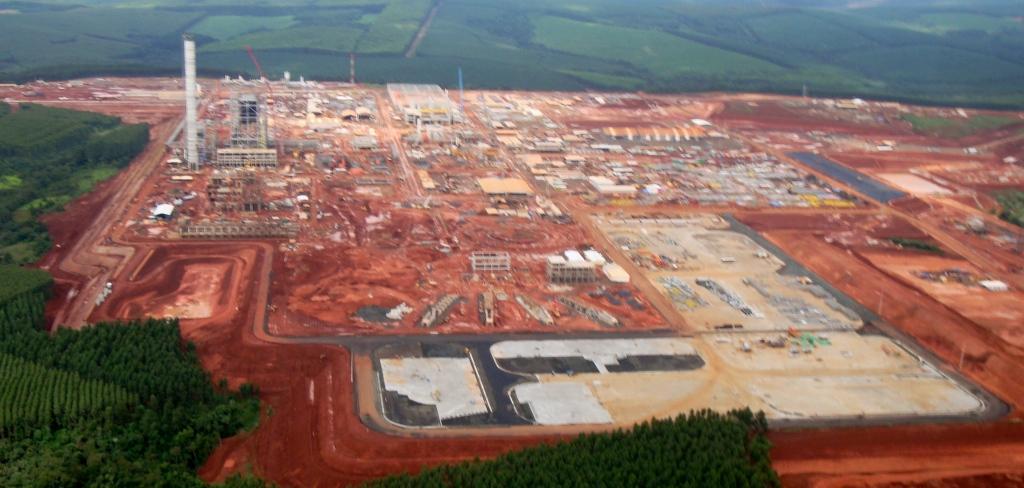
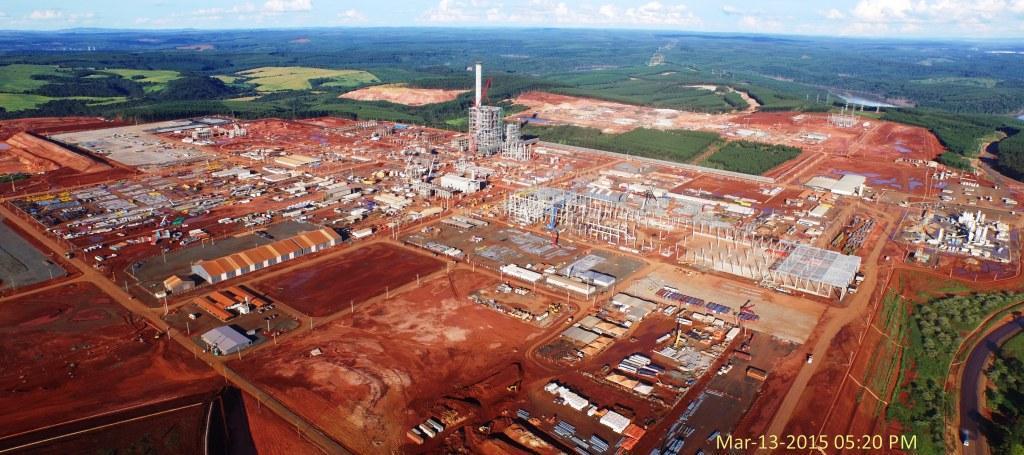
12 12


13 LOW OPERATION COST ANNUAL PRODUCTION CAPACITY 1.5 MILLION TONNES OF PULP 1.1 MILLION TONNES OF SHORT FIBER 400 THOUSAND TONNES OF LONG FIBER PART CONVERTED TO FLUFF PRODUCTION OF 270 MWh of ENERGY SELF SUFFICIENT 120 MWh FOR PUMA USE 150 MWh FOR SALE IN THE MARKET 13

14 LESS FORESTRY AREA NEEDED 300 thousand hectares Europe 700thousand hectares nordic countries 238 thousand hectares south USA PLANTED FOREST NEEDED FOR A 1.5 MILLION TONNES OF HARDWOOD PULP MILL 160 thousand hectares Chile 140 thousand hectares Brazil 100 thousand hectares HUGE KLABIN PUMA PRODUTIVITY 14

15 PARANÁ ORTIGUEIRA PUMA 23 Km MONTE ALEGRE MILL TELÊMACO BORBA IMBAÚ 15
 45% 0% OF THE PROJECT COMPLETED 100% 34% 0% OF THE CAPEX DISBURSED")
16 CURRENT STATUS COMPLETION COST areas delivered to EPC s 100% of earthmoving concluded EPC s with Klabin coordination dedicated team: strong feedback and control 95% of equipment supplies, materials and services concluded lower dependency on imported equipments EUR 360 million (50% already paid) 45% 0% OF THE PROJECT COMPLETED 100% 34% 0% OF THE CAPEX DISBURSED 100% 16
17 46% INDUSTRIAL CAPEX 14% TOTAL CAPEX R$ 7.2 BI national equipments and materials 14% imported equipments 27% INDUSTRIAL CAPEX R$ 5.8 BI NET OF RECOVERABLE TAXES engineering and other services civil construction and assembly FUNDING FOR THE PROJECT CONTRACTED 17
18 PUMA LOGISTICS 18


19 LOGISTICS MULTIMODAL 72 Km forestry average distance 441 Km railway to the port FORESTS PULP MILL PARANAGUÁ PORT INBOUND OUTBOUND 19


20 RAIL 4 compositions of 71 wagons 4,544 tonnes every 42 hours 1,250 meters dimension of each composition 20


21 maneuver courtyard ALL WAREHOUSE IN KM 5 rail access static capacity of 70,000 tonnes warehouse Km 5 warehouse in port port Klabin owns the area warehouse in Km 5 warehouse will be ready for use in dec/15 21

22 WAREHOUSE IN THE PORT Klabin owns the area rail access Static capacity of 80,000 tonnes warehouse in the port direct connection to the primary port area Paranaguá port 22
23 PUMA PULP MARKET 23
24 PULP MARKET million tonnes 164 mm t 52.6 million tonnes VIRGIN FIBER PULP PULP MARKET DISTRIBUTION long fiber 45% 33% eucalyptus 22% integrated pulp market pulp other short fibers Source: Hawkins Wright; RISI 24
25 LARGEST MARKET PULP MILLS OF THE WORLD million tonnes per year in 2014 Fibria Aracruz 2,340 PUMA: 6 th LARGEST PULP MILL April Riau 2,200 April Rizhao 1,700 WORLD DEMAND million tonnes per year in 2014 CMPC Guaíba 1,690 Suzano Mucuri 1,565 Klabin 1,500 short fiber market pulp Suzano Maranhão 1,500 Eldorado 1,500 Montes del Plata 1,300 eucalyptus Source: Hawkins Wright (jul/14) 25
26 4 th LARGEST IN FLUFF WORLD CAPACITY OF FLUFF thousand tonnes per year in 2014 GP Weyco IP Puma Klabin Domtar Resolute Stora Arauco Rock Tenn Rayonier UPM Source: Hawkins Wright 1,045 1,420 the only designed to produce fluff from the start 2,296 mills converted in fluff mills WORLD DEMAND million tonnes per year in ,7 fibra longa SBSK = pinus long fiber from USA 6,4 fluff and SBSK 26


27 FOCUS ON CONSUMER MARKETS MARKET PENETRATION IN DISPOSABLE DIAPERS 2013 SOPHISTICATION AND INNOVATION IN HIGHER VALUE ADDED PRODUCTS USA 96% high potential of growth BRA 50% ARG 72% Source: RISI, Euromonitor 27
28 BRAZIL IS THE 3 RD LARGEST MARKET OF DISPOSABLE DIAPERS IN THE WORLD SALES OF DIAPERS FOR ADULTS R$ billion SALES OF DIAPERS FOR INFANT R$ billion Source: Euromonitor 28


29 COMPOSITION OF DIAPERS 30% TO 50% OF THE AVERAGE WEIGHT OF A DIAPER IS COMPOSED OF FLUFF (20 TO 40G) 29
30 SPREADS AMONG DIFFERENT FIBERS 308 CIF EUROPE US$/TONNE fluff x short fiber 122 long fiber x short fiber may 13 jun 13 jul 13 aug 13 sep 13 oct 13 nov 13 dec 13 jan 14 feb 14 mar 14 apr 14 may 14 jun 14 jul 14 aug 14 sep 14 oct 14 nov 14 dez 14 Source: RISI, FOEX 30
31 GLOBAL CASH COST (SHORT FIBER) CIF EUROPE US$/TONNE 400 PUMA 5 million tonnes 10 million tonnes 15 million tonnes 20 million tonnes 25 million tonnes ANNUAL CAPACITY Source: Hawkins Wright CIF: COST, INSURANCE AND FREIGHT INCLUDED 31
32 EARNINGS
33 SALES VOLUME excluding wood tsd tonnes NET REVENUE R$ million HIGHLIGHTS ADJUSTED EBITDA R$ million 1,788 31% 1,771 31% 4,599 26% 4,894 25% 1,562 1,718 69% 69% 74% 75% exports domestic market 33
 KRAFTLINER 675 thousand tonnes 44% 637 thousand tonnes 41% 1,608 million")

34 COATED BOARDS PAPER BUSINESS UNIT KRAFTLINER (3) KRAFTLINER AND COATED BOARDS (1) RECYCLED (2) KRAFTLINER 675 thousand tonnes 44% 637 thousand tonnes 41% 1,608 million R$ 1,661 million R$ 377 thousand tonnes 58% 389 thousand tonnes % million R$ 639 million R$ 56% 59% 42% 35% exports domestic market 34
 2,017 million R$ 2,171 million R$ 693 thousand tonnes 712 thousand tonnes 2013 2014 + 2013")
35 CONVERSION MARKET POSITION CORRUGATED BOXES (7) CORRUGATED BOXES AND INDUSTRIAL BAGS (1) INDUSTRIAL BAGS (3) 2,017 million R$ 2,171 million R$ 693 thousand tonnes 712 thousand tonnes
36 UNIT CASH COST 1,689 R$/tonne 1,778 R$/tonne 1,719 R$/tonne 1,830 R$/tonne 4T13 4T14* * *Excluding non-recurring effects 36
37 NET DEBT NET DEBT/EBITDA (LTM) 2.4x 2.5x 2.3x 2.5x 2.4x 2.5x 2.2x 2.4x 2.4x 2.6x 1.7x 1.7x 2.4x 3.0x 5,242 NET DEBT R$ million 2,313 2,735 2,674 3,014 3,090 3,278 3,136 3,437 3,595 3,985 2,711 2,824 4,028 sep/11 dec/11 mar/12 jun/12 sep/12 dec/12 mar/13 jun/13 sep/13 dec/13 mar/14 jun/14 sep/14 dec/14 37
38 FIN. AGREEMENTS 2014 R$ million Local Currency Annual interest rate - % Current Debentures Mandatorily Convertible 2 Noncurrent Total USD + Share of Profits BNDES - Debentures IPCA to BNDES Project PUMA TJLP BNDES - Project MA1100 TJLP and basket FINAME 2.5 to BNDES - Other TJLP and basket Export credit notes CDI Other 1.0 to Foreign Currency (USD) 983 3,148 4,131 BNDES Project PUMA USD BNDES - Other USD to Bonds (Notes) USD ,328 1,36 Export credit notes USD to ,127 1,282 USD + Libor 6M to Export payments ,256 3,793 Others USD ,083 6,854 Total 1,754 9,231 10,985 MATURITY SCHEDULE 2014 R$ million DEBT PROFILE Foreign currency: R$ 6.9 billion Average tenor : 57 months Local currency : R$ 4.1 billion Average tenor: 45 months
39 CAPEX CAPEX R$ million E maintenance 3T T T T T special projects and growth vale do corisco PUMA project ,242 3,437 total ,945 4,172 39

40 Investor Relations Phone: +55 (11)
41 APPENDIX 41
42 INCOME STATEMENT (R$ thousand) 4Q14 3Q14 4Q Q14/3Q14 4Q14/4Q /2013 Gross Revenue 1,518,233 1,540,725 1,485,726-1% 2% 5,900,091 5,554,345 6% Net Revenue 1,257,110 1,282,208 1,236,221-2% 2% 4,893,882 4,599,337 6% Change in fair value - biological assets 19, ,784 56,362-92% -65% 924, , % Cost of Products Sold (919,770) (909,269) (845,033) 1% 9% (3,573,609) (3,206,917) 11% Gross Profit 356, , ,550-43% -20% 2,244,377 1,728,709 30% Selling Expenses (95,853) (98,218) (96,777) -2% -1% (379,726) (362,638) 5% General & Administrative Expenses (83,171) (69,367) (76,666) 20% 8% (298,350) (280,526) 6% Other Revenues (Expenses) 42,985 15,384 (1,342) 179% N/A 84,785 11, % Total Operating Expenses (136,039) (152,201) (174,785) -11% -22% (593,291) (631,692) -6% Operating Income (before Fin. Results) 220, , ,765-53% -19% 1,651,086 1,097,017 51% Equity pickup 14,268 23,032 4,860-38% 194% 48,649 22, % Financial Expenses (224,971) (226,856) (119,667) -1% 88% (654,932) (423,350) 55% Financial Revenues 131, ,318 64,803-12% 103% 535, , % Net Foreign Exchange Losses (357,697) (420,970) (193,655) -15% 85% (526,520) (528,641) 0% Net Financial Revenues (450,890) (498,508) (248,519) -10% 81% (646,112) (739,034) -13% Net Income before Taxes (215,677) (1,954) 29, % N/A 1,053, , % Income Tax and Soc. Contrib. 88,306 8,963 (7,586) 885% N/A (323,293) (90,121) 259% Net income (127,371) 7,009 21,520 N/A N/A 730, , % Depreciation and amortization 295, , ,749 33% 36% 951, ,553 24% Cost of carrying out assigned to property - land 3, N/A N/A 3,169 - N/A Change in fair value of biological assets (19,644) (252,784) (56,362) -92% -65% (924,104) (336,289) 175% Vale do Corisco 8,708 8,326 9,330 5% -7% 35,972 34,400 5% Adjusted EBITDA 508, , ,482 13% 15% 1,718,088 1,561,681 10% numbers in thousand R$ 42
43 BALANCE SHEET Assets dec-14 dez-13 Liabilities and Stockholders' Equity dec-14 dez-13 Current Assets 7,899,676 4,826,148 Current Liabilities 2,518,873 1,779,513 Cash and banks 400, ,836 Loans and financing 1,479,788 1,124,976 Short-term investments 4,845,149 2,599,036 Debentures 275,201 0 Securities 497, ,511 Suppliers 438, ,384 Receivables 1,148,676 1,145,154 Income tax and social contribution 0 18,209 Inventories 563, ,852 Taxes payable 55,137 43,298 Recoverble taxes and contributions 331, ,050 Salaries and payroll charges 139, ,356 Other receivables 111,886 85,709 REFIS Adherence 50,400 50,400 Other accounts payable 79,604 69,890 Noncurrent Assets 13,274,179 10,093,348 Long term Noncurrent Liabilities 11,596,659 7,747,316 Taxes to compensate 428, ,684 Loans and financing 8,160,320 5,838,621 Judicial Deposits 84,689 90,969 Debentures 1,070,263 0 Other receivables 236, ,322 Deferred income tax and social contribution 1,699,823 1,220,187 Other investments 494, ,581 Other accounts payable - Investors SCPs 131, ,767 Property, plant & equipment, net 8,351,387 5,909,507 REFIS Adherence 384, ,492 Biological assets 3,667,085 3,321,985 Other accounts payable 150, ,249 Intangible assets 11,337 9,300 Stockholders Equity 7,058,323 5,392,667 Capital 2,271,500 2,271,500 Capital reserve 1,295,919 4,419 Revaluation reserve 48,767 49,269 Profit reserve 2,534,302 2,159,949 Valuation adjustments to shareholders'equity 1,065,446 1,065,437 Treasury stock (157,611) (157,907) Total 21,173,855 14,919,496 Total 21,173,855 14,919,496 numbers in thousand R$ 43
INSTITUTIONAL PRESENTATION NOVEMBER, 2015 KLBN11 KLBN11 / KLBAY
 INSTITUTIONAL PRESENTATION NOVEMBER, 2015 KLBN11 KLBN11 / KLBAY DISCLAIMER The statements contained in this presentation related to the business outlook, operating and financial projections, and growth
INSTITUTIONAL PRESENTATION 2Q15
 INSTITUTIONAL PRESENTATION 2Q15 AUGUST, 2015 KLBN11 KLBN11 / KLBAY DISCLAIMER The statements contained in this presentation related to the business outlook, operating and financial projections, and growth
Institutional Presentation. February, 2013
 Institutional Presentation February, 2013 1 Disclaimer The statements contained in this presentation related to the business outlook, operating and financial projections, and growth prospects of Klabin
Institutional Presentation. May 2012
 Institutional Presentation May 2012 1 Forward looking statement The statements contained in this presentation related to the business outlook, operating and financial projections, and growth prospects
Institutional Presentation November, 2012
 Institutional Presentation November, 2012 1 2 Disclaimer The statements contained in this presentation related to the business outlook, operating and financial projections, and growth prospects of Klabin
140k. 90k DIVERSIFICATION AND FLEXIBILITY. TOTAL FIBERS 3.5 million tpy. TOTAL LAND 490k hectares. TOTAL CAPACITY 3.5 million tpy. 1.
 PRESENTATION 2Q18 1 DIVERSIFICATION AND FLEXIBILITY TOTAL LAND 490k hectares TOTAL FIBERS 3.5 million tpy BLEACHED PULP 1.5 mi tpy TOTAL CAPACITY 3.5 million tpy MARKET PULP 1.5 mi tpy Long fiber / Fluff
Earnings Release 1Q15
 Earnings Release 1Q15 APRIL 27, 2015 Adjusted EBITDA of R$461 million in 1Q15, 9% growth on 1Q14 NET REVENUE R$1,308 million Net revenue of R$1,308 million, 9% up on 1Q14. Domestic market net revenue came
1Q18 Earnings Release APRIL 26, 2018
 1Q18 Earnings Release APRIL 26, 2018 ADJUSTED EBITDA REACHES R$ 760 MILLION IN 1Q18, 41% GROWTH IN RELATION TO 1Q18. ADJUSTED EBITDA NET REVENUE KRAFTLINER SALES REVENUE PULP SALES VOLUME REDUCTION OF
Institutional Presentation
 Institutional Presentation 3Q09 October, 2009 years old Shareholder Structure 09/30/2009 Family control + Professional management Monteiro Aranha ; 20% Brazilian Investors ; 21% Common Klabin Irmãos; 59%
EARNINGS RELEASE 3Q17
 EARNINGS RELEASE 3Q17 OCTOBER 26, 2017 ADJUSTED EBITDA REACHES R$ 750 MILLION IN 3Q17, 28% GROWTH IN RELATION TO THE SAME PERIOD IN 2016. ADJUSTED EBITDA R$ 750 mi PULP SALES VOLUME 353 mil t CONVERSION
Earnings Release 2Q17
 Earnings Release 2Q17 JULY 27, 2017 ADJUSTED EBITDA REACHES R$ 595 MILLION IN 2Q17, 11% GROWTH IN RELATION TO THE SAME PERIOD IN 2016. ADJUSTED EBITDA R$ 595 mm PULP SALES VOLUME 337k tonnes NET REVENUE
2Q18 Earnings Release JULY 30 th, 2018
 2Q18 Earnings Release JULY 30 th, 2018 ADJUSTED EBITDA REACHES R$ 884 MILLION IN 2Q18 YEAR ON YEAR GROWTH OF 49% ADJUSTED EBITDA SALES REVENUES KRAFTLINER SALES REVENUE PULP PRODUCTION IN JUNE EBITDA MARGIN
Quarterly Report 3Q18 OCTOBER
 Quarterly Report 3Q18 OCTOBER 29 2018 ADJUSTED EBITDA FOR THE QUARTER REACHES R$ 1.248 BILLION IN 3Q18, YEAR-ON-YEAR GROWTH OF 66%. ADJUSTED EBITDA SALES REVENUES LEVERAGE REDUCTION PULP PRODUCTION EBITDA
3rd Quarter of October/08
 3rd Quarter of 2008 October/08 1 Forward Looking Statement The statements contained in this presentation related to the business outlook, operating and financial projections, and growth prospects of Klabin
Institutional Presentation 2Q10. August, 2010
 Institutional Presentation 2Q10 August, 2010 1 Forward Looking Statement The statements contained in this presentation related to the business outlook, operating and financial projections, and growth prospects
Klabin S.A. Quarterly Information (ITR) at March 31, 2013 and report on review of quarterly information
 at March 31, 2013 and report on review of quarterly information") Klabin S.A. Quarterly Information (ITR) at March 31, 2013 and report on review of quarterly information Report on review of quarterly information To the Board of Directors and Stockholders Klabin S.A.
Klabin S.A. Quarterly Information (ITR) at March 31, 2013 and report on review of quarterly information Report on review of quarterly information To the Board of Directors and Stockholders Klabin S.A.
EARNINGS RELEASE 4Q16 FEBRUARY 01, 2017
 EARNINGS RELEASE 4Q16 FEBRUARY 01, 2017 4Q16 ADJUSTED EBITDA REACHES R$ 653 MILLION AND R$2.3 BILLION IN 2016, 16% YOY GROWTH ADJUSTED EBITDA PULP PRODUCTION VOLUME PULP AND PAPER SALES VOLUME SALES REVENUE
Fixed Income Presentation 3Q17
 Fixed Income Presentation 3Q17 1 Agenda 1. Company Overview 2. Investment Highlights 3. Operating and Financial Highlights 2 Section 1 Company Overview 3 Company Overview Company Overview Competitive Advantages
May Corporate Presentation
 May 2014 Corporate Presentation Disclaimer The information contained in this presentation may include statements which constitute forward-looking statements, within the meaning of Section 27A of the U.S.
Fixed Income Presentation 1Q18
 Fixed Income Presentation 1Q18 1 Agenda 1. Company Overview 2. Investment Highlights 3. Operating and Financial Highlights 2 Section 1 Company Overview 3 Company Overview Company Overview Competitive Advantages
Klabin S.A. Quarterly Information (ITR) at March 31, 2015 and report on review of quarterly information
 at March 31, 2015 and report on review of quarterly information") Klabin S.A. Quarterly Information (ITR) at March 31, 2015 and report on review of quarterly information Report on review of quarterly information To the Board of Directors and Stockholders Klabin S.A.
Klabin S.A. Quarterly Information (ITR) at March 31, 2015 and report on review of quarterly information Report on review of quarterly information To the Board of Directors and Stockholders Klabin S.A.
December Corporate Presentation
 December 2014 Corporate Presentation Disclaimer The information contained in this presentation may include statements which constitute forward-looking statements, within the meaning of Section 27A of the
Fixed Income Presentation 4Q17
 Fixed Income Presentation 4Q17 1 Agenda 1. Company Overview 2. Investment Highlights 3. Operating and Financial Highlights 2 Section 1 Company Overview 3 Company Overview Company Overview Competitive Advantages
Klabin S.A. Quarterly Information (ITR) at September 30, 2014 and report on review of quarterly information
 at September 30, 2014 and report on review of quarterly information") Klabin S.A. Quarterly Information (ITR) and report on review of quarterly information Report on review of quarterly information To the Board of Directors and Stockholders Klabin S.A. Introduction We have
Klabin S.A. Quarterly Information (ITR) and report on review of quarterly information Report on review of quarterly information To the Board of Directors and Stockholders Klabin S.A. Introduction We have
Corporate Presentation June, 2011
 Corporate Presentation June, 2011 1 1 1 Disclaimer The information contained in this presentation may include statements which constitute forward-looking statements, within the meaning of Section 27A of
2 nd. nd Quarter August 08
 2 nd nd Quarter 2008 August 08 1 Forward Looking Statement The statements contained in this presentation related to the business outlook, operating and financial projections, and growth prospects of Klabin
Klabin S.A. Interim Financial Statements for the Quarter Ended March 31, 2006 and Independent Auditors Review Report
 (Convenience Translation into English from the Original Previously Issued in Portuguese) Klabin S.A. Interim Financial Statements for the Quarter Ended March 31, 2006 and Independent Auditors Review Report
Klabin S.A. Quarterly Information (ITR) at June 30, 2014 and Report on Review of Quarterly Information
 at June 30, 2014 and Report on Review of Quarterly Information") Klabin S.A. Quarterly Information (ITR) at June 30, 2014 and Report on Review of Quarterly Information Report on Review of Quarterly Information To the Board of Directors and Shareholders Klabin S.A. Introduction
Klabin S.A. Quarterly Information (ITR) at June 30, 2014 and Report on Review of Quarterly Information Report on Review of Quarterly Information To the Board of Directors and Shareholders Klabin S.A. Introduction
4Q17 EARNINGS RELEASE
 4Q17 EARNINGS RELEASE FEBRUARY 1 2018 ADJUSTED EBITDA REACHES R$ 855 MILLION IN 4Q17, 31% GROWTH VERSUS 4Q16 ADJUSTED EBITDA PULP PRODUCTION VOLUME PACKAGING SALES VOLUME SALES REVENUE NET DEBT/ EBITDA
Klabin S.A. Quarterly Information (ITR) at March 31, 2017 and report on review of quarterly information
 at March 31, 2017 and report on review of quarterly information") Klabin S.A. Quarterly Information (ITR) at March 31, 2017 and report on review of quarterly information Independent auditor s report on interim financial information The Shareholders, Board of Directors
Klabin S.A. Quarterly Information (ITR) at March 31, 2017 and report on review of quarterly information Independent auditor s report on interim financial information The Shareholders, Board of Directors
September Morgan Stanley - Global Natural Resources Conference
 September 2013 Morgan Stanley - Global Natural Resources Conference Disclaimer The information contained in this presentation may include statements which constitute forward-looking statements, within
Deutsche Bank GEMs Conference
 Deutsche Bank GEMs Conference September 5 6 th, 2012 1 Disclaimer The information contained in this presentation may include statements which constitute forwardlooking statements, within the meaning of
Equity offering and sale of forest assets of Bahia Produtos de Madeira (BPM) totaled R$1.6 billion in liquidity events to reduce leverage
 totaled R$1.6 billion in liquidity events to reduce leverage") Equity offering and sale of forest assets of Bahia Produtos de Madeira (BPM) totaled R$1.6 billion in liquidity events to reduce leverage Key Figures Unit 1Q12 4Q11 4Q11 Last 12 months Pulp Production
Equity offering and sale of forest assets of Bahia Produtos de Madeira (BPM) totaled R$1.6 billion in liquidity events to reduce leverage Key Figures Unit 1Q12 4Q11 4Q11 Last 12 months Pulp Production
Klabin S.A. Quarterly Information (ITR) at September 30, 2015 and report on review of quarterly information
 at September 30, 2015 and report on review of quarterly information") Klabin S.A. Quarterly Information (ITR) and report on review of quarterly information KLABIN915RL.DOCX Report on review of quarterly information To the Board of Directors and Stockholders Introduction
Klabin S.A. Quarterly Information (ITR) and report on review of quarterly information KLABIN915RL.DOCX Report on review of quarterly information To the Board of Directors and Stockholders Introduction
Citi 5 th Annual Brazil Equity Conference
 Citi 5 th Annual Brazil Equity Conference June 2012 1 Disclaimer The information contained in this presentation may include statements which constitute forwardlooking statements, within the meaning of
Corporate Presentation. June 2018
 Corporate Presentation June 2018 Forward-looking Statements This presentation may contain forward-looking statements, that should be considered as good faith estimates. Such statements are subject to risks
Morgan Stanley Global Emerging Markets Conference May 2014
 Morgan Stanley Global Emerging Markets Conference May 2014 2 Disclaimer The information contained in this presentation may include statements which constitute forward-looking statements, within the meaning
Corporate Presentation. April 2017
 Corporate Presentation April 2017 Forward-looking Statements This presentation may contain forward-looking statements, that should be considered as good faith estimates. Such statements are subject to
PWC 20 th Annual Forest and Paper Industry Conference
 PWC 20 th Annual Forest and Paper Industry Conference José Luciano Penido, CEO May, 2007 1 Shareholder Structure % of Total Capital Stock (1) Pro forma Votorantim Group 52% of total 100% of ON Free Float
Corporate Presentation. November 2017
 Corporate Presentation November 2017 Forward-looking Statements This presentation may contain forward-looking statements, that should be considered as good faith estimates. Such statements are subject
Why to invest in Suzano?
 Why to invest in Suzano? November 2017 Why to invest in Suzano? Strategy to Maximize the Return on Invested Capital Competitive Advantages and Leading Position in the Industry Strong Operating Cash Flow
Corporate Presentation. November 2018
 Corporate Presentation November 2018 Forward-Looking Statements This presentation may contain forward-looking statements that should be considered as good faith estimates. Such statements are subject to
Deutsche Bank's 2015 Global Emerging Markets (GEMs) September, 2015
 September, 2015") Deutsche Bank's 2015 Global Emerging Markets (GEMs) September, 2015 FIBRIA APP WITH THIS PRESENTATION IS AVAILABLE FOR DOWNLOAD AT APPLE STORE AND GOOGLE PLAY. 2 Disclaimer The information contained in
Deutsche Bank's 2015 Global Emerging Markets (GEMs) September, 2015 FIBRIA APP WITH THIS PRESENTATION IS AVAILABLE FOR DOWNLOAD AT APPLE STORE AND GOOGLE PLAY. 2 Disclaimer The information contained in
Meeting with investors - Santander August 2014
 Meeting with investors - Santander August 2014 2 Disclaimer The information contained in this presentation may include statements which constitute forward-looking statements, within the meaning of Section
Celulose Irani S.A. Quarterly Information (ITR) at September 30, 2015 and report on review of quarterly information
 at September 30, 2015 and report on review of quarterly information") Celulose Irani S.A. Quarterly Information (ITR) at September 30, 2015 and report on review of quarterly information IRANI915GHM.DOCX / IRANI915GHM.XLSX Report on review of quarterly information To the
Celulose Irani S.A. Quarterly Information (ITR) at September 30, 2015 and report on review of quarterly information IRANI915GHM.DOCX / IRANI915GHM.XLSX Report on review of quarterly information To the
March BofAML 2014 Brazil Conference
 March 2014 BofAML 2014 Brazil Conference 2 Disclaimer The information contained in this presentation may include statements which constitute forward-looking statements, within the meaning of Section 27A
Corporate Presentation. October 2018
 Corporate Presentation October 2018 Forward-Looking Statements This presentation may contain forward-looking statements that should be considered as good faith estimates. Such statements are subject to
EARNINGS RELEASE 1Q18
 , EARNINGS RELEASE Curitiba, May 8, 2018 RUMO S.A. (B3: RAIL3) ( Rumo ) and COSAN LOGÍSTICA S.A. (B3: RLOG3) ( Cosan Logística ) today announced their results for the first quarter of 2018 (), composed
Corporate Presentation. September, 2011
 Corporate Presentation September, 2011 1 Disclaimer The information contained in this presentation may include statements which constitute forwardlooking statements, within the meaning of Section 27A of
Corporate Presentation. January 2018
 Corporate Presentation January 2018 Forward-looking Statements This presentation may contain forward-looking statements, that should be considered as good faith estimates. Such statements are subject to
Suzano Papel e Celulose: Consolidated results for 3Q 2006
 Suzano Papel e Celulose: Consolidated results for 3Q 2006 Record Consolidated Ebitda of US$138 million São Paulo October 18, 2006: Suzano Papel e Celulose (Bovespa: SUZB5), one of Latin America s largest
4Q10 Results. 4Q10 Results
 1 Sale of Conpacel and KSR for R$1.5 billion reinforces Fibria s strategy of focusing on the pulp business and reducing its leverage. Key Indicators 1 4Q10 3Q10 4Q09 4Q10 vs. 3Q10 4Q10 vs. 4Q09 2010 2009
Corporate Presentation. March 2018
 Corporate Presentation March 2018 Forward-looking Statements This presentation may contain forward-looking statements, that should be considered as good faith estimates. Such statements are subject to
Stora Enso s strategy and market environment. Nordea Forest Products & Paper Seminar, 28 May 2014 CFO Seppo Parvi Stora Enso
 s strategy and market environment Nordea Forest Products & Paper Seminar, 28 May 2014 CFO Seppo Parvi It should be noted that certain statements herein which are not historical facts, including, without
EMPRESAS CMPC PRESENTATION PREPARED FOR THE J.P. MORGAN GLOBAL EMERGING MARKETS CORPORATE CONFERENCE
 EMPRESAS CMPC PRESENTATION PREPARED FOR THE J.P. MORGAN GLOBAL EMERGING MARKETS CORPORATE CONFERENCE LUIS LLANOS - CFO FEBRUARY, 2014 AGENDA I. Company description II. Our Value proposal 1. Leading diversified
1Q11 RESULTS May 12 th, 2011
 1Q11 RESULTS May 12 th, 2011 1 General Notice Certain statements in this presentation may constitute forward-looking statements. Such statements are subject to known and unknown risks and uncertainties
EMPRESAS CMPC COMPANY OVERVIEW
 EMPRESAS CMPC COMPANY OVERVIEW Presentation prepared for the BCI Investor Meeting Luis Llanos CFO April 2013 AGENDA I. Company description II. Our Value proposal 1. Leading diversified Latin American P&P
Corporate Presentation. September 2018
 Corporate Presentation September 2018 Forward-Looking Statements This presentation may contain forward-looking statements, that should be considered as good faith estimates. Such statements are subject
Celulose Irani S.A. Quarterly Information (ITR) at June 30, 2015 and report on review of quarterly information
 at June 30, 2015 and report on review of quarterly information") Celulose Irani S.A. Quarterly Information (ITR) at June 30, 2015 and report on review of quarterly information / IRANI615IFN.XLSX Report on review of quarterly information To the Board of Directors and
Celulose Irani S.A. Quarterly Information (ITR) at June 30, 2015 and report on review of quarterly information / IRANI615IFN.XLSX Report on review of quarterly information To the Board of Directors and
2008 MANAGEMENT REPORT
 To the Shareholders 2008 MANAGEMENT REPORT The Management of the Company herewith submits the Management Report for your appreciation, together with Financial Statements and the Report of the Independent
Ence Energía y Celulosa 9M15 Results. November 12 th, 2015
 Ence Energía y Celulosa 9M15 Results November 12 th, 2015 Ence 3Q15: Main Highlights 1 2 3 4 9M15 Adjusted EBITDA of 141 M, 56 M in the quarter. On track to achieve 200 M Adjusted EBITDA target - Unleveraged
FY 2017 Results. February 21 st 2018
 FY 2017 Results February 21 st 2018 Disclaimer The information contained in this presentation has been prepared by Ence Energía y Celulosa, S.A. (hereinafter, "Ence"). This presentation includes data relating
Santander 11 th Annual Conference. August 22-24, 2010 São Paulo 1
 Santander 11 th Annual Conference August 22-24, 2010 São Paulo 1 Disclaimer The information contained in this presentation may include statements which constitute forward-looking statements, within the
EMPRESAS CMPC PRESENTATION PREPARED FOR THE BTG PACTUAL V LATAM CEO CONFERENCE - NY OCTOBER 2014 SERGIO BREGMAN CFOO AGUSTÍN LETELIER VP FINANCE
 EMPRESAS CMPC PRESENTATION PREPARED FOR THE BTG PACTUAL V LATAM CEO CONFERENCE - NY OCTOBER 2014 SERGIO BREGMAN CFOO AGUSTÍN LETELIER VP FINANCE AGENDA I. Company description II. Our value proposal 1.
EMPRESAS CMPC PRESENTATION PREPARED FOR SANTANDER S XIX ANNUAL LATIN AMERICAN CEO CONFERENCE - CANCUN LUIS LLANOS CFO COLOMBA HENRÍQUEZ IR OFFICER
 EMPRESAS CMPC PRESENTATION PREPARED FOR SANTANDER S XIX ANNUAL LATIN AMERICAN CEO CONFERENCE - CANCUN LUIS LLANOS CFO COLOMBA HENRÍQUEZ IR OFFICER AGENDA I. Company description II. Our value proposal 1.
NDR RJ - Corporate Presentation. November, 2017
 NDR RJ - Corporate Presentation November, 2017 2 Disclaimer The information contained in this presentation may include statements which constitute forward-looking statements, within the meaning of Section
EMPRESAS CMPC PRESENTATION PREPARED FOR THE JP MORGAN EMERGING MARKETS CORPORATE CONFERENCE - MIAMI SERGIO BREGMAN - CFOO TRINIDAD VALDÉS HEAD IR
 EMPRESAS CMPC PRESENTATION PREPARED FOR THE JP MORGAN EMERGING MARKETS CORPORATE CONFERENCE - MIAMI SERGIO BREGMAN - CFOO TRINIDAD VALDÉS HEAD IR AGENDA I. Company description II. Our value proposal 1.
Bank of America Merrill Lynch 2018 CalGEMs Conference. June, 2018
 Bank of America Merrill Lynch 2018 CalGEMs Conference June, 2018 3 Disclaimer The information contained in this presentation may include statements which constitute forward-looking statements, within the
(A free translation of the original in Portuguese) (Unaudited) Klabin S.A.
 (Unaudited) Klabin S.A.") Klabin S.A. Financial statements at December 31, 2016 and 2015 and independent auditor's report PricewaterhouseCoopers Auditores Independentes 1 MANAGEMENT REPORT MESSAGE FROM MANAGEMENT The year 2016
Klabin S.A. Financial statements at December 31, 2016 and 2015 and independent auditor's report PricewaterhouseCoopers Auditores Independentes 1 MANAGEMENT REPORT MESSAGE FROM MANAGEMENT The year 2016
Leverage ratio in USD reaches lowest level since 3Q15, at 1.58x
 Leverage ratio in USD reaches lowest level since 3Q15, at 1.58x Record adjusted EBITDA of R$2,499 million with record margin of 58% and record FCF at R$1.7 billion Key Figures Unit 2Q18 6M18 6M17 Last
J.P. Morgan Brazil Opportunities Conference December, 2014
 J.P. Morgan Brazil Opportunities Conference December, 2014 2 Disclaimer The information contained in this presentation may include statements which constitute forward-looking statements, within the meaning
2Q11 RESULTS August 11 th, 2011
 2Q11 RESULTS August 11 th, 2011 1 General Notice Certain statements in this presentation may constitute forward-looking statements. Such statements are subject to known and unknown risks and uncertainties
Pulp & Paper Day Santander SP. May 24, 2017
 Pulp & Paper Day Santander SP May 24, 2017 2 Disclaimer The information contained in this presentation may include statements which constitute forward-looking statements, within the meaning of Section
18 th Annual Santander Brazil Conference - Corporate Presentation. August, 2017
 18 th Annual Santander Brazil Conference - Corporate Presentation August, 2017 2 Disclaimer The information contained in this presentation may include statements which constitute forward-looking statements,
BofA Merrill Lynch 2015 CalGEMs Global Emerging Markets 1x1 Conference June, 2015
 BofA Merrill Lynch 2015 CalGEMs Global Emerging Markets 1x1 Conference June, 2015 FIBRIA APP WITH THIS PRESENTATION IS AVAILABLE FOR DOWNLOAD AT APPLE STORE AND GOOGLE PLAY. 2 Disclaimer The information
EMPRESAS CMPC COMPANY OVERVIEW
 EMPRESAS CMPC COMPANY OVERVIEW JUNE, 2014 AGENDA I. Company description II. Our value proposal 1. Leading diversified Latin American P&P player and low cost producer 2. Diversified investment portfolio
Goldman Sachs Natural Resources Trip. January, 2011
 Goldman Sachs Natural Resources Trip January, 2011 1 1 1 Disclaimer The information contained in this presentation may include statements which constitute forward-looking statements, within the meaning
22 nd Santander LatAm Conference Cancun. January, 2018
 22 nd Santander LatAm Conference Cancun January, 2018 3 Disclaimer The information contained in this presentation may include statements which constitute forward-looking statements, within the meaning
Pulp Production 000 t % 32% Pulp Sales 000 t % 22% 6.497
 Leverage reduction to 2.02x in US$ and 2.08x in R$ Adjusted EBITDA of R$1,824 million, with a margin of 55% The learning curve of the new Horizonte 2 production line is 90% reached Key Figures Unit 1Q18
Ence Energía y Celulosa 1Q15 Results. April 30 th, 2015
 Ence Energía y Celulosa 1Q15 Results April 30 th, 2015 Implementing EBITDA ramp up, focusing on cash cost reduction and delivering our planned targets within the current positive environment 1Q14 Recurrent
BTG Pactual XIX CEO Conference Brasil - SP. February, 2018
 BTG Pactual XIX CEO Conference Brasil - SP February, 2018 3 Disclaimer The information contained in this presentation may include statements which constitute forward-looking statements, within the meaning
PRESENTATION PREPARED FOR THE ITAÚ BBA 11TH ANNUAL LATAM CEO CONFERENCE - NY
 PRESENTATION PREPARED FOR THE ITAÚ BBA 11TH ANNUAL LATAM CEO CONFERENCE - NY MAY 2016 1 AGENDA I. COMPANY DESCRIPTION II. CMPC S VALUE PROPOSAL 1. LEADING DIVERSIFIED LATIN AMERICAN P6P PLAYER 2. LOW COST
AGENDA CORPORATE GOVERNANCE & FINANCIAL STRATEGY PULP AND PAPER MARKET COMPETITIVE STRATEGY 2016 OUTLOOK. Marcelo Castelli Chief Executive Officer
 Fibria Day DISCLAIMER The information contained in this presentation may include statements which constitute forward-looking statements, within the meaning of Section 27A of the U.S. Securities Act of
8th Latin America Executive Conference - Morgan Stanley January, 2016
 8th Latin America Executive Conference - Morgan Stanley January, 2016 FIBRIA APP WITH THIS PRESENTATION IS AVAILABLE FOR DOWNLOAD AT APPLE STORE AND GOOGLE PLAY. 2 Disclaimer The information contained
LatAm Commodities Conference - Itaú BBA October 2014
 LatAm Commodities Conference - Itaú BBA October 2014 2 Disclaimer The information contained in this presentation may include statements which constitute forward-looking statements, within the meaning of
(A free translation of the original in Portuguese)
") Porto Alegre, July 31, 2018. Celulose Irani (B3: RANI3 and RANI4), one of the major Brazilian companies in the packaging paper and corrugated cardboard packaging segments, announces today the consolidated
Porto Alegre, July 31, 2018. Celulose Irani (B3: RANI3 and RANI4), one of the major Brazilian companies in the packaging paper and corrugated cardboard packaging segments, announces today the consolidated
UBS Sixth Annual LAT/EMEA Investor Conference. December 2009
 UBS Sixth Annual LAT/EMEA Investor Conference December 2009 1 Disclaimer The information contained in this presentation may include statements which constitute forward-looking statements, within the meaning
(A free translation of the original in Portuguese)
") Porto Alegre, October 31, 2018. Celulose Irani (B3: RANI3 and RANI4), one of the major Brazilian companies in the packaging paper and corrugated cardboard packaging segments, announces today the consolidated
Porto Alegre, October 31, 2018. Celulose Irani (B3: RANI3 and RANI4), one of the major Brazilian companies in the packaging paper and corrugated cardboard packaging segments, announces today the consolidated
Corporate Presentation November, 2016
 Corporate Presentation November, 2016 2 Disclaimer The information contained in this presentation may include statements which constitute forward-looking statements, within the meaning of Section 27A of
Conference Call 2Q17
 Conference Call 2Q17 1 Highlights 2Q17 Net Revenue of R$57.7 million in 6M17. Net Income of R$1.6 million in 6M17. Adjusted EBITDA of R$1.9 million in 6M17. Supply of 869.5 thousand tons of sugarcane in
Third Quarter 2017 Earnings Results
 Third Quarter 2017 Earnings Results Forward-looking Statements This presentation may contain forward-looking statements, that should be considered as good faith estimates. Such statements are subject to
COMPANY OVERVIEW NOVEMBER
 COMPANY OVERVIEW NOVEMBER 2016 1 AGENDA I. COMPANY DESCRIPTION II. CMPC S VALUE PROPOSAL 1. LEADING DIVERSIFIED LATIN AMERICAN P&P PLAYER 2. LOW COST PRODUCER WITH WORLD CLASS ASSETS 3. STRONG BALANCE
IRANI reports adjusted EBITDA of R$ million in 2014, increase of 21.6% in relation to 2013
 (A free translation of the original in Portuguese) Porto Alegre, february 27, 2015. Celulose Irani (BM&FBovespa: RANI3 and RANI4), one of the major Brazilian companies in the packaging paper and corrugated
Suzano Papel e Celulose S.A. Unaudited Condensed Consolidated Interim Financial Information as of June 30, 2018 and independent auditor s report.
 Unaudited Condensed Interim Financial Information and independent auditor s report. Unaudited condensed consolidated interim financial information Adjusted EBITDA¹ in 2Q18 of R$1,449/ton, leading the industry
Resultados trimestrales 1T13. Quarterly Report 2nd Quarter 2014
 Resultados trimestrales 1T13 Quarterly Report 2nd Quarter 2014 30 June 2014 CONTENTS 1. EXECUTIVE SUMMARY 1H14... 3 2. PULP BUSINESS... 5 3. ENERGY ACTIVITY... 7 4. FORESTRY ACTIVITY... 9 5. COMMENT ON
Record-high Adjusted EBITDA of R$3.3 billion in the last 12 months ending on June 2015
 2Q15 Results São Paulo, August 12 th, 2015. Suzano Pulp and Paper (Bovespa: SUZB5), one of the largest integrated pulp and paper producers in Latin America, announces today its consolidated results for
Adjusted EBITDA 1 of R$ 847 million is an industry highlight with operating performance improvement and ROIC of 10.6%
 1Q17 Results Adjusted EBITDA 1 of R$ 847 million is an industry highlight with operating performance improvement and ROIC of 10.6% São Paulo, May 3, 2017. Suzano Papel e Celulose (Bovespa: SUZB5), one
4 th Quarter 2014 Financial Results Celulosa Arauco y Constitución S.A.
 Conference Call Presentation 4 th Quarter 2014 Financial Results Celulosa Arauco y Constitución S.A. Gianfranco Truffello, C.F.O. Santiago, March 13 th, 2015 Disclaimer Forward-looking statements are based
BTG Pactual XVII CEO Conference February, 2016 FIBRIA APP WITH THIS PRESENTATION IS AVAILABLE FOR DOWNLOAD AT APPLE STORE AND GOOGLE PLAY.
 BTG Pactual XVII CEO Conference February, 2016 FIBRIA APP WITH THIS PRESENTATION IS AVAILABLE FOR DOWNLOAD AT APPLE STORE AND GOOGLE PLAY. 2 Disclaimer The information contained in this presentation may
Delivering value, delivering commitments. October 2016
 Delivering value, delivering commitments October 2016 Disclaimer The information contained in this presentation has been prepared by Ence Energía y Celulosa, S.A. (hereinafter, "Ence"). This presentation