I. ACCOUNTING ISSUES 2 II. FIRST QUARTER HIGHLIGHTS 3 III. INCOME STATEMENT 5 IV. BACKLOG 9 V. CONSOLIDATED BALANCE SHEET 11
|
|
|
- Allan Gilmore
- 5 years ago
- Views:
Transcription

1
2 - 1 - I. ACCOUNTING ISSUES 2 II. FIRST QUARTER HIGHLIGHTS 3 III. INCOME STATEMENT 5 IV. BACKLOG 9 V. CONSOLIDATED BALANCE SHEET 11 VI. GROWTH OF BUSINESS AREAS 15 VII. STOCK MARKET PERFORMANCE 30 VIII. SHAREHOLDER STRUCTURE 31 Note: The financial information presented in this document has been prepared in accordance with International Financial Reporting Standards. This information is not audited and may be modified in the future.
3 - 2 - I. ACCOUNTING ISSUES The income statement for the first quarter of 2015 has been restated as a result of the application of NIIF 11. In the first quarter of 2014 three Chilean concessions were accounted for using the equity method that were fully consolidated from the third quarter of that year. These concessions are S.C. Rutas del Desierto, S.A, S.C. Valles del Bio Bio, S.A. and S.C. Valles del Desierto, S.A. The consolidation method for the Guadalmedina motorway was also changed from equity to full consolidation following a revision of its corporate resolutions. In the first quarter of 2015, as a result of changes to the corporate resolutions that delimit the control of certain concessions companies, these concessions were fully consolidated has not been restated because this is a change in consolidation scope that is not caused by the application of NIIF 11. These companies and their impact on revenues are as follows: Revenue as of March Thousands of euros Change in consolidation scope due to corporate resolutions that delimit the control of certain concessions % Stake Var AUTOVÍA DEL TURIA 51% 2, ,776 AUTOVÍA NOROESTE C.A.R.M. 51% 1, ,956 PALMA MANACOR 40% 2, ,004 AUTOVÍA DEL ARLANZÓN 50% 6, ,250 INTERCAMBIADOR DE MONCLOA 51% 3, ,234 INTERCAMBIADOR DE PLAZA ELÍPTICA 51% 1, ,603 (1) HOSPITAL DE PARLA 51% 3,292 2,218 1,074 (1) HOSPITAL DE COSLADA 51% 3,442 2, TOTAL 24,557 4,661 19,897 (1) In march 2014, 49% stake of Hospital de Parla and Hospital de Coslada were sold. The 2014 revenue incorporate the revenue of both hospitals until sale date. There were also impacts on EBITDA, of 15 million, and on net financial debt, of 563 million.
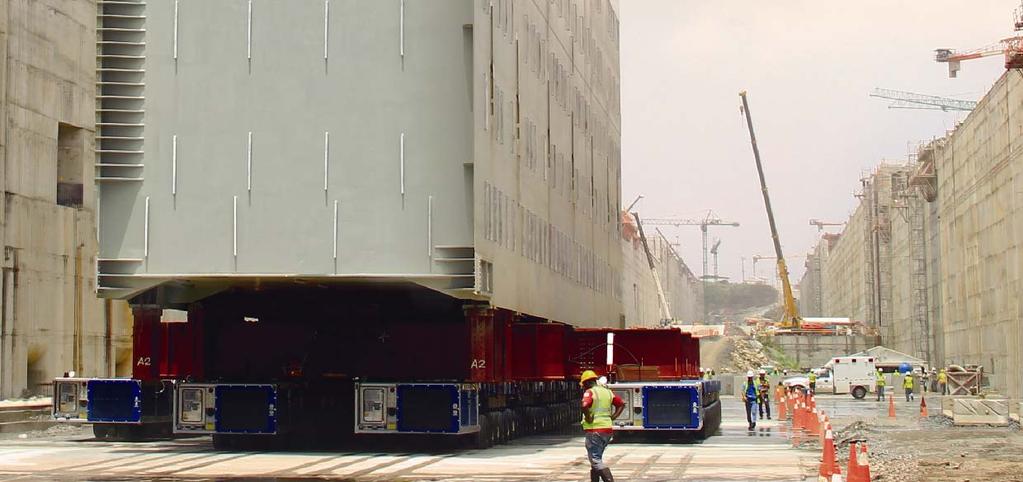
4 - 3 - II. FIRST QUARTER HIGHLIGHTS REFINANCING OF DEBT FOR ACQUISITION OF REPSOL Completion of this refinancing under favourable financial conditions was a major milestone for Sacyr. Under the agreement, achieved with near unanimous consent, the final maturity of the loan has been extended to 31 January The amount of the principal refinanced is 2,264 million and the guarantee structure is unchanged. TESTA On 3 February 2015, the Shareholders' Meeting approved a new agreement to distribute funds among shareholders by reducing the par value of all shares by million euros and paying out an extraordinary dividend of million euros. Both transactions must be performed at the same time as the increase in the company's equity. The Shareholders' Meeting had already delegated power to the Board of Directors to perform this transaction to obtain a minimum of 300 million in equity under terms that are satisfactory to Testa and its shareholders. The ultimate objective of seeking these authorisations from the Shareholders' Meeting is to pave the way for unlocking the value of Testa, providing it with greater liquidity and visibility in the financial and capital markets and with additional resources to undertake fresh real estate projects, thereby bolstering its leadership of the Spanish market. STABILITY IN THE PANAMA CANAL EXTENSION PROJECT In January 2015, the DAB (Dispute Adjudication Board) ruled in favour of GUPC in the two most important claims filed by the consortium, mainly regarding basalt and the delay attributed to the Panama Canal Authority (ACP) in approving the concrete mix to be used in the works. The ruling came down in favour of the GUPC's technical argument in these two legal claims, granting it the right to charge the ACP 234 million dollars and a six month contract extension.
5 - 4 - These claims were made at the start of the works by GUPC against the ACP, which deferred the decision to the DAB. The positive ruling, which fully held up the technical argument, is the starting point for many of the other claims that are directly or indirectly related to it. It must be taken into account that the large part of the cost of the project consists of civil works, meaning costs associated with the manufacture and laying of concrete in the new locks. The works to extend the Panama Canal, the largest engineering project in the world in terms of technical and technological complexity, are currently proceeding normally and are therefore expected to be completed as scheduled. On 1 August 2014, an agreement was reached with the Panama Canal Authority (ACP) to amend the contract so that work could be co financed
6 - 5 - III. INCOME STATEMENT Sacyr's results for the first quarter of 2015 reflect the strong operating performance of the group's businesses and confirm the growth trajectory that started last year. The group continues to focus on the goal of growing its core businesses those that contribute the most value added, on consolidating our presence in our international markets and on safeguarding profits through rigorous contract selection and stringent control of their associated risks and costs. STATEMENT OF INCOME MARCH % chg (Thousands of Euros) * 15/14 Revenue 701, , % Other income 19,599 14, % Gain on sale of building 0 2, % Total operating income 721, , % External and Operating Expenses 610, , % GROSS PROFIT FROM ORDINARY OPERATIONS(1) 110,892 89, % Amortisation and depreciation charge 32,217 27, % Changes in provision 2, n.s. NET OPERATING PROFIT 75,707 62, % Financial results 78,932 75, % Results from equity accounted subsidiaries 34,914 43, % Provisions for financial investments 1,748 1,620 n.s. Change in value of financial instruments 1,876 1,244 n.s. Results from sales of non current assets , % PROFIT BEFORE TAXES 27,965 51,830 n.s. Corporate Tax 1,039 13, % PROFIT FOR CONTINUING ACTIVITIES 26,925 38, % RESULTS FOR COMPANIES WITH DISCONTINOUS ACTIVITIES 0 14,808 n.s. CONSOLIDATE RESULTS 26,925 23, % Minorities 1, n.s. NET ATTRIBUTABLE PROFIT 25,322 24, % *Restated Gross margin 15.8% 14.9%
7 - 6 - Sacyr attained a net profit of 25 million in the first quarter of 2015, up 5% year on year, a significant achievement since the two figures are not comparable. Note that profit to 31 March 2014 included non recurring gains from disposals of concession assets and of the services activity amounting to 23 million (33% of Metro de Sevilla, 49% of the Parla and Coslada hospitals, the Olextra and Extragol energy plants and our 25% stake in Aguas de Alcalá). It also included a 2 million gain from the sale of a rental building in Madrid corresponding to our Rental Property business. Revenue in the first quarter amounted to 702 million, an increase of 19% compared with March REVENUE MARCH % Chg (Thousands Euros) * 15/14 Construction (Sacyr Construcción Somague) 368, , % Concessions (Sacyr Concesiones) 132, , % Services (Valoriza) 52,777 42, % Property (Testa) 175, , % Industrial (Sacyr Industrial) 46,354 46, % Holding and adjustments 73,776 89,007 REVENUE 701, , % INTERNATIONAL 367, , % % INTERNATIONAL 52% 47% * Restated The strong revenue performance was driven in particular by our Construction and Concessions businesses and Sacyr Industrial, with double digit growth, while our Rentals business continues to show its customary recurrence and strength and the Services business continues to hold its own. - At Sacyr Industrial growth stood at 23% due to the recurring business of energy plants and the intense focus on securing international EPC contracts.
8 At the Construction business, international activity grew 20% thanks to the contribution from the backlog in Latin America and the Middle East. International activities account for 73% of construction revenue. - In concessions, the increase is partly attributable to the change in consolidation scope caused by the full consolidation of eight concession assets that were equityaccounted in the first quarter of In addition to this impact, concession revenues were also boosted by the favourable traffic performance on our toll roads and the inauguration of the Rutas del Desierto motorway in Chile. - Service revenues fell slightly due to the Water business, mainly as a result of the disposal of water assets in Portugal in June 2014 (which therefore contributed revenues in the first half of 2014 and not in the first quarter of this year) and the completion of the construction works on a desalination plant, which were in full swing in the first quarter of However, the Environmental and Multiservices units, the other two activities at this division, posted 1% and 10% revenue growth respectively. First quarter EBITDA amounted to 110 million, a year on year increase of 23%. Since EBITDA for the first quarter of 2014 included a gain of 2 million from the sale of a property asset at Testa (a building of residential rental properties on Calle Conde de Xiquena, Madrid) recurring EBITDA growth stood at 26%.
9 - 8 - EBITDA MARCH Chg. (Miles de Euros) * 15/14 Construction (Sacyr Construcción Somague) 17,841 19, % Concessions (Sacyr Concesiones) 44,001 19, % Industrial (Sacyr industrial) 4, n.a. Services (Valoriza) 14,574 14, % Property (Testa) 34,825 34, % Holding and adjustments 4, n.a. GROSS PROFIT FROM OPERATIONS 110,892 87, % Gain on sales of buildings 0 2,290 GROSS PROFIT FROM OPERATIONS 110,892 89, % EBITDA MARGIN (%) 15.8% 14.9% * Restated The EBITDA margin was 15.8% compared to 14.9% for the same period in the previous year. The change in EBITDA compared with last year was affected at the construction business in the first quarter by the fall in the oil price, which caused a delay in some of Somague's projects, in particular in Angola and Brazil. This impact will normalise over the year. In concessions, the increase is partly attributable to the change in consolidation scope caused by the full consolidation of eight concession assets that were equity accounted in the first quarter of Stripping out this impact, concessions' EBITDA growth stood at 25%. Profit and loss of companies using the equity method This heading in the income statement includes 131 million from our holding in Repsol, of which 68 million relates to our share of Repsol s net profit of 761 million through 31 March 2015 and 35 million to the write down of the investment to fair value after an impairment test ( 21.45/share). 44 million was recorded for this item at 31 March 2014.
10 - 9 - IV. BACKLOG The anticipated future earnings at 31 March 2014 stood at 28,286 million, mostly comprising the more recurrent concessions and services businesses, which represent 47% and 22% of the total respectively, not to mention the large construction backlog on tender contracts awarded, mainly abroad. BACKLOG MARCH DECEMBER % Chg (Thousands of euros) /14 Construction (Sacyr Construcción Somague) 5,114 4,988 3% Concessions (Sacyr Concesiones) 13,292 14,952 11% Services (Valoriza) 6,202 6,259 1% Industrial( Sacyr Industrial) 2,578 2,418 7% Property (Testa) 1,100 1,193 8% BACKLOG 28,286 29,809 5% The construction backlog of Sacyr at 31 March 2015 stood at 5,114 million. It grew by 3% in the first quarter thanks to the international contracts won and the replacement level is adequate considering the increase in revenue. In construction, Sacyr has contracts in Chile, Italy, Panama, Portugal, Angola, Colombia, Bolivia, Qatar, Peru, Brazil, Mexico, Mozambique, Angola, Togo, Cape Verde, India and other countries. Sacyr Industrial is present in countries including Australia, the UK, Bolivia, Mexico, Peru and Colombia in addition to Spain, with various projects in the oil and gas, electricity infrastructure, power plant and waste treatment sectors. It now has a backlog worth 2,578 million and growth outside Spain stood at 82% in the first quarter. The large international component of the backlog is noteworthy, particularly in the Construction and Concessions businesses, which now have a distinctly international profile. The international backlog accounts for 84% of the total in the construction business. Sacyr's international footprint is even greater considering that these percentages do not include the
11 backlogs of GUPC (Panama) or the concession in Italy (Pedemontana Veneta), which are accounted for using the equity method. BACKLOG (Thousands of euros) MARCH 2015 % Internac. Construction (Sacyr Construcción Somague) 5,114 84% Concessions (Sacyr Concesiones) 13,292 31% Services (Valoriza) 6,202 32% Industrial( Sacyr Industrial) 2,578 17% Property (Testa) 1,100 0% BACKLOG 28,286 38% At Valoriza, the international backlog represents 32% of the total, with a presence in Algeria, Australia, Portugal, Bolivia, the UK, Peru and other countries, consisting mainly of water projects.
12 V. CONSOLIDATED BALANCE SHEET BALANCE SHEET MARCH DECEMBER Chg (Thousands of Euros) /14 NON CURRENT ASSETS 9,768,823 8,628,943 1,139,880 Intangible Assets 7,893 6, Real Estate Investments 1,841,074 1,846,596 5,522 Concessions Investments 1,646,462 1,213, ,787 Fixed Assets 379, ,039 15,991 Financial Assets 5,775,637 5,047, ,873 Other non Current Assets Goodwill 118, , CURRENT ASSETS 3,274,504 3,148, ,685 Non current assets held for sale 297, ,623 4,685 Inventories 396, ,356 9,955 Accounts Receivable 1,932,018 1,888,173 43,846 Financial Assets 266, ,191 53,655 Cash 381, ,475 22,915 ASSETS = LIABILITIES 13,043,327 11,777,762 1,265,565 EQUITY 1,559,771 1,326, ,696 Shareholder's Equity 1,406,151 1,205, ,851 Minority Interests 153, ,775 32,845 NON CURRENT LIABILITIES 7,559,142 4,318,315 3,240,827 Financial Debt 6,352,735 3,411,860 2,940,875 Financial Instruments at fair value 201, ,704 68,780 Provisions 295, ,248 15,884 Other non current Liabilities 709, , ,287 CURRENT LIABILITIES 3,924,414 6,133,372 2,208,958 Liabilities associated with the non current assets held for sa 206, ,771 12,811 Financial Debt 1,239,113 3,445,304 2,206,191 Financial Instruments at fair value 24,500 15,231 9,269 Trade Accounts Payable 1,481,877 1,604, ,107 Operating Provisions 297, ,908 18,662 Other current liabilities 674, , ,545 The most significant change in the first quarter of 2014 was the transfer from non current financial debt to current financial debt of the syndicated loan maturing on 31 January 2018 taken out to finance the investment in Repsol.
13 The change in the consolidation method in the first quarter of 2015 (from equity to full consolidation) for certain assets has resulted in increases in the concession projects and financial assets items. Financial debt increased by 562 million in the period for the same reason. EQUITY Equity at 31 March 2015 stood at 1,560 million. And 90% of the total (or 1,406 million) is attributable to equity holders of Sacyr and 154 million to non controlling interests in the Group. FINANCIAL DEBT At 31 March 2015, the Group s total net debt stood at 7,084 million. The breakdown is as follows: Type of debt Net Debt MARCH 2015 Structured Related to construction and contracts (Millions of Euros) Testa 1,632 1,632 Sacyr Concesiones 1,735 1,735 Sacyr Construcción + Somague Valoriza Industrial SUBTOTAL, BUSINESS 3,835 3, Repsol 2,272 2,272 Stake in Itínere SUBTOTAL, INVESTMENTS 2,515 2,515 Corporate Corporate BANK BORROWINGS 6,660 3,565 2, Convertible bond 424 TOTAL NET FINANCIAL DEBT 7,084
14 Corporate debt: the Group s net corporate debt amounted to 310 million. It corresponds to working capital credit facilities and corporate loans used by Sacyr, S.A. to coordinate and provide the financial management as the Group's parent company. In addition there was an outstanding balance of 424 million in convertible bonds at 31 March Debt according to businesses: Approximately 93% of this debt is associated with very longterm project finance, mortgage loans and lease arrangements. It is repaid with cash flows generated by the businesses and 72% matures from 2018 with significant gaps. The net debt of Testa, the rental property business, fell by just over 3% to 1,632 million, factoring in mortgage loan maturities, and its assets are valued at around 3,180 million according to an independent expert appraisal on 31 December Net debt associated with infrastructure concessions increased by 693 million, but 81% of this increase is due to the fact that several companies that were formerly equity accounted are now fully consolidated. Investment in Chile accounts for the remainder. 56% of this long term project finance is hedged against interest rate rises. Debt related to investments: The outstanding principal used to finance the 8.89% stake in Repsol stood at 2,265 million on 31 March The loan is serviced with Repsol dividends. This variable rate financing has been extended to 31 January 2018 at market conditions. The debt related to Sacyr S.A.'s investment in Itinere will be cancelled upon its sale. Net financial losses were 82 million, compared with 75 million at 31 March The average interest rate on debt was around 4%, similar to the level on 31 March 2014.
15 VI. DEVELOPMENTS IN BUSINESS AREAS CONSOLIDATED INCOME STATEMENT AS OF MARCH 2015 (Thousands of Euros) Sacyr Construcción Somague Sacyr Concesiones Testa Valoriza Sacyr Industrial Holding and Adjustments TOTAL Turnover 271,461 96, ,697 46, ,533 52,777 73, ,927 Other Sales 7,019 5,483 2, , ,191 19,599 Total Income 278, , ,204 46, ,733 52,552 72, ,526 External and Operating Expenses 264,541 98,462 91,203 11, ,159 48,165 67, ,634 GROSS OPERATING PROFIT 13,939 3,902 44,001 34,825 14,574 4,387 4, ,892 Depreciation 2,207 2,532 10,152 7,501 7,280 1, ,217 Trade Provisions 1, , ,968 NET OPERATING PROFIT 10,246 2,197 32,270 27,326 6,723 2,390 5,445 75,707 Financial results 244 2,354 29,737 1,934 4, ,006 78,932 Results from equity accounted subsidiaries ,307 34,914 Provisions for financial investments , ,748 Change in value of financial instruments at fair value 0 0 1, ,876 Results from sales of non current assets PROFIT BEFORE TAXES 10, ,390 2,837 2,655 14,143 27,965 Corporate Tax 2,639 1, , ,245 1,039 PROFIT FOR CONTINUING ACTIVITIES 8,135 1, ,097 2,521 1,881 1,897 26,925 PROFIT FOR DISCONTINUING ACTIVITIES CONSOLIDATE RESULTS 8,135 1, ,097 2,521 1,881 1,897 26,925 Minorities , ,603 NET ATTRIBUTABLE PROFIT 8,142 1,507 1,736 18,097 2,697 1,397 1,768 25,322
16 CONSOLIDATED INCOME STATEMENT AS OF MARCH 2014* (Thousands of Euros) Sacyr Construcción Somague Sacyr Concesiones Testa Valoriza Sacyr Industrial Holding and Adjustments TOTAL Turnover 180, , ,665 46, ,231 42,967 89, ,080 Other Sales 7,707 5, ,811 2, ,686 17,121 Total Income 187, , ,359 48, ,172 43,553 91, ,201 External and Operating Expenses 177, ,129 91,792 12, ,723 43,935 91, ,259 GROSS OPERATING PROFIT 10,000 9,853 19,567 36,778 14, ,942 Depreciation 3,605 2,580 3,870 7,514 7,136 1, ,424 Trade Provisions 1, , NET OPERATING PROFIT 7,580 7,587 14,308 28,866 7,577 2,220 1,055 62,643 Financial results 4,583 4,219 17, ,635 1,188 51,930 75,126 Results from equity accounted subsidiaries ,168 43,610 Provisions for financial investments , ,620 Change in value of financial instruments at fair value 0 0 1, ,244 Results from sales of non current assets 2, , , ,566 PROFIT BEFORE TAXES 9,593 3,455 18,331 27,562 5,731 4,041 8,800 51,830 Corporate Tax 2,722 2,053 12,993 8,682 2, ,680 13,468 PROFIT FOR CONTINUING ACTIVITIES 6,871 1,401 5,337 18,880 3,216 3,223 5,880 38,362 PROFIT FOR DISCONTINUING ACTIVITIES ,808 14,808 CONSOLIDATE RESULTS 6,871 1,401 5,337 18,880 3,216 3,223 8,928 23,554 Minorities NET ATTRIBUTABLE PROFIT 6,823 1,432 5,357 18,880 3,357 2,786 8,890 24,172 *Restated
17 CONSOLIDATED BALANCE SHEET AS OF MARCH 2015 (Thousands of Euros) Sacyr Construcción Somague Sacyr Concesiones Testa Valoriza Sacyr Industrial Holding and Adjustments TOTAL NON CURRENT ASSETS 307, ,544 3,384,323 3,095, , ,239 2,040,021 9,768,823 Intangible Assets ,294 2, ,893 Real Estate Investments ,015, ,037 1,841,074 Concessions Investments 49, ,304,979 46, , ,646,462 Fixed Assets 58,041 84,658 4, , ,970 3, ,048 Financial Assets 199,155 63,684 2,074,729 1,033, ,631 16,929 2,209,770 5,775,637 Other non Current Assets Goodwill 0 18, , ,207 CURRENT ASSETS 1,856, , ,091 42, , , ,012 3,274,504 Non current assets held for sale , ,938 Inventories 121,971 33,781 3, ,675 13, , ,311 Accounts Receivable 1,349, ,017 93,944 9, ,897 68, ,218 1,932,018 Financial Assets 288,191 31, ,084 6,862 14,317 7, , ,846 Cash 96,611 32, ,957 25,391 43,608 29,040 15, ,390 ASSETS = LIABILITIES 2,163, ,070 3,805,414 3,137,543 1,069, ,154 1,812,009 13,043,327 Equity 440, , ,309 1,407, ,003 69,602 1,329,130 1,559,771 Shareholder's Equity 436, , ,662 1,407, ,680 59,704 1,322,833 1,406,151 Minority Interests 3, , ,323 9,899 6, ,620 NON CURRENT LIABILITIES 495,528 62,000 2,675,466 1,544, ,207 76,131 2,385,249 7,559,142 Financial Debt 58,839 50,883 1,677,506 1,491, ,925 57,713 2,851,003 6,352,735 Financial Instruments at fair value ,764 6,820 23,149 3, ,485 Provisions 364, ,821 15,408 52,681 4, , ,132 Other non current Liabilities 72,466 11, ,374 30,467 79,451 10, , ,790 CURRENT LIABILITIES 1,227, , , , , , ,889 3,924,414 Liabilities associated with the non current assets held for sale , ,960 Financial Debt 109, , , , ,165 18, ,732 1,239,113 Financial instruments at fair value ,848 3,074 1,239 1, ,500 Trade Accounts Payable 784, ,601 20,222 4, ,952 64, ,746 1,481,877 Operating Provisions 242,243 27,210 3, ,259 2,880 9, ,246 Other current liabilities 91,582 46, ,228 10, ,724 13,643 3, ,719
18 CONSOLIDATED BALANCE SHEET AS OF DECEMBER 2014 (Thousands of Euros) Sacyr Construcción Somague Sacyr Concesiones Testa Valoriza Sacyr Industrial Holding and Adjustments TOTAL NON CURRENT ASSETS 272, ,429 2,448,378 3,118, , ,629 1,844,605 8,628,943 Intangible Assets ,344 1, ,913 Real Estate Investments ,020, ,719 1,846,596 Concessions Investments 50, ,050 46, , ,213,675 Fixed Assets 69,230 84,990 4, , ,629 3, ,039 Financial Assets 152,888 66,090 1,574,975 1,051, ,673 17,718 2,013,772 5,047,764 Other non Current Assets Goodwill 0 18, , ,311 CURRENT ASSETS 1,903, , ,448 48, , , ,025 3,148,819 Non current assets held for sale , ,623 Inventories 123,097 33,400 2, ,971 7, , ,356 Accounts Receivable 1,389, ,136 58,653 12, ,539 62, ,479 1,888,173 Financial Assets 272,084 31,209 74,090 14,075 20, , ,191 Cash 119,251 38,228 73,128 21,932 46,320 37,164 22, ,475 ASSETS = LIABILITIES 2,176, ,402 2,656,826 3,167,063 1,071, ,669 1,631,580 11,777,762 Equity 433, , ,286 1,383, ,642 66,452 1,485,575 1,326,074 Shareholder's Equity 430, , ,419 1,383, ,177 57,055 1,481,703 1,205,300 Minority Interests 3, , ,465 9,397 3, ,775 NON CURRENT LIABILITIES 476,597 60,112 1,649,279 1,604, ,318 72, ,162 4,318,315 Financial Debt 55,337 47, ,604 1,550, ,176 58, ,220 3,411,860 Financial Instruments at fair value ,095 8,335 22,649 3, ,704 Provisions 348, ,248 15,560 48,514 4, , ,248 Other non current Liabilities 73,172 12, ,332 30,506 78,979 6, , ,502 CURRENT LIABILITIES 1,265, , , , ,125 99,025 2,975,993 6,133,372 Liabilities associated with the non current assets held for sale , ,771 Financial Debt 83, , , , ,460 17,335 2,720,227 3,445,304 Financial instruments at fair value 0 0 9,324 2,250 1,186 1, ,231 Trade Accounts Payable 778, , ,872 5, ,909 65,309 54,402 1,604,984 Operating Provisions 107,096 28,313 2, ,802 2, , ,908 Other current liabilities 296,887 68, ,970 10, ,768 12, , ,174
19 SACYR CONSTRUCTION / SOMAGUE Thousands of Euros MARCH %Chg /14 Revenue % Spain % International % % International 73% 74% EBITDA % EBITDA Margin 4.8% 6.6% BACKLOG 5,114 4,988 3% International 4,318 4,152 4% % International Backlog 84% 83% 3 bp Revenue from the Construction business through 31 March 2015 totalled 368 million, This marks an increase of 22.3% compared with March The contribution of international revenue was steady at 73%. EBITDA performance compared with the first quarter of 2014 was affected by the slowdown of some Somague projects, in particular in Angola and Brazil. This impact will ease over the year thanks to the improvement of the macroeconomic situation in Angola and the entry into new markets such as Northern Ireland following the contract win for the University of Ulster. The construction backlog was up 3% year on year at 5,114 million at 31 March 2015, thanks to international contract wins.. The backlog covers 42 months of operations at current turnover rates.
20 INTERNATIONAL CONSTRUCTION Sacyr's international expansion strategy drove a 20% increase in international revenue, which on 31 March represented 73% of total construction revenue for this area, fuelled by contributions from major contract wins in Latin America and the Middle East. The international construction backlog represents 84% of the total backlog and increased by 2.5% in the first quarter. It includes four major contract wins: o A 190 million contract for construction of the second phase of the campus of the University of Belfast in Ulster awarded to the joint venture between Lagan Construction Group and Somague, marking the group's entry into a new market. Construction of the 250 million (approximately 318 million), 75,000 square metre Belfast campus began in 2014 and is expected to be completed in It is currently the largest building project in Northern Ireland and phase two will see two new blocks developed on York Street, directly opposite the existing campus building. o Construction of the Pumarejo Bridge over the Magdalena River in Barranquilla with a budget of 223 million and a 36 month deadline. o Construction of offices for the Angolan Ministry of Transport in Luanda, with a budget of 50 million and an 18 month deadline. o The upgrade of the "Ruta 7" toll road in Chaitén, Los Lagos, Chile, for 19 million.
21 VALORIZA Revenue at 31 March 2015 at Valoriza amounted to 176 million thanks to the increases in the Environment and Multiservices business. Total revenues fell slightly due to the Water business, mainly as a result of the disposal of water assets in Portugal in June 2014 (which therefore contributed revenues in the first half of 2014 and not in the first quarter of this year) and the completion of the construction works on a desalination plant, which were in full swing in the first quarter of (Thousands of Euros) MARCH % Chg /14 REVENUE 175, , % Medioambiente 73,813 73, % Multiservicios 71,300 64, % Agua 29,757 40, % Central 663 (56) 0.0% EBITDA 14,574 14, % Medioambiente 9,612 7, % Multiservicios 2,252 2, % Agua 1,695 3, % Central 1, % Margen Ebitda 8.30% 8.11% Valoriza's EBITDA totalled 15 million. This represents a 1% year on year increase, marking a turning point for the services businesses following the declines in previous quarters. The EBITDA margin widened to 8.30%.


22 Valoriza s backlog reached 6,202 million and 32% of it came from international business. Valoriza remains firmly committed to tendering activity in all its business areas both in Spain and abroad. The main wins in the first quarter were: A two year extension of the solid urban waste collection and cleaning contract for the city of Lérida worth 9 million. A 9 million contract with the savings bank CAM for maintenance of water mains, drinking water supply, wastewater treatment and remote control system and ornamental fountains. A 8 million contract for the comprehensive management of the senior citizen's home and day center in Villa del Prado, Madrid. A four year contract, worth more than 6 million, for the conservation of National Heritage listed Historic Gardens. A 8.9 million joint contract for the construction design, upgrade and expansion and also the operation and maintenance of Formentera s seawater desalination plant (IDAM) and its adjacent facilities. The contribution to revenue and the backlog by activity is as follows:
23 INDUSTRIAL Sacyr Industrial's revenue increased by 23% year on year in the first quarter to 53 million. This growth was fuelled by the organic growth of energy plants and the sharp increase in EPC revenue. EBITDA in the first quarter amounted to 4.4 million, leaving a margin of 8.3%. In the same period of 2014 EBITDA was negative largely as a result of the impact of the application of the new renewable energy regulations. (Thousands of Euros) MARCH % Chg /14 REVENUES 52,777 42,967 23% Energy 33,999 30,090 13% EPC 18,779 12,802 47% EBITDA 4,387 (382) Margin EBITDA 8.3% 0.9% BACKLOG (1Q2015 / 2H2014) 2,578 2,418 7% The backlog increased by 7% thanks to the business's volume of contract wins. This growth was due to the increase in the international backlog to 82%. Contract wins included: A 156 million contract to adapt the La Pamplilla refinery in Peru to new fuel specifications. A 12 million contract for two two electricity lines and three substations in Monterrey, Mexico.
24 In the quarter major contracts were also secured for the installation of geothermal systems at the Hotel Santa Marta and the refurbishment of Val Market in Valladollid. This major geothermal contract is worth a total of 1.5 million. One of the group's core businesses, Sacyr Industrial is engaged in intense commercial activity with a view to penetrating new markets (Australia, the US, Oman, Mexico, Peru and Bolivia). TESTA Testa's revenue amounted to 46.4 million in the first quarter of This represents a year on year increase of 0.6%, which is accompanied by 1.4% growth in EBITDA to 35 million. The EBITDA margin excluding gains on asset disposals was 75%. Of this amount, 45.1 million related to rental income on investment properties in operation and 1.3 million mostly to property management services. MARCH % Chg. (Thousands of euros) /14 Revenue 46,354 46, % EBITDA 34,960 36, % EBITDA (*) 34,960 34, % Net Profit 18,096 18, % EBITDA Margin (*) 75% 75% 0.0 pp Leseable Area (Thousands of m2) 1,346 1, % Ocupation Rate (Rentals) 96% 97% 1.0% (*) Exlcuding gains on sales
25 The market value of Testa assets according to an independent appraiser reached 3,180 million at 31 December This assessment assumes unrecorded implicit capital gains of 1,054 million and is 1.4% higher than at December 2013 (the same in surface area). GAV (Millions of euros) GAV 31/12/2013 3,287 Assets sold in Increase in asset value 59 GAV 31/12/2014 3,180 Like for like revenue advanced 0.4% compared with 31 March This is a positive performance bearing in mind that since July 2014 the CPI, the main index to which the annual renewals of most of the Testa Group's lease contracts are linked, has been negative. REVENUES (Thousands of euros) 31/03/ /03/2014 Chg. % Buildings for rentals 45,085 44, % Offices 26,291 26, % Hotels 6,420 6, % Shopping centres 6,726 6, % housing 2,851 2, % Industrial premises 2,303 2, % Residences % Car Parks % Income from services 1,269 1, % LFL Revenue 46,354 46, % Cancellation of linear revenue of Hotel 0 1,856 1,856 Surface rehabilitation 0 1,452 1,452 Assets sold in 2014 Conde de Xiquena Madrid residence REVENUE 46,354 46, %
26 Within the variations by sector it is worth noting the increase in industrial turnover arising from the lease signed for the Pedrola logistics centre in Zaragoza. This centre has an area of 21,579 m2 and was unoccupied in the first quarter of The most important adjustments to like for like revenue in the first quarter relate to: the cancellation in the first quarter of 2014 of the lease for a hotel in Madrid's Plaza de Castilla, whose linear revenues pending allocation to earnings were cancelled as a result. This cancellation resulted in a one off negative impact on revenue and EBITDA of 1,856 thousand. The company now has a new lessee/operator for this hotel. The complete refurbishment of the Partenón 12 building (in Campo de las Naciones, Madrid) with a leasable area of 18,343 square metres. This asset was leased in the first quarter of 2014 and is currently unoccupied. The project is scheduled for completion at the end of September and marketing work is currently underway. SACYR CONCESIONES Sacyr Concesiones' revenue stood at 133 million at 31 March 2015, 20% higher year onyear due to: the change in the consolidation method (from equity to full consolidation) for eight concessions in Spain due to changes in company control, with an impact of 20 million on revenue. the upturn in traffic on the concessions in operation, the inauguration of the Rutas del Desierto motorway at the end of 2014 (which means it did not contribute to revenue in the first quarter of 2014). the progress made by concessions in Chile.
27 the establishment in April 2014 of Convial de la Sierra, the concessionaire for the Longitudinal de la Sierra motorway in Peru (which means it did not contribute to revenue in the first quarter of 2014). Thousands of euros MARCH % Var % Var** ** 15/14 15/14 Revenue 132, , , % -1.9% Revenue from construction* 69,333 80,933 80, % -14.3% Revenue from concessions 63,364 29,732 54, % 16.6% EBITDA 44,001 19,567 37, % 16.8% EBIT 32,270 14,308 EBITDA Margin 69.4% 65.8% 69.3% 3.6 pp 0.1 pp *Includes construction by the concessions operator pursuant to IFRIC 12, excluding the effect of EBITDA, since revenue is the same as the construction business costs. ** Restated (Includes the effect of 8 concessions accounting by global method) The EBITDA generated reached 44 million, and the gross margin of this activity reached 69.4% of turnover, an improvement on the margin of 65.8% in the same period of The impact on EBITDA of the concessions consolidated using the full method in 2015 amounted to 15.7 million. Traffic on our motorways continued to perform well, with the growth that started on our Spanish concessions in 2014 continuing. Especially noteworthy is the growth of traffic on the Guadalmedina motorway in Malaga:
28 REVENUE AS OF MARCH ADT MARCH Var. (%) Var. (%) AUTOVÍA DEL TURIA 2, ,050 33, % AUTOVÍA NOROESTE C.A.R.M. 1, ,866 10, % VIASTUR 1,660 1, % 21,883 21, % PALMA MANACOR 2, ,603 17, % AUTOVÍA DEL BARBANZA 3,717 3, % 11,426 10, % AUTOVÍA DEL ERESMA 1,396 1, % 6,532 6, % AUTOVÍA DEL ARLANZÓN 6, ,984 16, % NEOPISTAS % INTERCAMBIADOR DE MONCLOA 3, INTERCAMBIADOR DE PLAZA ELÍPTICA 1, AUTOPISTA DE GUADALMEDINA 2,038 1,509-8,056 5, % HOSPITAL DE PARLA 3,292 2, % HOSPITAL DE COSLADA 3,442 2, % SACYR CONCESIONES % AEROPUERTO DE MURCIA CONCESIONARIA AEROPUERTO DE MURCIA CONCESIONARIA # REF! ESPAÑA 33,550 13, % 128, , % AUTOPISTAS DEL VALLE (San José - San Ramón) 0 0 # DIV/0! COSTA RICA IRLANDA % 8,951 8, % PORTUGAL 5,337 5, % CHILE 20,648 11, % 12,583 6, % PERU 3, TOTAL (without construction revenue) 63,364 29, % 149, , % CONSTRUCTION REVENUE 69,333 80, % TOTAL 132, , % At 31 March 2015, Sacyr Concesiones had interests in 32 concessions distributed in six countries, of which 23 are currently operating and nine are under construction. Of the total of 32 concessions, 21 are motorway and road concessions in the EU and America (11 in Spain, six in Chile, one in Italy, one in Portugal, one in Ireland and one in Peru) and the remaining 11 are other types of concessions: - Hospitals: Sacyr Concesiones has consolidated its position as a benchmark in hospital concessions, with seven hospitals at present, three in the Madrid area, three in Portugal and one in Chile. - Transport hubs: Sacyr Concesiones operates two of the five transport hub concessions in the Madrid area, with annual volume of over 35 million passengers between the two. - Metro lines: metro line in Tenerife - International Airport for the region of Murcia. The assets are in their first years of operation, and have a huge scope for generating value in the future. The average remaining life of the concessions is over 25 years.
29 VII. STOCK MARKET PERFORMANCE MARCH % Chg SACYR /14 Market Price at closing (euros per share) % High share price % Low share price % Market Capitalization at closing (Thousands of euros) 1,963,148 2,420, % Average Trading Volume (Thousands of euros) 1,936,348 2,361, % Average Daily Trading Volume (Number of shares) 8,378,976 9,449, % Liquidity (%) Number of shares (Thousands) 502, , % Share Nominal Value 1 EURO 1 EURO
30 VIII. SHAREHOLDER STRUCTURE Significant shareholders in Sacyr, S.A on the date of presentation of this information were as follows: SHAREHOLDER %Total D. Manuel Manrique Cecilia 5.3% Cymofag, S.L. 5.3% DISA. Demetrio Carceller Arce 12.1% D. José Manuel Loureda Mantiñán 7.8% Prilou, S.L. 3.2% Prilomi, S.L. 4.6% Grupo Corporativo Fuertes, S.L 5.8% Beta Asociados, S.L. 5.1% Taube Hodson Stonex Partners LLP 4.6% Grupo Satocan, S,A. 2.6% TOTAL SIGNIFICANT SHAREHOLDINGS 43.3%
31 For more information, please contact: Department of Investor Relations Tel: ir@sacyr.com
Resultados Results. First Quarter May Sacyr Vallehermoso
 Resultados 2012 Results First Quarter 2014 14 May 2014 Sacyr Vallehermoso 1 HIGHLIGHTS 1. Operating performance 2. Corporate business 3. Share price trend 4. Reduction of financial debt Sacyr Vallehermoso
I. THIRD QUARTER HIGHLIGHTS 2 II. INCOME STATEMENT 5 III. BACKLOG 10 IV. CONSOLIDATED BALANCE SHEET 12 V. PERFORMANCE BY BUSINESS AREA 16
 - 1 - I. THIRD QUARTER HIGHLIGHTS 2 II. INCOME STATEMENT 5 III. BACKLOG 10 IV. CONSOLIDATED BALANCE SHEET 12 V. PERFORMANCE BY BUSINESS AREA 16 VI. STOCK MARKET PERFORMANCE 32 VII. SHAREHOLDER STRUCTURE
2012 results. Results. Second Half February Sacyr Vallehermoso 1
 Results Second Half 2013 28 February 2014 Sacyr Vallehermoso 1 HIGHLIGHTS 1. Operating performance 2. Corporate business 3. Share price trend 4. Reduction of financial debt Sacyr Vallehermoso 2 Operating
Second half results 29 February 2012
 Second half results 29 February 2012 Second half results 2011 highlights 2011 results Business areas Appendices Sacyr Vallehermoso 2 2011 highlights Business areas INTERNATIONAL activity in core businesses
Third quarter results. 15 November 2010
 Third quarter results 15 November 2010 1 Period operatives keys Analysis of 3Q10 results Business areas Appendices 2 Period operative keys SyV third quarter results reflect the advancement made in: INTERANTIONAL
T h i r d Q u a r t e r 13 N o v e m b e r Q2017 Presentation of Results
 RESULTS 2017 T h i r d Q u a r t e r 13 N o v e m b e r 2017 Table of Contents HIGHLIGHTS OPERATIONAL EVOLUTION PERFORMANCE BY BUSINESS AREAS ANNEXES 2 Highlights 9M 2017 Revenue +4%. EBITDA +4% (Concessions
Results 3Q November 2016
 Results 3Q 2016 10 November 2016 3Q2016 Presentation of Results 1 CONTENTS 1. Highlights 2. Operational Development 3. Performance by Business Area 4. Annexes 3Q2016 Presentation of Results 2 Highlights
First half Results 29 July 2011
 First half Results 29 July 2011 First Half Results Period highlights 1H11 results Business areas Appendices Sacyr Vallehermoso 2 First Half of 2011 Reduction of financial exposure concluded CAPITALIZATION:
SACYR REPORTS EBITDA OF 155 MILLION (+50%) IN THE FIRST HALF
 IN THE FIRST HALF") PRESS RELEASE Debt down 3,600 million following sale of Testa SACYR REPORTS EBITDA OF 155 MILLION (+50%) IN THE FIRST HALF International construction revenue represents 72% of the total, while the Group
PRESS RELEASE Debt down 3,600 million following sale of Testa SACYR REPORTS EBITDA OF 155 MILLION (+50%) IN THE FIRST HALF International construction revenue represents 72% of the total, while the Group
FINANCIAL REPORT. First Quarter
 FINANCIAL REPORT First Quarter I. FIRST QUARTER HIGHLIGHTS 2 II. INCOME STATEMENT 6 III. BACKLOG 9 IV. CONSOLIDATED BALANCE SHEET 11 V. PERFORMANCE BY BUSINESS AREA 14 VI. STOCK MARKET PERFORMANCE 30 VII.
SACYR REPORTS EBITDA OF 318 MILLION (+33%) AND ITS TURNOVER INCREASES BY 8.5%
 AND ITS TURNOVER INCREASES BY 8.5%") PRESS RELEASE The group achieves net profits of 370 million SACYR REPORTS EBITDA OF 318 MILLION (+33%) AND ITS TURNOVER INCREASES BY 8.5% International construction revenue represents 75% of the total,
PRESS RELEASE The group achieves net profits of 370 million SACYR REPORTS EBITDA OF 318 MILLION (+33%) AND ITS TURNOVER INCREASES BY 8.5% International construction revenue represents 75% of the total,
SACYR INCREASES ITS INTERNATIONAL BUSINESS AND EARNS 83 MILLION EUROS TO SEPTEMBER
 PRESS RELEASE International construction revenues account for 70% SACYR INCREASES ITS INTERNATIONAL BUSINESS AND EARNS 83 MILLION EUROS TO SEPTEMBER The order book grows 20% Sacyr Industrial's portfolio
Letter from the. Chairman
 2016 Integrated Report Sacyr 24 Letter from the Chairman 30th Anniversary of Sacyr. Madrid, November 2016 1. Chapter 1.0. Letter from the Chairman 25 Letter from the Chairman G4-1, G4-13 2016 Integrated
28 F e b r u a r y Presentation of Results
 RESULTS 2017 28 F e b r u a r y 2 0 1 8 Table of Contents HIGHLIGHTS OPERATIONAL DEVELOPMENT PERFORMANCE BY BUSINESS AREAS ANNEXES 2 Highlights Financing closing of Pedemonana Veneta highway. Corporate
SACYR EARNS A NET PROFIT OF 120 MILLION EUROS IN 2016
 PRESS RELEASE EBITDA increases 13% to 360 million SACYR EARNS A NET PROFIT OF 120 MILLION EUROS IN 2016 Madrid, 27th February 2017.- The Sacyr Group achieved a net profit of 120.2 million in 2016. EBITDA
sacyr.com Results 2018 First Quarter
 sacyr.com Results 2018 First Quarter 10 May 2018 Table of Contents Highlights Operational Development Performance by Business Area Annexes Highlights Increase in Revenues +13%. Revenue increases in all
Results Second Half February 2017
 Results Second Half 2016 27 February 2017 2016 Presentation of Results 1 TABLE OF CONTENTS 1. Highlights 2. Operational Development 3. Performance by Business Area 4. Annexes 2016 Presentation of Results
sacyr.com 10 May 2018
 Results 2018 First Quarter 10 May 2018 I. Highlights of first quarter 2018 2 II. Income statement 7 III. Backlog 9 IV. Consolidated balance sheet 12 V. Performance by business area 15 VI. Stock market
FINANCIAL REPORT Third Quarter
 FINANCIAL REPORT 2017 Third Quarter I. HIGHLIGHTS FOR THE FIRST NINE MONTHS 2 II. INCOME STATEMENT 7 III. BACKLOG 10 IV. CONSOLIDATED BALANCE SHEET 12 V. PERFORMANCE BY BUSINESS AREA 15 VI. STOCK MARKET
Fostering constructive ideas. 05 Q1 Results and strategic development. June, 2005
 Fostering constructive ideas 05 Q1 Results and strategic development June, 2005 Contents 1 2 Q1 Results Highlights Business Areas Strategic Development Strategic Development by Area 04/07 Forecast 2 Contents
sacyr.com Results 2018 First Half
 sacyr.com Results 2018 First Half 27 July 2018 Table of Contents Highlights Operational Development Performance by Business Area Annexes Highlights Operational Growth Increase in Revenues +18% Revenue
FINANCIAL REPORT Second Half
 FINANCIAL REPORT 2017 Second Half I. 2017 HIGHLIGHTS 2 II. INCOME STATEMENT 10 III. BACKLOG 13 IV. CONSOLIDATED BALANCE SHEET 15 V. PERFORMANCE BY BUSINESS AREA 18 VI. STOCK MARKET PERFORMANCE 37 VII.
GROUP OVERVIEW BUSINESS AREAS INVESTMENTS SOCIAL RESPONSIBILITY
 GLOBAL INNOVATION GROUP OVERVIEW BUSINESS AREAS INVESTMENTS SOCIAL RESPONSIBILITY 2 GROUP OVERVIEW COMPANY OVERVIEW Sacyr is a diversified group with international recognition and encompassing four areas
sacyr.com Results 2018 Third Quarter
 sacyr.com Results 2018 Third Quarter 8 November 2018 Table of Contents Highlights Operational Development Performance by Business Area Annexes Highlights Operational Growth Increase in Revenues +20% Revenue
Sacyr Vallehermoso STRATEGY AND 2004 CLOSING FORECAST. Madrid, 29 October 2004
 Sacyr Vallehermoso STRATEGY AND 2004 CLOSING FORECAST Madrid, 29 October 2004 Contents Market Situation Strategy 2004 Earnings and Prospects 2 Market Situation Market Situation: Macroeconomic Outlook MACROECONOMIC
sacyr.com Results 2018
 sacyr.com Results 2018 28 February 2019 Table of Contents Strategic Plan 2015-2020 Highlights 2018 Operational Development 2018 Performance by Business Area 2018 Annexes Strategic Plan 2015 2020 (I) 2015-2018
Infrastructure. Services 3Q2011 EARNINGS REPORT. Energy
 Infrastructure 3Q2011 EARNINGS REPORT Services Energy 1. HIGHLIGHTS 2 2. EXECUTIVE SUMMARY 3 3. SUMMARY BY BUSINESS AREA 4 4. INCOME STATEMENT 6 5. BALANCE SHEET 9 6. CASH FLOW 12 7. BUSINESS PERFORMANCE
sacyr.com 27 July 2018
 Results 2018 First Half 27 July 2018 I. Highlights of first half 2018 2 II. Income statement 9 III. Backlog 13 IV. Consolidated balance sheet 15 V. Performance by business area 18 VI. Stock market performance
sacyr.com Results 2018 Third Quarter
 Results 2018 Third Quarter 8 November 2018 I. Highlights January-September 2018 2 II. Income statement 8 III. Backlog 11 IV. Consolidated balance sheet 13 V. Performance by business area 16 VI. Stock market
I. HIGHLIGHTS II. STATEMENT OF INCOME AND CONSOLIDATED BALANCE SHEET 3 III. BUSINESS AREA PERFORMANCE 14 IV. BOARD RESOLUTIONS 28
 I. HIGHLIGHTS OPERATING DATA 1 ECONOMIC FINANCIAL DATA 2 II. STATEMENT OF INCOME AND CONSOLIDATED BALANCE SHEET 3 III. BUSINESS AREA PERFORMANCE 14 IV. BOARD RESOLUTIONS 28 V. STOCK PERFORMANCE 31 VI.
II. STATEMENT OF INCOME AND CONSOLIDATED BALANCE SHEET 3 III. BUSINESS AREAS PERFORMANCE 14 IV. BOARD RESOLUTIONS 27 V. STOCK PERFORMANCE 29
 I. HIGHLIGHTS OPERATING DATA 1 ECONOMIC-FINANCIAL DATA 2 II. STATEMENT OF INCOME AND CONSOLIDATED BALANCE SHEET 3 III. BUSINESS AREAS PERFORMANCE 14 IV. BOARD RESOLUTIONS 27 V. STOCK PERFORMANCE 29 VI.
sacyr.com Challenge Success
 sacyr.com Challenge Success Group overview 2 Group overview We are a global group that welcomes and embraces any challenge to transform society. We work in 30 countries worldwide to improve the infrastructure
3. Consolidated income statement. 4. Business performance Acciona Infrastructure Acciona Real Estate
 Contents 1. Key financials 2. Acquisition of 21% of Endesa 3. Consolidated income statement 4. Business performance 4.1. Acciona Infrastructure 4.2. Acciona Real Estate 4.3. Acciona Energy 4.4. Acciona
5. The financial management in 2017
 5. The financial management in 2017 5.1. Consolidated FinanCial statements 5.2. Consolidated balance sheet of the acs Group 5.3. net Cash Flows of the acs Group 5.4. areas of activity evolution: ConstruCtion
2. Acquisition of 10% of Endesa. 3. Consolidated income statement. 4. Business performance Acciona Infrastructure Acciona Real Estate
 Contents 1. Key points 2. Acquisition of 10% of Endesa 3. Consolidated income statement 4. Business performance 4.1. Acciona Infrastructure 4.2. Acciona Real Estate 4.3. Acciona Energy 4.4. Acciona Logistics
Abertis' results reach 1,880Mn in 2015
 2015 ANNUAL RESULTS Abertis' results reach 1,880Mn in 2015 Net profit rises 7% on a comparable basis, stripping out extraordinary impacts In 2015 extraordinary impacts affected the Group: o 4,378Mn revenues,
2. Consolidated income statement Acciona Infrastructure Acciona Real Estate Acciona Logistics & Transport Services
 Contents 1. Key financials 2. Consolidated income statement 3. Business Divisions 3.1. Acciona Infrastructure 3.2. Acciona Real Estate 3.3. Acciona Energy 3.4. Acciona Logistics & Transport Services 3.5.
Profile of the Group in 2015
 A 0 Profile of the Group in 2015 Obrascón Huarte Lain (OHL) ranks among the leading international concession and construction groups, with more than 100 years of experience and an outstanding presence
Abertis' profit totals 1,677Mn, the best results in its history
 1H15 RESULTS Abertis' profit totals 1,677Mn, the best results in its history The Board approves a share buyback program of 6.5% of shares through a tender offer with a premium on the share quotation. Unlocking
2004 RESULTS. February 28 th, 2005
 2004 RESULTS February 28 th, 2005 Year 2004 Summary 2004 Consolidated Results 2004 Consolidated Balance Sheet Business area analysis Conclusions 2004 has been a Relevant Year for the ACS Group OPERATING
INFRASTRUCTURE. Management. Report 2008 SERVICES CEMENT ENERGY
 INFRASTRUCTURE Management SERVICES Report 2008 CEMENT ENERGY 1. HIGHLIGHTS 2 2. EXECUTIVE SUMMARY 4 3. SUMMARY BY BUSINESS AREA 5 4. INCOME STATEMENT 7 5. BALANCE SHEET 11 6. CASH FLOW 13 7. BUSINESS PERFORMANCE
The world s leading infrastructure developer. April 2012
 The world s leading infrastructure developer Investors Presentation Company profile, strategy and key financials April 2012 Grupo ACS The world s leading infrastructure developer Engineering contractor
5.3 Human Resources. Strategy and resources. Description of the Workforce:
 Sacyr 5.3 Human Resources AVERAGE CONSOLIDATED WORKFORCE DISTRIBUTION BY COUNTRY The Sacyr Human Resources Department, through its Personnel Administration, Human Resources Development, Recruitment, and
Presentation of the Group
 The world s leading infrastructure developer Presentation of the Group Key figures & Global Strategy July 2012 Grupo ACS The world s leading infrastructure & concessions developer Engineering contractor
QUARTERLY REPORT SEPTEMBER 30, 2016
 QUARTERLY REPORT SEPTEMBER 30, 2016 Table of Contents Page Presentation of Financial Information... ii Summary of Financial Information... 1 Business Overview... 3 Factors affecting the comparability of
REPSOL POSTS NET INCOME OF BILLION EUROS
 FULL YEAR 2012 EARNINGS PRESS RELEASE Madrid, 28 February 2013 Pages 9 Production rises 11% and the reserve replacement ratio reaches a record 204% REPSOL POSTS NET INCOME OF 2.060 BILLION EUROS Net income
AP 46. Las Pedrizas motorway. Málaga
 AP 46. Las Pedrizas motorway. Málaga THE SACYR VALLEHERMOSO GROUP GROUP PROFILE With an average headcount of over 20,210 employees, revenue of 4.82 billion, and an order book in excess of 51 billion the
ACS gains 388 million euros of net profit in the first half of 2016
 ACS gains 388 million euros of net profit in the first half of 2016 Sales reached 16,387 million euros, 5.3% lower in a like for like basis adjusted by currency impacts and the sale of renewable assets
on 12/14/2009 at 2:05 PM Labrador a4-bc9f-4b81-89f6-657b075eb230
 on 12/14/2009 at 2:05 PM CONTENTS 1. KEY FINANCIAL FIGURES 2. CONSOLIDATED INCOME STATEMENT 3. RESULTS BY DIVISION 3.1. ACCIONA Energy 3.2. ACCIONA Infrastructures 3.3. ACCIONA Real Estate 3.4. ACCIONA
ACS accounts in the first nine months of 2015 for a net profit of 574 euro million
 ACS accounts in the first nine months of 2015 for a net profit of 574 euro million Sales reaches 26,366 euro million, up to 3.6% Net debt drops by 34% down to 3,880 euro million. Grupo ACS Results Euro
Con experiencia probada
 Con experiencia probada ECONOMIC AND FINANCIAL REPORT OF ACS GROUP 2012 www.grupoacs.com Con experiencia probada Cover photo: Administrative Building (Salamanca, Spain). ECONOMIC AND FINANCIAL REPORT OF
REPSOL S NET INCOME RISES 15%
 Corporate Division of Communication Paseo de la Castellana, 278-280 28046 Madrid Spain Tel. (34) 913 488 100 (34) 913 488 000 Fax (34) 913 142 821 (34) 913 489 494 www.repsol.com Madrid, November 13th
Ezentis increases its EBITDA by 142,3% in the first nine months of the year up to 16,4 million Euros
 Results Presentation Ezentis increases its EBITDA by 142,3% in the first nine months of the year up to 16,4 million Euros The revenue of the Company increased by 30% up to 228,5 million Euros thanks to
Banco Santander attributable profit rose 22% to EUR billion in the first quarter of 2008
 Press Release Banco Santander attributable profit rose 22% to EUR 2.206 billion in the first quarter of 2008 The efficiency ratio stood at 41.9%, an improvement of 4.4 percentage points from a year earlier
COMPANY PROFILE. ACCIONA, sustainable development as a factor for leadership
 COMPANY PROFILE ACCIONA is one of the world's leading companies in terms of sustainability, standing out especially for its drive to develop renewable energies, infrastructures, water and services, placing
Environmental 2017 EARNINGS REPORT. Water. Infrastructures
 Environmental 2017 EARNINGS REPORT Water Infrastructures 1) SIGNIFICANT EVENTS 2 2) EXECUTIVE SUMMARY 3 3) SUMMARY BY BUSINESS AREA 4 4) INCOME STATEMENT 5 5) BALANCE SHEET 10 6) CASH FLOW 13 7) BUSINESS
THE FINANCIAL MANAGEMENT
 INTEGRATED REPORT 5 101 THE FINANCIAL MANAGEMENT 5.1 Consolidated Financial Statements 5.2 Consolidated balance sheet of the ACS Group 5.3 Net cash flows of the ACS Group 5.4 Areas of activity evolution:
Ordinary General Shareholders' Meeting of
 Ordinary General Shareholders' Meeting of 8 May 2018 Speech by the CEO Marcelino Fernández Verdes Introduction Fellow shareholders, good morning and many thanks for attending this General Shareholders'
COMPANY PROFILE ACCIONA INTEGRATES SUSTAINABILITY AS A DRIVER OF CHANGE AND PROGRESS VALUES MISSION VISION VALUE GENERATION
 10 COMPANY PROFILE COMPANY PROFILE VALUE GENERATION ACCIONA is a global company with a business model based on sustainability. Its aim is to respond to society s main needs through the provision of renewable
Grupo ACS net profit in 2011 totals EUR 962 million
 Grupo ACS net profit in 2011 totals EUR 962 million Turnover grew up to EUR 28,472 million, a 98.7% increase. International turnover now accounts for 72.5% of the total. The Grupo ACS ordinary net profit
Abertis reports 10% growth in like-for-like net profit to 718Mn in January-September
 9M16 RESULTS Abertis reports 10% growth in like-for-like net profit to 718Mn in January-September The Group has gradually increased the average life of its concessions by extending terms and is exploring
Gas Natural Fenosa posts net profit of 793 million euros and EBITDA of 3.14 billion euros up until September
 Press Room Spain Press releases Home / News / Press releases / Content in detail Gas Natural Fenosa posts net profit of 793 million euros and EBITDA of 3.14 billion euros up until September The annual
Sacyr Group (Sacyr S.A. and Subsidiaries) Consolidated Financial Statements and Consolidated Management Report AT 31 DECEMBER 2014 together with
 Consolidated Financial Statements and Consolidated Management Report AT 31 DECEMBER 2014 together with") Sacyr Group (Sacyr S.A. and Subsidiaries) Consolidated Financial Statements and Consolidated Management Report AT 31 DECEMBER 2014 together with THE AUDITORS' REPORT ON THE CONSOLIDATED FINANCIAL STATEMENTS
Sacyr Group (Sacyr S.A. and Subsidiaries) Consolidated Financial Statements and Consolidated Management Report AT 31 DECEMBER 2014 together with THE AUDITORS' REPORT ON THE CONSOLIDATED FINANCIAL STATEMENTS
SACYR, S.A. AND SUBSIDIARIES Consolidated Financial Statements and Consolidated Management Report for the year ended December 31, 2016
 Independent Audit Report SACYR, S.A. AND SUBSIDIARIES Consolidated Financial Statements and Consolidated Management Report for the year ended December 31, 2016 Translation of a report and consolidated
DIRECTORS REPORT PART I
 DIRECTORS REPORT PART I Directors Report Financial highlights 24 ANNUAL REPORT 2017 The following tables show the Group s adjusted key financial indicators for 2017 compared to the previous year. Adjustments
RESULTS 9M12. MADRID, 14 NOVEMBER
 RESULTS MADRID, 14 NOVEMBER 2012 www.indra.es CONTENTS 1. Introduction - 3 2. Main Figures - 6 3. Analysis of Revenues and Commercial Activity - 7 3.1. Analysis by Segment - 8 3.2. Analysis by Vertical
Grupo Isolux Corsán, S.A. and its subsidiaries. Consolidated financial information for the nine month period ended September 30, 2014 (unaudited)
") Consolidated financial information for the nine month period ended September 30, 2014 (unaudited) CONSOLIDATED INTERIM BALANCE SHEET (unaudited) For the period ended September 30, 2014 (Amounts in thousand
Consolidated financial information for the nine month period ended September 30, 2014 (unaudited) CONSOLIDATED INTERIM BALANCE SHEET (unaudited) For the period ended September 30, 2014 (Amounts in thousand
REPSOL POSTS ADJUSTED NET INCOME OF 1.86 BILLION EUROS
 2015 RESULTS Press release Madrid, February 25 th, 2016 7 pages Following impairments of 2.957 billion euros, net income was -1.227 billion euros REPSOL POSTS ADJUSTED NET INCOME OF 1.86 BILLION EUROS
April 2015 A LEADING TECH COMPANY
 April 2015 A LEADING TECH COMPANY This presentation has been produced by Indra for the sole purpose expressed therein. Therefore, neither this presentation nor any of the information contained herein constitutes
-8.7 % +1.5 % -5.3 % % %
 24 A BUSINESS WITH A PURPOSE I 2017 MILESTONES MILESTONES IN 2017 Consolidation of results 2015 SOLID BASIS FOR 2016 SUSTAINED GROWTH CHANGE OF TREND WITH AN INCREASE IN CAPEX OTHER BUSINESSES 7 % 42 %
Environmental 9M2018 EARNINGS REPORT. Water. Infrastructures
 Environmental 9M2018 EARNINGS REPORT Water Infrastructures 1. SIGNIFICANT EVENTS 2 2. EXECUTIVE SUMMARY 3 3. SUMMARY BY BUSINESS AREA 4 4. INCOME STATEMENT 5 5. BALANCE SHEET 10 6. BUSINESS PERFORMANCE
Astaldi, the BoD approves the quarterly report at September 30, 2006
 Astaldi, the BoD approves the quarterly report at September 30, 2006 Total revenues of 766.6 million Group net profit for the first nine months of 2006 of 22.6 million Total orders backlog of over 8 billion
COMISIÓN NACIONAL DEL MERCADO DE VALORES Paseo de la Castellana, Madrid. Madrid, 13 de mayo de Muy Sres. nuestros:
 COMISIÓN NACIONAL DEL MERCADO DE VALORES Paseo de la Castellana, 19 28046 Madrid Madrid, 13 de mayo de 2013 Muy Sres. nuestros: ACCIONA adjunta presentación en ingles que se seguirá en la multiconferencia
Environmental Services 1Q2015 EARNINGS REPORT. Water. Infrastructures
 Environmental Services 1Q2015 EARNINGS REPORT Water Infrastructures 1) HIGHLIGHTS 2 2) EXECUTIVE SUMMARY 3 3) SUMMARY BY BUSINESS AREA 4 4) INCOME STATEMENT 5 5) BALANCE SHEET 9 6) CASH FLOW 12 7) BUSINESS
ACS accounts in the first quarter of 2015 for a net profit of 207 euro million
 ACS accounts in the first quarter of 2015 for a net profit of 207 euro million Sales grow by 6% up to 8,570 euro million. 80.2% of total sales accounted from international activities. Grupo ACS Results
2014 Results Presentation
 2014 Results Presentation Madrid, March 2 nd 2015 Finance Department Investor Relations 1 Disclaimer This document may contain forward-looking statements regarding intentions, expectations or predictions
An Inflexion Point in the Company 1H 2015 RESULTS PRESENTATION. Madrid, 22 nd July 2015
 An Inflexion Point in the Company 1H 2015 RESULTS PRESENTATION Madrid, 22 nd July 2015 Disclaimer In addition to figures prepared in accordance with IFRS, PRISA presents non-gaap financial performance
REPSOL NET INCOME RISES 28% TO BILLION EUROS
 RESULTS FOR JANUARY-SEPTEMBER 2014 PRESS RELEASE Madrid, 6 November 2014 5 pages The company's debt falls to a historical low at the same time as the company generates a significant amount cash REPSOL
Madrid, February 25 th, 2011
 Madrid, February 25 th, 2011 This document contains forward-looking statements on the intentions, expectations or forecasts of Grupo ACS or its management at the time the document was drawn up and in reference
2010 Q1 RESULTS. Conference call - May 12, 2010
 2010 Q1 RESULTS Conference call - May 12, 2010 Q1 2010 Results Overview The Group continues to perform well even in the midst of a negative scenario Total revenues: +6.9% at EUR 460.7mn EBITDA:+10.5% at
achievements challenges into Turning 2016 Financial Report
 Turning challenges into achievements 2016 Financial Report 2016 Financial Report Contents 2016 Financial Report 2 1 2016 Financial Report 7 CONSOLIDATED STATEMENT OF FINANCIAL POSITION 8 SEPARATE CONSOLIDATED
INDRA POSTED NET PROFIT OF 70 MILLION EUROS IN 2016
 In 2015, Indra posted losses of -641m, due to extraordinary adjustments INDRA POSTED NET PROFIT OF 70 MILLION EUROS IN 2016 It s worth highlighting the strong cash generation ( +184m) thanks to the improvement
Environmental Services 1H2015 EARNINGS REPORT. Water. Infrastructures
 Environmental Services 1H2015 EARNINGS REPORT Water Infrastructures 1) HIGHLIGHTS 2 2) EXECUTIVE SUMMARY 3 3) SUMMARY BY BUSINESS AREA 4 4) INCOME STATEMENT 5 5) BALANCE SHEET 9 6) CASH FLOW 12 7) BUSINESS
1 Executive Summary Main figures Relevant facts 5. 2 Consolidated Financial Statements 7
 INDEX 1 Executive Summary 3 1.1. Main figures 3 1.2. Relevant facts 5 2 Consolidated Financial Statements 7 2.1 Income Statement 7 2.1.1 Sales and Backlog 8 2.1.2 Operating Results 10 2.1.3 Financial Results
Q SALES AND RESULTS
 Q1 2018 SALES AND RESULTS 9 th May 2018 1 Q1 2018 Main Financial Aspects Solid revenue growth of +4.9% (+6.8% at constant exchange rates) reaching 345m (+ 16m) in the first quarter of the year. In the
ACS gains 233 million euros, 6% more, in the first quarter of 2017
 ACS gains 233 million euros, 6% more, in the first quarter of 2017 Sales increased by 11.2% up to 8,357 million euros Backlog increases by 15.0% up to 68,092 million euros in March 2017 Net debt decreases
Strategic Review Financial Highlights. Business opportunities. Results by business
 March 2004 Strategic Review 2003 Financial Highlights Business opportunities Results by business Conclusions A Construction & Services Market Reference # 1 in Spanish Construction # 1 in Industrial Services
January-December Grupo PRISA results. January-December
 Grupo PRISA 2003 results January-December JANUARY-DECEMBER 2003 RESULTS PROFIT BEFORE TAXES OF PRISA INCREASED BY 64%, UP TO 86 MILLION Revenues increased by 7%, up to 1,305 million, EBIT came in at 136
FIRST HALF 2012 RESULTS
 Press Release FIRST HALF 2012 RESULTS Santander registered attributable net profit of EUR 1.704 billion (-51%), after covering 70% of real estate provisions required by the latest Spanish regulations Pre-provision
REPSOL POSTS NET INCOME OF BILLION EUROS
 Tel.: +34 91 753 87 87 FIRST-HALF EARNINGS PRESS RELEASE Madrid, 26 July 2012 9 pages REPSOL POSTS NET INCOME OF 1.036 BILLION EUROS Net income, excluding YPF, fell 14.6% to 903 million euros due to the
REPSOL POSTS ADJUSTED NET INCOME OF 572 MILLION EUROS
 FIRST QUARTER RESULTS 2016 Press release Madrid, May 5 th, 2016 5 pages REPSOL POSTS ADJUSTED NET INCOME OF 572 MILLION EUROS Repsol s business units (Upstream and Downstream) saw improved results driven
RELEASE. - Privileged Information - DISCLOSURE OF THE RESULTS RELATIVE TO THE FINANCIAL YEAR OF 2012 (UNAUDITED VALUES)
") RELEASE - Privileged Information - DISCLOSURE OF THE RESULTS RELATIVE TO THE FINANCIAL YEAR OF 2012 (UNAUDITED VALUES) After due consideration of the results for the financial year of 2012, and in accordance
RELEASE - Privileged Information - DISCLOSURE OF THE RESULTS RELATIVE TO THE FINANCIAL YEAR OF 2012 (UNAUDITED VALUES) After due consideration of the results for the financial year of 2012, and in accordance
SALES AND RESULS 2017
 SALES AND RESULS 2017 28 th February 2018 1 2017 Main Financial Aspects Solid revenue growth of +6.5% (+7.0% at constant exchange rates) reaching 1,571m (+ 97m) in the year. In the like-for-like ("LFL")
for the six-month period ended 30 June 2011
 Distribuidora Internacional de Alimentación, S.A. and Subsidiaries Interim Condensed Consolidated Financial Statements and Directors Report (together with Limited Review Report thereon) for the six-month
Management report for the first half of Vinci condensed interim consolidated financial statements at June
 interim financial statements at 30 june 2007 Contents Management report for the first half of 2007 1 Vinci condensed interim consolidated financial statements at June 2007 9 1. Consolidated financial statements
ASUR 1Q18 Passenger Traffic Increased 9.3% YoY in Mexico and Declined 19.2% in San Juan, Puerto Rico and 5.2% in Colombia
 ASUR 1Q18 Passenger Traffic Increased 9.3% YoY in Mexico and Declined 19.2% in San Juan, Puerto Rico and 5.2% in Colombia Mexico City, April 23, 2018 - Grupo Aeroportuario del Sureste, S.A.B. de C.V. (NYSE:
Abertis' net profit totalled 130Mn in the first quarter, up 13% in like-for-like terms
 1Q17 RESULTS Abertis' net profit totalled 130Mn in the first quarter, up 13% in like-for-like terms The company strengthens its presence in France, after the takeover of 100% of its subsidiary Sanef in
SAINT CROIX HOLDING IMMOBILIER, SOCIMI, S.A. Management Report 31 March 2017
 SAINT CROIX HOLDING IMMOBILIER, SOCIMI, S.A. Management Report 31 March 2017 1 Table of Contents Management Report 3 1. Explanation of figures at 31 March 2017 4 2. Valuation of real estate assets 9 3.
Investor Day April 2010 INVESTMENT STRATEGY. Mr. DAVID DIAZ Corporate Development Director
 Investor Day April 2010 INVESTMENT STRATEGY Mr. DAVID DIAZ Corporate Development Director abertis: Investment strategy 1. An overview of the infrastructure market 2. abertis strategy 3. A robust methodology
Abertis net profit totalled 182Mn in the first quarter, up 18% like-for-like
 1Q18 RESULTS Abertis net profit totalled 182Mn in the first quarter, up 18% like-for-like The Group keeps growing thanks to the extension of concessions in exchange for new investments Growth in key figures: