I. THIRD QUARTER HIGHLIGHTS 2 II. INCOME STATEMENT 5 III. BACKLOG 10 IV. CONSOLIDATED BALANCE SHEET 12 V. PERFORMANCE BY BUSINESS AREA 16
|
|
|
- Phillip Johnson
- 5 years ago
- Views:
Transcription

1
2 - 1 - I. THIRD QUARTER HIGHLIGHTS 2 II. INCOME STATEMENT 5 III. BACKLOG 10 IV. CONSOLIDATED BALANCE SHEET 12 V. PERFORMANCE BY BUSINESS AREA 16 VI. STOCK MARKET PERFORMANCE 32 VII. SHAREHOLDER STRUCTURE 33 VIII. ACCOUNTING ISSUES 34 Note: The financial information presented in this document has been prepared in accordance with International Financial Reporting Standards. This information is not audited and may be modified in the future. 9M11 RESULTS
3 - 2 - I. HIGHLIGHTS THIRD QUARTER 2015 SALE OF TESTA On June 8, 2015, an agreement was closed for the sale to Merlin Properties of Sacyr's 99.5% share in Testa, for 1,794 million. The sale had a premium to NAV of 17%. The proceeds will enable Sacyr to reduce its net debt by around 3,500 million, considerably bolstering its financial position and enabling the company to proceed with its strategic plan for the construction, infrastructure concessions, services and industrial businesses. In the third quarter, 600 million of a loan linked to the company's shareholding in Repsol was repaid, as was corporate debt and debt associated to other assets. The sale agreement was structured in various phases: In June 2015, Testa carried out a capital increase in through which Merlin Properties acquired a 25% stake. Sacyr received 239 million. For accounting purposes, Testa was then considered a discontinued operation in the first quarter of the year. In July and August 2015, a further 52% in Testa shares were delivered, amounting to 1,238 million. As a result, at the date of publication of this report, Sacyr's stake in Testa amounted to 23%. For accounting purposes, the capital gain from the sale was recorded in the third quarter of 2015 and Sacyr accounted for 23% of its shareholding in Testa as a financial investment held for sale.
4 - 3 - Before 30 June 2016, the remaining 23% of Testa will be delivered to Merlin Properties for 317 million. FLUOR ACQUISITION In July 2015, Sacyr acquired 50% of Fluor S.A., the Spanish subsidiary of engineering multinational, Fluor Corporation. The new company, called Sacyr Fluor, is a strategic reinforcement of the group's industrial division, one of the engine for Sacyr's future growth. Sacyr Fluor will provide engineering services and manage "EPC" projects (Engineering, Procurement and Construction) in the oil and gas sector and the onshore petrochemical industry in Spain, Southern Europe, North Africa and some Latin American countries. CREATION OF SACYR NERVIÓN In October 2015 (subsequent to the quarter close), Sacyr Industrial and Nervión Industries, Engineering and Services, S.L. a company whose main activity is to provide services of assembly, industrial maintenance and applied engineering in different fields created a partnership with a 50% share each, the company Sacyr Nervión. The new company will operate in projects related to the following: Comprehensive repair services of all manner of storage tanks, anywhere in the world. All types of maintenance services of refineries or other productive facilities in the oil & gas sector and other selective maintenance and assembly projects of industrial works.
5 - 4 - SIGNIFICANT CONTRACT WINS Sacyr won significant contracts in the first nine months of 2015, including three road contracts in Colombia with a total investment of about 2,200 million and a backlog of nearly 6,500 million. In addition to these important contracts is the recent contract win in Uruguay of the Road Link 21 and 24, with a backlog of 315 million, occurred subsequent to 30 September. For Sacyr, this means the opening of a new market within its strategy of international expansion. It also won, also in Colombia, the construction of the Pumarejo Bridge over the Magdalena river in the city of Barranquilla for 154 million; the construction of the new Ulster University (Northern Ireland) for 91 million; and the contract to adapt the Pampilla (Peru) refinery to new fuel specifications for 156 millions and the construction of development works of the QEZ 1 (Qatar Economic Zone 1) in Ras Bufontas, in Qatar, for 205 million.
6 - 5 - II. INCOME STATEMENT. Sacyr's results, at 30 September 2015, reflect the strong operating performance of all the group's core businesses. Consolidation in international markets, care for profitability and exhaustive control of risks and costs translate into business growth. Sacyr's net profit, at 30 September 2015, amounted to 532 million. This result is not comparable with that of the same period of 2014, due to the following: - It includes the gross amount of 1,280 million in gains from the sale of Testa and the corresponding asset impairment for deferred tax, amounting to 180 million. - Sacyr reduced the carrying amount of its investment in Repsol to fair value, at 373 million. Further, in keeping with criteria of prudence, working capital and financial provisions were made amounting to 130 million.
7 - 6 - STATEMENT OF INCOME SEPTEMBER % chg (Thousands of Euros) * 15/14 Revenue 2,123,178 1,841, % Other income 77,784 56, % Total operating income 2,200,962 1,898, % External and Operating Expenses 1,954,412 1,735, % GROSS PROFIT FROM ORDINARY OPERATIONS(1) 246, , % Amortisation and depreciation charge 79,314 59, % Changes in provision 33,046 11,083 n.s. NET OPERATING PROFIT 134, , % Financial results 208, , % Results from equity accounted subsidiaries 294, ,137 n.s. Provisions for financial investments 103,530 2,989 n.s. Change in value of financial instruments 2,276 3, % Results from sales of non current assets ,542 n.s. PROFIT BEFORE TAXES 473,935 60,970 n.s. Corporate Tax 185, n.s. PROFIT FOR CONTINUING ACTIVITIES 659,887 60,259 n.s. RESULTS FOR COMPANIES WITH DISCONTINOUS ACTIVITIES 1,203,393 26,840 n.s CONSOLIDATE RESULTS 543,507 87,100 n.s Minorities 11,237 4, % NET ATTRIBUTABLE PROFIT 532,270 82,583 n.s Gross margin 11.6% 8.8% * Adjusted with TESTA accounted as discontinued operation
8 - 7 - Revenue stood at 2,123 million, 15% higher year on year, with growth in all the group's businesses. REVENUE SEPTEMBER % Chg (Thousands Euros) * 15/14 Construcción (Sacyr Construcción Somague) 1,174,963 1,123, % Concesiones (Sacyr Concesiones) 409, , % Industrial (Sacyr Industrial) 189, , % Servicios (Valoriza) 566, , % Holding y Ajustes 218, ,744 REVENUE 2,123,178 1,841, % International 1,129, , % % International 53% 50% * Adjusted with TESTA accounted as discontinued operation Revenue grew by 15%, mainly on the back of the international business, which grew by 22% and growth in revenue in all business areas. - In the Construction business, international activity grew 12% thanks to the contribution from the backlog in Chile, Italy, Portugal, Colombia, Peru, Mexico, Portuguese speaking Africa and the Middle East. International activities account for 75% of construction revenue. - In Concessions, part of the 36% increase in revenue was attributable to the contribution of certain concession assets that were accounted for using the equity method in the third quarter of Stripping out this impact, concession revenue was 22% higher, boosted by the favourable traffic performance on our toll roads, the inauguration of the Rutas del Desierto motorway in Chile and further progress in the work on the Chilean motorways and the larger contribution of income from the Vial Sierra Norte concession in Peru.
9 Sacyr Industrial posted growth of 45% thanks to new EPC contract wins in electricity infrastructure (Mexico, Peru, United Kingdom) and in oil & gas (Colombia, Bolivia and Peru). - Services grew by 5%. Growth was 8% in like for like terms, due to the disinvestment from water assets in Portugal carried out in June Environment and multiservice activities grew by 6% and 9%, respectively, and water grew by 8% in like forlike terms. Third quarter EBITDA amounted to 247 million, a year on year increase of 51%. Of this increase, 58 million was the result of the addition to the consolidation scope of certain concessions (see 'Accounting issues' section). Like for like EBITDA growth (i.e. same consolidated group) was 11% EBITDA SEPTEMBER % Chg (Thousands Euros) * 15/14 Construcción (Sacyr Construcción Somague) 53,104 66, % Concesiones (Sacyr Concesiones) 143,379 58, % Industrial (Sacyr Industrial) 12,299 5, % Servicios (Valoriza) 50,333 47, % Holding y Ajustes 12,566 15,437 EBITDA 246, , % Ebitda Margin (%) 11.6% 8.8% * Adjusted with TESTA accounted as discontinued operation In the Construction business, the difference in EBITDA from the previous year was the result of the drop in oil prices, which led to delays in certain of Somague's projects, especially in Angola and Brazil.
10 - 9 - In Concessions, the increase is partly attributable to the change in consolidation scope, which entailed the full consolidation of eight concession assets that were carried using the equity method in the first half of Stripping out this impact, concessions' EBITDA growth stood at 22%. Sacyr Industrial is increasing its contribution to the Group's EBITDA as it develops. In Services, the 7% growth of EBITDA was notable, fuelled by Environment and Multiservices. Excluding the impact of disposals in the water business, growth in services was 15%. The EBITDA margin was 11.6% compared to 8.8% in the same period last year. The increase in the depreciation charge of property, plant and equipment was the result of the incorporation of concession projects due to the change to full consolidation of certain concession assets in Net financial results were 209 million. The average interest rate of borrowings stands at 4.69%. Results from equity accounted subsidiaries included 300 million from our holding in Repsol. Of this, 73 million related to our share of Repsol s net profit of 832 million through 30 September 2015 and 373 million to the write down of the investment to fair value after an impairment test.
11 III. BACKLOG The revenue backlog amounted to 31,231million, primarily in connection with the most recurrent activities: concessions and services, which represent 55% and 20% of the total respectively, not to mention the large construction backlog, now amounting to more than 5,500 million, relating to international contract wins. BACKLOG SEPTEMBER DECEMBER % Chg (Million Euros) * 15/14 Construcción (Sacyr Construcción Somague) 5,531 4, % Concesiones (Sacyr Concesiones)* 17,198 14, % Servicios (Valoriza) 6,051 6, % Sacyr Industrial 2,449 2, % BACKLOG 31,231 28, % *Restated by changing scope of consolidation The Construction backlog amounted to 5,531 million as at 30 September In the year to date, it has grown by 11%, thanks to the intense contracting work outside Spain, which has won contracts in Colombia, Northern Ireland, Mexico and Qatar. In addition, the backlog shows an adequate replacement level. In construction, Sacyr has contracts in Chile, Italy, Panama, Portugal, Angola, Colombia, Bolivia, Qatar, Peru, Brazil, Mexico, Mozambique, Angola, Togo, Cape Verde, India and other countries. The Concession backlog, in addition to fully consolidated concessions in the first nine months of 2015, includes the backlog of the Corridor 5: Puerta de Hierro Cruz del Vizo motorway won in Colombia in May: Puerta de Hierro Cruz del Vizo, won in Colombia in May and that of the Pasto Rumichaca motorway, also in Colombia, and won in July.
12 Sacyr Industrial is present in countries including Australia, the UK, Bolivia, Mexico, Peru and Colombia in addition to Spain, with various projects in the oil & gas, electricity infrastructure, power plant and waste treatment sectors. It now has backlog projects amounting to 2,449 million. The large international component (48%) of the backlog is noteworthy, particularly in the Construction and Concessions businesses, which now have a distinctly international profile. The international backlog accounts for 85% of the total at the Construction business and 47% of the total at the Concessions business. Sacyr's international footprint is even greater considering that these percentages do not include many of our projects, such as the backlog of Italy (Pedemontana Veneta) and the Mar 1 motorway in Colombia, which are accounted for using the equity method. BACKLOG SEPTEMBER (Million Euros) 2015 % International Construcción (Sacyr Construcción Somague) 5,531 85% Concesiones (Sacyr Concesiones) 17,198 47% Servicios (Valoriza) 6,051 31% Sacyr Industrial 2,449 15% BACKLOG 31,231 48% At Valoriza, the international backlog represents 31% of the total, with a presence in Algeria, Australia, Portugal, Bolivia, the UK, Peru and other countries, consisting mainly of water projects.
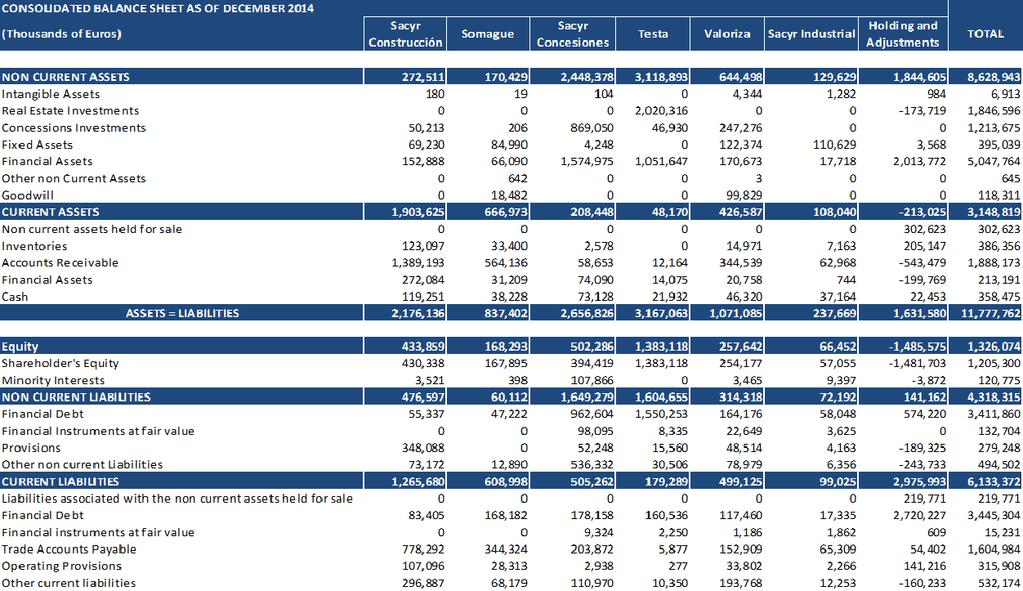
13 IV. CONSOLIDATED BALANCE SHEET BALANCE SHEET SEPTEMBER DECEMBER (Thousands of Euros) Chg NON CURRENT ASSETS 6,933,640 8,628,943 1,695,303 Intangible Assets 7,345 6, Real Estate Investments 0 1,846,596 1,846,596 Concessions Investments 1,581,204 1,213, ,529 Fixed Assets 371, ,039 23,185 Financial Assets 4,854,775 5,047, ,989 Other non Current Assets Goodwill 118, , CURRENT ASSETS 3,619,028 3,148, ,209 Non current assets held for sale 564, , ,294 Inventories 211, , ,150 Accounts Receivable 2,108,786 1,888, ,613 Financial Assets 273, ,191 60,784 Cash 460, , ,668 ASSETS = LIABILITIES 10,552,667 11,777,762 1,225,094 EQUITY 1,939,505 1,326, ,431 Shareholder's Equity 1,799,247 1,205, ,947 Minority Interests 140, ,775 19,483 NON CURRENT LIABILITIES 5,208,731 4,318, ,417 Financial Debt 4,146,101 3,411, ,241 Financial Instruments at fair value 169, ,704 36,742 Provisions 376, ,248 97,539 Other non current Liabilities 516, ,502 21,895 CURRENT LIABILITIES 3,404,430 6,133,372 2,728,942 Liabilities associated with the non current assets held for sale 247, ,771 27,598 Financial Debt 664,971 3,445,304 2,780,333 Financial Instruments at fair value 20,281 15,231 5,049 Trade Accounts Payable 1,371,139 1,604, ,845 Operating Provisions 328, ,908 12,271 Other current liabilities 772, , ,318 The most significant change in the balance sheet in the first nine months of 2015 was the sale of 77% of Testa. This means that it is no longer accounted for by full consolidation. The 23% shareholding Sacyr still holds in Testa at 30 September 2015 is now accounted for as a financial investment held for sale.
14 Another significant change was the transfer of the syndicated loan maturing 31 January 2018 taken out to finance the investment in Repsol from "Current financial debt" to "Non current financial debt and the partial repayment of the loan, amounting to 600 million.". The change in the consolidation method in the first quarter of 2015 (from equity accounting to full consolidation) for certain concessions has resulted in increases in the concession projects and financial assets items. Financial debt increased by 561 million in the period for the same reason. EQUITY Total equity at 30 September 2015 stood at 1,940 million. 93% (or 1,799 million) is attributable to equity holders of Sacyr and 140 million to non controlling interests in the Group.. Shareholders at the General Shareholders' Meeting held on 11 June 2015 resolved to carry out a capital increase with a charge to reserves through the issuance of 15.2 million shares with a par value of 1 each, in the proportion of 1 new share for every 33 previously issued. Trading in the new shares began on 29 July Accordingly, at 30 September 2015 share capital is represented by 517 million instruments each having a par value of 1. On 15 September, 2015, a interim dividend was paid in cash, of a gross amount of 0.05 per share.
15 FINANCIAL DEBT At 30 September 2015, the Group s total net debt stood at 4,224 million. The breakdown is as follows: NET DEBT (Million Euros) SEPT 2015 JUNE 2015 Chg. 3Q15 Sacyr Concesiones (project finance) 1,723 1,724 0% Sacyr + Somagues (construcción) Valoriza Industrial OTHER BUSINESS AREAS % Repsol 1,652 2,236 26% Corporate % BANK BORROWINGS 3,768 4,881 23% Convertible bonds TOTAL NET FINANCIAL DEBT 4,224 5,334 21% Corporate debt: the Group's net corporate debt amounted to 91 million; corresponding to working capital used by the parent to coordinate and provide the financial management as the Group's parent company and loans related to our shareholding in Itinere. In addition, the holding shows a financial liability of 456 million at 30 September 2015 for the outstanding balance on bond issues. Debt according to businesses: The virtual totality of the debt is associated with very longterm project finance. It is repaid with cash flows generated by the businesses and 92% matures from 2018 with significant gaps.
16 Net debt related to infrastructure concessions amounted to million or 85% of businesses' debt. It has increased by 681 million in the first half of 2015, but more than 80% of the increase, i.e. 561 million, is due to the fact that several companies that were formerly accounted for using the equity method are now fully consolidated. Investment in Chile accounts for the remainder. Derivative instruments arranged hedge 52% of potential increases in interest rates on project finance. Repsol debt: The investment vehicle that holds the 8.73% stake in Repsol had net debt at 30 September 2015 of 1,652 million. The loan is serviced with Repsol dividends. This variablerate financing was refinanced under favourable market conditions, with maturity extended to 31 January In the third quarter of 2015, 600 million was repaid. Net financial results were 209 million. The average interest rate of borrowings stands at 4.69%.
17 V. DEVELOPMENTS IN BUSINESS AREAS CONSOLIDATED INCOME STATEMENT AS OF SEPTEMBER 2015 (Thousands of Euros) Sacyr Construcción Somague Sacyr Concesiones Valoriza Sacyr Industrial Holding and Adjustments TOTAL Turnover 892, , , , , ,087 2,123,178 Other Sales 35,484 18,405 11,186 9,533 3, ,784 Total Income 928, , , , , ,371 2,200,962 External and Operating Expenses 880, , , , , ,805 1,954,412 GROSS OPERATING PROFIT 48,024 5, ,379 50,333 12,299 12, ,550 Depreciation 10,425 7,702 31,879 22,641 5,475 1,191 79,314 Trade Provisions 1,846 1,249 5,103 2,507 1,470 30,000 33,046 NET OPERATING PROFIT 39,444 1, ,397 25,185 8,293 43, ,189 Financial results 1,406 12,972 86,249 11,199 2,001 97, ,774 Results from equity accounted subsidiaries ,593 3, , ,497 Provisions for financial investments , , ,530 Change in value of financial instruments at fair value 0 0 2, ,276 Results from sales of non current assets PROFIT BEFORE TAXES 41,644 14,336 17,853 16,611 6, , ,935 Corporate Tax 16,410 2,274 4,162 4,818 2, , ,951 PROFIT FOR CONTINUING ACTIVITIES 25,234 16,610 13,691 11,793 4, , ,887 PROFIT FOR DISCONTINUING ACTIVITIES ,203,393 1,203,393 CONSOLIDATE RESULTS 25,234 16,610 13,691 11,793 4, , ,507 Minorities , ,237 NET ATTRIBUTABLE PROFIT 25,234 16,618 2,619 12,112 3, , ,270 9M11 RESULTS
18 CONSOLIDATED INCOME STATEMENT AS OF SEPTEMBER 2014* (Thousands of Euros) Sacyr Construcción Somague Sacyr Concesiones Valoriza Sacyr Industrial Holding and Adjustments TOTAL Turnover 715, , , , , ,744 1,841,885 Other Sales 18,672 19,458 3,507 11,941 1,735 1,619 56,932 Total Income 734, , , , , ,125 1,898,817 External and Operating Expenses 695, , , , , ,688 1,735,884 GROSS OPERATING PROFIT 38,591 27,755 58,995 47,186 5,842 15, ,933 Depreciation 10,377 7,866 14,178 21,496 4,963 1,110 59,990 Trade Provisions 2,084 1,929 4,535 1,483 11,145 1,943 11,083 NET OPERATING PROFIT 30,298 21,819 40,282 24,207 12,023 14, ,026 Financial results 8,847 11,526 52,462 11,775 3, , ,282 Results from equity accounted subsidiaries ,061 2, , ,137 Provisions for financial investments 1, ,814 1, ,989 Change in value of financial instruments at fair value 0 0 3, ,635 Results from sales of non current assets 2, ,763 2, ,542 PROFIT BEFORE TAXES 37,969 11,499 9,816 15,524 8,192 60,970 Corporate Tax 13,165 6,786 13,526 6, , PROFIT FOR CONTINUING ACTIVITIES 24,804 4,713 3,710 9,439 7,265 17,749 60,259 PROFIT FOR DISCONTINUING ACTIVITIES ,840 26,840 CONSOLIDATE RESULTS 24,804 4,713 3,710 9,439 7,265 44,589 87,100 Minorities , , ,516 NET ATTRIBUTABLE PROFIT 24,299 4,674 4,989 9,944 3,908 44,747 82,583 * Adjusted with TESTA accounted as discontinued operation
19 CONSOLIDATED BALANCE SHEET AS OF SEPTEMBER 2015 (Thousands of Euros) Sacyr Construcción Somague Sacyr Concesiones Valoriza Sacyr Industrial Holding y Ajustes TOTAL NON CURRENT ASSETS 287, ,830 3,148, , ,240 2,541,688 6,933,640 Intangible Assets , ,345 Real Estate Investments Concessions Investments 48, ,287, , ,581,204 Fixed Assets 49,564 85,209 3, , ,011 3, ,854 Financial Assets 189,076 36,671 1,857, ,112 59,293 2,537,572 4,854,775 Other non Current Assets Goodwill 0 18, , ,207 CURRENT ASSETS 1,852, , , , , ,960 3,619,028 Non current assets held for sale , ,917 Inventories 132,794 32,033 17,161 20,333 8, ,206 Accounts Receivable 1,474, , , ,215 72, ,677 2,108,786 Financial Assets 132,273 27, ,236 14, , ,975 Cash 112,986 36, ,656 57,461 43,386 70, ,143 ASSETS = LIABILITIES 2,140, ,879 3,570,511 1,106, ,700 2,647,648 10,552,667 Equity 405, , , ,722 71, ,004 1,939,505 Shareholder's Equity 409, , , ,489 61, ,980 1,799,247 Minority Interests 4, ,206 5,233 10, ,258 NON CURRENT LIABILITIES 508,742 58,221 2,477, ,403 71,275 1,775,302 5,208,731 Financial Debt 57,888 46,797 1,673, ,811 56,718 2,151,967 4,146,101 Financial Instruments at fair value ,513 20,068 2, ,446 Provisions 355, ,109 56,199 3, , ,787 Other non current Liabilities 95,207 11, ,246 82,324 8, , ,398 CURRENT LIABILITIES 1,226, , , , , ,341 3,404,430 Liabilities associated with the non current assets held for sale , ,369 Financial Debt 82, , ,646 60,798 19, , ,971 Financial instruments at fair value ,787 1,271 1, ,281 Trade Accounts Payable 704, ,784 31, ,114 76,439 70,791 1,371,139 Operating Provisions 96,758 24,600 3,548 30,942 1, , ,179 Other current liabilities 343,101 61, , ,290 50, , ,492
20 - 19 -
21 CONSTRUCTION Millions of Euros SEPTEMBER %Chg /14 Revenue 1,175 1, % Spain % International % % International 75% 70% EBITDA % EBITDA Margin 4.5% 5.9% BACKLOG* 5,531 4,988 11% International 4,681 4,152 13% % International Backlog 85% 83% 2 bp Months of activity * 2014 data refers to december Revenue from the Construction business through 30 September 2013 totalled 1,175 million, marking an increase of 4.5% year on year. The slowdown of activity in Spain has been offset by the strong 11.6% growth of international revenue, due to the higher degree of progress of works, mainly in Chile, Mexico, Peru and Italy. Construction has an international profile, as 75% of revenue comes from business abroad. EBITDA performance compared with the first nine months of 2014 was affected by the slowdown of some Somague projects, in particular in Angola and Brazil. Greater efforts are being devoted to the opening of new markets. 9M11 RESULTS
22 CONTRACTING AND BACKLOG The construction backlog stood at 5,531 million at 30 September 2015, up 11% from December 2014, thanks to international contract wins. The backlog covers 42 months of operations at current turnover rates, which shows the backlog's high replacement capacity. In 3Q15, Sacyr has won two major international contracts, among others: o The construction project of the AVE platform of the Mediterranean Corridor, the Pulpí Cuevas de Almanzora section in Almería, for 33 million (100% Sacyr). It was awarded other projects in Spain worth a total of 46 million. o Sacyr won the design and construction contract of the QEZ 1 (Qatar Economic Zone 1) urban development works in Ras Bufontas in Qatar worth 410 million (50% Sacyr: 205 million). These are added to the works won in the early months of the year, including: o In Colombia, construction of the Pumarejo Bridge over the Magdalena River in Barranquilla with a budget of 220 million (70% Sacyr: 154 million), Corridor 5 motorways: Puerta de Hierro Cruz del Vizo motorway for 113 million (100% Sacyr) and the Autopista al Mar 1 motorway for 476 million (37.5% Sacyr: 178 million) and the Pasto Rumichaca motorway for 537 million (60% Sacyr: 322 million). o In Northern Ireland, the largest construction project is currently under way, the second phase of the new Ulster University campus in Belfast worth 182 million (50% Sacyr: 91 million).
23 o In Mexico, the contract to build the new regional hospital of Querétara for 42 million (80% Sacyr: 34 million). o In Chile, the 22 million (100% Sacyr) contract for the upgrade of the Ruta 7 motorway in the Chaitén (Los Lagos) area and the 12 million (100% Sacyr) contract for the construction of an office building in Santiago, among other contract wins. The international construction backlog represents 85% of the total backlog.
24 SACYR CONCESIONES (Thousands of euros) SEPTEMBER % Chg. % Chg.** /14 15/14 Revenue 409, , % 8.1% Revenue from construction* 206, , % -3.0% Revenue from concessions 202,766 88, % 22.3% EBITDA 143,379 58, % 22.2% EBIT 106,397 40,282 Margen Ebitda 70.7% 66.4% 4.3 pp -0.1 pp *Includes construction by the concessions operator pursuant to IFRIC 12, excluding the effect of EBITDA, since revenue is the same as the construction business costs. **Restated (includes the effect of 8 concessions accounting by global method) Sacyr Concesiones' revenue stood at 410 million at 30 September 2015, 36% higher yearon year due to: The change in the consolidation method (from equity to full consolidation) for eight concessions in Spain due to changes in company control, with an impact of 77 million on revenue. The 5,3% upturn in traffic on the Spanish concessions in operation. The start of operation of the Rutas del Desierto motorway toward the end of The progress made by concessions in Chile (Rutas del Desierto, Valles del Bio Bio and Rutas del Algarrobo). The income contributed by Convial de la Sierra, the concessionaire of the Autopista Longitudinal de la Sierra motorway in Peru. The EBITDA generated amounted to 143 million, and the gross margin of this activity reached 71% of turnover, an improvement on the margin of 66% in the same period of The impact on EBITDA of the concessions consolidated using the full method in 2015 amounted to 58 million.
25 Growth of traffic in our concessions in Spain has consolidated, amounting to 5.3%. Especially noteworthy is the 25% growth of traffic on the Guadalmedina motorway in Malaga. Thousands of euros REVENUE AS OF SEPTEMBER ADT SEPTEMBER Chg. (%) Chg. (%) AUTOVÍA DEL TURIA 8, % 36,511 34, % AUTOVÍA NOROESTE C.A.R.M. 6, % 10,969 10, % VIASTUR 5,075 4, % 22,036 21, % PALMA MANACOR 7, % 22,389 21, % AUTOVÍA DEL BARBANZA 7,206 5, % 13,165 12, % AUTOVÍA DEL ERESMA 4,706 4, % 7,285 6, % AUTOVÍA DEL ARLANZÓN 24, % 20,780 21, % NEOPISTAS - 1, % INTERCAMBIADOR DE MONCLOA 9, % INTERCAMBIADOR DE PLAZA ELÍPTICA 4, % AUTOPISTA DE GUADALMEDINA 9,901 8, % 10,322 8, % HOSPITAL DE PARLA 9,588 2, % HOSPITAL DE COSLADA 10,275 2, % AEROPUERTO DE MURCIA CONCESIONARIA # REF! SPAIN 108,524 28, % 143, , % N6 CONCESSION LTD ,355 9, % IRELAND % 10,355 9, % HOSPITAL BRAGA 7,111 6, % HOSPITAL DE VILA FRANCA 6,758 9, % PARQUE DO NOVO HOSPITAL % SOMAGUE CONCESSOES - PORTUGAL % ESCALA PARQUE 1,363 1, % PORTUGAL 15,910 18, % RUTAS DEL DESIERTO - ACCESOS A IQUIQE 11,894 5, % RUTAS DEL DESIERTO (ruta 1) 5, RUTAS DEL DESIERTO (ruta 16) 6, VALLES DEL BIO BIO - CONCEPCIÓN CABRERO 14,187 6, % VALLES DEL DESIERTO - VALLENAR CALDERA 18,648 18, % 4,853 4, % RUTA 43 - LIMARI % HOSPITAL ANTOFAGASTA 3, % SERENA VALLENAR - RUTAS DEL ALGARROBO 16,017 5, % 3, CHILE 65,340 37, % 21,040 4,878 n.s. CONVIAL SIERRA NORTE 9, n.s PERU 9, n.s COLOMBIA HOLDING AND OTHERS 3,635 4,175 TOTAL (without construction revenue) 202,767 88, % 174, , % CONSTRUCTION REVENUE 206, , % TOTAL 409, , % At 30 September 2015, Sacyr Concesiones had interests in 35 concessions in seven countries, of which 23 are currently in operation and twelve are under construction. Of the 35 concessions, 24 are motorway and road concessions in the EU and America (11 in Spain, six in Chile, three in Colombia, one in Italy, one in Portugal, one in Ireland and one in Peru) and the remaining 11 are other types of concessions (seven hospitals, two transport hubs, a metro line and an airport).
26 The assets are in their first years of operation, and have a huge scope for generating value in the future. The average remaining life of the concessions is over 25 years. CONTRACTING AND BACKLOG As at 30 September 2015, the company won three major projects in Colombia as part of the government's 4G infrastructure programme, namely: o The upgrade, improvement and operation of the 202km long Corridor 5 for 25 years, with an investment of roughly $275 million. o The construction and management of the 176km long Mar 1 motorway for 25 years, with estimated investment of $1,000 million. The motorway is in Antioquia, close to Corridor 5. o The construction and operation of its third concession in Colombia, the 80 km long Rumichaca Pasto motorway which provides a connection with the border with Ecuador. Total investment in this project is around $1,100 million. Sacyr also won its first concession in Uruguay after the reporting date: The 179 km long Corredor Vial 21 and 24 in a 24 year concession, and a total backlog of 315 million.
27 INDUSTRIAL (Thousands of Euros) SEPTEMBER % Chg /14 Revenue 189, ,168 45% Energy 94,777 88,796 7% EPC 95,000 42, % EBITDA 12,299 5, % EBITDA Margin 6.5% 4.5% BACKLOG* 2,449 2,418 1% National 2,071 2,176 5% International % * 2014 data refers to december The revenue for Sacyr Industrial in the first nine months of 2015 amounted to 190 million, up 45% on the previous year thanks to new EPC contract wins in electricity infrastructure (Mexico, Peru, Scotland) and in oil and gas (Cartagena regasification plant in Colombia, the Oruro plant in Bolivia and the middle distillate block at the Pampilla refinery in Peru). Similarly, EBITDA to 30 September 2015 increased to 12 million, vs. 5.8 million in 2014, leaving a margin of 6.5%. In the first nine months of 2015, the company's power plants benefited from higher electricity pool and gas prices.
28 SACYR FLUOR Sacyr Industrial is one of the group's core businesses. It is engaged in intense commercial activity with a view to penetrating new markets, especially Latin America (Mexico, Colombia, Peru, Bolivia, Chile) and the Middle East (Oman) As part of this global strategy of commitment to its industrial activity, in July 2015 the Sacyr Group acquired 50% of Fluor S.A., the Spanish subsidiary of engineering multinational, Fluor Corporation. The new company, Sacyr Fluor, will provide engineering services and manage "EPC" projects (Engineering, Procurement and Construction) in the oil and gas sector and the onshore petrochemical industry in Spain, Southern Europe, North Africa and some Latin American countries. SACYR NERVIÓN In October 2015 (subsequent to the quarter close), Sacyr Industrial and Nervión Industries, Engineering and Services, S.L. created a partnership with a 50% share each, the company Sacyr Nervión. The new company will operate in projects related to the following: Comprehensive repair services of all manner of storage tanks, anywhere in the world. All types of maintenance services of refineries or other productive facilities in the oil & gas sector and other selective maintenance and assembly projects of industrial works. CONTRACTING AND BACKLOG The growth of the industrial backlog was due to international activity. In the third quarter, Sacyr Industrial won in Panama the new project of operation and maintenance services for the Empresa de Distribución Metro Oeste (EDEMET) worth 20 million.
29 This contract is in addition to other contracts won in 2015, including: o A 156 million contract to adapt the Pampilla refinery in Peru to new fuel specifications. o A 12 million contract for work on substations and the 4th phase Eastern transmission lines in Mexico for the Federal Electricity Commission (CFE). o In Spain a major contract was also secured for the installation of geothermal systems at the Hotel Santa Marta, Mercado del Val, worth a total of 1.5 million.
30 VALORIZA Valoriza's revenue through 30 September 2015 amounted to 567 million, This growth amounts to an increase of 5.3% year on year, thanks to the increases in the Environment (5.7%) and Multiservices (8.9%) businesses. The contraction of revenue in the Water business was due mainly to the disposal in June 2014 of the water assets in Portugal (which therefore contributed revenue in the first half of 2014, but not in the first half of this year). Excluding the impact of the disposal of the water assets in Portugal, revenue would have increased by 7.7%. (Thousands of Euros) SEPTEMBER % Chg. % Chg.* * 15/14 15/14 REVENUE 566, , , % 7.7% Environment 232, , , % 5.7% Multi Services 224, , , % 8.9% Water 107, ,098 99, % 8.0% Central 2, EBITDA 50,333 47,186 43, % 14.7% Environment 29,862 23,924 23, % 24.8% Multi Services 10,967 9,437 9, % 16.2% Water 7,659 12,592 9, % 17.6% Central 1,845 1,233 1, % 49.6% EBITDA Margin 8.9% 8.8% 8.3% * Eliminate the effect of disinvestments EBITDA for Valoriza totalled 50 million. This represents a 7% year on year increase, extending the trend reversal begun in the first two quarters of the year with a recovery in margins. Excluding the impact of the disposal of the water assets in Portugal, EBITDA would have increased by 15%. The EBITDA margin widened to 8.9%.
31 CONTRACTING AND BACKLOG Valoriza s backlog stood at 6,052 million, of which 31% is accounted for by international business. Valoriza remains firmly committed to tendering activity in all its business areas both in Spain and abroad. Quarter highlights: o Winning of the comprehensive road maintenance contracts for the Tudela and Tafalla (Navarra) maintenance centres for 14 million, with a term of 4 years. o Winning of a cleaning contract of the Carlos III University of Madrid, for a total amount of 6 million, with a term of 2 years. These contracts are added to those won in the early months of the year, including: o Management of the street cleaning and waste collection service in the city of Guadalajara, for a period of 15 years and for 71 million. o Management of the street cleaning, waste collection and containers service in Concejo de Poio (Pontevedra) for 11 million and with a concession term of 16 years. o Comprehensive services of the Moncloa transport hub in Madrid for 8 million and a concession of 5 years. o The comprehensive management of the senior citizen's home and day centre in Benidorm (Alicante). It is worth 9 million, and with a term of 4 years for the concession. o The two year extension of the solid urban waste collection and cleaning contract for the city of Lérida worth 9 million.
32 o The 9 million contract with the Madrid region for maintenance of water mains, drinking water supply, wastewater treatment and remote control system and ornamental fountains. o The 9 million joint contract for the construction, design, upgrade and expansion and also the operation and maintenance of Formentera s seawater desalination plant (IDAM) and its adjacent facilities. The contribution to revenue and the backlog by activity is as follows: REVENUE BACKLOG Multi-Services 40% Water 19% Multi-Services 14% Water 49% Environment 41% Environment 37%
33 VI. STOCK MARKET PERFORMANCE SEPTEMBER % Chg SACYR /14 Market Price at closing (euros per share) % High share price % Low share price % Market Capitalization at closing (Thousands of euros)* 1,021,926 2,206, % Average Trading Volume (Thousands of euros) 4,513,506 5,854, % Average Daily Trading Volume (Number of shares) 6,747,534 7,111, % Liquidity (%) Number of shares (Thousands) 517, , % Share Nominal Value 1 EURO 1 EURO *Adjusted in 2014 pursuant to capital increase in July 2015 consisting of issue of bonus shares at a proportion 1 new share for 33 previously issued shares.
34 VII. SHAREHOLDER STRUCTURE Significant shareholders in Sacyr, S.A. at 30 September 2015 were as follows: SHAREHOLDER %Total D. Manuel Manrique Cecilia 5.1% Cymofag, S.L. 5.1% DISA. Demetrio Carceller Arce 12.1% D. José Manuel Loureda Mantiñán 7.8% Prilou, S.L. 3.2% Prilomi, S.L. 4.6% Grupo Corporativo Fuertes, S.L 5.8% Beta Asociados, S.L. 5.1% Taube Hodson Stonex Partners LLP 4.6% Grupo Satocan, S,A. 2.6% TOTAL SIGNIFICANT SHAREHOLDINGS 43.0%
35 VIII. ACCOUNTING ISSUES a) As explained in previous quarters, as a result of changes to the corporate resolutions that delimit the control of certain concessions companies, these concessions were fully consolidated. The year 2014 has not been restated, as it is a change in consolidation scope that is not due to the application of IFRS 11. These companies and their impact on income at 30 September 2015 are as follows: Change in consolidation scope by modification of the management agreements % Particip. REVENUE AT 30 SEPTEMBER EBITDA AT 30 SEPTEMBER Chg Chg. AUTOVÍA DEL TURIA 51% 8, ,811 7, ,853 AUTOVÍA NOROESTE C.A.R.M. 51% 6, ,231 5, ,079 PALMA MANACOR 40% 7, ,359 6, ,766 AUTOVÍA DEL ARLANZÓN 50% 24, ,898 21, ,329 INTERCAMBIADOR DE MONCLOA 51% 9, ,645 7, ,942 INTERCAMBIADOR DE PLAZA ELÍPTICA 51% 4, ,829 3, ,449 HOSPITAL DE PARLA Y COSLADA * 51% 19,863 4,620 15,243 7,950 1,984 5,966 TOTAL 81,636 4,620 77,016 60,368 1,984 58,384 *In March 2014, 49% of the hospitals stake were sold and they started to be accounted by equity method incomes include incomes until sale date. There were also impacts on EBITDA, of 58 million, and on net financial debt, of 561 million. b) The sale of a controlling percentage in Testa was recorded in the third quarter of Hence, Sacyr accounted for its 23% shareholding in Testa as a financial investment held for sale. The income statement records in "Income from discontinued activities" the net income from Testa from 1 January 2015 to 30 June 2015, as Testa is accounted as a discontinued operation in that period. The 2014 income statement has been adjusted so that both periods are comparable.
36 For more information, please contact: Department of Investor Relations Tel: ir@sacyr.com Pº Castellana, Madrid
37 - 36 -
I. ACCOUNTING ISSUES 2 II. FIRST QUARTER HIGHLIGHTS 3 III. INCOME STATEMENT 5 IV. BACKLOG 9 V. CONSOLIDATED BALANCE SHEET 11
 - 1 - I. ACCOUNTING ISSUES 2 II. FIRST QUARTER HIGHLIGHTS 3 III. INCOME STATEMENT 5 IV. BACKLOG 9 V. CONSOLIDATED BALANCE SHEET 11 VI. GROWTH OF BUSINESS AREAS 15 VII. STOCK MARKET PERFORMANCE 30 VIII.
Results 3Q November 2016
 Results 3Q 2016 10 November 2016 3Q2016 Presentation of Results 1 CONTENTS 1. Highlights 2. Operational Development 3. Performance by Business Area 4. Annexes 3Q2016 Presentation of Results 2 Highlights
SACYR REPORTS EBITDA OF 318 MILLION (+33%) AND ITS TURNOVER INCREASES BY 8.5%
 AND ITS TURNOVER INCREASES BY 8.5%") PRESS RELEASE The group achieves net profits of 370 million SACYR REPORTS EBITDA OF 318 MILLION (+33%) AND ITS TURNOVER INCREASES BY 8.5% International construction revenue represents 75% of the total,
PRESS RELEASE The group achieves net profits of 370 million SACYR REPORTS EBITDA OF 318 MILLION (+33%) AND ITS TURNOVER INCREASES BY 8.5% International construction revenue represents 75% of the total,
SACYR REPORTS EBITDA OF 155 MILLION (+50%) IN THE FIRST HALF
 IN THE FIRST HALF") PRESS RELEASE Debt down 3,600 million following sale of Testa SACYR REPORTS EBITDA OF 155 MILLION (+50%) IN THE FIRST HALF International construction revenue represents 72% of the total, while the Group
PRESS RELEASE Debt down 3,600 million following sale of Testa SACYR REPORTS EBITDA OF 155 MILLION (+50%) IN THE FIRST HALF International construction revenue represents 72% of the total, while the Group
Resultados Results. First Quarter May Sacyr Vallehermoso
 Resultados 2012 Results First Quarter 2014 14 May 2014 Sacyr Vallehermoso 1 HIGHLIGHTS 1. Operating performance 2. Corporate business 3. Share price trend 4. Reduction of financial debt Sacyr Vallehermoso
T h i r d Q u a r t e r 13 N o v e m b e r Q2017 Presentation of Results
 RESULTS 2017 T h i r d Q u a r t e r 13 N o v e m b e r 2017 Table of Contents HIGHLIGHTS OPERATIONAL EVOLUTION PERFORMANCE BY BUSINESS AREAS ANNEXES 2 Highlights 9M 2017 Revenue +4%. EBITDA +4% (Concessions
2012 results. Results. Second Half February Sacyr Vallehermoso 1
 Results Second Half 2013 28 February 2014 Sacyr Vallehermoso 1 HIGHLIGHTS 1. Operating performance 2. Corporate business 3. Share price trend 4. Reduction of financial debt Sacyr Vallehermoso 2 Operating
Second half results 29 February 2012
 Second half results 29 February 2012 Second half results 2011 highlights 2011 results Business areas Appendices Sacyr Vallehermoso 2 2011 highlights Business areas INTERNATIONAL activity in core businesses
FINANCIAL REPORT. First Quarter
 FINANCIAL REPORT First Quarter I. FIRST QUARTER HIGHLIGHTS 2 II. INCOME STATEMENT 6 III. BACKLOG 9 IV. CONSOLIDATED BALANCE SHEET 11 V. PERFORMANCE BY BUSINESS AREA 14 VI. STOCK MARKET PERFORMANCE 30 VII.
Letter from the. Chairman
 2016 Integrated Report Sacyr 24 Letter from the Chairman 30th Anniversary of Sacyr. Madrid, November 2016 1. Chapter 1.0. Letter from the Chairman 25 Letter from the Chairman G4-1, G4-13 2016 Integrated
28 F e b r u a r y Presentation of Results
 RESULTS 2017 28 F e b r u a r y 2 0 1 8 Table of Contents HIGHLIGHTS OPERATIONAL DEVELOPMENT PERFORMANCE BY BUSINESS AREAS ANNEXES 2 Highlights Financing closing of Pedemonana Veneta highway. Corporate
Results Second Half February 2017
 Results Second Half 2016 27 February 2017 2016 Presentation of Results 1 TABLE OF CONTENTS 1. Highlights 2. Operational Development 3. Performance by Business Area 4. Annexes 2016 Presentation of Results
First half Results 29 July 2011
 First half Results 29 July 2011 First Half Results Period highlights 1H11 results Business areas Appendices Sacyr Vallehermoso 2 First Half of 2011 Reduction of financial exposure concluded CAPITALIZATION:
SACYR EARNS A NET PROFIT OF 120 MILLION EUROS IN 2016
 PRESS RELEASE EBITDA increases 13% to 360 million SACYR EARNS A NET PROFIT OF 120 MILLION EUROS IN 2016 Madrid, 27th February 2017.- The Sacyr Group achieved a net profit of 120.2 million in 2016. EBITDA
sacyr.com Results 2018 First Quarter
 sacyr.com Results 2018 First Quarter 10 May 2018 Table of Contents Highlights Operational Development Performance by Business Area Annexes Highlights Increase in Revenues +13%. Revenue increases in all
Third quarter results. 15 November 2010
 Third quarter results 15 November 2010 1 Period operatives keys Analysis of 3Q10 results Business areas Appendices 2 Period operative keys SyV third quarter results reflect the advancement made in: INTERANTIONAL
FINANCIAL REPORT Third Quarter
 FINANCIAL REPORT 2017 Third Quarter I. HIGHLIGHTS FOR THE FIRST NINE MONTHS 2 II. INCOME STATEMENT 7 III. BACKLOG 10 IV. CONSOLIDATED BALANCE SHEET 12 V. PERFORMANCE BY BUSINESS AREA 15 VI. STOCK MARKET
GROUP OVERVIEW BUSINESS AREAS INVESTMENTS SOCIAL RESPONSIBILITY
 GLOBAL INNOVATION GROUP OVERVIEW BUSINESS AREAS INVESTMENTS SOCIAL RESPONSIBILITY 2 GROUP OVERVIEW COMPANY OVERVIEW Sacyr is a diversified group with international recognition and encompassing four areas
FINANCIAL REPORT Second Half
 FINANCIAL REPORT 2017 Second Half I. 2017 HIGHLIGHTS 2 II. INCOME STATEMENT 10 III. BACKLOG 13 IV. CONSOLIDATED BALANCE SHEET 15 V. PERFORMANCE BY BUSINESS AREA 18 VI. STOCK MARKET PERFORMANCE 37 VII.
SACYR INCREASES ITS INTERNATIONAL BUSINESS AND EARNS 83 MILLION EUROS TO SEPTEMBER
 PRESS RELEASE International construction revenues account for 70% SACYR INCREASES ITS INTERNATIONAL BUSINESS AND EARNS 83 MILLION EUROS TO SEPTEMBER The order book grows 20% Sacyr Industrial's portfolio
sacyr.com 10 May 2018
 Results 2018 First Quarter 10 May 2018 I. Highlights of first quarter 2018 2 II. Income statement 7 III. Backlog 9 IV. Consolidated balance sheet 12 V. Performance by business area 15 VI. Stock market
sacyr.com Results 2018 First Half
 sacyr.com Results 2018 First Half 27 July 2018 Table of Contents Highlights Operational Development Performance by Business Area Annexes Highlights Operational Growth Increase in Revenues +18% Revenue
sacyr.com Results 2018
 sacyr.com Results 2018 28 February 2019 Table of Contents Strategic Plan 2015-2020 Highlights 2018 Operational Development 2018 Performance by Business Area 2018 Annexes Strategic Plan 2015 2020 (I) 2015-2018
sacyr.com Challenge Success
 sacyr.com Challenge Success Group overview 2 Group overview We are a global group that welcomes and embraces any challenge to transform society. We work in 30 countries worldwide to improve the infrastructure
sacyr.com Results 2018 Third Quarter
 sacyr.com Results 2018 Third Quarter 8 November 2018 Table of Contents Highlights Operational Development Performance by Business Area Annexes Highlights Operational Growth Increase in Revenues +20% Revenue
sacyr.com 27 July 2018
 Results 2018 First Half 27 July 2018 I. Highlights of first half 2018 2 II. Income statement 9 III. Backlog 13 IV. Consolidated balance sheet 15 V. Performance by business area 18 VI. Stock market performance
sacyr.com Results 2018 Third Quarter
 Results 2018 Third Quarter 8 November 2018 I. Highlights January-September 2018 2 II. Income statement 8 III. Backlog 11 IV. Consolidated balance sheet 13 V. Performance by business area 16 VI. Stock market
II. STATEMENT OF INCOME AND CONSOLIDATED BALANCE SHEET 3 III. BUSINESS AREAS PERFORMANCE 14 IV. BOARD RESOLUTIONS 27 V. STOCK PERFORMANCE 29
 I. HIGHLIGHTS OPERATING DATA 1 ECONOMIC-FINANCIAL DATA 2 II. STATEMENT OF INCOME AND CONSOLIDATED BALANCE SHEET 3 III. BUSINESS AREAS PERFORMANCE 14 IV. BOARD RESOLUTIONS 27 V. STOCK PERFORMANCE 29 VI.
Fostering constructive ideas. 05 Q1 Results and strategic development. June, 2005
 Fostering constructive ideas 05 Q1 Results and strategic development June, 2005 Contents 1 2 Q1 Results Highlights Business Areas Strategic Development Strategic Development by Area 04/07 Forecast 2 Contents
I. HIGHLIGHTS II. STATEMENT OF INCOME AND CONSOLIDATED BALANCE SHEET 3 III. BUSINESS AREA PERFORMANCE 14 IV. BOARD RESOLUTIONS 28
 I. HIGHLIGHTS OPERATING DATA 1 ECONOMIC FINANCIAL DATA 2 II. STATEMENT OF INCOME AND CONSOLIDATED BALANCE SHEET 3 III. BUSINESS AREA PERFORMANCE 14 IV. BOARD RESOLUTIONS 28 V. STOCK PERFORMANCE 31 VI.
SACYR, S.A. AND SUBSIDIARIES Consolidated Financial Statements and Consolidated Management Report for the year ended December 31, 2016
 Independent Audit Report SACYR, S.A. AND SUBSIDIARIES Consolidated Financial Statements and Consolidated Management Report for the year ended December 31, 2016 Translation of a report and consolidated
Sacyr Vallehermoso STRATEGY AND 2004 CLOSING FORECAST. Madrid, 29 October 2004
 Sacyr Vallehermoso STRATEGY AND 2004 CLOSING FORECAST Madrid, 29 October 2004 Contents Market Situation Strategy 2004 Earnings and Prospects 2 Market Situation Market Situation: Macroeconomic Outlook MACROECONOMIC
Profile of the Group in 2015
 A 0 Profile of the Group in 2015 Obrascón Huarte Lain (OHL) ranks among the leading international concession and construction groups, with more than 100 years of experience and an outstanding presence
Grupo ACS net profit in 2011 totals EUR 962 million
 Grupo ACS net profit in 2011 totals EUR 962 million Turnover grew up to EUR 28,472 million, a 98.7% increase. International turnover now accounts for 72.5% of the total. The Grupo ACS ordinary net profit
ACS accounts in the first nine months of 2015 for a net profit of 574 euro million
 ACS accounts in the first nine months of 2015 for a net profit of 574 euro million Sales reaches 26,366 euro million, up to 3.6% Net debt drops by 34% down to 3,880 euro million. Grupo ACS Results Euro
Grupo Isolux Corsán, S.A. and its subsidiaries. Consolidated financial information for the nine month period ended September 30, 2014 (unaudited)
") Consolidated financial information for the nine month period ended September 30, 2014 (unaudited) CONSOLIDATED INTERIM BALANCE SHEET (unaudited) For the period ended September 30, 2014 (Amounts in thousand
Consolidated financial information for the nine month period ended September 30, 2014 (unaudited) CONSOLIDATED INTERIM BALANCE SHEET (unaudited) For the period ended September 30, 2014 (Amounts in thousand
Infrastructure. Services 3Q2011 EARNINGS REPORT. Energy
 Infrastructure 3Q2011 EARNINGS REPORT Services Energy 1. HIGHLIGHTS 2 2. EXECUTIVE SUMMARY 3 3. SUMMARY BY BUSINESS AREA 4 4. INCOME STATEMENT 6 5. BALANCE SHEET 9 6. CASH FLOW 12 7. BUSINESS PERFORMANCE
ACS gains 388 million euros of net profit in the first half of 2016
 ACS gains 388 million euros of net profit in the first half of 2016 Sales reached 16,387 million euros, 5.3% lower in a like for like basis adjusted by currency impacts and the sale of renewable assets
Abertis' profit totals 1,677Mn, the best results in its history
 1H15 RESULTS Abertis' profit totals 1,677Mn, the best results in its history The Board approves a share buyback program of 6.5% of shares through a tender offer with a premium on the share quotation. Unlocking
REPSOL POSTS NET INCOME OF BILLION EUROS
 FULL YEAR 2012 EARNINGS PRESS RELEASE Madrid, 28 February 2013 Pages 9 Production rises 11% and the reserve replacement ratio reaches a record 204% REPSOL POSTS NET INCOME OF 2.060 BILLION EUROS Net income
achievements challenges into Turning 2016 Financial Report
 Turning challenges into achievements 2016 Financial Report 2016 Financial Report Contents 2016 Financial Report 2 1 2016 Financial Report 7 CONSOLIDATED STATEMENT OF FINANCIAL POSITION 8 SEPARATE CONSOLIDATED
5. The financial management in 2017
 5. The financial management in 2017 5.1. Consolidated FinanCial statements 5.2. Consolidated balance sheet of the acs Group 5.3. net Cash Flows of the acs Group 5.4. areas of activity evolution: ConstruCtion
Environmental 9M2018 EARNINGS REPORT. Water. Infrastructures
 Environmental 9M2018 EARNINGS REPORT Water Infrastructures 1. SIGNIFICANT EVENTS 2 2. EXECUTIVE SUMMARY 3 3. SUMMARY BY BUSINESS AREA 4 4. INCOME STATEMENT 5 5. BALANCE SHEET 10 6. BUSINESS PERFORMANCE
Abertis' results reach 1,880Mn in 2015
 2015 ANNUAL RESULTS Abertis' results reach 1,880Mn in 2015 Net profit rises 7% on a comparable basis, stripping out extraordinary impacts In 2015 extraordinary impacts affected the Group: o 4,378Mn revenues,
Con experiencia probada
 Con experiencia probada ECONOMIC AND FINANCIAL REPORT OF ACS GROUP 2012 www.grupoacs.com Con experiencia probada Cover photo: Administrative Building (Salamanca, Spain). ECONOMIC AND FINANCIAL REPORT OF
Presentation of the Group
 The world s leading infrastructure developer Presentation of the Group Key figures & Global Strategy July 2012 Grupo ACS The world s leading infrastructure & concessions developer Engineering contractor
REPSOL S NET INCOME RISES 15%
 Corporate Division of Communication Paseo de la Castellana, 278-280 28046 Madrid Spain Tel. (34) 913 488 100 (34) 913 488 000 Fax (34) 913 142 821 (34) 913 489 494 www.repsol.com Madrid, November 13th
The world s leading infrastructure developer. April 2012
 The world s leading infrastructure developer Investors Presentation Company profile, strategy and key financials April 2012 Grupo ACS The world s leading infrastructure developer Engineering contractor
REPSOL POSTS NET INCOME OF BILLION EUROS
 Tel.: +34 91 753 87 87 FIRST-HALF EARNINGS PRESS RELEASE Madrid, 26 July 2012 9 pages REPSOL POSTS NET INCOME OF 1.036 BILLION EUROS Net income, excluding YPF, fell 14.6% to 903 million euros due to the
3. Consolidated income statement. 4. Business performance Acciona Infrastructure Acciona Real Estate
 Contents 1. Key financials 2. Acquisition of 21% of Endesa 3. Consolidated income statement 4. Business performance 4.1. Acciona Infrastructure 4.2. Acciona Real Estate 4.3. Acciona Energy 4.4. Acciona
Gas Natural Fenosa posts net profit of 793 million euros and EBITDA of 3.14 billion euros up until September
 Press Room Spain Press releases Home / News / Press releases / Content in detail Gas Natural Fenosa posts net profit of 793 million euros and EBITDA of 3.14 billion euros up until September The annual
ACS accounts in the first quarter of 2015 for a net profit of 207 euro million
 ACS accounts in the first quarter of 2015 for a net profit of 207 euro million Sales grow by 6% up to 8,570 euro million. 80.2% of total sales accounted from international activities. Grupo ACS Results
Abertis net profit totalled 182Mn in the first quarter, up 18% like-for-like
 1Q18 RESULTS Abertis net profit totalled 182Mn in the first quarter, up 18% like-for-like The Group keeps growing thanks to the extension of concessions in exchange for new investments Growth in key figures:
2014 Results Presentation
 2014 Results Presentation Madrid, March 2 nd 2015 Finance Department Investor Relations 1 Disclaimer This document may contain forward-looking statements regarding intentions, expectations or predictions
2004 RESULTS. February 28 th, 2005
 2004 RESULTS February 28 th, 2005 Year 2004 Summary 2004 Consolidated Results 2004 Consolidated Balance Sheet Business area analysis Conclusions 2004 has been a Relevant Year for the ACS Group OPERATING
Sacyr Group (Sacyr S.A. and Subsidiaries) Consolidated Financial Statements and Consolidated Management Report AT 31 DECEMBER 2014 together with
 Consolidated Financial Statements and Consolidated Management Report AT 31 DECEMBER 2014 together with") Sacyr Group (Sacyr S.A. and Subsidiaries) Consolidated Financial Statements and Consolidated Management Report AT 31 DECEMBER 2014 together with THE AUDITORS' REPORT ON THE CONSOLIDATED FINANCIAL STATEMENTS
Sacyr Group (Sacyr S.A. and Subsidiaries) Consolidated Financial Statements and Consolidated Management Report AT 31 DECEMBER 2014 together with THE AUDITORS' REPORT ON THE CONSOLIDATED FINANCIAL STATEMENTS
Net Profit in the first semester of 2014 grew by 10.7% up to 395 Euro million
 Net Profit in the first semester of 2014 grew by 10.7% up to 395 Euro million Sales stand at 18,759 Euro million, 83.8% of them from abroad. Net debt of the Group accounts for 5,812 Euro million, showing
PROSEGUR COMPAÑÍA DE SEGURIDAD, S.A. AND SUBSIDIARIES. QUARTERLY INTERIM FINANCIAL INFORMATION Interim statement for the third quarter of 2017
 COMPAÑÍA DE SEGURIDAD, S.A. AND SUBSIDIARIES QUARTERLY INTERIM FINANCIAL INFORMATION Interim statement for the third quarter of 2017 (Translation from the original in Spanish. In the event of discrepancy,
RESULTS 9M12. MADRID, 14 NOVEMBER
 RESULTS MADRID, 14 NOVEMBER 2012 www.indra.es CONTENTS 1. Introduction - 3 2. Main Figures - 6 3. Analysis of Revenues and Commercial Activity - 7 3.1. Analysis by Segment - 8 3.2. Analysis by Vertical
AP 46. Las Pedrizas motorway. Málaga
 AP 46. Las Pedrizas motorway. Málaga THE SACYR VALLEHERMOSO GROUP GROUP PROFILE With an average headcount of over 20,210 employees, revenue of 4.82 billion, and an order book in excess of 51 billion the
Environmental Services 1Q2015 EARNINGS REPORT. Water. Infrastructures
 Environmental Services 1Q2015 EARNINGS REPORT Water Infrastructures 1) HIGHLIGHTS 2 2) EXECUTIVE SUMMARY 3 3) SUMMARY BY BUSINESS AREA 4 4) INCOME STATEMENT 5 5) BALANCE SHEET 9 6) CASH FLOW 12 7) BUSINESS
QUARTERLY REPORT SEPTEMBER 30, 2016
 QUARTERLY REPORT SEPTEMBER 30, 2016 Table of Contents Page Presentation of Financial Information... ii Summary of Financial Information... 1 Business Overview... 3 Factors affecting the comparability of
Capital. Dividends. Stock Market Performance. Investor Relations
 Capital Dividends Stock Market Performance Investor Relations Stock Market Performance and the Financial Community 4 Capital On 3 April 2003 the General Shareholders Meeting of Vallehermoso, S.A. approved
April 2015 A LEADING TECH COMPANY
 April 2015 A LEADING TECH COMPANY This presentation has been produced by Indra for the sole purpose expressed therein. Therefore, neither this presentation nor any of the information contained herein constitutes
2. Consolidated income statement Acciona Infrastructure Acciona Real Estate Acciona Logistics & Transport Services
 Contents 1. Key financials 2. Consolidated income statement 3. Business Divisions 3.1. Acciona Infrastructure 3.2. Acciona Real Estate 3.3. Acciona Energy 3.4. Acciona Logistics & Transport Services 3.5.
Abertis reports 10% growth in like-for-like net profit to 718Mn in January-September
 9M16 RESULTS Abertis reports 10% growth in like-for-like net profit to 718Mn in January-September The Group has gradually increased the average life of its concessions by extending terms and is exploring
Abertis' net profit totalled 130Mn in the first quarter, up 13% in like-for-like terms
 1Q17 RESULTS Abertis' net profit totalled 130Mn in the first quarter, up 13% in like-for-like terms The company strengthens its presence in France, after the takeover of 100% of its subsidiary Sanef in
Management report for the first half of Vinci condensed interim consolidated financial statements at June
 interim financial statements at 30 june 2007 Contents Management report for the first half of 2007 1 Vinci condensed interim consolidated financial statements at June 2007 9 1. Consolidated financial statements
Madrid, February 25 th, 2011
 Madrid, February 25 th, 2011 This document contains forward-looking statements on the intentions, expectations or forecasts of Grupo ACS or its management at the time the document was drawn up and in reference
1 Executive Summary Main figures Relevant facts 5. 2 Consolidated Financial Statements 7
 INDEX 1 Executive Summary 3 1.1. Main figures 3 1.2. Relevant facts 5 2 Consolidated Financial Statements 7 2.1 Income Statement 7 2.1.1 Sales and Backlog 8 2.1.2 Operating Results 10 2.1.3 Financial Results
2012 Results Presentation. Madrid, February 27, 2013
 2012 Results Presentation Madrid, February 27, 2013 Any declaration made in this presentation that may differ from previous past figures made in reference to, but not limited to; the operational development,
REPSOL NET INCOME INCREASES BY 41%
 JANUARY-SEPTEMBER 2017 EARNINGS Press release Madrid, November 3rd, 2017 6 pages REPSOL NET INCOME INCREASES BY 41% Repsol earned a net profit of 1.583 billion euros in the first nine months of 2017, 41%
Environmental 2017 EARNINGS REPORT. Water. Infrastructures
 Environmental 2017 EARNINGS REPORT Water Infrastructures 1) SIGNIFICANT EVENTS 2 2) EXECUTIVE SUMMARY 3 3) SUMMARY BY BUSINESS AREA 4 4) INCOME STATEMENT 5 5) BALANCE SHEET 10 6) CASH FLOW 13 7) BUSINESS
ACS gains 233 million euros, 6% more, in the first quarter of 2017
 ACS gains 233 million euros, 6% more, in the first quarter of 2017 Sales increased by 11.2% up to 8,357 million euros Backlog increases by 15.0% up to 68,092 million euros in March 2017 Net debt decreases
Preview of income statement for first quarter 2008
 At Eu1,212 million, net income rises 36.5% year-on-year Unaudited figures (IFRS) FIRST QUARTER 2008 RESULTS 1Q07 4Q07 1Q08 1Q08/1Q07 REPORTED EARNINGS INCOME FROM OPERATIONS 1,407 1,541 1,606 14.1 NET
-8.7 % +1.5 % -5.3 % % %
 24 A BUSINESS WITH A PURPOSE I 2017 MILESTONES MILESTONES IN 2017 Consolidation of results 2015 SOLID BASIS FOR 2016 SUSTAINED GROWTH CHANGE OF TREND WITH AN INCREASE IN CAPEX OTHER BUSINESSES 7 % 42 %
Results Presentation H1 2015
 Results Presentation H1 2015 Madrid, 29 July 2015 This version of our presentation is a free translation of the original, which was prepared in Spanish. All possible care has been taken to ensure that
FY2017 RESULTS. 1 February 2017 to 31 January Inditex continues to roll out its global, fully integrated store and online platform.
 FY2017 RESULTS 1 February 2017 to 31 January 2018 Inditex continues to roll out its global, fully integrated store and online platform. Strong operating performance: Net sales for FY2017 reached 25.3 billion,
Q RESULTS 12 November,
 Q3 RESULTS 12 November, 0 TABLE OF CONTENTS BASIS OF PREPARATION OF THE FINANCIAL INFORMATION... 2 KEY METRICS FOR THE PERIOD... 4 KEY MILESTONES FOR THE THIRD QUARTER OF... 4 NET INCOME PERFORMANCE BY
Environmental Services 1H2015 EARNINGS REPORT. Water. Infrastructures
 Environmental Services 1H2015 EARNINGS REPORT Water Infrastructures 1) HIGHLIGHTS 2 2) EXECUTIVE SUMMARY 3 3) SUMMARY BY BUSINESS AREA 4 4) INCOME STATEMENT 5 5) BALANCE SHEET 9 6) CASH FLOW 12 7) BUSINESS
Preview of income statement for second quarter 2007
 Preview of income statement for second quarter Lower oil prices and good refining margins mark second quarter results Unaudited figures (IFRS) 1Q 07/06 SECOND QUARTER RESULTS 07/06 REPORTED EARNINGS 1,690
ACS, Actividades de Construcción y Servicios, S.A. and Subsidiaries. Condensed Consolidated Financial Statements for the year ended 31 December 2014
 ACS, Actividades de Construcción y Servicios, S.A. and Subsidiaries Condensed Consolidated Financial Statements for the year ended 31 December 2014 Translation of interim condensed consolidated financial
QUARTERLY INFORMATION (INTERIM DECLARATION OR QUARTERLY FINANCIAL REPORT)
") QUARTERLY INFORMATION (INTERIM DECLARATION OR QUARTERLY FINANCIAL REPORT) QUARTER: FIRST YEAR: 2015 END OF REPORTING PERIOD: 31/03/2015 I. ISSUER IDENTIFICATION INFORMATION Corporate name: MAPFRE, S.A.
QUARTERLY INFORMATION (INTERIM DECLARATION OR QUARTERLY FINANCIAL REPORT) QUARTER: FIRST YEAR: 2015 END OF REPORTING PERIOD: 31/03/2015 I. ISSUER IDENTIFICATION INFORMATION Corporate name: MAPFRE, S.A.
2. Acquisition of 10% of Endesa. 3. Consolidated income statement. 4. Business performance Acciona Infrastructure Acciona Real Estate
 Contents 1. Key points 2. Acquisition of 10% of Endesa 3. Consolidated income statement 4. Business performance 4.1. Acciona Infrastructure 4.2. Acciona Real Estate 4.3. Acciona Energy 4.4. Acciona Logistics
on 12/14/2009 at 2:05 PM Labrador a4-bc9f-4b81-89f6-657b075eb230
 on 12/14/2009 at 2:05 PM CONTENTS 1. KEY FINANCIAL FIGURES 2. CONSOLIDATED INCOME STATEMENT 3. RESULTS BY DIVISION 3.1. ACCIONA Energy 3.2. ACCIONA Infrastructures 3.3. ACCIONA Real Estate 3.4. ACCIONA
COMISIÓN NACIONAL DEL MERCADO DE VALORES Paseo de la Castellana, Madrid. Madrid, 13 de mayo de Muy Sres. nuestros:
 COMISIÓN NACIONAL DEL MERCADO DE VALORES Paseo de la Castellana, 19 28046 Madrid Madrid, 13 de mayo de 2013 Muy Sres. nuestros: ACCIONA adjunta presentación en ingles que se seguirá en la multiconferencia
ENDESA, S.A. and Subsidiaries
 ENDESA, S.A. and Subsidiaries Quarterly Report for the period January-September (Translation from the original issued in Spanish. In the event of discrepancy, the Spanish-language version prevails) Madrid,
CONSOLIDATED FINANCIAL STATEMENTS
 CONSOLIDATED FINANCIAL STATEMENTS FOR THE YEAR ENDED 31 DECEMBER ENDESA, S.A. AND SUBSIDIARIES CONSOLIDATED STATEMENTS OF FINANCIAL POSITION AT 31 DECEMBER AND 31 DECEMBER ASSETS 31 December 31 December
THE FINANCIAL MANAGEMENT
 INTEGRATED REPORT 5 101 THE FINANCIAL MANAGEMENT 5.1 Consolidated Financial Statements 5.2 Consolidated balance sheet of the ACS Group 5.3 Net cash flows of the ACS Group 5.4 Areas of activity evolution:
FINANCIAL REPORT ENERO - SEPTIEMBRE
 2014January - March FINANCIAL REPORT ENERO - SEPTIEMBRE FINANCIAL REPORT 3 Key consolidated data 4 Highlights of the period 6 General background 7 Consolidated financial report 7 Income statement 11 Balance
PROSEGUR COMPAÑÍA DE SEGURIDAD, S.A. AND SUBSIDIARIES. QUARTERLY INTERIM FINANCIAL INFORMATION Interim statement for the third quarter of 2017
 PROSEGUR COMPAÑÍA DE SEGURIDAD, S.A. AND SUBSIDIARIES QUARTERLY INTERIM FINANCIAL INFORMATION Interim statement for the third quarter of 2017 (Translation from the original in Spanish. In the event of
5.3 Human Resources. Strategy and resources. Description of the Workforce:
 Sacyr 5.3 Human Resources AVERAGE CONSOLIDATED WORKFORCE DISTRIBUTION BY COUNTRY The Sacyr Human Resources Department, through its Personnel Administration, Human Resources Development, Recruitment, and
PROSEGUR COMPAÑÍA DE SEGURIDAD, S.A. AND SUBSIDIARIES
 COMPAÑÍA DE SEGURIDAD, S.A. AND SUBSIDIARIES QUARTERLY FINANCIAL INFORMATION Interim Statement for first quarter of financial year 2013 RESULTS FOR PERIOD JANUARY TO MARCH 2013 CONSOLIDATED RESULTS 2012
Ordinary General Shareholders' Meeting of
 Ordinary General Shareholders' Meeting of 8 May 2018 Speech by the CEO Marcelino Fernández Verdes Introduction Fellow shareholders, good morning and many thanks for attending this General Shareholders'
Results Report Results Report 3Q14 3Q14. 13th November, Non Audited Figures 1
 13th November, 2014 Non Audited Figures 1 INDEX 1 Executive Summary 3 1.1 Main figures 3 1.2 Relevant facts 4 2 Consolidated Financial Statements 7 2.1 Income Statement 7 2.1.1 Sales and Backlog 7 2.1.2
CONSOLIDATED FINANCIAL STATEMENTS
 CONSOLIDATED FINANCIAL STATEMENTS FOR THE SIX MONTHS ENDED 30 JUNE 2017 ENDESA, S.A. AND SUBSIDIARIES CONSOLIDATED STATEMENTS OF FINANCIAL POSITION AT 30 JUNE 2017 AND 31 DECEMBER 2016 (*) Unaudited ASSETS
COMPANY PROFILE. ACCIONA, sustainable development as a factor for leadership
 COMPANY PROFILE ACCIONA is one of the world's leading companies in terms of sustainability, standing out especially for its drive to develop renewable energies, infrastructures, water and services, placing
REPSOL 2010 NET INCOME TRIPLES TO 4.69 BILLION EUROS
 2010 EARNINGS Press release Madrid, February 24 th 2011 Number of pages: Recurring net income rose 55% to 2.36 billion REPSOL 2010 NET INCOME TRIPLES TO 4.69 BILLION EUROS The significant profit increase
An Inflexion Point in the Company 1H 2015 RESULTS PRESENTATION. Madrid, 22 nd July 2015
 An Inflexion Point in the Company 1H 2015 RESULTS PRESENTATION Madrid, 22 nd July 2015 Disclaimer In addition to figures prepared in accordance with IFRS, PRISA presents non-gaap financial performance
ABENGOA. Innovative Technology Solutions for Sustainability. Consolidated condensed interim financial statements
 Innovative Technology Solutions for Sustainability 01 Consolidated condensed interim financial statements 01.1 Consolidated condensed statements of financial position as of September 30, 2014 and December