2010 Q1 RESULTS. Conference call - May 12, 2010
|
|
|
- Amberlynn Berniece Barton
- 5 years ago
- Views:
Transcription


1 2010 Q1 RESULTS Conference call - May 12, 2010
2 Q Results Overview The Group continues to perform well even in the midst of a negative scenario Total revenues: +6.9% at EUR 460.7mn EBITDA:+10.5% at EUR 51.8mn; EBIT: +6.9% at EUR 39.4mn Net profit: +14% at EUR 14.7mn THANKS TO Successful implementation ti of the geographical diversificationifi strategy, t which h guarantees a well balanced mix of revenues and an increasing quality for orders in execution especially in EPC/general contracting and project finance/concessions 2
3 Q Results Overview Growth is sustained by: EUR 8.6bn backlog, of which EUR 6.1bn construction contracts in execution with an average life of 4.5 years Over EUR 8bn of incoming orders both in construction and in concession for a total potential order backlog of EUR 17bn The separation between construction and concession activities is being implemented Board of Directors to be held in June 2010 for the kick-off of the concession company Activites for the development of the new concession projects are being pursued Ancona motorway in Italy Gebze-Izmir motorway in Turkey Hydroelectric projects in Latin America Milan Subway Line 5 (extension) 3
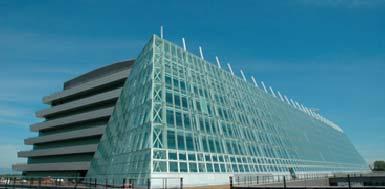
4 Q Results Positive performance in a negative scenario All projects are now in production and guarantee good economic performance Country Project Stage of completion (%) Order backlog Astaldi share value (EUR/000) Ending Year Italy Rome Subway Line C 30% > 2012 Italy Jonica National Road (Lot "DG22") 7% > 2012 Italy Jonica National Road (Lot "DG21") 56% Italy Bologna Centrale High-Speed Railway Station 50% > 2012 Italy Pedemontana Lombarda Highway 3% > 2012 Italy Accademy for Italian Police Officer in Florence 32% > 2012 Italy Turin Railway Hub 65% Italy Four Hospitals in Tuscany 2% Italy Parma-La Spezia Railway 23% > 2012 Italy "Infraflegrea" Project in Naples 49% Italy Milan Subway Line 5 69% Italy Other domestic initiatives Total 2,577.0 Concessions (Italy) 1,875.0 Order backlog (Italy) 4,452.0 Algeria Saida-Mulay Slissen Railway 8% > 2012 Bulgaria Plovdiv-Svilengrad Railway 20% > 2012 Chile Chacayes Dam 38% El Salvador El Chaparral Project 33% > 2012 Poland Warsaw Subway 1% > 2012 Poland Remodernization of NR8 (Piotrokow-Trybunalski stretch) 3% > 2012 Romania Otopeni International Airport in Bucharest (Phase No. 3) 17% Romania Railway Project in Romania 48% Romania Medgidia-Costanza Highway 9% Romania DN79 - Arad Oradea Highway 14% Turkey Istanbul Subway 48% > 2012 Venezuela Puerto Cabello-La Encrujicada Railway 49% > 2012 Venezuela San Juan De Los Morros-San Fernando de Apure Railway 32% Venezuela Chaguaramas-Cabruta Railway 57% 99.7 > 2012 Abroad Other foreign initiatives Total 3.597,0 Concessions (abroad) 594,0 Order backlog (abroad) 4.191,0 Total Order Backlog as of March 31, ,0 4
5 Q Results Positive performance in a negative scenario Successful strategic vision and effective risk management allow the Group to perform well even in the midst of a lasting negative scenario Main economic items (EUR/ ) Q % on rev. Q % on rev. % Total revenues % % +6.9% Costs of production (342.0) (74.2)% (320.5) (74.3)% +6.7% Labor costs (61.0) (13.2)% (59.9) 9) (13.9)% +1.9% Other operating costs (5.9) (1.3)% (3.9) (0.9)% n.m. EBITDA % % +10.5% Amortization (12.6) (2.7)% (10.2) (2.4)% +23.5% (Capitalization of internal costs) % % n.m. EBIT % % +6.9% Net financial charges (16.2) (3.5)% (15.9) (3.7)% +1.8% Effects of evaluation of investments at equity method % % n.m. Profit before taxes % % +11.9% Taxes (9.0) (2.0)% (8.1) (1.9)% n.m. Minorities (0.2) 0.0% (0.3) (0.1)% n.m. Net income % % +14.0% Group s risk management policies have proven effective in mitigating the effects of the latest Venezuelan bolivar devaluation which have affected revenues in terms of volumes, but not the margins Conservative tender and accounting policies together with a strong know-how in project management and eectionallo execution allow to maintain profitability at above average levelsl vs. peers 5
 ASTALDI TRADITIONAL")
: Romania, Bulgaria Turkey (transport infrastr.) Algeria (transport infrast.")
: Florida Latin America (transport infrast.")
 Total construc.")
6 Q Results Positive performance in a negative scenario Successful implementation of the geographical diversification strategy guarantees a well balanced mix of revenues: no activities in PIGS (Portugal, Ireland, Greece, Spain) ASTALDI TRADITIONAL MARKETS Italy (transport infrast., water&energy, civil buildings) Eastern Europe (transport infrast.): Romania, Bulgaria Turkey (transport infrastr.) Algeria (transport infrast., water&energy) Middle East (oil&gas) : Saudi Arabia, Qatar, UAE USA (transport infrast., global procurement): Florida Latin America (transport infrast., ASTALDI NEW MARKETS Poland Running projects: Warsaw Subway Line 6 (general contracting) + NR8 Remordinazation (construction) Total value: EUR 1.1bn Chile Running projects: Chacayes hydroelec. plant (EPC + concession) Total construc. value: USD 282mn Astaldi concess. value: EUR 350mn water&energy): Venezuela, Peru Running projects: Huanza hydroelec. plant Total value: USD 116mn Bolivia, Costa Rica, El Salvador, Honduras, Nicaragua, Guatemala, Panama 6
7 Q Results Net debt is planned to reduce Q net debt affected by seasonality NFP (EUR/000) Q FY 2009 Q Cash and cash equivalents 294, , ,511 Currentfinanciali receivables 29,481 21,789 21,091 Current financial debt (341,360) (365,983) (304,482) Net current financial debt (17,043) 104,118 8,120 Non current financial debt (580,392) (576,400) (472,119) Net financial debt (597,435) (472,282) (463,999) Financial receivables coming from concessions ,705 Total net financial debt ( ) (427,921) (428,293) Own shares 4,382 5,172 5,905 Net financial position (*) (543,350) (422,749) (422,388) Net debt at EUR 543.3mn is planned to reduce in the second half, also benefiting from incoming payments from domestic and foreign contracts In July 2009, Astaldi signed a new syndicated loan for EUR 110mn (average spread: 190bp over EURIBOR 3-months) MAIN BALANCE SHEET ITEMS (EUR/000) March December March Total fixed assets 453, , ,157 Working capital 545, , ,336 Total funds (33,360) (33,364) (31,628) Net invested capital 965, , ,865 Net financial receivables/liabilities (597,435) (472,282) 282) (463,999) Financial receivables coming from concessions 49,703 44,361 35,705 Total financial receivables/liabilities (547,733) (427,921) (428,293) Net equity 418, , ,572 (*) Consider that application of IFRIC12 effective as of January 2010 entailed the classification of infrastructures related to concessions, specifically car parks, among financial assets previously classified among intangible fixed assets. 7
8 Q Results Growth is sustained by backlog Strong commercial network guarantees growth of order backlog and geographical diversification: An increasing quality of orders in execution, and More than EUR 8bn of additional orders in which Astaldi results first in ranking EUR 8.6bn order backlog + > EUR 8bn of incoming orders New initiatives in Italy and abroad to be developed in: - concession sector abroad (i.e. Gebze-Izmir Highway: total investment USD 6.4bn; total estimated concession revenues: USD 23bn; concession period: 22 years + 4 months) - concession sector in Italy (i.e. Ancona Highway: total investiment approx. EUR 600mn; concession period: 30 years - transport infrastructure sector (i.e. extension for Milan Subway Line 5 and Rome Subway Line C) - renewable energy sector (new initiatives in Latin America) ORDER BACKLOG COULD REACH more than EUR 17bn 8


9 Q Results Growth is sustained by backlog The roll-out of the revenues coming from the orders in execution plus the incoming contracts shows that more than 70% of the revenues planned for the next 4 years is secured > EUR 2,750mn EUR 1,869mn 100% EUR 461mn > 70% of secured revenues % of secured revenues Q
10 Q Results Separation of concessions Concession sector development plan: further steps CONCESSION SECTOR DEVELOPMENT PLAN FURTHER STEPS PHASE N. 1 PHASE N. 2 PHASE N. 3 PHASE N. 4 TODAY (June 2010) Kick-off Holding Concession Company Re-engineering financial structure of Concession Company Reporting dedicated to Concession Company Further developments WITHIN
11 Q Results Separation of concessions Car parks Healthcare Transportation Water and Energy Construction and operation of 5 car parks: Car parks in Turin Corso Stati Uniti Porta Palazzo Car parks in Bologna Piazza VIII Agosto Riva Reno Car parks in Verona Piazza della Cittadella Design, construction and operation of: Mestre Hospital (31%) Hospital in Naples (60%) 4 Hospitals in Tuscany (35%) Incoming projects: Opportunities in Italy Milan Subway Line (23.3%) 3%) Incoming projects: Extension of Milan Subway Line 5 project (23.3%) Gebze - Izmir Highway (16.7%) Ancona Motorway Hydroelectric plant in Chile (Chacayes 27,3%) Aguas de San Pedro, Honduras (15%) Incoming projects: Hydroelectric power plants in Latin America 11
12 APPENDIXES 12

 - Design in progress - Work")
 Naples Line 1 Naples Line 6")
 - Excavation progress by by TBM:")


13 Q Results Appendixes Effective results in subway sector, both in Italy and abroad Major subway contracts in progress WARSAW SUBWAY (Poland) - Design in progress - Work completion date: 2013 Milan Line 5 (Italy) Genoa (Italy) Naples Line 1 Naples Line 6 (Italy) Brescia (Italy) ROME SUBWAY LINE C (Turkey) - Excavation progress by by TBM: 48% (referring to the first stretch) - Work completion date: 2011 (first tranche deadline) ISTANBUL SUBWAY (Turkey) - Excavation progress by conventional method: 88.5% - Excavation progress by by TBM:79.2% - Avg. excavation progress by TBM: 22 m/day - Work completion date:


14 Q Results Appendixes Order backlog as of March 31,


15 Q Results Appendixes Geographical contribution as of March 31,


16 Q Results Appendixes Sector contribution as of March 31,
17 Q Results Appendixes Q1 2009: Reclassified consolidated income statements RECLASSIFIED CONSOLIDATED INCOME STATEMENT EUR/000 31/03/10 % 31/03/09 % Revenues 441, % 413, % Other revenues 18, % 17, % Total revenues 460, % 431, % Costs of production (341,958) -74.2% (320,514) -74.3% Added value 118, % 110, % Labor costs (61,025) -13.2% (59,862) -13.9% Other operating costs (5,923) -1.3% 13% (3,893) -0.9% 09% EBITDA 51, % 46, % Amortizations (12,648) -2.7% (10,242) -2.4% (Capitalization of internal construction costs) % % EBIT 39, % 36, % Net financial charges (16,182) -3.5% (15,888) -3.7% Effects of evaluation of investments using the equity method % % Profit (Loss) before taxes 23, % 21, % Taxes (8,988) -2.0% (8,120) -1.9% Profit (loss) for the period 14, % 13, % Minorities (229) 0.0% (347) -0.1% Group net income 14,702 32% 3.2% 12,902 30% 3.0% 17
18 Q Results Appendixes Q1 2009: Reclassified consolidated balance sheet RECLASSIFIED CONSOLIDATED BALANCE SHEET EUR/000 March December March Intangible fixed assets 3,857 3,998 4,376 Tangible fixed assets 318, , ,838 Equity investments 103, ,269 64,110 Other net fixed assets 27,642 31,874 22,832 TOTAL FIXED ASSETS (A) 453, , ,157 Inventories 87,659 90,316 95, Contracts in progress 762, , ,815 Trade receivables 40,532 29,607 26,658 Accounts receivables 649, , ,115 Other assets 158, , ,949 Tax receivables 87,459 78,391 76,960 Advances from customers (353,908) (382,905) (371,520) Subtotal 1,432,885 1,305,757 1,215,910 Trade payables (103,960) (90,034) (64,268) Due to suppliers (516,937) (543,639) (494,777) Other payables (266,256) (265,716) (215,530) Subtotal (887,153) (899,389) (774,575) Working capital (B) 545, , ,336 Employee benefits (9,586) (9,555) (10,578) Provisions for non-current risks and charges (23,774) (23,809) (21,050) Total funds (C) (33,360) (33,364) (31,628) Net invested capital ( D ) = ( A ) + ( B ) + ( C ) 965, , ,865 Cash and cash equivalents 291, , ,793 Current financial receivables 16,475 19,371 18,368 Non-current financial receivables 13,007 2,418 2,723 Securities 3,532 4,175 5,718 Current financial liabilities (341,360) (365,983) (304,482) Non-current financial liabilities (580,392) (576,400) (472,119) Net financial liabilities / receivables ( E ) (597,435) (472,282) (463,999) Financial receivables coming from concessions 49,703 44,361 35,705 Total financial liabilities / receivables (547,733) (427,921) (428,293) Group net equity (399,761) (385,918) (352,063) Minority it equity (18,495) (18,265) (5,509) 509) Net equity ( G ) = ( D ) - ( E ) 418, , ,572 18
- October, Pont Ventoux Hydroelectric (Venezuela) (Italy) (Italy) Hospital in Mestre. Milan Subway, Line 5. Rome Subway, Line C (Italy)
 (Italy) (Italy) Hospital in Mestre. Milan Subway, Line 5. Rome Subway, Line C (Italy)") - October, 2009 - Rome Subway, Line C Caracas-Tuy Railway Hospital in Mestre Milan Subway, Line 5 Pont Ventoux Hydroelectric (Venezuela) Power Plant 2009-2013 Business Plan as of today 2009-20132013 Business
- October, 2009 - Rome Subway, Line C Caracas-Tuy Railway Hospital in Mestre Milan Subway, Line 5 Pont Ventoux Hydroelectric (Venezuela) Power Plant 2009-2013 Business Plan as of today 2009-20132013 Business
1Q 2011 Results Conference call May 11, 2011
 1Q 2011 Results Conference call May 11, 2011 Growing steadily since 1920 1 1Q 2011 Results main items Total revenues up +10.1% to 511M, thanks to the positive trend of activities in Italy and abroad Net
9M 2013 Results. November 11, 2013
 9M 2013 Results November 11, 2013 1 1 GOALS AND ACHIEVEMENTS FOR 2013 OUR GOALS OUR ACHIEVEMENTS Financial close and start-up of Turkish projects Financial support to domestic projects in order to deliver
Business Plan Business Plan
 1 : the scenario The takes account of changes in the domestic scenario, such as: Change in Italian Government and consequent redefinition of public expenditure priorities, causing a slowdown in construction
FY 2012 Results. March 13 th, 2013
 FY 2012 Results March 13 th, 2013 ASTALDI GROUP FY 2012 RESULTS Conference Call, March 13 2013 1 1 2012 RESULTS OVERALL OUTLOOK Positive Group performance in a very difficult year both in the domestic
2005 First Half Consolidated Results
 2005 First Half Consolidated Results 1 Index 1H 2005 Results Transition to IFRS: main impacts Appendix 2 1H 2005 Main Highlights The following data and all comparisons with previous periods are based on
ASTALDI: +14.8% INCREASE IN TOTAL REVENUES TO EUR 2.36 BILLION IN 2011 NET PROFIT OF EUR 71 MILLION, +12.9%
 The BoD of Astaldi approves the consolidated results at 31 December 2011 ASTALDI: +14.8% INCREASE IN TOTAL REVENUES TO EUR 2.36 BILLION IN 2011 NET PROFIT OF EUR 71 MILLION, +12.9% PROPOSED DIVIDEND OF
Milan STAR Conference - FY 2014 Results
 1. Update on Disposals 2. Update on Special Issues 3. New Orders & Backlog 4. 9M 2014 Results 5. Appendix Milan STAR Conference - FY 2014 Results Milan March 24 & 25, 2015 FY 2014 Results Main Items FY
1H 2015 Results A Durable Competitive Advantage
 A Durable Competitive Advantage Rome August 3, 2015 Main Topics STRONG 1H 2015 RESULTS BENEFITING FROM A GOOD COMMERCIAL AND OPERATING PERFORMANCE Total Revenue +15.8%, at EUR 1.4 billion Operating revenue
2006 Second Quarter Results. August 1, 2006
 2006 Second Quarter Results August 1, 2006 1 Foreign activities are a strategic asset that guarantees further business development 2006 Second Quarter Results Strong increase in order backlog (+28% yoy)
ASTALDI, REVENUES OF EUR 1.8 BILLION, +4.6% DURING THE FIRST NINE MONTHS OF THE YEAR and NET PROFIT OF EUR 60 MILLION, +14.5%
 The Board of Directors approves the consolidated results at 30 September 2012 ASTALDI, REVENUES OF EUR 1.8 BILLION, +4.6% DURING THE FIRST NINE MONTHS OF THE YEAR and NET PROFIT OF EUR 60 MILLION, +14.5%
Astaldi in 2010: Net profit of EUR 62.6 million, +12% Revenues of EUR 2 billion, +9.2% Reduction of debt to EUR 384 million, 8.8%
 Astaldi s BoD has approved the consolidated results of Q4 2010 (unaudited) and examined the preliminary consolidated results of 2010 Astaldi in 2010: Net profit of EUR 62.6 million, +12% Revenues of EUR
ASTALDI: AT 30 JUNE 2011, NET PROFIT +12.4% TO EUR 35 MILLION TOTAL REVENUES +14.3% TO OVER EUR 1.1 BILLION NEW ORDERS OF OVER EUR 1.
 The Board of Directors of Astaldi has approved the 2011 half-yearly results ASTALDI: AT 30 JUNE 2011, NET PROFIT +12.4% TO EUR 35 MILLION TOTAL REVENUES +14.3% TO OVER EUR 1.1 BILLION NEW ORDERS OF OVER
FY 2015 Results Presentation Conference Call March
 3 rd Bridge on Bosphorus Turkey The largest suspended bridge at worldwide level FY 2015 Results Presentation Conference Call March 9 2016 1 Over the Last 10 Years Investments have supported a Consistent
H results 2 August 2017
 H1 2017 results 2 August 2017 Delivering the Strategy Plan 2 Sustainable growth Operational discipline Financial strength Major operational milestones met on time Commercial growth continues Revenue geographic
INTERIM REPORT ON OPERATIONS AT 31 MARCH Astaldi, consolidated net profit up by 14%
 INTERIM REPORT ON OPERATIONS AT 31 MARCH 2010 1 Astaldi, consolidated net profit up by 14% Total revenues up by 6.9% to EUR 460.7 million EBITDA: +10.5% to EUR 51.8 million, with the EBITDA margin up to
ASTALDI: NET PROFIT UP +20.1% AT 32 MILLION EUROS NET INDEBTEDNESS DOWN TO MILLION EUROS
 The Board of Directors has approved the Intermediate Report at 30 September 2008 ASTALDI: NET PROFIT UP +20.1% AT 32 MILLION EUROS NET INDEBTEDNESS DOWN TO 467.7 MILLION EUROS Main consolidated data at
PRESS RELEASE S +7.5% TO
 PRESS RELEASE The Board of Directors of Astaldi approves the 2012 half-yearly results ASTALDI: AT 30 JUNE 2012, NET PROFIT +13.6% TO T EUR 39.8 MILLION TOTAL REVENUES S +7.5% TO EUR 1.2 BILLION NEW ORDERS
Astaldi. Italian Investment Seminar April 27, 2005
 Astaldi Italian Investment Seminar April 27, 2005 1 2004-2006 2006 Plan 2005-2009 2009 Plan >> The strong operating capacity of the Group, both in Italy and abroad, as proven by: The efficacy of 2004-2006
2015 Nine Months Results
 1. Update on Disposals 2. Update on Special Issues 3. New Orders & Backlog 4. 9M 2014 Results 5. Appendix 2015 Nine Months Results Rome - November 11, 2015 3 rd Bridge on Bosphorus, Turkey 2015 Nine Months
COMPANY PRESENTATION. FY 2017 Results. March 15, 2018
 COMPANY PRESENTATION FY 2017 Results March 15, 2018 2 Agenda Capital and Financial Strengthening Program FY 2017 Results Appendix Capital and Financial Strengthening Program Key Features 3 300 M CAPITAL
February 10, Astaldi. 4Q 2004 and 2004 Preliminary Results
 Astaldi 4Q 2004 and 2004 Preliminary Results February 10, 2005 1 Main Highlights (Million of euro) 2004 yoy 2006 CAGR 03-06 2004 RESULTS ABOVE 2004-2006 STRATEGIC PLAN TARGETS Order backlog 5,011 13.7%
Interim Financial Report at 31 March 2014
 Interim Financial Report at 31 March 2014 Total revenues of EUR 551.6 million (+3.8%) EBITDA margin up to 13.3%, with EBITDA totalling EUR 73.4 million (+24.4%) EBIT margin of 10.5%, with EBIT totalling
ASTALDI, NET PROFIT INCREASED BY 16.7% TO EURO 10.2 MLN ORDER BACKLOG OUTREACHES EURO 8.5 BLN
 ASTALDI, NET PROFIT INCREASED BY 16.7% TO EURO 10.2 MLN ORDER BACKLOG OUTREACHES EURO 8.5 BLN Main consolidated data as at March 31, 2008 Total revenues scored Euro 334.1 million, +26.4% on an annual basis
2012 LONDON STAR Conference. London, 2 3 October 2012
 2012 LONDON STAR Conference London, 2 3 October 2012 1 1 ASTALDI is the largest Contractor in Italy, operating only in large infrastructures at worldwide level Construction RoW 42% ( 4.2Bn) Construction
PRESS RELEASE THE YEAR
 PRESS RELEASE The Board of Directors of Astaldi approves the 2013 half-yearly results ASTALDI: NET PROFIT OF OVER EURR 40 MILLION, +1% DURING D THE FIRST HALF OF THE YEAR NEW ORDERS OF EUR 2.4 BILLION
Interim Report on Operations at 31 March 2012
 Interim Report on Operations at 31 March 2012 Increase in profits and revenues despite effects of seasonal factors, already largely made up during the early part of Q2. Total revenues of EUR 522.3 million
FY16 Results Presentation
 Muskrat Falls Hydro Plant, Canada FY16 Results Presentation March 14, 2017 Agenda Warsaw subway Line 2, Poland 2016 Highlights Q4 & FY16 results Appendix 2 Fit for the Future our Strategy Plan Sustainable
Astaldi Business Plan. Milan November 15 th, 2012
 Astaldi 2012-2017 Business Plan Milan November 15 th, 2012 1 1 Executive summary 1 Concession: cash-in value to support the growth 2 2012-2017 Business Plan: targets and drivers 3 2012-2017 Business Plan:
Astaldi, the BoD approves the quarterly report at September 30, 2006
 Astaldi, the BoD approves the quarterly report at September 30, 2006 Total revenues of 766.6 million Group net profit for the first nine months of 2006 of 22.6 million Total orders backlog of over 8 billion
Fitter for the Future Strategic Update
 Fitter for the Future Strategic Update 2017-21 Chairman s remarks Global strategic overview Significant market opportunity Basarab Overpass in Bucharest, Romania Naples underground (Toledo Station), Italy
EBIT margin of 10%, with EBIT amounting to EUR 57.4 million (+9.4%) Net profit of EUR 21.2 million (+3.0%)
 Net profit of EUR 21.2 million (+3.0%)") FIRST NINE MONTHS FOR ASTALDI: NET PROFIT UP BY 1.6% TO EUR 61.4 MILLION NEW ORDERS TOTALLING EUR 4.2 BILLION ORDER BACKLOG UP BY 24.5% TO EUR 12.7 BILLION Consolidated results at 30 September 2013 Total
FIRST NINE MONTHS FOR ASTALDI: NET PROFIT UP BY 1.6% TO EUR 61.4 MILLION NEW ORDERS TOTALLING EUR 4.2 BILLION ORDER BACKLOG UP BY 24.5% TO EUR 12.7 BILLION Consolidated results at 30 September 2013 Total
9M 2017 results 14 November 2017
 9M 2017 results 14 November 2017 Agenda 2 Capital and financial strengthening Program Venezuela write-down 9M Results A comprehensive capital and financial strengthening program 3 A 400 million capital
Strategy Plan E Fit for the Future. May 2016
 Strategy Plan 2016-20E Fit for the Future May 2016 Agenda Chairman s remarks Strategy Plan 2016-2020 Q1 2016 Results Appendix 2 Chairman s remarks Transition to renewed BUSINESS MODEL addressing challenges
(Translation from the Italian original which remains the definitive version)
") (Translation from the Italian original which remains the definitive version) Interim Financial Report at 30 June 2014 I ASTALDI Società per Azioni Registered Office/Head Office: Via Giulio Vincenzo Bona
(Translation from the Italian original which remains the definitive version) Interim Financial Report at 30 June 2014 I ASTALDI Società per Azioni Registered Office/Head Office: Via Giulio Vincenzo Bona
RESULTS AT 30 SEPTEMBER 2016
 Astaldi s Board of Directors approves Group s results at 30 September 2016 RESULTS AT 30 SEPTEMBER 2016 REVENUES FOR FIRST NINE MONTHS, UP BY 4.1% TO EUR 2.15 BILLION, NET PROFIT FROM CONTINUING OPERATIONS,
STAR Conference
 1H 2014 Results Value Building Strategy Astaldi Today Outlook Appendix ASTALDI @ STAR Conference London - October 2&3, 2014 Agenda Value Building Strategy Astaldi Today Outlook Appendix Latest news & 1H
INTERIM REPORT ON OPERATIONS AT MARCH 31, 2008
 1 INTERIM REPORT ON OPERATIONS AT MARCH 31, 2008 CONTENTS Introduction Reclassified consolidated income statement Reclassified consolidated balance sheet and financial position Comments on the Group s
Translation from the Italian original, that remains the definitive version. Interim Report on Operations at 30 September 2017
 Interim Report on Operations at 30 September 2017 ASTALDI Società per Azioni Head Office: Via Giulio Vincenzo Bona 65-00156 Rome (Italy) Registered with the Companies Register of Rome Tax code No.: 00398970582
Astaldi Società per Azioni Registered Office and Head Office: Rome (Italy), Via Giulio Vincenzo Bona no. 65 Entered in the Rome Company Register TIN
, Via Giulio Vincenzo Bona no. 65 Entered in the Rome Company Register TIN") Half Yearly Financial Report 30 June 2008 Astaldi Società per Azioni Registered Office and Head Office: Rome (Italy), Via Giulio Vincenzo Bona no. 65 Entered in the Rome Company Register TIN 00398970582
Half Yearly Financial Report 30 June 2008 Astaldi Società per Azioni Registered Office and Head Office: Rome (Italy), Via Giulio Vincenzo Bona no. 65 Entered in the Rome Company Register TIN 00398970582
(Translation from the Italian original which remains the definitive version)
") 0 Astaldi Società per Azioni Registered Office/Head Office: Via Giulio Vincenzo Bona 65-00156 Rome (Italy) Registered with the Companies Register of Rome Tax Code: 00398970582 R.E.A. No. 152353 VAT No.:
0 Astaldi Società per Azioni Registered Office/Head Office: Via Giulio Vincenzo Bona 65-00156 Rome (Italy) Registered with the Companies Register of Rome Tax Code: 00398970582 R.E.A. No. 152353 VAT No.:
Astaldi Società per Azioni Corporate and Head Offices: Via Giulio Vincenzo Bona 65, Rome (Italy) Registered with the Companies Register of Rome TIN:
 Registered with the Companies Register of Rome TIN:") Half-Year Financial Report at 30 June 2009 Astaldi Società per Azioni Corporate and Head Offices: Via Giulio Vincenzo Bona 65, Rome (Italy) Registered with the Companies Register of Rome TIN: 00398970582
Half-Year Financial Report at 30 June 2009 Astaldi Società per Azioni Corporate and Head Offices: Via Giulio Vincenzo Bona 65, Rome (Italy) Registered with the Companies Register of Rome TIN: 00398970582
THE BOARD OF DIRECTORS OF ASTALDI APPROVES A SHARE CAPITAL INCREASE UP TO A MAXIMUM OF EUR 300 MILLION AND CALLS THE SHAREHOLDERS MEETING
 THE BOARD OF DIRECTORS OF ASTALDI APPROVES A SHARE CAPITAL INCREASE UP TO A MAXIMUM OF EUR 300 MILLION AND CALLS THE SHAREHOLDERS MEETING 2018-2022 STRATEGIC PLAN AND CONSOLIDATED RESULTS OF Q1 2018 ALSO
Interim financial report at 30 June 2013
 (Translation from the Italian original which remains the definitive version) Interim financial report at 30 June 2013 Profit for the period of EUR 40.2 million (+1% YOY) Total revenue of EUR 1,160.8 million
Corporate Presentation
 Corporate Presentation 2018 Mission Statement Our mission is to provide our clients with security so that they can concentrate on growing their business. We strive to create value and long term mutually
THE BOARD OF DIRECTORS HAS EXAMINED A CAPITAL AND FINANCIAL STREGTHENING PROGRAMME AND APPROVED THE INTERIM REPORT ON OPERATIONS AT 30 SEPTEMBER
 PRESS RELEASE THE BOARD OF DIRECTORS HAS EXAMINED A CAPITAL AND FINANCIAL STREGTHENING PROGRAMME AND APPROVED THE INTERIM REPORT ON OPERATIONS AT 30 SEPTEMBER 2017 Equity and financial consolidation The
2007 Consolidated Annual Report
 2007 Consolidated Annual Report Main ratios (million of euro) Main economic items Total revenues EBIT EBIT/margin (%) Net income Net income/total revenues (%) Main balance-sheet items Fixed assets Net
ASTALDI Società per Azioni Head Office: Via Giulio Vincenzo Bona Rome (Italy) Registered with the Companies Register of Rome Tax code no.
 Registered with the Companies Register of Rome Tax code no.") Interim Report on Operations at 31 March 2017 1 ASTALDI Società per Azioni Head Office: Via Giulio Vincenzo Bona 65-00156 Rome (Italy) Registered with the Companies Register of Rome Tax code no.: 00398970582
Interim Report on Operations at 31 March 2017 1 ASTALDI Società per Azioni Head Office: Via Giulio Vincenzo Bona 65-00156 Rome (Italy) Registered with the Companies Register of Rome Tax code no.: 00398970582
FY2016 RESULTS. 1 February 2016 to 31 January Inditex continues to roll out its global, fully integrated store and online model.
 FY2016 RESULTS 1 February 2016 to 31 January 2017 Inditex continues to roll out its global, fully integrated store and online model. Strong operating performance: Net sales for FY2016 reached 23.3 billion,
ASTALDI GROUP QUARTERLY REPORT AT MARCH 31, 2006
 1 ASTALDI GROUP QUARTERLY REPORT AT MARCH 31, 2006 CONTENTS GENERAL INFORMATION GROUP STRUCTURE CORPORATE BODIES GROUP CONSOLIDATED ACCOUNTS STATEMENTS AND NOTES CONSOLIDATION AREA ACCOUNTING STANDARDS
FY2017 RESULTS. 1 February 2017 to 31 January Inditex continues to roll out its global, fully integrated store and online platform.
 FY2017 RESULTS 1 February 2017 to 31 January 2018 Inditex continues to roll out its global, fully integrated store and online platform. Strong operating performance: Net sales for FY2017 reached 25.3 billion,
Building a stronger Astaldi
 Building a stronger Astaldi Investor presentation May 16, 2018 Disclaimer 1 THIS PRESENTATION IS NOT AN OFFER OR AN INVITATION TO BUY OR SELL SECURITIES. IMPORTANT: Please read the following before continuing.
Interim Report on Operations at 30 September 2015
 Interim Report on Operations at 30 September 2015 Main consolidated results: - Total revenue up to EUR 2.1 billion (+11.6% compared to 30 September 2014) - EBITDA margin of 11.7%, with EBITDA of EUR 242.8
A S T A L D I G R O U P
 A S T A L D I G R O U P QUARTERLY REPORT AT JUNE 30, 2006 CONTENTS GENERAL INFORMATION CORPORATE BODIES GROUP CONSOLIDATED ACCOUNTS STATEMENTS AND NOTES CONSOLIDATION AREA ACCOUNTING STANDARDS AND VALUATION
Interim Report on Operations at 30 September 2016
 (Translation from Italian original which remains the definitive version Translation under review) Interim Report on Operations at 30 September 2016 Financial results at 30 September 2016, in line with
Building a stronger Astaldi
 Building a stronger Astaldi Investor Presentation June 2018 Disclaimer 1 THIS PRESENTATION IS NOT AN OFFER OR AN INVITATION TO BUY OR SELL SECURITIES. IMPORTANT: Please read the following before continuing.
A S T A L D I G R O U P
 A S T A L D I G R O U P QUARTERLY REPORT AT JUNE 30, 2007 2 contents group profile corporate bodies group consolidated account statements and notes consolidation area accounting standards and valuation
EAST BALT BAKERIES July 2017 ACQUISITION
 EAST BALT BAKERIES July 2017 ACQUISITION E AST BA LT AT A G L A N C E Leading foodservice-focused company that supplies baked goods to Quick Service Restaurants ( QSR ) across the world Operates 21 bakeries
SHARE IN OUR FUTURE AN ADVENTURE IN EMPLOYEE STOCK OWNERSHIP DEBBI MARCUS, UNILEVER
 SHARE IN OUR FUTURE AN ADVENTURE IN EMPLOYEE STOCK OWNERSHIP DEBBI MARCUS, UNILEVER DEBBI.MARCUS@UNILEVER.COM RUTGERS SCHOOL OF MANAGEMENT AND LABOR RELATIONS NJ/NY CENTER FOR EMPLOYEE OWNERSHIP AGENDA
EQUITY REPORTING & WITHHOLDING. Updated May 2016
 EQUITY REPORTING & WITHHOLDING Updated May 2016 When you exercise stock options or have RSUs lapse, there may be tax implications in any country in which you worked for P&G during the period from the
Financial Results CONFERENCE CALL Third Quarter Results. Cesena 14 th November2014. Ended 30 th September 2014
 Financial Results 2014 Third Quarter Results Ended 30 th September 2014 CONFERENCE CALL Cesena 14 th November2014 1. TREVI Group 2. 9M 2014 Financial Results 3. Q&A 4. Appendix Rome (ITALY) Metro Line
Enel Green Power 9M 2015 consolidated results
 Enel Green Power Rome November 13, 2015 Agenda Overview of recent events Analysis of results Closing remarks 1 Active portfolio management Exit from El Salvador Cash-in: 224 m Capital gain: 123 m Entry
Wedbush Morgan California Dreamin Santa Monica, CA December 9, 2008
 Wedbush Morgan California Dreamin 2008 Santa Monica, CA December 9, 2008 GUESS?, Inc. Carlos Alberini President & Chief Operating Officer 2 Safe Harbor Statement Except for historical information contained
SANGAM GLOBAL PHARMACEUTICAL & REGULATORY CONSULTANCY
 SANGAM GLOBAL PHARMACEUTICAL & REGULATORY CONSULTANCY Regulatory Affairs Worldwide An ISO 9001:2015 Certified Company Welcome to Sangam Global Pharmaceutical & Regulatory Consultancy (SGPRC) established
To consolidate as leading. Italian General Contractor and. enhance value, progress. and well-being for the communities
 a n n u a l r e p o r t 2004 To consolidate as leading Italian General Contractor and m i s s i o n enhance value, progress and well-being for the communities m a i n r a t i o s (million of euro) 2004
2014 Results Presentation
 2014 Results Presentation Madrid, March 2 nd 2015 Finance Department Investor Relations 1 Disclaimer This document may contain forward-looking statements regarding intentions, expectations or predictions
Annual Shareholders Meeting
 Annual Shareholders Meeting 23 April 2013 Group overview Vianini Lavori is one of the main Italian General Contractors and it operates in the large infrastructure, water and highways concessions industries.
Consolidated financial results 2014
 PRESS RELEASE Consolidated financial results 2014 The Board of Directors has approved the Consolidated Financial Statement at December 31st, 2014. Consolidated income statement data: o Total revenues of
THE BOARD OF DIRECTORS APPROVES THE RESULTS AT 31 DECEMBER THE BoD EXAMINED THE PROPOSAL OF CAPITAL AND FINANCIAL STRENGTHENING PROGRAMME
 THE BOARD OF DIRECTORS APPROVES THE RESULTS AT 31 DECEMBER 2017 THE BoD EXAMINED THE PROPOSAL OF CAPITAL AND FINANCIAL STRENGTHENING PROGRAMME Capital and financial strengthening programme The Company
ASTALDI GROUP REPORT FOR THE THREE MONTHS AS AT SEPTEMBER 2002
 ASTALDI GROUP REPORT FOR THE THREE MONTHS AS AT SEPTEMBER 2002 0 CONTENTS GENERAL STRUCTURE OF THE GROUP GEOGRAPHICAL AREAS DIRECTORS, SENIOR MANAGERS AND AUDITORS CONSOLIDATED STATEMENTS AND NOTES SCOPE
2017. Future and concreteness.
 annual report 2017. Future and concreteness. Construction means imagination, design, giving shape to the future. OPENING LAYING OF THE FIRST STONE AWARD 11 October 2017 Opening of the Arts and Science
a closer look GLOBAL TAX WEEKLY ISSUE 249 AUGUST 17, 2017
 GLOBAL TAX WEEKLY a closer look ISSUE 249 AUGUST 17, 2017 SUBJECTS TRANSFER PRICING INTELLECTUAL PROPERTY VAT, GST AND SALES TAX CORPORATE TAXATION INDIVIDUAL TAXATION REAL ESTATE AND PROPERTY TAXES INTERNATIONAL
GEK TERNA GROUP. Group presentation
 GEK TERNA GROUP Group presentation GEK TERNA Group: Business Divisions Business Divisions Energy Concessions Construction Real Estate Supplementary activities (Industrial Products, Quarries) 2 GEK TERNA
WORLD HEALTH ORGANISATION MONDIALE. NINTH WORLD HEALTH ASSEMBLY Jg? \ A9/P&B/19 ^! fr t 15 May 1956 Agenda item 6.5 îj. L,, л
 WORLD HEALTH ORGANISATION MONDIALE ORGANIZATION DE LA SANTÉ NINTH WORLD HEALTH ASSEMBLY Jg? \ A9/P&B/19 ^! fr t 15 May 1956 Agenda item 6.5 îj. L,, л Q-u L. * ORIGINAL: ENÓLISH REVIEW AND APPROVAL OF THE
ASTM GROUP Investor Presentation 2018
 ASTM GROUP Investor Presentation 2018 2 ASTM GROUP DISCLAIMER This document (the document ) has been prepared by ASTM Group (the Company ) for the sole purpose described herein. Under no condition should
DIRECTORS REPORT PART I
 DIRECTORS REPORT PART I Directors Report Financial highlights 24 ANNUAL REPORT 2017 The following tables show the Group s adjusted key financial indicators for 2017 compared to the previous year. Adjustments
Enel Green Power business plan. Rome - April 3 rd 2014
 Enel Green Power 20142018 business plan Rome April 3 rd 2014 EGP 20142018 business plan Agenda Snapshot on 2013 key achievements F. Starace, CEO Focus on geothermal R. Deambrogio, Head of Italy & Europe
2009 Half Year Results. August 25, 2009
 1 2009 Half Year Results August 25, 2009 2 Caution statement This presentation may contain forward looking statements, which are subject to risk and uncertainty. A variety of factors could cause our actual
Gli strumenti SACE-SIMEST a supporto dell internazionalizzazione
 Gli strumenti SACE-SIMEST a supporto dell internazionalizzazione CDP Group: we promote the future WE FINANCE public investments, support international cooperation, and drive the development of Italy's
Today's CPI data: what you need to know
 Trend Macrolytics, LLC Donald Luskin, Chief Investment Officer Thomas Demas, Managing Director Michael Warren, Energy Strategist Data Insights: Consumer Price Index, Producer Price Index Friday, July 14,
HEALTH WEALTH CAREER 2017 WORLDWIDE BENEFIT & EMPLOYMENT GUIDELINES
 HEALTH WEALTH CAREER 2017 WORLDWIDE BENEFIT & EMPLOYMENT GUIDELINES WORLDWIDE BENEFIT & EMPLOYMENT GUIDELINES AT A GLANCE GEOGRAPHY 77 COUNTRIES COVERED 5 REGIONS Americas Asia Pacific Central & Eastern
FY16 Preliminary Financial Results
 we build value FY16 Preliminary Financial Results FY16 Preliminary Financial Results Agenda Business Update Pietro Salini Chief Executive Officer Financial Update Massimo Ferrari General Manager Finance
Priorities for Productivity and Income (PPIs) Country Results
 Country Results") Priorities for Productivity and Income (PPIs) Country Results Bolivia Alejandro Izquierdo Jimena Llopis Umberto Muratori Jose Juan Ruiz 2015 Priorities for Productivity and Income (PPIs) Country Results
Priorities for Productivity and Income (PPIs) Country Results Bolivia Alejandro Izquierdo Jimena Llopis Umberto Muratori Jose Juan Ruiz 2015 Priorities for Productivity and Income (PPIs) Country Results
2017 EU-wide Transparency Exercise
 ound_3 5 TRA Bank Name LEI Code Country Code 529900V3O1M5IHMOSF46 DE St 201612 201706 Capital (mln EUR, %) COREP CODE REGULATION A OWN FUNDS 2,043 2,011 C 01.00 (r010,c010) Articles 4(118) and 72 of CRR
2012 results. Results. Second Half February Sacyr Vallehermoso 1
 Results Second Half 2013 28 February 2014 Sacyr Vallehermoso 1 HIGHLIGHTS 1. Operating performance 2. Corporate business 3. Share price trend 4. Reduction of financial debt Sacyr Vallehermoso 2 Operating
Profile of the Group in 2015
 A 0 Profile of the Group in 2015 Obrascón Huarte Lain (OHL) ranks among the leading international concession and construction groups, with more than 100 years of experience and an outstanding presence
2017 EU-wide Transparency Exercise
 ound_3 5 TRA Bank Name LEI Code Country Code EV2XZWMLLXF2QRX0CD47 SE Ko 201612 201706 Capital (mln EUR, %) As of 31/12/2016 As of 30/06/2017 COREP CODE REGULATION A OWN FUNDS 668 715 C 01.00 (r010,c010)
2017 EU-wide Transparency Exercise
 ound_3 5 TRA Bank Name LEI Code Country Code 529900H2MBEC07BLTB26 PT Ca 201612 201706 Capital (mln EUR, %) COREP CODE REGULATION A OWN FUNDS 1,162 1,211 C 01.00 (r010,c010) Articles 4(118) and 72 of CRR
2017 EU-wide Transparency Exercise
 ound_3 5 TRA Bank Name LEI Code Country Code J48C8PCSJVUBR8KCW529 IT Ba 201612 201706 Capital (mln EUR, %) COREP CODE REGULATION A OWN FUNDS 3,151 3,141 C 01.00 (r010,c010) Articles 4(118) and 72 of CRR
2017 EU-wide Transparency Exercise
 ound_3 5 TRA Bank Name LEI Code Country Code 222100ZXZ9BRGDMKXL75 SI Bi 201612 201706 Capital (mln EUR, %) COREP CODE REGULATION A OWN FUNDS 370 393 C 01.00 (r010,c010) Articles 4(118) and 72 of CRR A.1
2017 EU-wide Transparency Exercise
 ound_3 5 TRA Bank Name LEI Code Country Code 549300271OUEJT4RYD30 SI Ab 201612 201706 Capital (mln EUR, %) COREP CODE REGULATION A OWN FUNDS 495 504 C 01.00 (r010,c010) Articles 4(118) and 72 of CRR A.1
Allianz Group Financial information as of 31 March 2018
 Allianz Group Financial information as of 31 March 2018 Reporting by business segments and quarters (starting from 1Q 2017) Consolidated Balance Sheets Asset allocation Allianz Group overview Property-Casualty
Clinical Trials Insurance
 Allianz Global Corporate & Specialty Clinical Trials Insurance Global solutions for clinical trials liability Specialist cover for clinical research The challenges of international clinical research are
2017 EU-wide Transparency Exercise
 ound_3 5 TRA Bank Name LEI Code Country Code 529900GGYMNGRQTDOO93 NL N. 201612 201706 Capital (mln EUR, %) COREP CODE REGULATION A OWN FUNDS 3,933 4,269 C 01.00 (r010,c010) Articles 4(118) and 72 of CRR
2017 EU-wide Transparency Exercise
 ound_3 5 TRA Bank Name LEI Code Country Code 529900HEKOENJHPNN480 FI Ku 201612 201706 Capital (mln EUR, %) COREP CODE REGULATION A OWN FUNDS 1,124 1,218 C 01.00 (r010,c010) Articles 4(118) and 72 of CRR
2017 EU-wide Transparency Exercise
 ound_3 5 TRA Bank Name LEI Code Country Code PSNL19R2RXX5U3QWHI44 IT Me 201612 201706 Capital (mln EUR, %) COREP CODE REGULATION A OWN FUNDS 8,469 8,879 C 01.00 (r010,c010) Articles 4(118) and 72 of CRR
2017 EU-wide Transparency Exercise
 ound_3 5 TRA Bank Name LEI Code Country Code 5493001BABFV7P27OW30 SI NO 201612 201706 Capital (mln EUR, %) COREP CODE REGULATION A OWN FUNDS 1,336 1,323 C 01.00 (r010,c010) Articles 4(118) and 72 of CRR
2017 EU-wide Transparency Exercise
 ound_3 5 TRA Bank Name LEI Code Country Code M6AD1Y1KW32H8THQ6F76 GR Pi 201612 201706 Capital (mln EUR, %) COREP CODE REGULATION A OWN FUNDS 9,003 8,829 C 01.00 (r010,c010) Articles 4(118) and 72 of CRR
Summary 715 SUMMARY. Minimum Legal Fee Schedule. Loser Pays Statute. Prohibition Against Legal Advertising / Soliciting of Pro bono
 Summary Country Fee Aid Angola No No No Argentina No, with No No No Armenia, with No No No No, however the foreign Attorneys need to be registered at the Chamber of Advocates to be able to practice attorney
2018 Global Medical Trends Survey Report
 2018 Global Medical Trends Survey Report Executive summary The cost of medical care continues to rise across the globe. Insurers responding to the 2018 Willis Towers Watson Global Medical Trends Pulse