GungHo Online Entertainment, Inc. FY2013 Financial Results
|
|
|
- Gabriella Caldwell
- 5 years ago
- Views:
Transcription

1 GungHo Online Entertainment, Inc. FY2013 Financial Results Feb 4, 2014
2 FY2013 Financial Highlights Director CFO Kazuya Sakai 2
3 FY2013 Summary Record High Sales and Income 3
 163,060 120,000 100,000 80,000 91,228 60,000 40,000 20,000 0 25,821 10,293 9,240 9,607 9,298 1,743 1,844 1,176 FY2009 FY2010 FY2011 FY2012")
4 Trends in Consolidated Sales & Operating Income (Unit: millions of yen) 180, , ,000 Sales Operating Income Sales Operating Income increase(yoy) increase(yoy) 163, , ,000 80,000 91,228 60,000 40,000 20, ,821 10,293 9,240 9,607 9,298 1,743 1,844 1,176 FY2009 FY2010 FY2011 FY2012 FY2013 4
5 Trends in Quarterly Consolidated Sales & Operating Income Sales increase (YoY) (Unit: millions of yen) 50,000 45,000 Operating Income Sales Operating Income 43,717 increase (YoY) 41,639 46,799 40,000 35,000 30,000 25,000 30,904 26,538 23,360 22,712 20,000 18,616 15,000 10,000 5, ,121 6,886 3,291 3,846 4, ,392 1Q Q 3Q 4Q 1Q Q 3Q 4Q 5
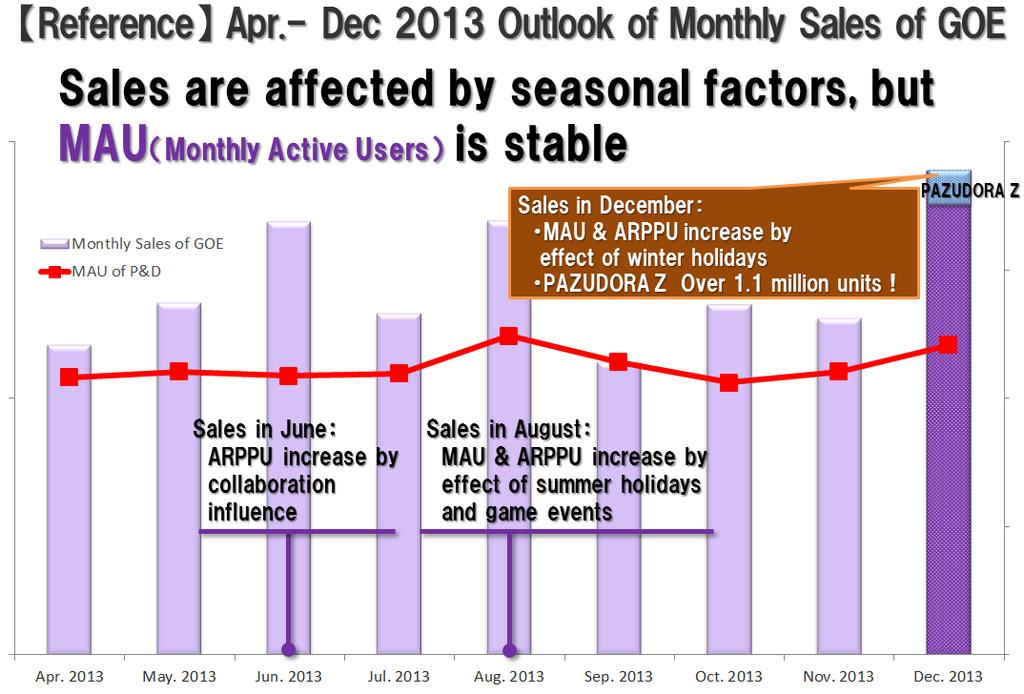
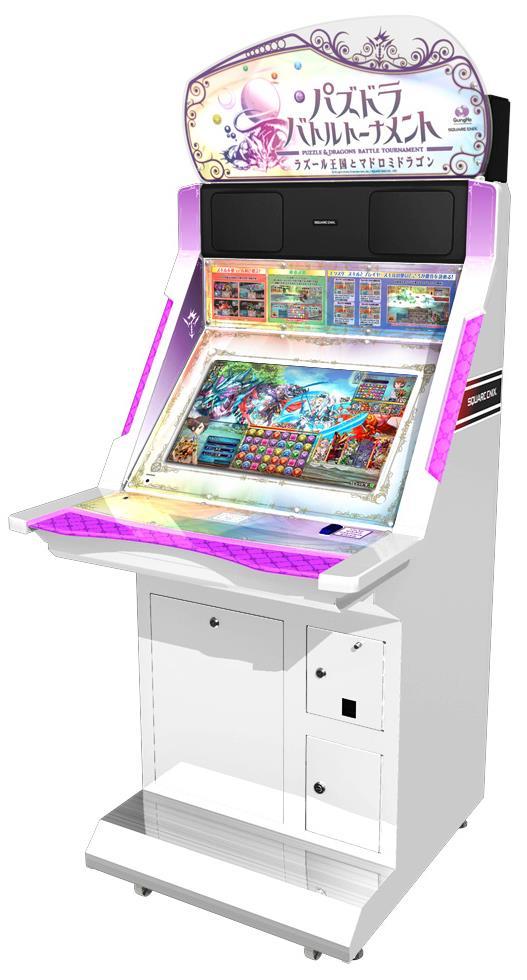
6 (Unit: millions of yen) Trends in Quarterly Data of Mobile Consumer Business 50,000 40,000 30,000 20,000 P&D continues to grow PAZUDORA Z is good sales Record high sales in 4Q 42,132 SaleSales s Operating Income Operating Income Rate 35.4% 45.8% 56.7% 12, % 29,226 18, % 26,958 40, % 45, % 23,937 23, % 80.0% 60.0% 40.0% 10,000 0 (10,000) 6,897 1,195 1,936 2, ,251 1Q Q 3Q 4Q 1Q Q 3Q 4Q -11.9% 20.0% 0.0% -20.0% (Note) Above amount not including adjustments 6
7 7
8 Trends in Quarterly data of PC Online Business Because of user shift from PC to smartphone, the ways of playing PC game have been changed (Unit: millions of yen) 2,500 2,000 1,500 1, (500) (1,000) 2, % 580 1,969 1, % 16.8% , % 191 1, % 43 1, % -80 S Sales al Operating Income e Operating Income Ratio 1,360 1, % 1Q Q 3Q 4Q 1Q Q 3Q 4Q % 40.0% 30.0% 20.0% 10.0% 0.0% -10.0% -20.0% -30.0% -40.0% -50.0% (Note) Above amounts are not including adjustments 8
9 Consolidated Profit and Loss Sheet summary (YoY) Unit: millions of yen Jan. Dec Jan. Dec Amount Component ratio Amount Component ratio Change ratio YoY Sales 25, % 163, % 531.5% Sales increase with success of P&D and other smartphone game Cost of sales 9, % 53, % 465.1% Fee increase to platformers Gross profit margin 16, % 109, % 569.5% SGA 7, % 18, % 162.7% Ad expenses increase by TV commercials Operating income 9, % 91, % 881.1% Ordinary income 9, % 90, % 863.1% Equity method investment loss by Supercell 1.2 billion yen (Cost of stock acquisition) Net income 8, % 54, % 567.1% Corporation tax etc billion yen 9

10 Consolidated Balance Sheet Summary Unit: millions of yen End of Dec 2012 End of Dec 2013 Change ratio Note Current Assets 19,722 87, % Cash and deposits increase with sales increase Tangible Fixed Assets % Intangible Fixed Assets 3,077 2, % Investment and other Assets 1,775 34,939 1,868.2% Investment securities increase with acquisition of Surpercell Total Fixed Assets 5,362 37, % Total Assets 25, , % Current Liabilities 4,939 46, % Accrued tax payable, etc. increase Fixed Liabilities 754 1, % Long-term debts of subsidiary increase Total Liabilities 5,693 47, % Net Assets 19,391 77, % Accumulated earnings increase Total Net Assets and Liabilities 25, , % 10
11 First Dividend 250 yen per share We perform a stock split at the rate of 100 per 1 common stock on January 1, 2014 and adopt a unit stock system to assume the number of the stock of 1 unit 100 stocks. In addition, we pay a dividend based on a number of stocks before stock split about the year-end dividend of FY2013, because an effective date of stock split is January 1,

12 Acquisition of Treasury shares 3 billion yen 12
 : Start service for Android os on Jan. 23 rd 4.")
 : Cumulative number of shipments over1.3m units Note 1: There is a possibility that the numerical value above will be revised.")
13 Monthly Non-consolidated Sales Forecast January 16.5 billion yen (87.4% YoY increase) 1.P&D(Japan) : Achieved 24M downloads on Jan. 4 th 2.Road to Dragon : Achieved 2M downloads on Jan. 1 st 3.P&D(Hong Kong Taiwan) : Start service for Android os on Jan. 23 rd 4.Divine Gate(Japan) : Achieved 2M downloads on Jan. 23 rd 5.P&D(Worldwide) : Start collaboration with Hello Kitty World from Jan. 27 th 6.PAZUDORA Z(Japan) : Cumulative number of shipments over1.3m units Note 1: There is a possibility that the numerical value above will be revised. Note 2: It is not guaranteed that an achievement above will continue into the future. 13
14 GungHo Growth Strategy CEO Kazuki Morishita 14

15 Worldwide Sales Rank Worldwide Game Revenue Rank No.1 *AppAnnie APP ANNIE INDEX : 2013 RETROSPECTIVE The Top Trends of

16 Worldwide Publisher Sales Rank Worldwide Sales Rank by Publisher No.1 *AppAnnie APP ANNIE INDEX : 2013 RETROSPECTIVE The Top Trends of


17 Overwhelming No.1 In Smartphone Market 17

18 1 2 3 KAZUNOMICS 18
19 1 Maximize Existing Value 19
20 1 Gain Stable Profit Establish Brand 20
21 1 One Source Multi-Use 21


22 1 Over 1.3 million units! *As of January 31, 2014 *Including download sales in Nintendo eshop 22


23 1 23
24 1 P&D for smartphone New game addition Coming soon 24
25 2 Create New Value 25
26 2 Accumulate Profit Base Establish Further Pillar 26


27 2 けり Divine Gate 2 million DL Princess Punt Sweets 7 million DL Amount of downloads are not including overlap. 27

28 Downloads Rank in JAPAN 23million DL 7milliom DL Downloads Rank in JAPAN No.1 *AppAnnie APP ANNIE INDEX : 2013 RETROSPECTIVE The Top Trends of

29 Sales Rank in JAPAN Sales Rank in JAPAN No.1 *AppAnnie APP ANNIE INDEX : 2013 RETROSPECTIVE The Top Trends of

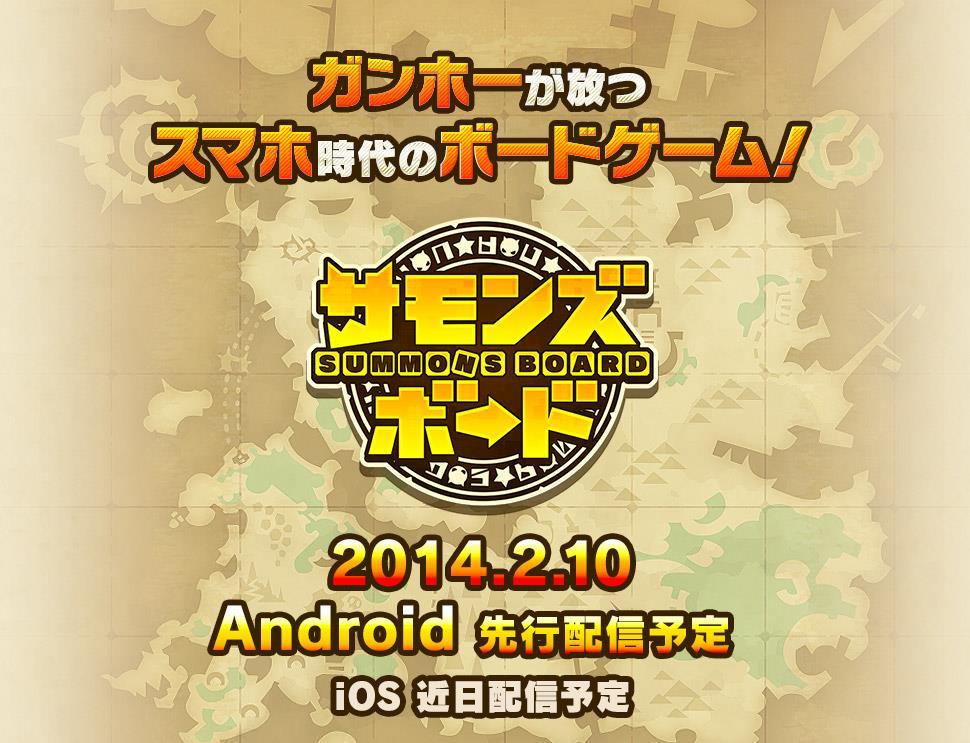
30 2 Release of New Game Feb. 10,
31 31

32 3 Strengthen Overseas Expansion 32
33 3 Maximize Income Further Growth Base 33
34 3 Utilization of SUPERCELL Cooperation with Overseas Branch 34

35 3 Universal Release of New Game 35


36 1. Maximize Existing Value 2. Create New Value KAZUNOMICS 3. Strengthen Overseas Expansion 36
37 Essence 37
38 Essence= Development of Fun Game 38

39 Only GungHo that made P&D can beyond P&D 39
40 Only original can beyond original 40
41 We are the World. 41
42 The strategy, plan and forecast within this material have been determined based on information available at this moment. Therefore, actual performance and similar information are subject to influence from various factors, and may differ from the forecasts presented herein. Please be aware that this material includes risk and uncertainty. The company disclaims any obligation to update or revise information and data, whether as a results of new information, future events or otherwise. 42
GungHo Online Entertainment, Inc. s Transfer of Shares in its Specified Subsidiary to SoftBank
 August 21, 2014 SoftBank Corp. GungHo Online Entertainment, Inc. s Transfer of Shares in its Specified Subsidiary to SoftBank GungHo Online Entertainment, Inc. ( GungHo ), a subsidiary of SoftBank Corp.
Fiscal Year Ending March 2017 Financial Results
 Fiscal Year Ending March 2017 Financial Results Financial Summary (FY2016) FY2015 FY2016 YoY Change Amount Ratio Amount Ratio Amount Rate of change Sales 38,332 100.0% 37,034 100.0% 1,298 3.4% Operating
Q2 FY2016 Operating Results
 Q2 FY2016 Operating Results November 4, 2016 DeNA Co., Ltd. 1. Financial Results 2. Strategy and Initiatives 3. Guidance 4. Reference 1 Financial Results Summary Both IFRS and non-gaap operating profit
3. Consolidated Business Forecasts of FY 3/2019 (April 1, 2018 March 31, 2019) H1 Net Sales Operating Profit Ordinary Profit Profit Attributable to Ow
 H1 Net Sales Operating Profit Ordinary Profit Profit Attributable to Ow") Q1 FY 3/2019 Summary of Consolidated Financial Results August 6, 2018 Company Name Wacom Co., Ltd. (Code Number: 6727 TSE1) (URL http://www.wacom.com ) Representative: Nobutaka Ide, CEO TEL: +81-3-5337-6502
Q1 FY 3/2019 Summary of Consolidated Financial Results August 6, 2018 Company Name Wacom Co., Ltd. (Code Number: 6727 TSE1) (URL http://www.wacom.com ) Representative: Nobutaka Ide, CEO TEL: +81-3-5337-6502
Investor Presentation Q NEXON Co., Ltd.
 Investor Presentation Q4 2012 NEXON Co., Ltd. 2012 Overview and 2013 Outlook 2 2012: Another Year of Double-Digit Growth (Unit: billions) Revenues Operating Income 87.6 24% Growth 108.4 38.2 25% Growth
IGG Inc. March Annual Results
 IGG Inc. March 2017 Annual Results Disclaimer This presentation and the accompanying slides (the Presentation ) which have been prepared by IGG INC (the Group ) do not constitute any offer or invitation
Fiscal Year Ending March st Half Financial Results
 Fiscal Year Ending March 2017 1st Half Financial Results Financial Summary (FY2016 1st Half) Achieved sales and profit YoY increase! Achieved all-time high sales for the first half! (Units: Millions of
Notice of Convocation of the 20th Annual General Meeting of Shareholders
 Dear shareholders Securities code: 3765 March 6, 2017 1-11-1,Marunouchi, Chiyoda-ku, Tokyo, 100-0005 Japan GungHo Online Entertainment, Inc. President & CEO Kazuki Morishita Notice of Convocation of the
Summary of Consolidated Financial Results for the 3rd Quarter (Unaudited)
") Summary of Consolidated Financial Results for the 3rd Quarter (Unaudited) Date of Issue:February 13, 2004 Company Name: CAPCOM Co., Ltd. Stock Exchange: Tokyo, Osaka Company Code: 9697 Location of Headquarters:
Summary of Consolidated Financial Results for the 3rd Quarter (Unaudited) Date of Issue:February 13, 2004 Company Name: CAPCOM Co., Ltd. Stock Exchange: Tokyo, Osaka Company Code: 9697 Location of Headquarters:
Annual Results. IGG Inc March 2018
 Annual Results IGG Inc March 2018 Disclaimer This presentation and the accompanying slides (the Presentation ) do not constitute any offer or invitation to purchase or subscribe for any securities, and
Japan s Leading All-in Provider of Internet Services. Copyright (C) 2013 GMO Internet, Inc. All Rights Reserved.
 2013 GMO Internet, Inc. All Rights Reserved.") Japan s Leading All-in Provider of Internet Services Fiscal Year 2012 Results Presentation Masatoshi Kumagai, CEO Masashi Yasuda, CFO February 6, 2013 GMO Internet, Inc. (TSE1: 9449) 2 About the Use of
Japan s Leading All-in Provider of Internet Services Fiscal Year 2012 Results Presentation Masatoshi Kumagai, CEO Masashi Yasuda, CFO February 6, 2013 GMO Internet, Inc. (TSE1: 9449) 2 About the Use of
Third Quarter of FY Japan Display Inc. Consolidated Financial Results. February 14, (Oct. 1, 2018 Dec. 31, 2018)
") Third Quarter of FY 2018 (Oct. 1, 2018 Dec. 31, 2018) Consolidated Financial Results Japan Display Inc. February 14, 2019 Today s Speakers Yoshiyuki Tsukizaki Chief Operating Officer and President Takanobu
Third Quarter of FY 2018 (Oct. 1, 2018 Dec. 31, 2018) Consolidated Financial Results Japan Display Inc. February 14, 2019 Today s Speakers Yoshiyuki Tsukizaki Chief Operating Officer and President Takanobu
Consolidated financial results for the 9 months ended December 31, 2012 (Japan GAAP - Unaudited)
") Consolidated financial results for the 9 months ended December 31, 2012 (Japan GAAP - Unaudited) Date of issue: February 4, 2013 Company name: CAPCOM Co., Ltd. Stock listing: Tokyo, Osaka Code number:
Consolidated financial results for the 9 months ended December 31, 2012 (Japan GAAP - Unaudited) Date of issue: February 4, 2013 Company name: CAPCOM Co., Ltd. Stock listing: Tokyo, Osaka Code number:
Flash Report for the Fiscal Year ended December 31, 2013 [Japan GAAP] (on a consolidated basis)
![Flash Report for the Fiscal Year ended December 31, 2013 [Japan GAAP] (on a consolidated basis)](/thumbs/91/106826542.jpg "Flash Report for the Fiscal Year ended December 31, 2013 [Japan GAAP] (on a consolidated basis)") Flash Report for the Fiscal Year ended December 31, [Japan GAAP] (on a consolidated basis) January 31, 2014 Company Name: OPT, Inc. Stock exchange listing: Tokyo Stock Code: 2389 URL http://www.opt.ne.jp/
Flash Report for the Fiscal Year ended December 31, [Japan GAAP] (on a consolidated basis) January 31, 2014 Company Name: OPT, Inc. Stock exchange listing: Tokyo Stock Code: 2389 URL http://www.opt.ne.jp/
4. Other 1) Reclassification of significant subsidiaries during the period (Reclassification due to the change in scope of consolidation) : No 2) Adop
 Reclassification of significant subsidiaries during the period (Reclassification due to the change in scope of consolidation) : No 2) Adop") 1Q FY 3/2015 Summary of Consolidated Financial Results Company Name Wacom Co., Ltd. (URL http://www.wacom.com ) Representative: Masahiko Yamada, CEO TEL: 0120-056-665 Contact: Wataru Hasegawa, CFO Preparation
1Q FY 3/2015 Summary of Consolidated Financial Results Company Name Wacom Co., Ltd. (URL http://www.wacom.com ) Representative: Masahiko Yamada, CEO TEL: 0120-056-665 Contact: Wataru Hasegawa, CFO Preparation
Topics. 1. Full Year FY2017 Performance P Q FY2017 Performance P FY2018 Consolidated Performance Forecast & Shareholder returns
 Topics 1. Full Year FY2017 Performance P.2 2. 4Q FY2017 Performance P.14 3. FY2018 Consolidated Performance Forecast & Shareholder returns P.23 4. Business Overview P.26 5. Supplementary Materials P.44
Investor Presentation Q NEXON Co., Ltd.
 Investor Presentation NEXON Co., Ltd. Results 2 Highlights First quarter performance exceeded high end of our outlook 44.4 bn revenue, up 46% year-over-year, and up 26% on a constant currency basis 20.7
Topics. 1. FY2018 Q3 Performance P Business Overview. 3. Supplementary Materials. Copyright Adways Inc. All Rights Reserved.
 Topics 1. FY2018 Q3 Performance P.2 2. Business Overview 3. Supplementary Materials P.12 P.31 Copyright Adways Inc. All Rights Reserved. 1 1. FY2018 Q3 Performance Copyright Adways Inc. All Rights Reserved.
FY03/17 Consolidated Financial Results For Third Quarter Ended December 31, 2016 (Japan GAAP)
") This document is a partial translation of the original Kessan Tanshin in Japanese. Digital Arts Inc. provides this translation for your reference and convenience only and without any warranty as to its
This document is a partial translation of the original Kessan Tanshin in Japanese. Digital Arts Inc. provides this translation for your reference and convenience only and without any warranty as to its
3 rd Quarter FY2018. Financial Results. ended Dec. 31, 2017
 3 rd Quarter FY2018 Financial Results ended Dec. 31, 2017 1. 3 rd Quarter FY2018 Financial Results 2. FY2018 Financial Forecasts 1-1) Overview of 3 rd Quarter Financial Results
FY2006. First Quarter Consolidated Results (Quarter ended June 30, 2006) Sony Corporation Investor Relations
 Sony Corporation Investor Relations") FY2006 Sony Corporation Investor Relations First Quarter Consolidated Results (Quarter ended June 30, 2006) Statements made in this presentation with respect to Sony s current plans, estimates, strategies
FY2006 Sony Corporation Investor Relations First Quarter Consolidated Results (Quarter ended June 30, 2006) Statements made in this presentation with respect to Sony s current plans, estimates, strategies
Consolidated Financial Results for the Three-Month Period Ended June 30, 2013 (Japan GAAP)
") Consolidated Financial Results for the ThreeMonth Period Ended June 30, 2013 (Japan GAAP) August 6, 2013 Company name: SQUARE ENIX HOLDINGS CO., LTD. Shares traded: Tokyo Stock Exchange, First Section
Consolidated Financial Results for the ThreeMonth Period Ended June 30, 2013 (Japan GAAP) August 6, 2013 Company name: SQUARE ENIX HOLDINGS CO., LTD. Shares traded: Tokyo Stock Exchange, First Section
Consolidated financial results for the 1st quarter of the fiscal year ending March 31, 2014 (Japan GAAP - Unaudited)
") Company name: Code number: Representative: Contact person: Filing date for financial report : Consolidated financial results for the 1st quarter of the fiscal year ending March 31, 2014 (Japan GAAP Unaudited)
Company name: Code number: Representative: Contact person: Filing date for financial report : Consolidated financial results for the 1st quarter of the fiscal year ending March 31, 2014 (Japan GAAP Unaudited)
Topics. 1. FY2018 Q2 Performance P Business Overview. 3. Supplementary Materials. Copyright Adways Inc. All Rights Reserved.
 Topics 1. FY2018 Q2 Performance P.2 2. Business Overview 3. Supplementary Materials P.14 P.30 Copyright Adways Inc. All Rights Reserved. 1 1. FY2018 Q2 Performance Copyright Adways Inc. All Rights Reserved.
Performance Summary. Copyright 2018 Harmonic Drive Systems Inc.
 Performance Summary 2 1st-half consolidated results (versus original forecasts for the period) Original forecasts (announced May 11) 1st-half FY ending Mar.31,2019 Vs. original forecasts for the period
DoubleU Games. Social casino professional developer
 DoubleU Games Social casino professional developer Some contents may reflect forward-looking statements and have been prepared based on the expectations according to the dates on which these statements
Financial Section. Financial Strategy According to the CFO: R&D Investment and Fund Procurement. 11-Year Summary of Consolidated Financial Indicators
 Financial Section 6 61 63 67 69 7 71 72 91 Financial Strategy According to the CFO: R&D Investment and Fund Procurement 11-Year Summary of Consolidated Financial Indicators Financial Review Consolidated
Pioneer Corporation. Business Results for Fiscal Susumu Kotani, President and CEO May 14, 2018
 Pioneer Corporation Business for Fiscal 2018 Susumu Kotani, President and CEO May 14, 2018 2 Main Points of Today s Presentation 1. Business for FY2018 Compared with our previous plans, operating income
2009 3Q Earnings Release
 2009 3Q Earnings Release October 21 st 2009 All information regarding management performance and financial results of LG Electronics (the Company ) during the 3 rd quarter of 2009 as contained herein has
Consolidated Financial Results for the Six-Month Period Ended September 30, 2012 (Japan GAAP)
") Consolidated Financial Results for the Six-Month Period Ended September 30, 2012 (Japan GAAP) November 6, 2012 Company name: SQUARE ENIX HOLDINGS CO., LTD. Shares traded: Tokyo Stock Exchange, First Section
Consolidated Financial Results for the Six-Month Period Ended September 30, 2012 (Japan GAAP) November 6, 2012 Company name: SQUARE ENIX HOLDINGS CO., LTD. Shares traded: Tokyo Stock Exchange, First Section
Details of financial results of FY2017 are as follows.
 Details of financial results of are as follows. (Unit: million yen) FY2016 YoY Against Guidance Total Transaction Value 212,090 (100.0%) 270,543 (100.0%) 27.6% 0.2% Net Sales 76,393 (36.0%) 98,432 (36.4%)
2018 2Q IR PRESENTATION
 2018 2Q IR PRESENTATION Investor Relation June 2018 2 Disclaimer These materials have been prepared by GRAVITY Co., Ltd. ("Gravity" or the "Company"). The statements contained in this presentation have
Business Report for Q1 FY ending March 31, 2019 (April-June 2018)
") Business Report for Q1 FY ending March 31, 2019 (April-June 2018) Wacom Chapter 2 Wacom Co., Ltd. (TSE 1st Sec. Code: 6727) Q1 FY 03/19 Results Overview Consolidated net sales of JPY 17.9 bn (YOY +12%)
Business Report for Q1 FY ending March 31, 2019 (April-June 2018) Wacom Chapter 2 Wacom Co., Ltd. (TSE 1st Sec. Code: 6727) Q1 FY 03/19 Results Overview Consolidated net sales of JPY 17.9 bn (YOY +12%)
Trend Micro FY Q / Annual Results. Mahendra Negi, CFO, Representative director February 4, 2003
 Trend Micro FY2002. 4Q / Annual Results Mahendra Negi, CFO, Representative director February 4, 2003 1 Forward Looking Statements Certain statements that we make in this presentation are forward-looking
Financial Results for Third Quarter of FY2011 (From April 1, 2010 to December 31, 2010)
") 1/19 1/20 Financial Results for Third of FY2011 (From April 1, 2010 to December 31, 2010) January 31, 2011 Hino Motors, Ltd. 1. Sales Turnover 2/20 Global Unit Sales 3/20 FY2011 3rd ('10/10-12) FY2010
1/19 1/20 Financial Results for Third of FY2011 (From April 1, 2010 to December 31, 2010) January 31, 2011 Hino Motors, Ltd. 1. Sales Turnover 2/20 Global Unit Sales 3/20 FY2011 3rd ('10/10-12) FY2010
Interim Results. IGG Inc August 2017
 Interim Results IGG Inc August 2017 Disclaimer This presentation and the accompanying slides (the Presentation ) do not constitute any offer or invitation to purchase or subscribe for any securities, and
Consolidated financial results for the 9 months ended December 31, 2011 (Japan GAAP - Unaudited)
") Consolidated financial results for the 9 months ended December 31, 2011 (Japan GAAP - Unaudited) Date of issue: February 2, 2012 Company name: CAPCOM Co., Ltd. Stock listing: Tokyo, Osaka Code number:
Consolidated financial results for the 9 months ended December 31, 2011 (Japan GAAP - Unaudited) Date of issue: February 2, 2012 Company name: CAPCOM Co., Ltd. Stock listing: Tokyo, Osaka Code number:
KADOKAWA DWANGO Financial Results for the 3rd Quarter Ended December 31, 2017
 0 KADOKAWA DWANGO Financial Results for the 3rd Quarter Ended December 31, 2017 February 8, 2018 Contents 1 Results for nine of consolidated fiscal year ending March 31, 2018 2 Topics 9 Reference materials
CONSOLIDATED FINANCIAL REPORT (Japanese GAAP) FY2016 (June 1, 2016 to May 31, 2017) Three Months Ended August 31, 2016
 FY2016 (June 1, 2016 to May 31, 2017) Three Months Ended August 31, 2016") CONSOLIDATED FINANCIAL REPORT (Japanese GAAP) FY2016 (June 1, 2016 to May 31, 2017) Three Months Ended August 31, 2016 Listing stock exchange: The First Section of the Tokyo Stock Exchange Securities code
CONSOLIDATED FINANCIAL REPORT (Japanese GAAP) FY2016 (June 1, 2016 to May 31, 2017) Three Months Ended August 31, 2016 Listing stock exchange: The First Section of the Tokyo Stock Exchange Securities code
Yahoo Japan Corporation
 Yahoo Japan Corporation FY2015 Full Year & 4Q Business Results (Apr. 2015-Mar. 2016/Jan.-Mar. 2016) April 28, 2016 P. 4 P. 14 P. 17 P. 22 P. 25 P. 34 P. 45 P. 50 2 Table of Contents FY2015 Full Year Financial
2Q FY 3/2016 Summary of Consolidated Financial Results Company Name Wacom Co., Ltd. (URL ) Representative: Masahiko Yamada, CEO T
 Representative: Masahiko Yamada, CEO T") 2Q FY 3/2016 Summary of Consolidated Financial Results Company Name Wacom Co., Ltd. (URL http://www.wacom.com ) Representative: Masahiko Yamada, CEO TEL: 03-5337-6502 Contact: Toru Ando, CFO Preparation
2Q FY 3/2016 Summary of Consolidated Financial Results Company Name Wacom Co., Ltd. (URL http://www.wacom.com ) Representative: Masahiko Yamada, CEO TEL: 03-5337-6502 Contact: Toru Ando, CFO Preparation
FY09/3 Q2 Financial Results
 FY09/3 Q2 Financial Results Toshio Nakajima President and CEO October 29, 2008 NEC Electronics Corporation http://www.necel.com/ir/en/ 1 Executive Summary Despite the effects of considerable yen depreciation,
August 8, 2013 Securities Code:9438
 FY2013 for the 3rd Quarter Financial Res sults Presentation August 8, 2013 Securities Code:9438 CONTENTS P2 Overview of Consolidated Financial Results for the 3rd Quarter P3 P4 P8 P9 P10 Financial Highlights
CONSOLIDATED FINANCIAL HIGHLIGHTS
 CONSOLIDATED FINANCIAL HIGHLIGHTS 11-1 Kamitoba Hokotate-cho, Minami-ku, Kyoto 601-8501 Japan January 26, 2012 Consolidated Results for the Nine Months Ended December 2010 and 2011 (1) Consolidated operating
Flash Report for the Fiscal Year Ended December 31, 2016 [Japan GAAP] (on a consolidated basis) February 13, 2017
![Flash Report for the Fiscal Year Ended December 31, 2016 [Japan GAAP] (on a consolidated basis) February 13, 2017](/thumbs/95/123620510.jpg "Flash Report for the Fiscal Year Ended December 31, 2016 [Japan GAAP] (on a consolidated basis) February 13, 2017") Flash Report for the Fiscal Year Ended December 31, 2016 [Japan GAAP] (on a consolidated basis) February 13, 2017 Company Name: OPT Holding, Inc. Stock Exchange Listing: Tokyo Stock Code: 2389 URL http://www.opt.ne.jp/english/holding/
Flash Report for the Fiscal Year Ended December 31, 2016 [Japan GAAP] (on a consolidated basis) February 13, 2017 Company Name: OPT Holding, Inc. Stock Exchange Listing: Tokyo Stock Code: 2389 URL http://www.opt.ne.jp/english/holding/
3. Consolidated Financial Forecasts of FY 3/2018 (April 1, 2017 March 31, 2018) Q2 (H1 FY 3/2018) Full Year Sales Operating Profit Ordinary Profit Net
 Q2 (H1 FY 3/2018) Full Year Sales Operating Profit Ordinary Profit Net") Q1 FY 3/2018 Summary of Consolidated Financial Results August 7, 2017 Company Name Wacom Co., Ltd. (Code Number: 6727 TSE1) (URL http://www.wacom.com ) Representative: Masahiko Yamada, CEO TEL: +81-3-5337-6502
Q1 FY 3/2018 Summary of Consolidated Financial Results August 7, 2017 Company Name Wacom Co., Ltd. (Code Number: 6727 TSE1) (URL http://www.wacom.com ) Representative: Masahiko Yamada, CEO TEL: +81-3-5337-6502
Executive Summary of Consolidated Financial Results for the year ended March 31,2018. Yakult Honsha Co., Ltd.
 Executive Summary of Consolidated Financial Results for the year ended March 31,2018 Yakult Honsha Co., Ltd. May 10 th 2018 General outline of Consolidated financial results Total Increase in sales and
Financial Section. Financial Strategy According to the CFO: R&D Investment and Fund Procurement. 11-Year Summary of Consolidated Financial Indicators
 Financial Section 62 63 65 69 71 72 73 74 91 Financial Strategy According to the CFO: R&D Investment and Fund Procurement 11-Year Summary of Consolidated Financial Indicators Financial Review Consolidated
1H FY07/3 Financial Results and Outlook
 1H Financial Results and Outlook Toshio Nakajima President and CEO October 25, 2006 NEC Electronics Corporation http://www.necel.com/ir/en/ 1 CAUTIONARY STATEMENTS: The statements in this presentation
FY08/3 Financial Results
 Financial Results Toshio Nakajima President and CEO May 14, 2008 NEC Electronics Corporation http://www.necel.com/ir/en/ 1 Thank you for joining NEC Electronics webcast. Before we begin, please be sure
3. Consolidated Business Forecasts of FY 3/2017 (April 1, 2016 March 31, 2017) 2Q (H1 FY 3/2017) Full Year Sales Operating Income Ordinary Income Net
 2Q (H1 FY 3/2017) Full Year Sales Operating Income Ordinary Income Net") Q1 FY 3/2017 Summary of Consolidated Financial Results August 5, 2016 Company Name Wacom Co., Ltd. (Code Number: 6727 TSE1) (URL http://www.wacom.com ) Representative: Masahiko Yamada, CEO TEL: 03-5337-6502
Q1 FY 3/2017 Summary of Consolidated Financial Results August 5, 2016 Company Name Wacom Co., Ltd. (Code Number: 6727 TSE1) (URL http://www.wacom.com ) Representative: Masahiko Yamada, CEO TEL: 03-5337-6502
attributable to Sales revenue Profit before tax Net profit shareholders of income Cookpad Inc. Fiscal year ended million yen %
 This is a translation of the original Japanese document. If there are any discrepancies between this and the original, the original Japanese document prevails. Cookpad Inc. Consolidated Earnings Results
Accounting Report for the Third Quarter of Fiscal Year Ending March 2009 (October 1, December 31, 2008)
") January 30, 2009 Company: Representative: Contact: JVC KENWOOD Holdings, Inc. Haruo Kawahara, Chairman and CEO (Code: 6632; 1st Section of Tokyo Stock Exchange) Hiroshi Odaka, Deputy President and CFO
January 30, 2009 Company: Representative: Contact: JVC KENWOOD Holdings, Inc. Haruo Kawahara, Chairman and CEO (Code: 6632; 1st Section of Tokyo Stock Exchange) Hiroshi Odaka, Deputy President and CFO
Consolidated Financial Results for the Six-Month Period Ended September 30, 2014 (Japan GAAP)
") Consolidated Financial Results for the Six-Month Period Ended September 30, 2014 (Japan GAAP) November 6, 2014 Company name: SQUARE ENIX HOLDINGS CO., LTD. Shares traded: Tokyo Stock Exchange, First Section
Consolidated Financial Results for the Six-Month Period Ended September 30, 2014 (Japan GAAP) November 6, 2014 Company name: SQUARE ENIX HOLDINGS CO., LTD. Shares traded: Tokyo Stock Exchange, First Section
Results of Operations Half Year Ended September 30, 2009 KITO CORPORATION. TSE 1 st Section
 Results of Operations Half Year Ended September 30, 2009 KITO CORPORATION TSE 1 st Section November 19, 2009 Content 1. First Half of FY 2010 Financial Results 2. Second Half of FY 2010 Financial Outlook
Consolidated financial results for the 3 months of the fiscal year ending March 31, 2019 (Japan GAAP - Unaudited)
") Company name: Code number: Representative: Contact person: Filing date for financial report : Consolidated financial results for the 3 months of the fiscal year ending March 31, 2019 (Japan GAAP Unaudited)
Company name: Code number: Representative: Contact person: Filing date for financial report : Consolidated financial results for the 3 months of the fiscal year ending March 31, 2019 (Japan GAAP Unaudited)
Consolidated Financial Results for the Three-Month Period Ended June 30, 2015 (Japan GAAP)
") Consolidated Financial Results for the Three-Month Period Ended June 30, 2015 (Japan GAAP) August 6, 2015 Company name: SQUARE ENIX HOLDINGS CO., LTD. Shares traded: Tokyo Stock Exchange, First Section
Consolidated Financial Results for the Three-Month Period Ended June 30, 2015 (Japan GAAP) August 6, 2015 Company name: SQUARE ENIX HOLDINGS CO., LTD. Shares traded: Tokyo Stock Exchange, First Section
Consolidated Financial Review for the Third Quarter Ended December 31, 2015
 Jan 29, 2016 Consolidated Financial Review for the Third Quarter Ended December 31, 2015 Company name: Tokyo Electron Limited URL: http://www.tel.com Telephone number: (03) 5561-7000 Stock exchange listing:
Konica Minolta Group 3rd Quarter/March 2014 Consolidated Financial Results
 Konica Minolta Group 3rd Quarter/March 2014 Consolidated Financial Results Three months : October 1, 2013 - December 31, 2013 Nine months : April 1, 2013 - December 31, 2013 - Announced on January 30,
Third Quarter FY2004. Consolidated Results. (Three months ended December 31, 2004)
") Third Quarter FY2004 Consolidated Results (Three months ended December 31, 2004) Statements made in this presentation with respect to Sony s current plans, estimates, strategies and beliefs and other statements
Third Quarter FY2004 Consolidated Results (Three months ended December 31, 2004) Statements made in this presentation with respect to Sony s current plans, estimates, strategies and beliefs and other statements
Financial Results Presentation for 3Q FY2013
 Adways Inc.(Tokyo Stock Exchange Mothers: 2489) Financial Results Presentation for 3Q FY2013 (from October 2013 to December 2013) January 31, 2014 President and CEO, Haruhisa Okamura Topics 3Q FY2013 Performance
2015 Annual Results Sales of 256.2M, up 13% Gross profit up 16% Current operating income of 2.1M Net cash of 36.9M
 2015 Annual Results Sales of 256.2M, up 13% Gross profit up 16% Current operating income of 2.1M Net cash of 36.9M Paris (France), March 21, 2016 Gameloft, a leading digital and social game developer,
Consolidated Financial Report for FY2000 Half-Year (April 1, 2000 September 30, 2000)
") Consolidated Financial Report for FY2000 Half-Year (April 1, 2000 September 30, 2000) October 26, 2000 Fuji Electric Co., Ltd. Summary of Consolidated Financial Results 1. Summary of consolidated statements
Consolidated Financial Report for FY2000 Half-Year (April 1, 2000 September 30, 2000) October 26, 2000 Fuji Electric Co., Ltd. Summary of Consolidated Financial Results 1. Summary of consolidated statements
Summary of Consolidated Financial Results for the Six Months Ended October, 2012 (2Q/FY2013) [Japanese Standards] (Consolidated)
![Summary of Consolidated Financial Results for the Six Months Ended October, 2012 (2Q/FY2013) [Japanese Standards] (Consolidated)](/thumbs/94/121083167.jpg "Summary of Consolidated Financial Results for the Six Months Ended October, 2012 (2Q/FY2013) [Japanese Standards] (Consolidated)") December 7, 2012 Summary of Consolidated Financial Results for the Six Months Ended October, 2012 (2Q/FY2013) [Japanese Standards] (Consolidated) Company name: ZAPPALLAS, INC. Stock listing: Tokyo Stock
December 7, 2012 Summary of Consolidated Financial Results for the Six Months Ended October, 2012 (2Q/FY2013) [Japanese Standards] (Consolidated) Company name: ZAPPALLAS, INC. Stock listing: Tokyo Stock
First Quarter of FY 2018
 First Quarter of FY 2018 Consolidated Financial Results Japan Display Inc. August 8, 2018 1Q-FY18 Results & FY 2018 Guidance Takanobu Oshima Chief Financial Officer 2 1Q-FY18 Topics 1Q sales were down
Morningstar Japan K.K. Third Quarter Financial Results (Fiscal Year Ending March 31, 2011)
") Morningstar Japan K.K. Third Quarter Financial Results (Fiscal Year Ending March 31, 2011) January 25 th, 2011 Morningstar Japan K.K. < # > Part 1 Consolidated Financial Performance 2 2 Consolidated Financial
Morningstar Japan K.K. Third Quarter Financial Results (Fiscal Year Ending March 31, 2011) January 25 th, 2011 Morningstar Japan K.K. < # > Part 1 Consolidated Financial Performance 2 2 Consolidated Financial
Fuji Heavy Industries Ltd.
 President & CEO, Yasuyuki Yoshinaga Fuji Heavy Industries Ltd. May 9, 2014 0 Business Results for the FYE2014 ( 100M) Consolidated automobile sales FYE2013 FYE2014 YoY 724,000 825,000 High +13.9 % Net
Topics. 1. 2Q FY2016 Performance P Business Overview P Supplementary Materials P.23. Copyright Adways Inc. All Rights Reserved.
 Topics 1. 2Q FY2016 Performance P.2 2. Business Overview P.10 3. Supplementary Materials P.23 Copyright Adways Inc. All Rights Reserved. 1 1. 2Q FY2016 Performance Copyright Adways Inc. All Rights Reserved.
Disclaimer. kabu.com Securities Co., Ltd.
 Disclaimer This document is an Englishlanguage translation of the nonconsolidated financial summary of the financial results for the third quater of the fiscal year ending March 31, 2013(from April 2012
Agenda. Company Overview Annual Financial Results. Business Review and Prospects
 Disclaimer This presentation and the accompanying slides (the Presentation ) which have been prepared by IGG INC (the Company ) do not constitute any offer or invitation to purchase or subscribe for any
3. Financial Forecasts for the Year Ending March 31, 2019 (April 1, 2018 to March 31, 2019) Note: Percentages for year ending March 31, 2019 indicate
 Note: Percentages for year ending March 31, 2019 indicate") Summary of Consolidated Financial Results for the Third Quarter Ended December 31, 2018 (Japanese GAAP) January 31, 2019 Name of Listed Company: Tokyo Electron Limited Stock Exchange Listing: Tokyo Security
Summary of Consolidated Financial Results for the Third Quarter Ended December 31, 2018 (Japanese GAAP) January 31, 2019 Name of Listed Company: Tokyo Electron Limited Stock Exchange Listing: Tokyo Security
11-Year Summary of Consolidated Financial Indicators
 11-Year Summary of Consolidated Financial Indicators Financial Performance For the Year: 25 26 27 28 29 Net sales 65,895 7,253 74,542 83,97 91,878 Operating income 7,752 6,58 9,62 13,121 14,618 Net income
Overview Total Transaction Value:67,414 million yen(+20.2%, Yoy)Operating Profit: 7,009million yen(+16.0%, Yoy) Steady growth. Total Transaction Value
Operating Profit: 7,009million yen(+16.0%, Yoy) Steady growth. Total Transaction Value") Overview Total Transaction Value:67,414 million yen(+20.2%, Yoy)Operating Profit: 7,009million yen(+16.0%, Yoy) Steady growth Total Transaction Value ZOZOTOWN Business Total Transaction Value 59,785 million
Overview Total Transaction Value:67,414 million yen(+20.2%, Yoy)Operating Profit: 7,009million yen(+16.0%, Yoy) Steady growth Total Transaction Value ZOZOTOWN Business Total Transaction Value 59,785 million
Notice Relating to Information on Seven Bank s Financial Results Accompanying Its Listing on the First Section of the Tokyo Stock Exchange
 Seven Bank, Ltd. December 26, 2011 Notice Relating to Information on Seven Bank s Financial Results Accompanying Its Listing on the First Section of the Tokyo Stock Exchange Seven Bank listed its shares
Sony FY2001 Results. Consolidated Results
 Sony FY21 Results Statements made in this presentation with respect to Sony's current plans, estimates, strategies and beliefs and other statements that are not historical facts are forward-looking statements
1H FY08/3 Financial Results and Outlook
 1H FY8/3 Financial Results and Outlook Toshio Nakajima President and CEO November 13, 27 NEC Electronics Corporation http://www.necel.com/ir/en/ 1 Thank you for joining NEC Electronics webcast. Before
Business Overview March 2018
 Business Overview March 2018 Safe Harbor Disclosure and Definitions This presentation contains forward-looking statements. The use of words such as "anticipates," "estimates," "expects," "plans" and "believes,"
11-Year Summary of Consolidated Financial Indicators
 11-Year Summary of Consolidated Financial Indicators Financial Index For the Year: Net sales Operating income Net income (loss) before income taxes Depreciation & amortization Capital expenditures R&D
Diluted Net Income per Share. Net Income per Share Yen
 BRIEF STATEMENT OF CONSOLIDATED FINANCIAL RESULTS FOR THE 1st QUARTER OF THE FISCAL YEAR ENDING MARCH 2019 This is an English translation of summarized consolidated financial results prepared for the convenience
Consolidated financial results for the year ended March 31, 2017 (Unaudited)
") Company name: Code number: Representative: Contact person: CAPCOM Co., Ltd. 9697 Consolidated financial results for the year ended March 31, 2017 (Unaudited) URL: Date of issue: April 27, 2017 Stock listing:
Company name: Code number: Representative: Contact person: CAPCOM Co., Ltd. 9697 Consolidated financial results for the year ended March 31, 2017 (Unaudited) URL: Date of issue: April 27, 2017 Stock listing:
Flash Report for the 3rd Quarter of the Fiscal Year Ending December 31, 2018 [Japan GAAP] (on a consolidated basis)
![Flash Report for the 3rd Quarter of the Fiscal Year Ending December 31, 2018 [Japan GAAP] (on a consolidated basis)](/thumbs/92/110340460.jpg "Flash Report for the 3rd Quarter of the Fiscal Year Ending December 31, 2018 [Japan GAAP] (on a consolidated basis)") This document has been translated from the Japanese original document for reference purposes only. In the event of any discrepancy between this translated document and the Japanese original, the original
This document has been translated from the Japanese original document for reference purposes only. In the event of any discrepancy between this translated document and the Japanese original, the original
(Note) Comprehensive Income - Sep 30, 2012: 3,648 million (-2.9%), Sep 30, 2011: 3,758 million (-%) Net Profit per Share (Diluted)
 Comprehensive Income - Sep 30, 2012: 3,648 million (-2.9%), Sep 30, 2011: 3,758 million (-%) Net Profit per Share (Diluted)") Consolidated Third Quarter Results Statement for the Fiscal Year Ending December 2012 (Japanese GAAP) November 2, 2012 Name of Listed Company: GMO Internet, Inc. Exchange Listing: Tokyo Stock Exchange
Consolidated Third Quarter Results Statement for the Fiscal Year Ending December 2012 (Japanese GAAP) November 2, 2012 Name of Listed Company: GMO Internet, Inc. Exchange Listing: Tokyo Stock Exchange
Essential Information
 Information 24 Information Information 25 Group Structure The Company is a corporate group comprising the pure holding company SoftBank Group Corp. and 761 subsidiaries (as of March 31, 217). Major subsidiaries
2008 3Q Earnings Release. October 20 th
 2008 3Q Earnings Release October 20 th 2008 0 All information regarding management performance and financial results of LG Electronics (the Company ) during the 3 rd quarter of 2008 as contained herein
Management Presentation Q results
 Management Presentation Q2 2018 results Christoph Vilanek, CEO and Joachim Preisig, CFO 09 August 2018 Analyst and Investor Conference Call 1 Management Presentation Q2 2018 09 August 2018 Cautionary statement
Consolidated Financial Results for the 1 st Half of FYE 2019
 Consolidated Financial Results for the 1 st Half of SUBARU CORPORATION Toshiaki Okada Corporate Executive Vice President & CFO November 5 th, 2018 1 Summary Consolidated Financial Results for the 1 st
Q2 FY2004 Consolidated Results
 Q2 FY2004 Consolidated Results (Quarter Ended September 30, 2004) 1 Statements made in this presentation with respect to Sony s current plans, estimates, strategies and beliefs and other statements that
FY11 3Q Summary of Consolidated Financial Results
 FY11 3Q Summary of Consolidated Financial Results January 30, 2012 Company Name Wacom Co., Ltd. (Code Number: 6727 TSE1) (URL http://wacom.jp/en/company/outline ) Representative: Masahiko Yamada, CEO TEL:
TOMY Company Ltd. Fiscal Year 2016 Results (April 1, 2016 March 31, 2017) May 12, 2017 TSE Securities Code: 7867
 May 12, 2017 TSE Securities Code: 7867") TOMY Company Ltd. Fiscal Year 2016 Results (April 1, 2016 March 31, 2017) May 12, 2017 TSE Securities Code: 7867 1 FY 2016 Financial Highlights (April 1, 2016 March 31, 2017) May 12, 2017 Kazuhiro Kojima
TOMY Company Ltd. Fiscal Year 2016 Results (April 1, 2016 March 31, 2017) May 12, 2017 TSE Securities Code: 7867 1 FY 2016 Financial Highlights (April 1, 2016 March 31, 2017) May 12, 2017 Kazuhiro Kojima
KDDI CORPORATION. Financial Results of the Fiscal Year Ended March April 25, President Takashi Tanaka
 KDDI CORPORATION Financial Results of the Fiscal Year Ended March 2012 April 25, 2012 President Takashi Tanaka 1 1 2 Financial Results for / Outlook for FY2013.3 Complete recovery of au momentum / Initial
Earnings Presentation for 3Q FY2012
 Earnings Presentation for 3Q FY2012 Feb 13, 2013 The estimates and projection in this presentation are forward-looking statements based on the information available at the time of the announcement. Actual
FY2018 Q2 Financial Results
 Wantedly, Inc. FY2018 Q2 Financial Results 13.Apr.2018 FY2018 Q2 Results Overview FY2018 Q2 Consolidated Earnings Results - 61% YoY Revenue Growth ( M) F8/17Q2 F8/18Q1 F8/18Q2 YoY QoQ Revenue 310 433 500
(million) Item FY2014 2Q FY2013 2Q YoY Change(%) Target. Transaction value 56,073 49, % 132, %
 Item FY2014 2Q FY2013 2Q YoY Change(%) Target. Transaction value 56,073 49, % 132, %") 1 Overview Total transaction value : 56.0billion yen (+ 13.1% increase / Yoy) Operating Profit 6.0 billion (+11.1% increase / Yoy). For Operating Profit, we have over achieved our corporate plan (not disclosed).
1 Overview Total transaction value : 56.0billion yen (+ 13.1% increase / Yoy) Operating Profit 6.0 billion (+11.1% increase / Yoy). For Operating Profit, we have over achieved our corporate plan (not disclosed).
FY17/12 Q4/FULL-YEAR PRESENTATION
 FY17/12 Q4/FULL-YEAR PRESENTATION RENESAS ELECTRONICS CORPORATION FEBRUARY 9, 2018 2018 Renesas Electronics Corporation. All rights reserved. GROWTH AND EARNINGS TARGETS TO MAXIMIZE SHAREHOLDER VALUE Long-Term
TOKYO ELECTRON Summary of Consolidated Financial Results for the Second Quarter Ended September 30, 2018 (Japanese GAAP) October 31, 2018 Name of List
 October 31, 2018 Name of List") Summary of Consolidated Financial Results for the Second Quarter Ended September 30, 2018 (Japanese GAAP) October 31, 2018 Name of Listed Company: Tokyo Electron Limited Stock Exchange Listing: Tokyo Security
Summary of Consolidated Financial Results for the Second Quarter Ended September 30, 2018 (Japanese GAAP) October 31, 2018 Name of Listed Company: Tokyo Electron Limited Stock Exchange Listing: Tokyo Security
FY2017 Consolidated Financial Results
 Consolidated Financial Results April 27, 2018 Fujitsu Limited Contents 1. Financial Results for (1) Financial Results / Business Segment Information (2) Cash Flows (3) Assets, Liabilities and Equity 2.
CONSOLIDATED FINANCIAL RESULTS FOR THE THREE MONTHS PERIOD ENDED JUNE 30, 2009 (JPNGAAP)
") CONSOLIDATED FINANCIAL RESULTS FOR THE THREE MONTHS PERIOD ENDED JUNE 30, 2009 (JPNGAAP) August 7, 2009 Company Name: Square Enix Holdings Co., Ltd. Code: 9684 URL: http://www.square enix.com/ Representative:
CONSOLIDATED FINANCIAL RESULTS FOR THE THREE MONTHS PERIOD ENDED JUNE 30, 2009 (JPNGAAP) August 7, 2009 Company Name: Square Enix Holdings Co., Ltd. Code: 9684 URL: http://www.square enix.com/ Representative:
DELL INC. Condensed Consolidated Statement of Financial Position (in millions) (unaudited)
 (unaudited)") Condensed Consolidated Statement of Financial Position (in millions) Assets: Cash & cash equivalents $ 14,061 $ 14,623 $ 13,293 $ 13,852 $ 12,814 $ 10,635 $ 13,913 $ 13,852 Short-term investments 418 509
Condensed Consolidated Statement of Financial Position (in millions) Assets: Cash & cash equivalents $ 14,061 $ 14,623 $ 13,293 $ 13,852 $ 12,814 $ 10,635 $ 13,913 $ 13,852 Short-term investments 418 509
Consolidated Financial Results for the Nine-Month Period Ended December 31, 2014 (Japan GAAP)
") Consolidated Financial Results for the Nine-Month Period Ended December 31, 2014 (Japan GAAP) February 4, 2015 Company name: SQUARE ENIX HOLDINGS CO., LTD. Shares traded: Tokyo Stock Exchange, First Section
Consolidated Financial Results for the Nine-Month Period Ended December 31, 2014 (Japan GAAP) February 4, 2015 Company name: SQUARE ENIX HOLDINGS CO., LTD. Shares traded: Tokyo Stock Exchange, First Section
Consolidated Financial Results for the Three-Month Period Ended June 30, 2016 (Japan GAAP)
") Consolidated Financial Results for the Three-Month Period Ended June 30, 2016 (Japan GAAP) Company name: SQUARE ENIX HOLDINGS CO., LTD. Shares traded: Tokyo Stock Exchange, First Section Company code:
Consolidated Financial Results for the Three-Month Period Ended June 30, 2016 (Japan GAAP) Company name: SQUARE ENIX HOLDINGS CO., LTD. Shares traded: Tokyo Stock Exchange, First Section Company code: