Topics. 1. FY2018 Q3 Performance P Business Overview. 3. Supplementary Materials. Copyright Adways Inc. All Rights Reserved.
|
|
|
- Frank McGee
- 5 years ago
- Views:
Transcription
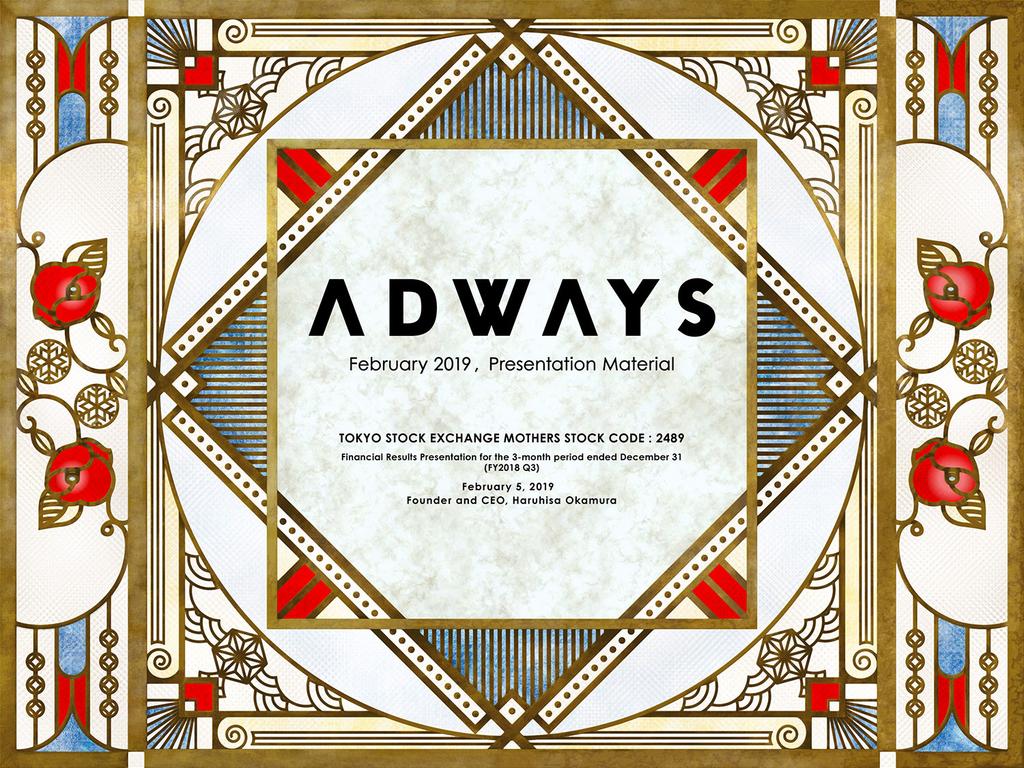
1
2 Topics 1. FY2018 Q3 Performance P.2 2. Business Overview 3. Supplementary Materials P.12 P.31 Copyright Adways Inc. All Rights Reserved. 1
3 1. FY2018 Q3 Performance Copyright Adways Inc. All Rights Reserved. 2
4 1. FY2018 Q3 Performance Cumulative Quarterly Results (YoY) (JPY mn) FY2018 Q3 cumulative Result YoY (FY2017 Q3 cumulative) Change Change (%) Net sales 32,526 30,332 +2, % Gross profit 5,553 5, % SG&A expenses 4,865 5, % Operating profit % Ordinary profit % Profit attributable to owners of parent Net sales Increased JPY 2,194 mn YoY (+7.2%) Operating profit Increased JPY 476 mn YoY (+225.7%) Copyright Adways Inc. All Rights Reserved. 3
5 1. FY2018 Q3 Performance Quarterly Results (YoY, QoQ) (JPY mn) FY2018 Q3 Result YoY FY2017 Q3 Change Change (%) Result QoQ FY2018 Q2 Change Change (%) Net sales 10,038 9, % 11,044-1, % Gross profit 1,632 1, % 1, % SG&A expenses 1,511 1, % 1, % Operating profit % Ordinary profit % Profit attributable to owners of parent % Net sales Increased JPY 968 mn YoY (+10.7%) Decreased JPY 1,006 mn QoQ (-9.1%) Operating profit Increased JPY 287 mn YoY (-) Decreased JPY 33 mn QoQ (-21.6%) Copyright Adways Inc. All Rights Reserved. 4
6 1. FY2018 Q3 Performance FY2018 performance forecasts and results (JPY mn) Net sales Operating profit Ordinary profit Profit attributable to owners of parent FY2018 Forecast 43, Q3 Results 32, Progress rate 75.6% 91.7% 84.3% 112.1% *Rounded to the first decimal place Copyright Adways Inc. All Rights Reserved. 5
7 1. FY2018 Q3 Performance Net sales (QoQ Change) Smartphone PC Overseas App Media, Other 12,000 10,000 11,044 10,038 Domestic Advertising QoQ: JPY -1,009 mn (-10.3%) Smartphone (Mainly app advertising) : JPY 4,695 mn QoQ: JPY -48 mn (-1.0%) JPY 8,746 mn 8,000 - Decline due to the reduction of ad budgets for inbound campaign by overseas clients, despite the orders from major clients remaining strong. 6,000 PC (PC web advertising and smartphone web advertising) : JPY 4,051 mn QoQ: JPY -960 mn (-19.2%) 4,000 - Decline due to the decrease in the number of ads by some clients in the financial sector as well as the budget reduction of EC clients in health food, beauty-related and other businesses. 2,000 0 (JPY mn) FY2018 Q2 FY2018 Q3 Overseas QoQ: JPY -101 mn (-8.9%) JPY 1,031 mn - Decline due to the decrease in the number of ads for game apps which performed strongly in Q2. * The accounting periods of our overseas subsidiaries excluding India end in December, so their FY2018 Q3 (July September) figures are consolidated with the Adways Group s FY2018 Q3 (October December) figures. Copyright Adways Inc. All Rights Reserved. 6
8 1. FY2018 Q3 Performance Gross profit (QoQ Change) Net sales Gross profit Gross margin 14,000 12,000 11,044 10,038 Q3 Gross profit: JPY 1,632 mn QoQ: JPY -169 mn (-9.4%) Gross margin: 16.3% (-) 10,000 8, % 16.3% 6,000 4,000 2,000 1,802 1,632 0 (JPY mn) FY2018 Q2 FY2018 Q3 Copyright Adways Inc. All Rights Reserved. 7
9 1. FY2018 Q3 Performance SG&A expenses (QoQ Change) Other expenses Depreciation Rent Personnel expenditure Recruiting & education expenses SG&A/ consolidated sales 2,000 1,500 1,647 1,511 Q3 SG&A expenses: JPY 1,511 mn QoQ: JPY -136 mn (-8.3%) SG&A to sales ratio:15.1% (+0.2%) Main decreased factors Labor expenses: Down JPY 78 mn Provision of allowance for doubtful accounts: Down JPY 61 mn 1, % 15.1% (JPY mn) FY2018 Q2 FY2018 Q3 Copyright Adways Inc. All Rights Reserved. 8
10 1. FY2018 Q3 Performance Operating profit (QoQ Change) Operating profit Operating margin Q3 Operating profit: JPY 121 mn QoQ: JPY -33 mn (-21.6%) Operating margin: 1.2% (-0.2points) % 1.2% 0 (JPY mn) FY2018 Q2 FY2018 Q3 Copyright Adways Inc. All Rights Reserved. 9
11 1. FY2018 Q3 Performance Ordinary profit (QoQ Change) Profit attributable to owners of parent (QoQ Change) % % 50 0 (JPY:mn) FY2018 Q2 FY2018 Q3 (JPY:mn) FY2018 Q2 FY2018 Q3 0 Q3 Ordinary profit: 149mn QoQ: JPY -57 mn (-27.9%) Q3 Profit attributable to owners of parent: JPY 130 mn QoQ: JPY +61 mn (+90.7%) Copyright Adways Inc. All Rights Reserved. 10
12 1. FY2018 Q3 Performance Breakdown of FY2018 Q3 Profit attributable to owners of parent FY2018 Q3 Ordinary profit JPY 149 mn Loss on valuation of investment securities JPY -21 mn FY2018 Q3 Profit attributable to owners of parent JPY 130 mn Gain on sales of investment securities JPY 92 mn Income taxes total, Other JPY -89 mn (JPY:mn) 0 Gain on sales of investment securities [JPY +92 mn] No. of entities (2 companies) Loss on valuation of investment securities [JPY -21 mn] No. of entities (1 companies) Income taxes total, Other [JPY -89 mn]: Including JPY -66 mn corporate tax for head office Copyright Adways Inc. All Rights Reserved. 11
13 2. Business Overview Copyright Adways Inc. All Rights Reserved. 12


14 2. Business Overview Scope of advertising business Ad agency Ad management platform SSPs RTB links Domestic and overseas major SSP Advertisers Affiliate Creative Reward Performance-based advertisement Media Copyright Adways Inc. All Rights Reserved. 13


15 2. Business Overview Adways internet advertising business Ad platform business Ad Agency business Copyright Adways Inc. All Rights Reserved. 14

16 Copyright Adways Inc. All Rights Reserved. 15

17 2. Business Overview Ad Agency Business What is STROBELIGHTS X? Facebook Google 4F 4T 4Y 4G etc... UNICORN A comprehensive support system for performance-based advertisement Comprehensive dashboard enabling integrated management of delivery status for each global mega platform. Copyright Adways Inc. All Rights Reserved. 16

18 2. Business Overview Ad Agency Business Conventional performance-based advertisement Conventionally, the operation staff carved out optimal delivery setting and keywords for each media to maximize advertisement effect. Media B Media E Media F Media A All manual Media D Media G Media C Collection of reports for each medium/report integration/ KPI status confirmation/budget progress evaluation/ comprehension of degree of separation/budget allocation confirmation/analysis of policy effectiveness/strategic planning/policy execution Advertisement effect Advertisement effect of each campaign Campaign A Campaign B Campaign C Time Campaign life time tends to be shorter How speedily and accurately we can turn the PDCA cycle is the key. Copyright Adways Inc. All Rights Reserved. 17

19 2. Business Overview Ad Agency Business STROBELIGHTS X enables integrated management across media Automatic real-time collection of trending words Automatic real-time PDCA Analysis of collected data and automatic keyword expansion through Adways' unique system Ad distribution to users based on their tweets for maximum effect Google Facebook Improvement of ad accuracy through fully-automatic optimization Realizing maximization of camapaign ROI with Adways unique innovative technology. Copyright Adways Inc. All Rights Reserved. 18

20 Copyright Adways Inc. All Rights Reserved. 19
21 2. Business Overview Ad Platform Business Becoming one of Japan s largest mobile marketing platforms With the start of US and Europe campaigns, monthly bid request volume surpassed 420 billion impressions (280 billion impressions announced in FY2018 Q1) The number of SSPs is on the rise, including Smaato (a major SSP in Europe and the U.S.) and major SSPs in South Korea and Taiwan. Progress in connecting with SSPs (as end of Dec 2018) Major domestic SSPs: 9 companies Major global SSPs: 4 companies Copyright Adways Inc. All Rights Reserved. 20
22 2. Business Overview Ad Platform Business Machine learning enables a super-high-speed PDCA cycle that is faster than when it is done by humans Client Planner Designer Operator Ad network KPI Tracking URL(s) Budget Period Creativity PDCA Targeting Media screening Creativity screening Bid price adjustment With 5 simple settings, UNICORN automates everything, allowing humans to focus on what only humans can do Copyright Adways Inc. All Rights Reserved. 21

23 2. Business Overview Ad Platform Business UNICORN s ad bidding logic Machine learning 200,000 requests/sec Bid requested Visits Over 10,000 types USER Ads displayed MEDIA SSP Best ad selected Decided in 0.01 secs Purchase unit price confirmed With up to 200,000 potential ad purchases per second, each decision is made within 0.01 seconds using machine learning Copyright Adways Inc. All Rights Reserved. 22
 Achieved overwhelmingly higher ROAS than other companies * ROAS (Return On Advertising Spend) is the rate of return gained against the")
24 2. Business Overview Ad Platform Business UNICORN sales Progress of UNICORN ROAS* of users obtained through UNICORN Test operation period Steady sales growth Average 334% (December 2018 results) Other major 4 ad networks Average 87% (December 2018 results) Achieved overwhelmingly higher ROAS than other companies * ROAS (Return On Advertising Spend) is the rate of return gained against the advertisement expenses; it is the cost effectiveness of advertisements. Copyright Adways Inc. All Rights Reserved. 23
25 2. Business Overview Ad Platform Business Topics 1. Delivery to Apple Search Ads 2. Strengthening measures against ad fraud 3. Continuing to focus on brand ads Copyright Adways Inc. All Rights Reserved. 24


26 2. Business Overview Ad Platform Business Finished integration with Apple Search Adsin addition to existing SSPs Minimum 90,000 different patterns Age Search Gender Word New/existing user * When designed with audience setting of 180 combinations x 500 words Optimization using unique logic Automatically generate words, distribute and optimize by automatically acquiring words from App Store descriptions and official websites and combining them with effective words. Copyright Adways Inc. All Rights Reserved. 25
27 2. Business Overview Ad Platform Business Participated in SHARED BLACKLIST which aims to eliminate ad fraud and improve the quality of digital advertising industry By sharing information on ad fraud collected through each service, we prevent exploitation of ad expenses Copyright Adways Inc. All Rights Reserved. 26
 Apps (Games, etc.) Others E-Commerce Brand Ad Continuing to focus on video ad platforms that specialize in brand ads Copyright Adways Inc.")
28 2. Business Overview Ad Platform Business Participating in SHARED BLACKLIST aiming at eradicating ad fraud and aiming for healthy advertising industry for Brand (Tentative) Apps (Games, etc.) Others E-Commerce Brand Ad Continuing to focus on video ad platforms that specialize in brand ads Copyright Adways Inc. All Rights Reserved. 27

29 2. Business Overview Ad Platform Business Realized optimal distribution for users in Japan by utilizing expertise gained in performance-based ad business Ad fraud countermeasures Brand safety Whitelist distribution View completion optimization CPV billing Transparency on adplacement Specializing in brand video ad and has reach impact similar to mass media Copyright Adways Inc. All Rights Reserved. 28


30 Copyright Adways Inc. All Rights Reserved. 29
31 Thank you very much for attending our presentation today The information provided in this presentation contains forward-looking statements including Adways Inc. s current plans, outlook, estimates and forecast related to its business and industry trends. Such statements are subject to certain risks and uncertainties. Actual results may differ from the outlook expressed herein due to risks which may or may not be known at present, uncertainties and various other factors. Adways Inc. makes no warranty that its future outlook and forecasts are accurate, and actual results may differ materially from company estimates and may be worse than those expressed. Statements made herein are based on information available as of February 5, 2019 and a variety of factors may cause the statements to differ from actual results. Copyright Adways Inc. All Rights Reserved. 30

32 3. Supplementary Materials Copyright Adways Inc. All Rights Reserved. 31
33 3. Supplementary Materials Consolidated Trend of Sales Focus on PC/feature phone affiliate business Launch and expansion of smartphone advertising business Focus on overseas business Focus on new business 39,613 42,329 41,501 FY2018 forecast 43,000 35,890 31,521 22,639 Listed on Mothers in ,302 13,157 15,907 17,972 32,526 FY2018 Q3 4,919 4, FY2006 年 2008 FY2007 年 2009 FY2008 年 FY 年 2011 FY2010 年 2012 FY2011 年 2013 FY2012 年 2014 FY2013 年 2015 FY2014 年 2016 FY2015 年 2017 FY2016 年 2018 FY2017 年 2019 FY2018 年 3 月期 3 月期 3 月期 3 月期 3 月期 3 月期 3 月期 3 月期 3 月期 3 月期 3 月期 3 月期 3 月期 (JPY mn) Copyright Adways Inc. All Rights Reserved. 32
34 3. Supplementary Materials Consolidated Trend of Operating profit 1, , FY2018 forecast FY2018 Q FY2006 年 2008 FY2007 年 2009 FY2008 年 2010 FY2009 年 2011 FY2010 年 2012 FY2011 年 2013 FY2012 年 2014 FY2013 年 2015 FY2014 年 2016 FY2015 年 2017 FY2016 年 2018 FY2017 年 2019 FY2018 年 3 月期 3 月期 3 月期 3 月期 3 月期 3 月期 3 月期 3 月期 3 月期 3 月期 3 月期 3 月期 3 月期 (JPY mn) Copyright Adways Inc. All Rights Reserved. 33
35 3. Supplementary Materials Quarterly Change in Consolidated Sales 12,000 10,000 10,292 11,714 10,694 10,567 9,070 11,169 11,443 11,044 10,038 8,000 6,000 4,000 2,000 0 (JPY mn) FY /3Q Q3 FY /4Q Q4 FY /1Q Q1 FY /2Q Q2 FY /3Q3 FY /4Q Q4 FY /1Q Q1 FY /2Q Q2 FY /3Q Q3 Copyright Adways Inc. All Rights Reserved. 34
36 3. Supplementary Materials Quarterly Change in Consolidated Cost of sales Listing fees Other costs Cost of sales/cons. sales Listing fees/parent sales 10, % 83.0% 83.2% 83.3% 84.5% 85.8% 82.9% 84.4% 83.7% 8,000 6,000 4, % 81.9% 82.7% 81.9% 82.7% 83.5% 81.5% 83.7% 83.7% 2,000 0 (JPY mn) FY /3Q Q3 FY /4Q Q4 FY /1Q Q1 FY /2Q Q2 FY /3Q Q3 FY /4Q Q4 FY /1Q Q1 FY /2Q Q2 FY /3Q Q3 Copyright Adways Inc. All Rights Reserved. 35
37 3. Supplementary Materials Quarterly Change in Consolidated SG&A expenses Personnel Recruiting & Training Rent Depreciation Other expenses SG&A/cons. sales 2,000 1,800 1,600 1,400 1,200 1, % 16.8% 15.8% 16.1% 19.1% 15.7% 14.9% 14.9% 15.1% (JPY mn) FY /3Q Q3 FY /4Q Q4 FY /1Q Q1 FY /2Q Q2 FY /3Q Q3 FY /4Q Q4 FY /1Q Q1 FY /2Q Q2 FY /3Q Q3 Copyright Adways Inc. All Rights Reserved. 36
38 3. Supplementary Materials Quarterly Change in Consolidated Operating profit Operating profits Operating margin 3.6% % 1.3% 1.5% 2.0% 0.8% % % % (JPY mn) FY /3Q Q3 FY /4Q Q4 FY /1Q Q1 FY /2Q Q2 FY /3Q Q3 FY /4Q Q4 FY /1Q Q1 FY /2Q Q2 FY /3Q Q3 Copyright Adways Inc. All Rights Reserved. 37
39 3. Supplementary Materials Consolidated Balance Sheet (QoQ) FY2018 Q3 FY2018 Q2 Change ( mn) Change (%) Current assets 15,341 15, % (Cash and deposits) 9,976 9, % Non-current assets 2,612 2, % Total assets 17,953 18, % Current liabilities 6,674 7, % Non-current liabilities % Total liabilities 6,793 7, % Net assets 11,160 11, % (JPY mn) Copyright Adways Inc. All Rights Reserved. 38
40 3. Supplementary Materials Quarterly Breakdown of Consolidated Sales by Segment 14,000 12,000 10,000 9,070 11,169 11,443 11,044 10,038 8,000 6,000 4,000 2,000 (JPY mn) 0 QoQ FY2017 Q3 FY2017 Q4 FY2018 Q1 FY2018 Q2 FY2018 Q3 Change Change (%) Smartphone 4,317 4,960 5,464 4,743 4, % PC 3,407 4,706 4,774 5,012 4, % Overseas 1,164 1,330 1,049 1,132 1, % App Media, Other % Total 9,070 11,169 11,443 11,044 10,038-1, % In conjunction with the FY2018 Q1 segment change, the previous figures are displayed accroding to the segments after the change. Copyright Adways Inc. All Rights Reserved. 39
41 3. Supplementary Materials Quarterly Breakdown of Consolidated Operating Profit by Segment 1, (JPY mn) -800 QoQ FY2017 Q3 FY2017 Q4 FY2018 Q1 FY2018 Q2 FY2018 Q3 Change Change (%) Advertising % Overseas App Media, Other Eliminations & corporate Total % In conjunction with the FY2018 Q1 segment change, the previous figures are displayed accroding to the segments after the change. Copyright Adways Inc. All Rights Reserved. 40
42 3. Supplementary Materials Quarterly Change in Group employees 1,400 1,200 1,000 1,225 1,184 1,137 1,095 1,070 1, (Persons) FY2016 Q3 FY2016 Q4 FY2017 Q1 FY2017 Q2 FY2017 Q3 FY2017 Q4 FY2018 Q1 FY2018 Q2 FY2018 Q3 ADW Japan ADW China ADW Shanghai (R&D center) Domestic subsidiaries Overseas subsidiaries (excluding China) Temporary workers, part-time employees Total 1,225 1,184 1,137 1,095 1,070 1, The number of employees at ADW Shanghai is zero due to a management buyout in March Copyright Adways Inc. All Rights Reserved.
43 3. Supplementary Materials Company Overview Company name Founded Business overview Founder and CEO Capital Net sales Employees * including temporary workers Adways Inc. February 28, 2001 Internet business Haruhisa Okamura JPY 1,605 mn JPY 41,501 mn 902 (for the entire Group) (As of end of Dec 2018) (FY2017, Consolidated) (As of end of Dec 2018) Copyright Adways Inc. All Rights Reserved. 42
Topics. 1. FY2018 Q2 Performance P Business Overview. 3. Supplementary Materials. Copyright Adways Inc. All Rights Reserved.
 Topics 1. FY2018 Q2 Performance P.2 2. Business Overview 3. Supplementary Materials P.14 P.30 Copyright Adways Inc. All Rights Reserved. 1 1. FY2018 Q2 Performance Copyright Adways Inc. All Rights Reserved.
Topics. 1. Full Year FY2017 Performance P Q FY2017 Performance P FY2018 Consolidated Performance Forecast & Shareholder returns
 Topics 1. Full Year FY2017 Performance P.2 2. 4Q FY2017 Performance P.14 3. FY2018 Consolidated Performance Forecast & Shareholder returns P.23 4. Business Overview P.26 5. Supplementary Materials P.44
Financial Results Presentation for 3Q FY2013
 Adways Inc.(Tokyo Stock Exchange Mothers: 2489) Financial Results Presentation for 3Q FY2013 (from October 2013 to December 2013) January 31, 2014 President and CEO, Haruhisa Okamura Topics 3Q FY2013 Performance
Topics. 1. 2Q FY2016 Performance P Business Overview P Supplementary Materials P.23. Copyright Adways Inc. All Rights Reserved.
 Topics 1. 2Q FY2016 Performance P.2 2. Business Overview P.10 3. Supplementary Materials P.23 Copyright Adways Inc. All Rights Reserved. 1 1. 2Q FY2016 Performance Copyright Adways Inc. All Rights Reserved.
Japan s Leading All-in Provider of Internet Services. Copyright (C) 2013 GMO Internet, Inc. All Rights Reserved.
 2013 GMO Internet, Inc. All Rights Reserved.") Japan s Leading All-in Provider of Internet Services Fiscal Year 2012 Results Presentation Masatoshi Kumagai, CEO Masashi Yasuda, CFO February 6, 2013 GMO Internet, Inc. (TSE1: 9449) 2 About the Use of
Japan s Leading All-in Provider of Internet Services Fiscal Year 2012 Results Presentation Masatoshi Kumagai, CEO Masashi Yasuda, CFO February 6, 2013 GMO Internet, Inc. (TSE1: 9449) 2 About the Use of
3. Consolidated Financial Forecasts of FY 3/2018 (April 1, 2017 March 31, 2018) Q2 (H1 FY 3/2018) Full Year Sales Operating Profit Ordinary Profit Net
 Q2 (H1 FY 3/2018) Full Year Sales Operating Profit Ordinary Profit Net") Q1 FY 3/2018 Summary of Consolidated Financial Results August 7, 2017 Company Name Wacom Co., Ltd. (Code Number: 6727 TSE1) (URL http://www.wacom.com ) Representative: Masahiko Yamada, CEO TEL: +81-3-5337-6502
Q1 FY 3/2018 Summary of Consolidated Financial Results August 7, 2017 Company Name Wacom Co., Ltd. (Code Number: 6727 TSE1) (URL http://www.wacom.com ) Representative: Masahiko Yamada, CEO TEL: +81-3-5337-6502
Fiscal Year 2018 Third Quarter Consolidated Financial Results (Japanese GAAP)
") Fiscal Year 2018 Third Quarter Consolidated Financial Results (Japanese GAAP) November 12, 2018 Name of Listed Company: GMO Internet, Inc. Exchange Listing: Tokyo Stock Exchange Stock Code: 9449 URL: https://www.gmo.jp/en
Fiscal Year 2018 Third Quarter Consolidated Financial Results (Japanese GAAP) November 12, 2018 Name of Listed Company: GMO Internet, Inc. Exchange Listing: Tokyo Stock Exchange Stock Code: 9449 URL: https://www.gmo.jp/en
April 28, st Quarter, Business Results for the Fiscal Year Ending December 31, 2015
 April 28, 2015 1st Quarter, Business Results for the Fiscal Year Ending December 31, 2015 2015Q1 (Jan-Mar) Summary of Financial Results * Unstated amounts are rounded down to the nearest one million yen
3. Consolidated Business Forecasts of FY 3/2019 (April 1, 2018 March 31, 2019) H1 Net Sales Operating Profit Ordinary Profit Profit Attributable to Ow
 H1 Net Sales Operating Profit Ordinary Profit Profit Attributable to Ow") Q1 FY 3/2019 Summary of Consolidated Financial Results August 6, 2018 Company Name Wacom Co., Ltd. (Code Number: 6727 TSE1) (URL http://www.wacom.com ) Representative: Nobutaka Ide, CEO TEL: +81-3-5337-6502
Q1 FY 3/2019 Summary of Consolidated Financial Results August 6, 2018 Company Name Wacom Co., Ltd. (Code Number: 6727 TSE1) (URL http://www.wacom.com ) Representative: Nobutaka Ide, CEO TEL: +81-3-5337-6502
Fiscal year ended December 31, 2017 Earnings Briefing
 Fiscal year ended December 31, 2017 Earnings Briefing Loadstar Capital K.K. Securities code: 3482 February 2018 Loadstar Capital ALL RIGHTS RESERVED Table of Contents 1. Overview of Financial Results for
Fiscal Year 2017 First Quarter Consolidated Financial Results (Japanese GAAP)
") Fiscal Year 2017 First Quarter Consolidated Financial Results (Japanese GAAP) May 15, 2017 Name of Listed Company: GMO Internet, Inc. Exchange Listing: Tokyo Stock Exchange Stock Code: 9449 URL: http://www.gmo.jp/en
Fiscal Year 2017 First Quarter Consolidated Financial Results (Japanese GAAP) May 15, 2017 Name of Listed Company: GMO Internet, Inc. Exchange Listing: Tokyo Stock Exchange Stock Code: 9449 URL: http://www.gmo.jp/en
Financial Results for the Second Quarter of FY 2018 [Based on the Japanese Accounting Standards] (Consolidated) November 5, 2018
![Financial Results for the Second Quarter of FY 2018 [Based on the Japanese Accounting Standards] (Consolidated) November 5, 2018](/thumbs/91/104494815.jpg "Financial Results for the Second Quarter of FY 2018 [Based on the Japanese Accounting Standards] (Consolidated) November 5, 2018") Financial Results for the Second Quarter of FY 2018 [Based on the Japanese Accounting Standards] (Consolidated) November 5, 2018 Name of the company: Takachiho Koheki Co., Ltd. Stock Market: Tokyo Stock
Financial Results for the Second Quarter of FY 2018 [Based on the Japanese Accounting Standards] (Consolidated) November 5, 2018 Name of the company: Takachiho Koheki Co., Ltd. Stock Market: Tokyo Stock
Business Report for Q1 FY ending March 31, 2019 (April-June 2018)
") Business Report for Q1 FY ending March 31, 2019 (April-June 2018) Wacom Chapter 2 Wacom Co., Ltd. (TSE 1st Sec. Code: 6727) Q1 FY 03/19 Results Overview Consolidated net sales of JPY 17.9 bn (YOY +12%)
Business Report for Q1 FY ending March 31, 2019 (April-June 2018) Wacom Chapter 2 Wacom Co., Ltd. (TSE 1st Sec. Code: 6727) Q1 FY 03/19 Results Overview Consolidated net sales of JPY 17.9 bn (YOY +12%)
Fiscal Year 2018 Second Quarter Consolidated Financial Results (Japanese GAAP)
") Fiscal Year 2018 Second Quarter Consolidated Financial Results (Japanese GAAP) August 9, 2018 Name of Listed Company: GMO Internet, Inc. Exchange Listing: Tokyo Stock Exchange Stock Code: 9449 URL: https://www.gmo.jp/en
Fiscal Year 2018 Second Quarter Consolidated Financial Results (Japanese GAAP) August 9, 2018 Name of Listed Company: GMO Internet, Inc. Exchange Listing: Tokyo Stock Exchange Stock Code: 9449 URL: https://www.gmo.jp/en
DREAM INCUBATOR / 4310
 This PDF document is an updated note on the company. A comprehensive version of the report on the company, including this latest update, is available on our website and various professional platforms.
Flash Report for the 3rd Quarter of the Fiscal Year Ending December 31, 2018 [Japan GAAP] (on a consolidated basis)
![Flash Report for the 3rd Quarter of the Fiscal Year Ending December 31, 2018 [Japan GAAP] (on a consolidated basis)](/thumbs/92/110340460.jpg "Flash Report for the 3rd Quarter of the Fiscal Year Ending December 31, 2018 [Japan GAAP] (on a consolidated basis)") This document has been translated from the Japanese original document for reference purposes only. In the event of any discrepancy between this translated document and the Japanese original, the original
This document has been translated from the Japanese original document for reference purposes only. In the event of any discrepancy between this translated document and the Japanese original, the original
Agenda. Company Overview Annual Financial Results. Business Review and Prospects
 Disclaimer This presentation and the accompanying slides (the Presentation ) which have been prepared by IGG INC (the Company ) do not constitute any offer or invitation to purchase or subscribe for any
Overview Total Transaction Value:67,414 million yen(+20.2%, Yoy)Operating Profit: 7,009million yen(+16.0%, Yoy) Steady growth. Total Transaction Value
Operating Profit: 7,009million yen(+16.0%, Yoy) Steady growth. Total Transaction Value") Overview Total Transaction Value:67,414 million yen(+20.2%, Yoy)Operating Profit: 7,009million yen(+16.0%, Yoy) Steady growth Total Transaction Value ZOZOTOWN Business Total Transaction Value 59,785 million
Overview Total Transaction Value:67,414 million yen(+20.2%, Yoy)Operating Profit: 7,009million yen(+16.0%, Yoy) Steady growth Total Transaction Value ZOZOTOWN Business Total Transaction Value 59,785 million
GungHo Online Entertainment, Inc. FY2013 Financial Results
 GungHo Online Entertainment, Inc. FY2013 Financial Results Feb 4, 2014 FY2013 Financial Highlights Director CFO Kazuya Sakai 2 FY2013 Summary Record High Sales and Income 3 Trends in Consolidated Sales
Research Coverage Report by Shared Research Inc.
 This PDF document is an updated note on the company. A comprehensive version of the report on the company, including this latest update, is available on our website and various professional platforms.
2008 3Q Earnings Release. October 20 th
 2008 3Q Earnings Release October 20 th 2008 0 All information regarding management performance and financial results of LG Electronics (the Company ) during the 3 rd quarter of 2008 as contained herein
FY11 3Q Summary of Consolidated Financial Results
 FY11 3Q Summary of Consolidated Financial Results January 30, 2012 Company Name Wacom Co., Ltd. (Code Number: 6727 TSE1) (URL http://wacom.jp/en/company/outline ) Representative: Masahiko Yamada, CEO TEL:
Summary of Consolidated Financial Results for the 9 Months Ended November 30, 2016 (Based on Japanese GAAP)
") Translation tice: This document is an excerpt translation of the original Japanese document and is only for reference purposes. In the event of any discrepancy between this translated document and the
Translation tice: This document is an excerpt translation of the original Japanese document and is only for reference purposes. In the event of any discrepancy between this translated document and the
FY2017 1H Summary. Cookpad Inc.
 FY2017 1H Summary Cookpad Inc. Contents 1.Business Overview 2.Web/APP Usage 3.Premium Service 4.Advertising Revenue 5.Cookpad TV 6.Cookpad in Global 2 1. Business Overview 1st Half of the Year: Highlights
Earnings Release. NCsoft Corp.
 Earnings Release 1Q, 2005 NCsoft Corp. May 6, 2005 NCsoft Corp. Online Game Publisher Seung Kwang Bldg., 143-8 Samsung-dong, Kangnam-gu, Seoul 135-090, KOREA Tel : +82-2-2186-3300 Fax : +82-2-2186-3393
Yahoo Japan Corporation
 Yahoo Japan Corporation FY2010-1Q Business Results (Apr.-Jun. 2010) July 27, 2010 1 Statements made at the meeting or included in the documents that are not historical facts are forward-looking statements
3. Consolidated Business Forecasts of FY 3/2017 (April 1, 2016 March 31, 2017) 2Q (H1 FY 3/2017) Full Year Sales Operating Income Ordinary Income Net
 2Q (H1 FY 3/2017) Full Year Sales Operating Income Ordinary Income Net") Q1 FY 3/2017 Summary of Consolidated Financial Results August 5, 2016 Company Name Wacom Co., Ltd. (Code Number: 6727 TSE1) (URL http://www.wacom.com ) Representative: Masahiko Yamada, CEO TEL: 03-5337-6502
Q1 FY 3/2017 Summary of Consolidated Financial Results August 5, 2016 Company Name Wacom Co., Ltd. (Code Number: 6727 TSE1) (URL http://www.wacom.com ) Representative: Masahiko Yamada, CEO TEL: 03-5337-6502
Consolidated Financial Results of Fiscal Year 2017
 Consolidated Financial Results of Fiscal Year 2017 Company name: DISCO Corporation Stock code number: 6146 (Tokyo Stock Exchange 1st Section) URL: http://www.disco.co.jp Telephone number: 81-3-4590-1099
First Quarter of FY 2018
 First Quarter of FY 2018 Consolidated Financial Results Japan Display Inc. August 8, 2018 1Q-FY18 Results & FY 2018 Guidance Takanobu Oshima Chief Financial Officer 2 1Q-FY18 Topics 1Q sales were down
NCsoft Earnings Release Q4, 2007
 NCsoft Earnings Release Q4, 2007 February 13, 2008 NCsoft CORPORATION OK-san Bldg 157-33, Samsung-dong, Kangnam-gu, Seoul 135-090, KOREA Tel: +82-2-2186-3300 Fax : +82-2-2186-3550 Copyright NCsoft Corporation.
Matsui Securities / 8628
 Research Report by Shared Research Inc. https://sharedresearch.jp This PDF document is an updated note on the company. A comprehensive version of the report on the company, including this latest update,
(Note) Comprehensive Income - Sep 30, 2012: 3,648 million (-2.9%), Sep 30, 2011: 3,758 million (-%) Net Profit per Share (Diluted)
 Comprehensive Income - Sep 30, 2012: 3,648 million (-2.9%), Sep 30, 2011: 3,758 million (-%) Net Profit per Share (Diluted)") Consolidated Third Quarter Results Statement for the Fiscal Year Ending December 2012 (Japanese GAAP) November 2, 2012 Name of Listed Company: GMO Internet, Inc. Exchange Listing: Tokyo Stock Exchange
Consolidated Third Quarter Results Statement for the Fiscal Year Ending December 2012 (Japanese GAAP) November 2, 2012 Name of Listed Company: GMO Internet, Inc. Exchange Listing: Tokyo Stock Exchange
Marimedia Ltd. ( Marimedia or the Company ) Interim Results 2015
 Interim Results 2015") 3 September 2015 Marimedia Ltd. ( Marimedia or the Company ) Interim Results 2015 Marimedia (AIM: MARI) (to be renamed Taptica), a proprietary marketing ad-technology solutions company that leverages big
3 September 2015 Marimedia Ltd. ( Marimedia or the Company ) Interim Results 2015 Marimedia (AIM: MARI) (to be renamed Taptica), a proprietary marketing ad-technology solutions company that leverages big
Consolidated Financial Review for the First Quarter Ended June 30, 2016
 Consolidated Financial Review for the First Quarter Ended June 30, 2016 Company name: Tokyo Electron Limited URL: http://www.tel.com Telephone number: (03) 5561-7000 Stock exchange listing: Tokyo Stock
SOFTBANK CORP. CONSOLIDATED FINANCIAL REPORT For the three-month period ended June 30, 2007
 SOFTBANK CORP. CONSOLIDATED FINANCIAL REPORT For the three-month period ended June 30, 2007 Tokyo, August 8, 2007 FINANCIAL HIGHLIGHTS 1. Results of Operations Three-month period ended June 30, 2007 Three-month
Summary of Consolidated Financial Results for the Six Months Ended October, 2012 (2Q/FY2013) [Japanese Standards] (Consolidated)
![Summary of Consolidated Financial Results for the Six Months Ended October, 2012 (2Q/FY2013) [Japanese Standards] (Consolidated)](/thumbs/94/121083167.jpg "Summary of Consolidated Financial Results for the Six Months Ended October, 2012 (2Q/FY2013) [Japanese Standards] (Consolidated)") December 7, 2012 Summary of Consolidated Financial Results for the Six Months Ended October, 2012 (2Q/FY2013) [Japanese Standards] (Consolidated) Company name: ZAPPALLAS, INC. Stock listing: Tokyo Stock
December 7, 2012 Summary of Consolidated Financial Results for the Six Months Ended October, 2012 (2Q/FY2013) [Japanese Standards] (Consolidated) Company name: ZAPPALLAS, INC. Stock listing: Tokyo Stock
Earnings Call Presentation Q3 2018
 Earnings Call Presentation Q3 2018 Forward Looking Statements This presentation and the accompanying oral presentation contain forward-looking statements that are based on our management s beliefs and
Fiscal Year 2013 Second Quarter Consolidated Financial Results (Japanese GAAP)
") Fiscal Year 2013 Second Quarter Consolidated Financial Results (Japanese GAAP) August 1, 2013 Name of Listed Company: GMO Internet, Inc. Exchange Listing: Tokyo Stock Exchange Stock Code: 9449 URL: http://www.gmo.jp/en
Fiscal Year 2013 Second Quarter Consolidated Financial Results (Japanese GAAP) August 1, 2013 Name of Listed Company: GMO Internet, Inc. Exchange Listing: Tokyo Stock Exchange Stock Code: 9449 URL: http://www.gmo.jp/en
SunTrust 2018 Internet & Digital Media Conference. May 8, 2018
 SunTrust 2018 Internet & Digital Media Conference May 8, 2018 SAFE HARBOR STATEMENT This presentation is for informational purposes only and is not an offer to sell securities or a solicitation of an offer
FY16/3 Financial Results
 FY16/3 Financial Results Renesas Electronics Corporation May 11, 2016 2016 Renesas Electronics Corporation. All rights reserved. FY16/3 Financial Results Since FY16/3, Renesas Electronics Group (hereinafter
(Year ended March 31, 2014) May 16, 2014 FY2013 CONSOLIDATED RESULTS
 May 16, 2014 FY2013 CONSOLIDATED RESULTS") (Year ended March 31, 2014) May 16, 2014 1 Consolidated Results Summary Business Results for FY2013 Ended March 31, 2014 Forecast for FY2014 Ending March 31, 2015 Measures of FY2014 Ending March 31, 2015
(Year ended March 31, 2014) May 16, 2014 1 Consolidated Results Summary Business Results for FY2013 Ended March 31, 2014 Forecast for FY2014 Ending March 31, 2015 Measures of FY2014 Ending March 31, 2015
First Quarter Earnings Report for Fiscal 2017, Ending March 31, 2018 [Japanese Standards] (Consolidated)
![First Quarter Earnings Report for Fiscal 2017, Ending March 31, 2018 [Japanese Standards] (Consolidated)](/thumbs/75/71503456.jpg "First Quarter Earnings Report for Fiscal 2017, Ending March 31, 2018 [Japanese Standards] (Consolidated)") First Quarter Earnings Report for Fiscal 2017, Ending March 31, 2018 [Japanese Standards] (Consolidated) July 28, 2017 Company name: Ryosan Company, Limited Stock listing: First Section, Tokyo Stock Exchange
First Quarter Earnings Report for Fiscal 2017, Ending March 31, 2018 [Japanese Standards] (Consolidated) July 28, 2017 Company name: Ryosan Company, Limited Stock listing: First Section, Tokyo Stock Exchange
Consolidated Business Results
 FY2013 April 1, 2013 December 31, 2013 Consolidated Business Results 2014.1.31 01 FY2013 3Q Highlights Overview for the consolidated business result Total Transaction value:81.1billion yen (+19.2% increase
Financial Results for the Second Quarter of the Fiscal Year Ending March 31, 2014 [Japanese GAAP] (Consolidated)
![Financial Results for the Second Quarter of the Fiscal Year Ending March 31, 2014 [Japanese GAAP] (Consolidated)](/thumbs/93/111330278.jpg "Financial Results for the Second Quarter of the Fiscal Year Ending March 31, 2014 [Japanese GAAP] (Consolidated)") Financial Results for the Second Quarter of the Fiscal Year Ending March 31, 2014 [Japanese GAAP] (Consolidated) October 29, 2013 Name of Listed Company: Hino Motors, Ltd. Stock Listing: Tokyo and Nagoya
Financial Results for the Second Quarter of the Fiscal Year Ending March 31, 2014 [Japanese GAAP] (Consolidated) October 29, 2013 Name of Listed Company: Hino Motors, Ltd. Stock Listing: Tokyo and Nagoya
Consolidated Financial Review for the Second Quarter Ended September 30, 2015
 Oct 27, 2015 Consolidated Financial Review for the Second Quarter Ended September 30, 2015 Company name: Tokyo Electron Limited URL: http://www.tel.com Telephone number: (03) 5561-7000 Stock exchange listing:
FINANCIAL SUMMARY FOR THE FIRST QUARTER ENDED JUNE 30, 2009
 Company Name: ANRITSU CORPORATION (Code Number:6754) Listed at : Tokyo Stock Exchange URL http://www.anritsu.co.jp/ Representative: Hiromichi Toda ; President and Director Contact Person: Tetsuo Kawabe
Q Results Presentation
 Q3 2017 Results Presentation September 2017 November 2, 2017 Copyright 2017 AutoWeb, Inc. 2 Safe Harbor Statement and Non-GAAP Disclosures The statements made in the accompanying conference call or contained
Overview Total transaction value : 92.1billion yen (+ 13.5% /Yoy)
") 1 Overview Total transaction value : 92.1billion yen (+ 13.5% /Yoy) Operating Profit : 10.6 billion yen (+23.3% /Yoy). For Operating Profit, we have over achieved our corporate plan (not disclosed). Total
1 Overview Total transaction value : 92.1billion yen (+ 13.5% /Yoy) Operating Profit : 10.6 billion yen (+23.3% /Yoy). For Operating Profit, we have over achieved our corporate plan (not disclosed). Total
4. Other 1) Reclassification of significant subsidiaries during the period (Reclassification due to the change in scope of consolidation) : No 2) Adop
 Reclassification of significant subsidiaries during the period (Reclassification due to the change in scope of consolidation) : No 2) Adop") 1Q FY 3/2015 Summary of Consolidated Financial Results Company Name Wacom Co., Ltd. (URL http://www.wacom.com ) Representative: Masahiko Yamada, CEO TEL: 0120-056-665 Contact: Wataru Hasegawa, CFO Preparation
1Q FY 3/2015 Summary of Consolidated Financial Results Company Name Wacom Co., Ltd. (URL http://www.wacom.com ) Representative: Masahiko Yamada, CEO TEL: 0120-056-665 Contact: Wataru Hasegawa, CFO Preparation
2Q FY 3/2016 Summary of Consolidated Financial Results Company Name Wacom Co., Ltd. (URL ) Representative: Masahiko Yamada, CEO T
 Representative: Masahiko Yamada, CEO T") 2Q FY 3/2016 Summary of Consolidated Financial Results Company Name Wacom Co., Ltd. (URL http://www.wacom.com ) Representative: Masahiko Yamada, CEO TEL: 03-5337-6502 Contact: Toru Ando, CFO Preparation
2Q FY 3/2016 Summary of Consolidated Financial Results Company Name Wacom Co., Ltd. (URL http://www.wacom.com ) Representative: Masahiko Yamada, CEO TEL: 03-5337-6502 Contact: Toru Ando, CFO Preparation
Net sales Operating income Ordinary income EBITDA. 2,679 million yen (22.3%) 4,894 million yen (16.1%) June 30, 2017:
 4,894 million yen (16.1%) June 30, 2017:") Summary of Consolidated Financial Results for the Three-month Period Ended June 30, 2018 (Japanese accounting standards) Released August 7, 2018 Name of listed firm: Nojima Corporation Listed on the Tokyo
Summary of Consolidated Financial Results for the Three-month Period Ended June 30, 2018 (Japanese accounting standards) Released August 7, 2018 Name of listed firm: Nojima Corporation Listed on the Tokyo
Chugoku Marine Paints 4617
 This PDF document is an updated note on the company. A comprehensive version of the report on the company, including this latest update, is available on our website at http:// and various professional
Precision System Science Co., Ltd.
 Nov 14, 2017 Precision System Science Co., Ltd. SUMMARY OF CONSOLIDATED FINANCIAL STATEMENTS For the First Three Months of the Fiscal Year, Ending June 30 2018 (From July 1, 2017 to September 30, 2017)
Company Presentation. Search. March 2015
 Company Presentation Search March 2015 Forward Looking Statement Disclaimer This presentation contains forward-looking statements that involve risks and uncertainties. These include statements regarding
STARTIA, INC Tokyo Stock Exchange First Section
 Company Research and Analysis Report FISCO Ltd. http://www.fisco.co.jp 伪伪 In the middle of shifting gears towards the achievement of the new middle term plan and the growth after the plan. Startia
Consolidated Financial Results for the Fiscal Year Ended March 31, 2018 [Japanese GAAP]
![Consolidated Financial Results for the Fiscal Year Ended March 31, 2018 [Japanese GAAP]](/thumbs/87/97109926.jpg "Consolidated Financial Results for the Fiscal Year Ended March 31, 2018 [Japanese GAAP]") This is an abridged translation of the original document in Japanese and is intended for reference purposes only. In the event of any discrepancy between this translated document and the Japanese original,
This is an abridged translation of the original document in Japanese and is intended for reference purposes only. In the event of any discrepancy between this translated document and the Japanese original,
1 Consolidated Earnings for the Third Quarter of the Fiscal Year Ending September 2016
 Financial Results for the Third Quarter of the Fiscal Year Ending September 2016 [Japanese Standards](Consolidated) July 21, 2016 Listed company name: CyberAgent, Inc. Listed stock exchange: TSE 1st section
FY2018 Q2 Financial Results
 Wantedly, Inc. FY2018 Q2 Financial Results 13.Apr.2018 FY2018 Q2 Results Overview FY2018 Q2 Consolidated Earnings Results - 61% YoY Revenue Growth ( M) F8/17Q2 F8/18Q1 F8/18Q2 YoY QoQ Revenue 310 433 500
Company Presentation. September 2016
 Company Presentation September 216 Forward Looking Statement Disclaimer This presentation contains forward-looking statements that involve risks and uncertainties. These include statements regarding the
Investor Presentation Q NEXON Co., Ltd.
 Investor Presentation NEXON Co., Ltd. Results 2 Highlights First quarter performance exceeded high end of our outlook 44.4 bn revenue, up 46% year-over-year, and up 26% on a constant currency basis 20.7
Q2 13 FINANCIAL HIGHLIGHTS
 Q2 13 FINANCIAL HIGHLIGHTS 7.16.2013 1 This presentation contains forward-looking statements concerning Yahoo! s expected financial performance and Yahoo! s strategic and operational plans. Risks and uncertainties
Consolidated Financial Review for the Third Quarter Ended December 31, 2015
 Jan 29, 2016 Consolidated Financial Review for the Third Quarter Ended December 31, 2015 Company name: Tokyo Electron Limited URL: http://www.tel.com Telephone number: (03) 5561-7000 Stock exchange listing:
2009 3Q Earnings Release
 2009 3Q Earnings Release October 21 st 2009 All information regarding management performance and financial results of LG Electronics (the Company ) during the 3 rd quarter of 2009 as contained herein has
Yahoo Japan Corporation
 Yahoo Japan Corporation FY2015 Full Year & 4Q Business Results (Apr. 2015-Mar. 2016/Jan.-Mar. 2016) April 28, 2016 P. 4 P. 14 P. 17 P. 22 P. 25 P. 34 P. 45 P. 50 2 Table of Contents FY2015 Full Year Financial
Second Quarter of FY 2018 (July 1, 2018 Sep 30, 2018) Japan Display Inc. Consolidated Financial Results. November 12, 2018
 Japan Display Inc. Consolidated Financial Results. November 12, 2018") Second Quarter of FY 2018 (July 1, 2018 Sep 30, 2018) Consolidated Financial Results Japan Display Inc. November 12, 2018 Today s Speakers Yoshiyuki Tsukizaki Chief Operating Officer and President Takanobu
Second Quarter of FY 2018 (July 1, 2018 Sep 30, 2018) Consolidated Financial Results Japan Display Inc. November 12, 2018 Today s Speakers Yoshiyuki Tsukizaki Chief Operating Officer and President Takanobu
TENCENT ANNOUNCES 2012 SECOND QUARTER AND INTERIM RESULTS
 For Immediate Release TENCENT ANNOUNCES 2012 SECOND QUARTER AND INTERIM RESULTS Hong Kong, August 15, 2012 Tencent Holdings Limited ( Tencent or the Company, SEHK 00700), a leading provider of comprehensive
TOKYO ELECTRON Summary of Consolidated Financial Results for the Second Quarter Ended September 30, 2018 (Japanese GAAP) October 31, 2018 Name of List
 October 31, 2018 Name of List") Summary of Consolidated Financial Results for the Second Quarter Ended September 30, 2018 (Japanese GAAP) October 31, 2018 Name of Listed Company: Tokyo Electron Limited Stock Exchange Listing: Tokyo Security
Summary of Consolidated Financial Results for the Second Quarter Ended September 30, 2018 (Japanese GAAP) October 31, 2018 Name of Listed Company: Tokyo Electron Limited Stock Exchange Listing: Tokyo Security
Taiyo Holdings / 4626
 COVERAGE INITIATED ON: 2017.12.08 Shared Research Inc. has produced this report by request from the company discussed in the report. The aim is to provide an owner s manual to investors. We at Shared Research
3. Consolidated Forecast for the Fiscal Year Ending March 31, 2019 (April 1, 2018 March 31, 2019) (Percentages represent year-over-year changes)
 (Percentages represent year-over-year changes)") May 9, 2018 Summary of Financial Results for the Fiscal Year Ended March 31, 2018 [Japanese GAAP] Company name: JCU CORPORATION Listing: Tokyo Stock Exchange, First Section Stock code: 4975 URL: https://www.jcu-i.com/
May 9, 2018 Summary of Financial Results for the Fiscal Year Ended March 31, 2018 [Japanese GAAP] Company name: JCU CORPORATION Listing: Tokyo Stock Exchange, First Section Stock code: 4975 URL: https://www.jcu-i.com/
Details of financial results of FY2017 are as follows.
 Details of financial results of are as follows. (Unit: million yen) FY2016 YoY Against Guidance Total Transaction Value 212,090 (100.0%) 270,543 (100.0%) 27.6% 0.2% Net Sales 76,393 (36.0%) 98,432 (36.4%)
3. Financial Forecasts for the Year Ending March 31, 2019 (April 1, 2018 to March 31, 2019) Note: Percentages for year ending March 31, 2019 indicate
 Note: Percentages for year ending March 31, 2019 indicate") Summary of Consolidated Financial Results for the First Quarter Ended June 30, 2018 (Japanese GAAP) July 26, 2018 Name of Listed Company: Tokyo Electron Limited Stock Exchange Listing: Tokyo Security Code:
Summary of Consolidated Financial Results for the First Quarter Ended June 30, 2018 (Japanese GAAP) July 26, 2018 Name of Listed Company: Tokyo Electron Limited Stock Exchange Listing: Tokyo Security Code:
Third Quarter 2017 Financial Report FYBER N.V.
 FYBER N.V. Third Quarter 20 Financial Report 1 Fyber N.V. ( Fyber or the Company ) is a global technology company, developing a next generation platform for the programmatic trading of ads, in a data-driven
Financial Results. Fourth Quarter & Full Year Fiscal Japan Display Inc. May 15, 2018
 Financial Results Fourth Quarter & Full Year Fiscal 2017 Japan Display Inc. May 15, 2018 4Q-FY17 Results & FY 18 Guidance Takanobu Oshima Chief Financial Officer 2 4Q-FY17 Topics Due to lower demand for
Diluted Net Income per Share. Net Income per Share Yen
 BRIEF STATEMENT OF CONSOLIDATED FINANCIAL RESULTS FOR THE 1st QUARTER OF THE FISCAL YEAR ENDING MARCH 2019 This is an English translation of summarized consolidated financial results prepared for the convenience
Net sales Operating income Ordinary income. (2) Consolidated financial position Total assets Net assets Equity ratio Millions of yen Millions of yen %
 Consolidated financial position Total assets Net assets Equity ratio Millions of yen Millions of yen %") Consolidated Financial Results for the Second Quarter of the Fiscal Year Ending September 30, 2018 (FY9/18) (Six Months Ended March 31, 2018) [Japanese GAAP] May 15, 2018 Company name: Evolable Asia Corp.
Consolidated Financial Results for the Second Quarter of the Fiscal Year Ending September 30, 2018 (FY9/18) (Six Months Ended March 31, 2018) [Japanese GAAP] May 15, 2018 Company name: Evolable Asia Corp.
Consolidated Financial Results for the Fiscal Year Ended March 31, 2012 (Japan GAAP)
") Consolidated Financial Results for the Fiscal Year Ended March 31, 2012 (Japan GAAP) May 14, 2012 Company name: SQUARE ENIX HOLDINGS CO., LTD. Shares traded: Tokyo Stock Exchange, First Section Company
Consolidated Financial Results for the Fiscal Year Ended March 31, 2012 (Japan GAAP) May 14, 2012 Company name: SQUARE ENIX HOLDINGS CO., LTD. Shares traded: Tokyo Stock Exchange, First Section Company
Morningstar Japan K.K. Third Quarter Financial Results (Fiscal Year Ending March 31, 2011)
") Morningstar Japan K.K. Third Quarter Financial Results (Fiscal Year Ending March 31, 2011) January 25 th, 2011 Morningstar Japan K.K. < # > Part 1 Consolidated Financial Performance 2 2 Consolidated Financial
Morningstar Japan K.K. Third Quarter Financial Results (Fiscal Year Ending March 31, 2011) January 25 th, 2011 Morningstar Japan K.K. < # > Part 1 Consolidated Financial Performance 2 2 Consolidated Financial
Consolidated Financial Results for the First Quarter of Fiscal Year 2018
 Consolidated Financial Results for the First Quarter of Fiscal Year Company name: DISCO Corporation Stock code number: 6146 (Tokyo Stock Exchange 1st Section) URL: http://www.disco.co.jp Telephone number:
FY2014 First Half Results
 は FY2014 First Half s October 31, 2014 Norio Tadakawa Corporate Officer, CFO Shiseido Co., Ltd. In this document, statements other than historical facts are forward-looking statements that reflect our
FY03/17 Consolidated Financial Results For Third Quarter Ended December 31, 2016 (Japan GAAP)
") This document is a partial translation of the original Kessan Tanshin in Japanese. Digital Arts Inc. provides this translation for your reference and convenience only and without any warranty as to its
This document is a partial translation of the original Kessan Tanshin in Japanese. Digital Arts Inc. provides this translation for your reference and convenience only and without any warranty as to its
Q1 14 FINANCIAL HIGHLIGHTS. April 15, 2014
 Q1 14 FINANCIAL HIGHLIGHTS April 15, 2014 This presentation contains forward-looking statements concerning the expected financial performance of Yahoo! Inc. and its consolidated subsidiaries ( we, Yahoo
Annual Results. IGG Inc March 2018
 Annual Results IGG Inc March 2018 Disclaimer This presentation and the accompanying slides (the Presentation ) do not constitute any offer or invitation to purchase or subscribe for any securities, and
Investor Presentation Q NEXON Co., Ltd.
 Investor Presentation Q4 2012 NEXON Co., Ltd. 2012 Overview and 2013 Outlook 2 2012: Another Year of Double-Digit Growth (Unit: billions) Revenues Operating Income 87.6 24% Growth 108.4 38.2 25% Growth
First Quarter of FY Japan Display Inc. Consolidated Financial Results. August 9, 2016
 First Quarter of FY 2016 Consolidated Financial Results Japan Display Inc. August 9, 2016 Agenda 1. 1Q16 Results & 2Q16 Forecast 2. Sales Trends and JDI s Action 3. Management Challenges Note: The depreciation
SOFTBANK CORP. CONSOLIDATED FINANCIAL REPORT For the six-month period ended September 30, 2009
 SOFTBANK CORP. CONSOLIDATED FINANCIAL REPORT Tokyo, October 29, 2009 1. FINANCIAL HIGHLIGHTS (1) Results of Operations Six-month period ended September 30, 2009 (Percentages are shown as year-on-year changes)
Earnings Release 4Q January 24, 2008
 Earnings Release 4Q 2007 January 24, 2008 1 Disclaimer All information regarding management performance and financial results of LG Electronics (the Company ) during the 4th quarter of 2007 as contained
KADOKAWA DWANGO CORPORATION Financial Results for the Fiscal Year Ended March 31, 2016
 KADOKAWA DWANGO CORPORATION Financial Results for the Fiscal Year March 31, 2016 0 Contents 1 1. Review of the Fiscal Year March 31, 2016 2. Policies for the Fiscal Year Ending March 31, 2017 3. Medium-Term
Renesas Electronics Reports Third Quarter 2018 Financial Results
 Renesas Electronics Reports Third Quarter 2018 Financial Results Third Quarter Sales Decreased Year-on-Year, from Weakening End Demand Mainly in Industrial Business. Temporary Decrease in Gross Margin
Third Quarter of the Fiscal Year Ending December 31, 2016 Unicharm Presentation Materials for Investor Meeting
 Third Quarter of the Fiscal Year Ending December 31, 2016 Unicharm Presentation Materials for Investor Meeting November 4, 2016 Takahisa Takahara President and CEO Unicharm Corporation Projections stated
(1) Consolidated operating results (cumulative) (% of change from previous year) Net sales Operating profit Ordinary profit
 Consolidated operating results (cumulative) (% of change from previous year) Net sales Operating profit Ordinary profit") Summary of Consolidated Financial Results for the First Quarter of the Fiscal Year Ending March 31, 2019 [Japanese GAAP] July 30, 2018 Listed company name: Infocom Corporation Listed on: Tokyo Stock Exchange
Summary of Consolidated Financial Results for the First Quarter of the Fiscal Year Ending March 31, 2019 [Japanese GAAP] July 30, 2018 Listed company name: Infocom Corporation Listed on: Tokyo Stock Exchange
Investor Meeting for the Year ended March 2017
 Investor Meeting for the Year ended March 2017 May 24, 2017 SANSHIN ELECTRONICS CO., LTD. Toshiro Suzuki, Representative Director & COO (Stock code: 8150) 1 Business activities As a general electronics
FY Q Earnings Results
 FY 2018 2Q Earnings Results Wemade Entertainment Investor Relations August 8, 2018 Disclaimer The financial information under this document is the sales performance of Wemade Entertainment Co., Ltd. (the
Net sales Operating income Ordinary income
 Financial Results for the Fiscal Year Ended March 31, 2016 [Japanese GAAP] (Consolidated) English translation from the original Japanese-language document April 27, 2016 Name of Listed Company: Hino Motors,
FY11/3 Q3 Financial Results
 FY11/3 Q3 Financial Results Renesas Electronics Corporation January 28, 2011 Kazuaki Ogura, Executive Vice President 2011 Renesas Electronics Corporation. All rights reserved. (FOREWARD-LOOKING STATEMENTS)
Net sales Operating income Ordinary income EBITDA. 7,727 million yen (72.9%) 11,559 million yen (35.5%)
 11,559 million yen (35.5%)") Summary of Consolidated Financial Results for the Six-month Period Ended September 30, 2018 (Japanese accounting standards) Released October 30, 2018 Name of listed firm: Nojima Corporation Listed on the
Summary of Consolidated Financial Results for the Six-month Period Ended September 30, 2018 (Japanese accounting standards) Released October 30, 2018 Name of listed firm: Nojima Corporation Listed on the
Fourth Quarter 2004 Financial Results. March11, 2005
 INVESTOR RELATIONS Fourth Quarter 200 Financial Results March11, 2005 Disclaimer The financial results for Q of 200 have not been reviewed or audited, and may be subject To change following the completion
Consolidated Financial Results For the Second Quarter Ended September 30, 2018 [JGAAP]
![Consolidated Financial Results For the Second Quarter Ended September 30, 2018 [JGAAP]](/thumbs/94/121027936.jpg "Consolidated Financial Results For the Second Quarter Ended September 30, 2018 [JGAAP]") DISCLAIMER This document is summary translation of Japanese version and is to be used solely as a reference. In the event of any discrepancy, errors and/or omissions, the Japanese version shall prevail.
DISCLAIMER This document is summary translation of Japanese version and is to be used solely as a reference. In the event of any discrepancy, errors and/or omissions, the Japanese version shall prevail.
Results of Operations
 Results of Operations for the Fiscal Year Ended August 2017 (FY8/17) October 20, 2017 Contents Corporate Overview 3 Organization 4 FY8/17 Consolidated Results of Operations 5 Financial Highlights 6 Consolidated
Summary of Financial Data and Business Results for the Third Quarter of the Fiscal Year Ending March 31, 2016 (JP GAAP, Consolidated)
") This is an English translation of the official announcement in Japanese that was released on February 9, 2016. The translation is prepared for the readers convenience only. All readers are strongly recommended
This is an English translation of the official announcement in Japanese that was released on February 9, 2016. The translation is prepared for the readers convenience only. All readers are strongly recommended
Summary of Consolidated Financial Results for the First Half Ended September 30, 2018 [Japan GAAP]
![Summary of Consolidated Financial Results for the First Half Ended September 30, 2018 [Japan GAAP]](/thumbs/95/123620472.jpg "Summary of Consolidated Financial Results for the First Half Ended September 30, 2018 [Japan GAAP]") November 6, 2018 Summary of Consolidated Financial Results for the First Half Ended September 30, 2018 [Japan GAAP] Name of Company: KAGA ELECTRONICS CO., LTD. Stock Code: 8154 Stock Exchange Listing:
November 6, 2018 Summary of Consolidated Financial Results for the First Half Ended September 30, 2018 [Japan GAAP] Name of Company: KAGA ELECTRONICS CO., LTD. Stock Code: 8154 Stock Exchange Listing: