Company Presentation December 2016
|
|
|
- Beryl Grant
- 5 years ago
- Views:
Transcription

1 Company Presentation December 2016
2 Market German Residential Safe Harbor and Low Risk German residential market: important pillar of the German economy With a GDP contribution of more than 430bn the German real estate industry represents almost 20% of Germany s GDP. Germany and its resilient economy provide a comparatively safe harbor for foreign investments. Germany is the economic powerhouse and growth engine of Europe. Due to its regulatory structure, the German residential rental market is largely immune to macroeconomic fluctuations and provides high cash flow visibility. Residential market provides superior returns especially in low interest rate environment. Germany: regulated market ensures sustainable rent growth % 6 USA: rent growth is highly volatile % E GDP growth Germany (%) Market rent growth Germany (%) -6 GDP growth USA (%) Rent growth USA (%) Source: Federal Statistics Office Sources: REIS, BofA Merrill Lynch Global Research BIP USA: IMF, Statista page 2
3 New constructions ( 000 units) Market German Residential Favorable Fundamentals Low home ownership ratio Germans prefer to rent Home ownership rate 2015 in % New supply falls short of demand 500 Romania Spain Poland Italy UK France Austria Germany Switzerland Ø Europe 71% Total required construction volume (incl refugees) Required construction volume (ex refugees) Actual run rate of new constructions is ca. 250k, of which less than 100k are in the affordable buildto-let category Fragmented ownership structure of ~23m rental units Amateur landlords 15.0 Professional, not listed 2.3 Government owned 2.3 Cooperatives 2.1 Growing number of smaller households (million) or more persons -29% 4 persons 3 persons -24% -24% Listed property companies Churches and other persons 1 person +12% +11% Sources: Federal Statistics Office, IW Köln; GdW (German Association of Professional Homeowners), Eurostat, GdW (German Association of Professional Homeowners). page 3


4 Company Vonovia at a Glance National footprint with ~338k apartments and 23.9bn gross asset value 338k apartments Average size of ~61 sqm Vacancy~2.5% 1 almost fully let 13.5 years average tenure > 1,500m 1 stable rental income ~ 760m 1 operating profit before sales (FFO 1) Dividend policy: approx. 70% of FFO 1 Location Schwarmstädte Munich * Karlsruhe Dortmund Based on recent forecast of Vonovia calculations. Valuation results are subject to change during the ongoing valuation process. 1 Guidance 2016 page 4

5 Company Management Team with Wide Range of Experience CFO Dr. A. Stefan Kirsten CEO Rolf Buch CCO Gerald Klinck COO Klaus Freiberg Since 2011 CFO of Vonovia Since 2013 CEO of Vonovia Board member since 2012 Board member since 2010 Former CEO of Majid Al Futtaiim Group LLC (real estate development company focusing mainly on retail and entertainment ventures in the Emirates) Former CFO of Metro AG and thyssenkrupp AG in Germany Former management board member of Bertelsmann SE Former CEO of Arvato AG (global BPO service provider with more than 60,000 employees in over 40 countries) Former CFO of GAGFAH Group 20+ years experience in leading positions in the real estate industry Responsible for the property management (customer care service, management and letting of portfolio) Former senior manager of Arvato Group; supervised and optimized the service centers of Deutsche Post and Deutsche Telekom Expert in pronounced customer orientation page 5
6 Shared- Services Central Local Company Scaleable Organization Asset Management Property Management ~ apartments 38 Business Units 6 Business Units 5 Business Units 4 Business Units 8 Business Units 7 Business Units 8 Business Units Local property management, letting, care-taking North East South-East South Central West 6 Regions Product Management New Construction & Modernization Acquisition & Sales Customer Service Residential Environment Service Technical Service Finance/ Tax Controlling / Valuation Legal/ HR IT Other Functions* *other Shared-Services areas: internal audit, communications, central procurement, insurances, investor relations, accounting as of September 30, 2016 page 6
7 VWAP (Euro/share) Average Market Cap. ( bn) Company Vonovia History Seed portfolios of today s Vonovia have origin in public housing provided by government, large employers and similar landlords with a view towards offering affordable housing. At beginning of last decade, private equity invested in German resi on a large scale including into what is Vonovia today (mainly Deutsche Annington and Gagfah then). IPO in Final exit of private equity in Share price and market capitalization S-DAX inclusion DeWAG & Vitus acq. (41k units) MDAX inclusion MSCI inclusion Stoxx 600 inclusion Gagfah acq. (140k units) Südewo acq. (20k units) DAX inclusion Q3 '13 Q4 '13 Q1 '14 Q2 '14 Q3 '14 Q4 '14 Q1 '15 Q2 '15 Q3 '15 Q4 '15 Q1 '16 Q2 '16 Q3 '16 Q4 to date Source: Factset, company data Average Market Cap. ( bn) page 7 VWAP (Euro/share)
8 Jul-13 Aug-13 Sep-13 Oct-13 Nov-13 Dec-13 Jan-14 Feb-14 Mar-14 Apr-14 May-14 Jun-14 Jul-14 Aug-14 Sep-14 Oct-14 Nov-14 Dec-14 Jan-15 Feb-15 Mar-15 Apr-15 May-15 Jun-15 Jul-15 Aug-15 Sep-15 Oct-15 Nov-15 Dec-15 Jan-16 Feb-16 Mar-16 Apr-16 May-16 Jun-16 Jul-16 Aug-16 Sep-16 Oct-16 Nov-16 Company Liquid Large-cap Stock Shareholder structure (as of November 4, 2016) Share information 8.3% 7.6% First day of trading July 11, 2013 Number of shares outstanding 466 million 75.6% 5.4% 3.1% Blackrock Norges Lansdowne Sun Life Other Free float based on Deutsche Börse definition ISIN Ticker symbol Share class Listing Market segment 92.4% DE000A1ML7J1 VNA Registered shares with no par value Frankfurt Stock Exchange Regulated Market, Prime Standard Major indices and weight (as of Sept 30, 2016) DAX Stoxx Europe 600 MSCI Germany GPR 250 FTSE EPRA/NAREIT Europe 1.8% 0.2% 1.6% 1.2% 7.7% VNA share price performance since IPO vs. DAX and EPRA Europe Index 230 Vonovia 210 DAX 190 FTSE EPRA/NAREIT Dev. Europe % + 30 % + 26 % 90 Source: Factset page 8
9 Innovative Traditional Proven Strategy Reputation & Customer Satisfaction 1 Property Management Systematic optimization of operating performance and core business productivity through leveraging scaling effects High degree of standardization and industrialization throughout the entire organization 2 Financing Ensure well-balanced financing mix and maturity profile with low financing costs, investment grade credit rating and adequate liquidity at all times 5 Mergers & Acquisitions 3 Portfolio Management Fast and unfettered access to equity and debt capital markets at all times Portfolio optimization by way of tactical acquisitions and non-core/non-strategic disposals to ensure exposure to strong local markets Pro-active development of the portfolio through investments to offer the right products in the right markets and on a long-term basis Continuous review of on- and off-market opportunities to lever economies of scale and apply strategic pillars 1-4 to a growing portfolio All acquisitions must meet the stringent acquisition criteria 4 Extension Expansion of core business to extend the value chain by offering additional services and products that are directly linked to our customers and/or the properties Insourcing of services to ensure maximum process management and cost control page 9
10 1 Property Management Property Management In-place rent ( /sqm) Vacancy rate (%) M '16 In-place rent ( /sqm), eop M '16 Adj. EBITDA Operations margin* 77.4% 60.0% 60.8% 79.6% 63.8% 82.2% 67.7% 84.8% 71.8% 87.7% IPO M 2016 EBITDA Operations Margin EBITDA Operations Margin (excl. Maintenance) * Please see Glossary / Sources in the Appendix for further information. page 10
11 Innovative Traditional Proven Strategy Reputation & Customer Satisfaction 1 Property Management Systematic optimization of operating performance and core business productivity through leveraging scaling effects High degree of standardization and industrialization throughout the entire organization 2 Financing Ensure well-balanced financing mix and maturity profile with low financing costs, investment grade credit rating and adequate liquidity at all times 5 Mergers & Acquisitions 3 Portfolio Management Fast and unfettered access to equity and debt capital markets at all times Portfolio optimization by way of tactical acquisitions and non-core/non-strategic disposals to ensure exposure to strong local markets Pro-active development of the portfolio through investments to offer the right products in the right markets and on a long-term basis Continuous review of on- and off-market opportunities to lever economies of scale and apply strategic pillars 1-4 to a growing portfolio All acquisitions must meet the stringent acquisition criteria 4 Extension Expansion of core business to extend the value chain by offering additional services and products that are directly linked to our customers and/or the properties Insourcing of services to ensure maximum process management and cost control page 11


12 2 Financing Well-balanced Debt Maturity Profile & Diverse Funding Mix Debt maturity profile ( m; as of November 3, 2016) 4,000 3,500 3,000 2,500 2,000 1,500 1, from 2027 Mortgages Structured Loans Bond Debt Hybrid Equity Hybrid CMBS GRF-2 CMBS Taurus CMBS included at contractual maturity X declining prepayment penalties facilitate prior refinancing Diverse funding mix (as of November 3, 2016) KPIs Stand alone Bonds incl. US$ Bonds 10% Subsidized Modernization Debt 1% Mortgages 8% Structured Loans 10% CMBS 12% EMTN Bonds 47% Equity Hybrid 7% Debt Hybrid 5% LTV Unencumbered assets * in % 56% Fixed/hedged debt ratio 99% Global ICR * (YTD) 3.6x Financing cost 2.3% Weighted avg. maturity ~ 42% pro forma YE2016 ~ 7 years Ongoing optimization with most economic funding * Please see Glossary / Sources in the Appendix for further information. page 12
13 Innovative Traditional Proven Strategy Reputation & Customer Satisfaction 1 Property Management Systematic optimization of operating performance and core business productivity through leveraging scaling effects High degree of standardization and industrialization throughout the entire organization 2 Financing Ensure well-balanced financing mix and maturity profile with low financing costs, investment grade credit rating and adequate liquidity at all times 5 Mergers & Acquisitions 3 Portfolio Management Fast and unfettered access to equity and debt capital markets at all times Portfolio optimization by way of tactical acquisitions and non-core/non-strategic disposals to ensure exposure to strong local markets Pro-active development of the portfolio through investments to offer the right products in the right markets and on a long-term basis Continuous review of on- and off-market opportunities to lever economies of scale and apply strategic pillars 1-4 to a growing portfolio All acquisitions must meet the stringent acquisition criteria 4 Extension Expansion of core business to extend the value chain by offering additional services and products that are directly linked to our customers and/or the properties Insourcing of services to ensure maximum process management and cost control page 13
14 3 Portfolio Management Pro-active Portfolio Management Modernization * Disposal * More than 1bn invested in value-enhancing modernization between 2013 and Sale of ~42k Non-core and Non-strategic assets ( ) with below-average quality, location and/or potential. Acquisition of more than 200k units (2013- Acquisition * 2016 ytd) in attractive regions and complementary to the existing portfolio. Pro-active portfolio management results in material improvements in quality of assets and locations. Well-positioned to benefit from strong underlying fundamentals of entire German residential market. Sep 30, 2016 (unless indicated otherwise) Residential Units In-place rent ( /sqm) Vacancy rate Fair value ( bn) Fair value (%) Fair value (%) at IPO in Operate 125, % % 37% Upgrade Buildings 102, % % 30% Optimize Apartments 73, % % 24% Subtotal Strategic Clusters 301, % % 91% Privatize 17, % % 6% Non-strategic 12, % 0.5 8% 2% Non-core 6, % 0.2 5% 1% Total 337, % % 100% * Please see Glossary / Sources in the Appendix for further information. 1 The cluster Non-strategic was introduced after the IPO. For comparison purposes, locations considered Non-strategic as of Sep 30, 2016, were defined as Non-strategic as of the IPO date as well. page 14
15 Yield* 3 Portfolio Management Growing Investment Program Modernization investments continue to be a valuable organic growth driver. Increasing investment volume ( m) 7.2% 7.4% ~7.6% ~7% ~7% Σ 1bn Σ 65 Σ Σ Σ Σ A 2014A 2015A 2016E 2017E Expect to initiate 1bn investment program for modernization and space creation in 2017, of which 700m- 730m are expected to be completed and accounted for within the 2017 financial year. Upgrade Buildings Optimize Apartments New initiatives and space creation page 15


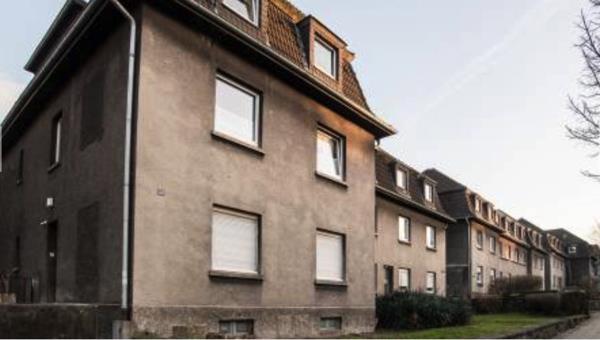
16 3 Portfolio Management Modernization - Impressions Addition of new floor plus modernization investment - Before Addition of new floor plus modernization investment - After Upgrade Building - Before Upgrade Building - After page 16


17 3 Portfolio Management Optimize Apartment- Impressions Optimize Apartment - Before Optimize Apartment - After page 17

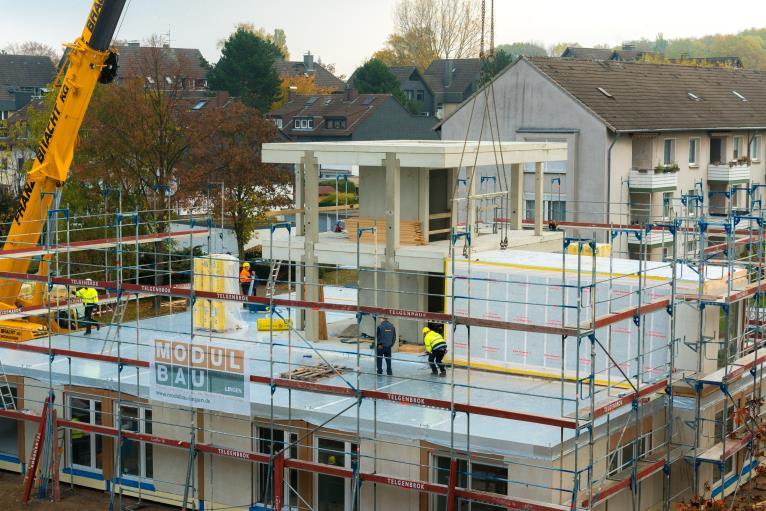
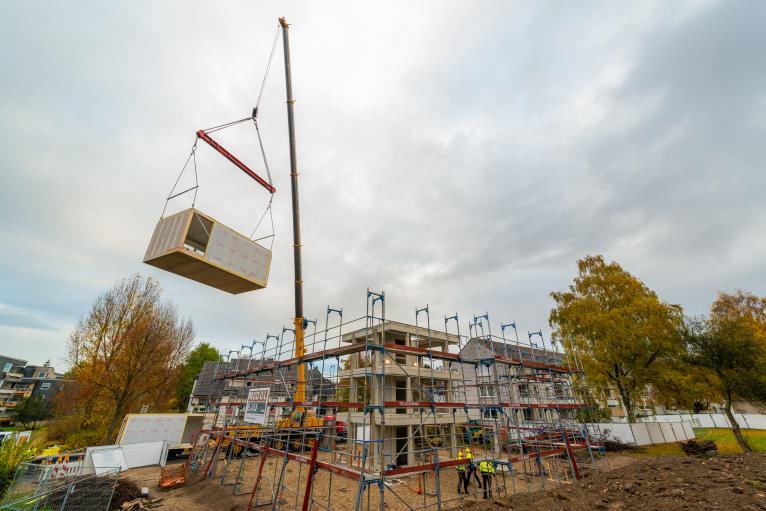

18 3 Portfolio Management Modular Construction- Impressions page 18


19 3 Portfolio Management Addition of new Floor- Impressions page 19
20 3 Portfolio Management Substantial Reduction of Portfolio Locations 03/2015 (incl. Südewo) 818 locations FC 12/ locations Strategic Portfolio ~400 locations Vonovia location Schwarmstädte page 20
21 3 Portfolio Management 15 Regional Markets Balanced Strategic Portfolio with high exposure and material footprint in strong Markets. Well positioned to benefit from a dynamic development across the country. Market data on future development shows attractive growth rates across all Markets. Regional Market Multiple Fair value Fair value (in-place ( m) ( /sqm) rent) Residential units Annualized inplace rent ( m) In-place rent ( /sqm) L-f-l rent growth (y-o-y) Re-letting rent growth (y-o-y) * Avg. rent growth forecast CBRE (5yrs) * Schwarmstadt? Berlin 2,716 1, , % 6.7% 3.1% yes 4.0 Rhineland (Cologne, Düsseldorf, Bonn) 2,515 1, , % 5.4% 2.6% yes 2.9 Rhine Main Area (Frankfurt, Darmstadt, Wiesbaden) Southern Ruhr Area (Dortmund, Essen, Bochum) Prognos ranking 2,303 1, , % 5.6% 3.4% yes 1.8 2, , % 6.1% 1.9% 5.0 Dresden 2, , % 7.1% 3.0% yes 2.0 Stuttgart 1,821 1, , % 0.1% 3.0% yes 2.2 Hamburg 1,468 1, , % 5.3% 3.2% yes 2.7 Munich 1,374 2, , % 5.9% 4.9% yes 1.5 Northern Ruhr Area (Duisburg, Gelsenkirchen) 1, , % 4.3% 1.7% 6.3 Hanover 912 1, , % 6.7% 2.2% yes 2.8 Kiel , % 7.0% 2.3% yes 5.1 Bremen , % 5.5% 2.8% 5.0 Westphalia (Münster, Osnabrück) , % 4.9% 2.4% yes 4.2 Freiburg 393 1, , % 3.2% 3.6% yes 3.1 Leipzig , % 1.0% 2.1% yes 4.2 Other Strategic Locations 1,771 1, , % 3.3% 2.7% Total 22,920 1, ,869 1, % 4.4% 2.8% Excluding non-core and non-strategic locations and including privatization assets in strategic locations. * Please see Glossary / Sources in the Appendix for further information. page 21
22 Innovative Traditional Proven Strategy Reputation & Customer Satisfaction 1 Property Management Systematic optimization of operating performance and core business productivity through leveraging scaling effects High degree of standardization and industrialization throughout the entire organization 2 Financing Ensure well-balanced financing mix and maturity profile with low financing costs, investment grade credit rating and adequate liquidity at all times 5 Mergers & Acquisitions 3 Portfolio Management Fast and unfettered access to equity and debt capital markets at all times Portfolio optimization by way of tactical acquisitions and non-core/non-strategic disposals to ensure exposure to strong local markets Pro-active development of the portfolio through investments to offer the right products in the right markets and on a long-term basis Continuous review of on- and off-market opportunities to lever economies of scale and apply strategic pillars 1-4 to a growing portfolio All acquisitions must meet the stringent acquisition criteria 4 Extension Expansion of core business to extend the value chain by offering additional services and products that are directly linked to our customers and/or the properties Insourcing of services to ensure maximum process management and cost control page 22


23 Extension Portfolio Management 4 Extension Extension - Innovation as Growth Driver Continuous flow of innovative projects that are all immediately linked to the apartment or customer/rental contract BUILDING APARTMENT SERVICES Condominium Mgmt. page 23
24 4 Extension Extension Increasing Organic Growth Extension business with increasing significance and compelling growth rates. Vonovia, through its subsidiaries, now employs ca. 3,600 craftsmen and gardeners. Subsidiary for Third-party and condo management * now with 22 local offices in Germany managing a total of 77k units. Multimedia service contracts * are expected to be rolled out to 270k units by the end of 2016 (+145% since year-end 2015). Adj. EBITDA Extension * ( m) >90 >55 >+60% 37.6 >+46% % * Please see Glossary / Sources in the Appendix for further information E 2017E page 24
25 Innovative Traditional Proven Strategy Reputation & Customer Satisfaction 1 Property Management Systematic optimization of operating performance and core business productivity through leveraging scaling effects High degree of standardization and industrialization throughout the entire organization 2 Financing Ensure well-balanced financing mix and maturity profile with low financing costs, investment grade credit rating and adequate liquidity at all times 5 Mergers & Acquisitions 3 Portfolio Management Fast and unfettered access to equity and debt capital markets at all times Portfolio optimization by way of tactical acquisitions and non-core/non-strategic disposals to ensure exposure to strong local markets Pro-active development of the portfolio through investments to offer the right products in the right markets and on a long-term basis Continuous review of on- and off-market opportunities to lever economies of scale and apply strategic pillars 1-4 to a growing portfolio All acquisitions must meet the stringent acquisition criteria 4 Extension Expansion of core business to extend the value chain by offering additional services and products that are directly linked to our customers and/or the properties Insourcing of services to ensure maximum process management and cost control page 25
26 5 Acquisition Acquisition Track record (Total number of units) 182k 175k 203k Franconia (5k) Dewag (11k) 375k Südewo (20k) Gagfah (140k) 362k Conwert (~24k) 1 Vitus (30k) E 1 Expected, not closed yet Vonovia: Substantially larger scale compared to the peer group Number of units (k) Cost per Unit ( )* 343 ~ Vonovia Peer A Peer B Peer C Vonovia Peer A Peer B Peer C * Please see Glossary / Sources in the Appendix for further information. 1 Estimate for On the basis of the published results for FY 2015 page 26
27 Attractive Dividend Policy Sustainable and growing Cash Flow with attractive pay out-ratio ~1.80 ~ % of FFO (E) 2017(E) FFO 1 per share* Dividend per share *Please see Glossary / Sources in the Appendix for further information. page 27
28 Guidance for 2016 and 2017 (effects from potential conwert takeover not yet taken into account) Actuals Guidance 2017 Guidance L-f-l rental growth (eop) 2.9% % 3.5%-3.7% Rent growth expected to continue to accelerate Vacancy (eop) 2.7% ~2.5% <2.5% Rental Income ( m) 1,415 1,530-1,550 1,530-1,550 Stable top line on smaller portfolio FFO1 ( m) 608 ~ FFO1/share * (eop NOSH) 1.30 ~ Double-digit organic growth (mid-point) EPRA NAV/share * (eop) ~ * Adj. EPRA NAV/share * (eop) ~ Maintenance ( m) 331 ~340 ~340 Modernization ( m) Including valuation impact from improved performance and investments (~4% NAV growth); excluding any assumptions for yield compression. Every 1% value uplift from yield compression results in ~ 0.60 NAV growth per share. Privatization (#) 2,979 ~2,500 ~2,300 FMV step-up (Privatization) 30.5% >35% ~35% Non-core (#) 12,195 Up to 24,000 continuously opportunistic opportunistic FMV step-up (Non-Core) 9.2% ~5% >0% Expect to initiate 1bn investment program for modernization and space creation in 2017, of which 700m- 730m are expected to be completed and accounted for within the 2017 financial year. Dividend/share % of FFO 1 * Please see Glossary / Sources in the Appendix for further information. page 28
29 Summary Only residential company in German Blue Chip Index DAX; ca. 15bn market cap. Liquid stock with 92% free float and ca. 40m daily turnover on Xetra. Proven track record of sustainable and growing free cash flow from operations ( FFO ) and dividends. Industrialized approach leverages economies of scale in a highly homogeneous asset class. Strong internal growth profile via sustainable market rent growth, additional rent growth from portfolio investments and dynamic extension business. Market leadership with nationwide footprint offers additional growth opportunities. Predictable top and bottom line with downside protection and upside potential. page 29
30 IR Contact & Financial Calendar Contact Rene Hoffmann Head of Investor Relations Vonovia SE Philippstr Bochum Germany rene.hoffmann@vonovia.de Financial Calendar 2017 January 9-11 Commerzbank German Investment Seminar, NYC January 11 JPM European Real Estate CEO Conference, London January 16 16th Kepler Cheuvreux German Corporate Conf., Frankfurt February 6-10 Management Roadshow, Asia March 7 FY 2016 results May 9 1 Interim results 3M 2017 May 9 Estimated record day for dividend entitlement May 16 Annual General Meeting May 17 Estimated dividend payment date August 2 1 Interim results 6M 2017 November 8 1 Interim results 9M 2017 Vonovia Investor Relations Tablet App Now available for ios and Android 1 Dates are indicative and subject to change depending on conwert integration page 30
31 Appendix page 31
32 Highlights 9M 2016 Operating business running smoothly with strong momentum In-place rent of 5.94 per sqm per month (+4.4% y-o-y). L-f-l rent growth of 2.8% y-o-y. Adj. EBITDA Operations * of 832.3m or 2,394 per average unit * (+8.4% y-o-y). FFO 1 of 571.6m or 1.23 per share * (up 29.8% y-o-y on an eop per-share basis). Currently ongoing valuation work indicates strong uplift 1 ; growth potential across strategic portfolio Annual valuation work underway indicates a valuation uplift between 3.5bn and 3.9bn (+15% to 17%) on the back of better performance, investments and yield compression. Break-down of Strategic Portfolio into 15 Markets and benchmarking against external sources shows growth potential across strategic portfolio. Portfolio management strategy confirmed with regards to investments, acquisitions and disposals. 1 Recent forecast of Vonovia calculations. The value is subject to change during the ongoing valuation process. * Please see Glossary / Sources in the Appendix for further information. page 32
33 Highlights 9M guidance confirmed at upper end of range; increase of proposed dividend FFO 1 now expected at higher end of the range with ~ 760m or ~ 1.63 per share *. Dividend of 1.12 per share (19.1% increase y-o-y) intended to be proposed to the 2017 Annual General Meeting; dividend proposal not dependent on acceptance level of tender offer for conwert shares. New shares from conwert offer fully eligible for dividends. EPRA NAV per share * of ~ 36 and adj. EPRA NAV per share * of ~ 30 expected for year-end Confident 2017 guidance (effects from potential conwert takeover not yet taken into account) L-f-l rent growth expected to accelerate to 3.5%-3.7%. Expected double-digit organic FFO 1 growth to 830m to 850m or per share *. Expect to initiate 1bn investment program for modernization and space creation in 2017, of which 700m- 730m are expected to be completed and accounted for within the 2017 financial year. EPRA NAV per share* expected to grow to based on increased performance and higher investments. Does not include any assumptions for yield compression. * Please see Glossary / Sources in the Appendix for further information. page 33
34 Strong Development of KPIs Higher overall inplace rent growth as a result of successful action-driven portfolio management and acquisitions +8.4% per avg. unit * ( 2,394 vs. 2,208) +18.3% per avg. unit * ( 1,644 vs. 1,390) 9M M 2015 Delta In-place rent (eop) /month/sqm % In-place rent l-f-l (eop) /month/sqm % Vacancy rate (eop) % bps Rental income m 1, , % Cost per average unit * % Adj. EBITDA Operations * m % Rental * m % Extension * m % Other (i.e. consolidation) m n/a FFO 1 m % FFO 1 per share * (eop NOSH) % FFO 1 per share * (avg. NOSH) % AFFO * m % Adj. EBITDA Sales * m % Adj. EBITDA (Total) m % FFO 2 m % +11.6% per sqm ( 1,095 vs. 981) Sep. 30, 2016 Dec. 31, 2015 Delta Fair value of real estate portfolio m 23, , % EPRA NAV * /share % Adj. EPRA NAV * /share % LTV % 47.1% 46.9% +20bps Dividend paid m m * Please see Glossary / Sources in the Appendix for further information. page 34
35 1 Property Management Growing Adj. EBITDA and EBITDA Operations Margin * Adj. EBITDA Operations margin of 71.8% in 9M 2016, up from 68.6% in 9M Expensed vs. capitalized maintenance varies between companies and is a major discretionary swing factor in the EBITDA margin, which is why Vonovia reports Adj. EBITDA margins incl. and excl. maintenance. Excluding expensed maintenance and including operating costs and corporate SG&A the margin was 87.7% after 85.1% in 9M Adj. EBITDA Operations margin * m 9M M 2015 Delta 77.4% 60.0% 60.8% 79.6% 63.8% 82.2% 67.7% 84.8% 71.8% 87.7% Rental income 1, , % Maintenance expenses % Operating expenses % Adj. EBITDA Rental * Income % of which external >100% of which internal % Operating expenses % Adj. EBITDA Extension * % IPO M 2016 EBITDA Operations Margin EBITDA Operations Margin (excl. Maintenance) Adj. EBITDA Other >100% Adj. EBITDA Operations * % * Please see Glossary / Sources in the Appendix for further information. page 35
36 1 Property Management Maintenance and Modernization Stable maintenance expenses on a per sqm basis y-o-y. The maintenance capitalization ratio * is not an input factor but an outcome; i.e. what type of work is expensed vs. capitalized is determined on the basis of a pre-defined SAP-based catalogue agreed with the auditors. m 9M M 2015 Delta /sqm 9M M 2015 Delta Expenses for maintenance % Expenses for maintenance % Capitalized maintenance % Capitalized maintenance % Total % Maintenance capitalization ratio * 21% 33% Total % Maintenance capitalization ratio * 21% 33% Investments (modernization, new initiatives, space creation) % * Please see Glossary / Sources in the Appendix for further information. page 36
37 2 Financing Substantial LTV Reduction Expected for YE 2016 m (unless indicated otherwise) Sep. 30, 2016 Dec. 31, 2015 Delta Non-derivative financial liabilities 13, , % Foreign exchange rate effects % Cash and cash equivalents -1, , % Net debt 11, , % Sales receivables % Additional loan amount for outstanding acquisitions Adj. net debt 11, , % Fair value of real estate portfolio 23, , % Fair value of outstanding acquisitions Shares in other real estate companies >100% Adj. fair value of real estate portfolio 24, , % LTV 47.1% 46.9% +20bps Pro forma LTV * as of Dec. 31, 2016 Net debt ( bn) 11.6 Adj. fair value of real estate portfolio 1 ( bn) 27.6 LTV ~42% 1 Assuming mid-point of current valuation uplift expectation for year-end. * Please see Glossary / Sources in the Appendix for further information. page 37
38 Final Guidance for actuals Initial Guidance for 2016 (in Nov. 15) Updated Guidance for 2016 (in Aug. 16) Final Guidance for 2016 L-f-l rental growth (eop) 2.9% % % % Vacancy (eop) 2.7% ~3% ~2.5% ~2.5% Rental Income ( m) 1,415 1,500-1,520 1,530-1,550 1,530-1,550 FFO1 ( m) ~760 FFO1/share * (eop NOSH) ~ 1.63 Upper end of the guidance range; ~25% per-share growth y-o-y EPRA NAV/share * (eop) ~ 36 Adj. EPRA NAV/share * (eop) ~ 30 Maintenance ( m) 331 ~330 ~340 ~340 Modernization ( m) Final 2016 guidance includes current expectations for yearend portfolio valuation uplift (mid-point) Privatization (#) 2,979 ~2,400 ~2,400 ~2,500 FMV step-up (Privatization) 30.5% ~30% >35% >35% Non-core (#) 12,195 opportunistic opportunistic Up to 24,000 continuously opportunistic FMV step-up (Non-Core) 9.2% ~0% ~5% ~5% Dividend/share 0.94 ~70% of FFO Excluding assumptions for year-end valuation gains. 2 Intended to be proposed to the 2017 Annual General Meeting. * Please see Glossary / Sources in the Appendix for further information. page 38 19% increase y-o-y; not subject to acceptance level in conwert tender
39 Reconciliation of 2016 Dividend Dividend of 1.12 per share (19.1% increase y-o-y) intended to be proposed to the 2017 Annual General Meeting; dividend proposal not dependent on acceptance level of tender offer for conwert shares. New shares from conwert offer fully eligible for dividends. This proposal is irrespective of the conwert tender offer result, as we would pass the conwert dividend amount we would receive on to Vonovia shareholders. Dividend Reconciliation In case of 0% acceptance ratio In case of 75% acceptance ratio Vonovia FFO 1 Guidance ( m) conwert dividend ( m) 0 34 New shares (m) m FFO(E) for 2016 *60% payout ratio *75% acceptance ratio = 34m New total shares (m) FFO 1 ( /share)* Payout ratio 69% 70% DPS ( ) Dividend payout ( m) m*70% = 532m + conwert dividend 34m = 566m dividend amount 566m/504m shares = 1,12 * Please see Glossary / Sources in the Appendix for further information. page 39
40 3 Portfolio Management Adj. EBITDA Sales * Privatization volume slightly higher y-o-y partly as a result of privatization sales in the context of portfolio transactions; excluding this impact the margin for the first nine months 2016 was 38.5%. Increased non-core and non-strategic sales largely driven by three larger portfolio transactions with an aggregate volume of ca. 17k units. m (unless indicated otherwise) 9M M M M M M 2015 Privatization Non-core/Non-strategic Total No. of units sold 2,150 1,748 19,772 3,574 21,922 5,322 Income from disposal Fair value of disposal * Adj. profit from disposal Fair value step-up * (%) % 37.1% 3.9% 1.6% Selling costs Adj. EBITDA Sales * * Please see Glossary / Sources in the Appendix for further information. page 40
41 3 Portfolio Management Successful Sales Programs Privatization Y-o-y growth of per sqm sales prices 2015 vs. 2014: +3.6% Non-core & Non-strategic Reduced Non-core and Non-strategic volume by more than half in nine months ytd vs. 2015: +22.2% Privatization sales of prior years have left the location mix of the privatization cluster unchanged. Location mix of Privatization cluster Non-core and Non-strategic disposal pipeline ( 000 units) C locations 34% 36% 34% 34% B locations 23% 23% 24% 24% A locations 42% 41% 42% 42% Dec 2013 Dec 2014 Dec 2015 Sep 2016 Excluding D locations, which represent less than 1% of Privatization cluster. Locations A-D based on internal ranking of privatization locations with A being the best locations. Dec 31, 2015 Sales Additions and Reclassifications Sep 30, 2016 Signed 2017ff. sales include ca. 3.8k units with sales restrictions in place. Reserved Pipeline 2017 ff. sales page 41

42 3 Portfolio Management The Portfolio Is on a Positive Trajectory Continuous improvement of portfolio quality and exposure to attractive markets through acquisitions and sales. Increased portfolio size has resulted in lower risk profile. Benchmark against independent research confirms that our strategic portfolio is in the right locations and has longterm growth potential. empirica: Growing Metropolitan Areas ( Schwarmstädte 1 ) and Prognos: Future Atlas Ranking 2 of all 402 German cities and counties Total Return Matrix 1 The word Schwarmstadt is a combination of the German words for flock and city, trying to capture the migration movement of large parts of the (especially younger) generations into certain cities. Please see page 49 for more details. 2 Please see page 50 for more details. Note: Strategic Portfolio includes privatization assets in strategic locations. The chart does not account for asset quality or micro location; the chart is a zoomed view of the full Total Return Matrix. page 42
 Uplift FV ( m) 750 950 Investments 450 470 Yield compression 2,300 2,500 Total 3,500-3,900 Expected increase in value Up to 5% Up to 10% Up to 15% More than 15% Schwarmstadt FV expectation m 50")
 Considerable yield compression also in secondary locations (e.g. Dresden, Darmstadt, Heidenheim) Based on recent forecast of Vonovia calculations.")
43 3 Portfolio Management Broad Geographic Basis for Expected Valuation Uplift Geographic Breakdown of Expected Valuation Uplift Value driver Performance (rent development, redemption of rent control, etc.) Uplift FV ( m) Investments Yield compression 2,300 2,500 Total 3,500-3,900 Expected increase in value Up to 5% Up to 10% Up to 15% More than 15% Schwarmstadt FV expectation m 50 m 100 m 500 m 1,000 m 3,000 Significant increase in Vonovia s rents and development of market rents / new leases. Effect of yield compression higher than in 2015: High additional uplift in prime locations (e.g. Hamburg, Munich, Stuttgart) Considerable yield compression also in secondary locations (e.g. Dresden, Darmstadt, Heidenheim) Based on recent forecast of Vonovia calculations. Valuation results are subject to change during the ongoing valuation process. page 43
44 3 Portfolio Management 3 Angles to Look on the Portfolio 1 Geographic Federal states Markets Individual cities 2 Action-driven portfolio clustering Operate Upgrade Buildings Optimize Apartments Privatization Non-strategic Non-core 3 Operating platform 6 Regions 38 Business Units page 44
45 3 Portfolio Management Enhanced Transparency on Portfolio Structure Given its numerous larger and mid-sized urban areas and its heterogeneous local markets, Germany is quite different from countries such as France or the UK where the capital city tends to overshadow the rest. The relevance of the catchment area and the appeal that a striving urban area has on its vicinity can be better assessed if the focus is shifted away from federal states and the data for individual cities. State Saxony Dresden Chemnitz NRW Cologne Gelsenkirchen Lower Saxony Hanover Salzgitter City Berlin Potsdam Essen Bochum Dortmund Munich locations connected via local train We have prepared a supplemental reporting structure for our strategic portfolio 1 that cuts the portfolio into 15 Markets, each of which represents a homogeneous area with similar characteristics and future development potential, geographic proximity, commuter relations, etc.; benchmarks the Markets against external sources (empirica on Growing Metropolitan Areas ( Schwarmstädte ) and Prognos Future Atlas ranking) to systematically measure their relative attractiveness; is primarily forward-looking; supplements our action-driven portfolio clustering and confirms our portfolio management strategy. 1 Excluding non-core and non-strategic locations and including privatization assets in strategic locations page 45
46 3 Portfolio Management Exposure to Attractive Regional Markets has Grown The strategy of portfolio investments, disposals of weaker markets and acquisitions in stronger markets has resulted in a substantially more attractive portfolio due to higher-quality assets and locations. Portfolio share in Schwarmstädte 1 Portfolio share in above-average Prognos locations 2 70% 60% 54% 65% 68% 70% 60% 53% 61% 71% 50% 50% Avg. Germany 40% 40% 30% Avg. Germany 30% 20% Annington IPO Annington Portfolio Q3 '16 Vonovia Portfolio Q3 '16 20% Annington IPO Annington Portfolio Q3 '16 Vonovia Portfolio Q3 '16 1 If more than 50% of the fair value of a regional market is in a Schwarmstadt, all of the fair value of that regional market is counted towards the Schwarmstadt; if less than 50% of the fair value of a regional market is in a Schwarmstadt, none of the fair value of that regional market is counted towards the Schwarmstadt 2 Above average = ranking 1-4 Portfolio weighting based on fair value; average for Germany based on number of units page 46
47 5 Acquisition Acquisitions Opportunistic but Disciplined Acquisition pipeline ( 000 units) excl. Gagfah Examined* Analyzed in more detail* Due Diligence, partly ongoing* Bids* Signed* 9M M M Subject to successful tender offer to shareholders of conwert Immobilien SE. * Please see Glossary / Sources in the Appendix for further information. page 47
48 2 Financing Bonds / Rating Corporate Investment grade rating as of Rating agency Rating Outlook Last Update Standard & Poor s BBB+ Stable 06 September 2016 Bond ratings as of years 3.125% Bond 002 (EUR-Bond) ISIN Amount Issue price Coupon Final Maturity Date 4 years 3.200% 3.200% US25155FAA49 USD 750m % 2 Oct 2017 BBB+ Bond 003 (USD-Bond) (2.970%)* 10 years 5.000% 5.000% US25155FAB22 USD 250m % 2 Oct 2023 BBB+ Bond 004 (USD-Bond) (4.580%)* 8 years 3.625% Bond 005 (EMTN) 60 years 4.625% Bond 006 (Hybrid) 8 years 2.125% Bond 007 (EMTN) perpetual 4% Bond 008 (Hybrid) 5 years 0.875% Bond 009A (EMTN) 10 years 1.500% Bond 009B (EMTN) 2 years 0.950%+3M EURIBOR Bond 010A (EMTN) 5 years 1.625% Bond 010B (EMTN) 8 years 2.250% Bond 010C (EMTN) 6 years 0.875% Bond 011A (EMTN) 10 years 1.500% Bond 011B (EMTN) 2 years 0.380%+3M EURIBOR Bond 012 (EMTN) * EUR-equivalent re-offer yield Rating DE000A1HNW52 600m % 3.125% 25 July 2019 BBB+ DE000A1HRVD5 500m % 3.625% 8 Oct 2021 BBB+ XS m % 4.625% 8 Apr 2074 BBB- DE000A1ZLUN1 500m % 2.125% 9 July 2022 BBB+ XS ,000m % 4.000% perpetual BBB- DE000A1ZY m % 0.875% 30 Mar 2020 BBB+ DE000A1ZY m % % 31 Mar 2025 BBB+ DE000A18V m % 0.950%+3M EURIBOR (0.835% hedged) 15 Dec 2017 BBB+ DE000A18V138 1,250m % 1.625% 15 Dec 2020 BBB+ DE000A18V146 1,000m % % 15 Dec 2023 BBB+ DE000A182VS4 500m % 0.875% 10 Jun 2022 BBB+ DE000A182VT2 500m % % 10 Jun 2026 BBB+ DE000A185WC9 500m % 0.380%+3M EURIBOR (0.140% hedged) 13 Sep 2018 BBB+ page 48
49 Apr 2014 Hybrid Dec 2014 Hybrid EMTN 2013 Yankee Eurobond 2013 EMTN 2014 EMTN Mar 2015 EMTN Dec 2015 EMTN Jun 2016 EMTN Sep Financing Financing Economies of Scale in EMTN Issuance Costs We have managed to establish ourselves as a first class frequent issuer on the capital markets since our IPO. The most recent September 2016 issuance was structured as a private bond. 6 of our bonds so far have been purchased by the ECB through its Corporate Sector Purchase Program. Cost per 100m * m Cost per 100m * Apr 2014 Hybrid 1.21 Dec 2014 Hybrid 1.00 EMTN Yankee 0.78 Eurobond EMTN EMTN Mar EMTN Dec EMTN Jun EMTN Sep 2016 (private placement) 0.14 Excluding contingency; including some cost estimates for the most recent transactions as not all bills have been fully settled yet. * Please see Glossary / Sources in the Appendix for further information. page 49
50 2 Financing Bond and Rating KPIs - as per September 30, 2016 Bond KPIs Covenants * Level Actual LTV Total Debt / Total Assets Secured LTV Secured Debt / Total Assets ICR Last 12 months EBITDA / Last 12 months Interest Expense Unencumbered Assets Unencumbered Assets / Unsecured Debt <60% 45% <45% 15% >1.80x 3.54x >125% 215% Rating KPIs Covenant Level (BBB+) Debt to Capital Total Debt / Total Equity + Total Debt ICR Last 12 months EBITDA / LTM Interest Expense <60% >1.80x * Please see Glossary / Sources in the Appendix for further information page 50
51 2 Financing Development of Unencumberance Ratio Unencumberance ratio dropped from 49.6% pre GAGFAH down to 32.1% including GAGFAH in S&P provided 18 months (i.e. 30 September 2016) to reach an unencumberance ratio of > 50%. Upon GRF-1 prepayment in August 2016, the unencumberance ratio increased to 56%. Development of unencumberance ratio Prepayment of GRF-1 CMBS Unencumberance ratio upon GAGFAH takeover 32% Prepayment of 8 secured loans with a volume of 1.8bn 44% 56% Jun 2015 Jun 2016 Sep 2016 page 51
52 2 Financing CMBS - Overview as of September 30, 2016 Name Amount Coupon Maturity Date German Residential Funding Limited ( GRF-2 ) 603 m 2.78% 27 Nov 2018 Taurus 2013 (GMF1) PLC ( WOBA ) 1,024 m 2.38% 21 May 2018 Expected prepayment fees for early CMBS redemption ( m) IPD GRF-2 WOBA Nov Feb May Aug Nov Feb May Aug na Nov na Hedge break costs not considered. Values may differ in case of deviation from sales plan. page 52
53 3 Portfolio Management Schwarmstädte While the actual demographic development has not deviated materially from past projections, the regional distribution of the population is seeing a comprehensive shift as especially the younger generation moves into more urban settings. This results in a certain number of growing metropolitan areas ( Schwarmstädte 1 ) and large parts of the country that see a substantial outflow of their population. empirica has identified 30 Schwarmstädte across Germany that are the beneficiaries of the regrouping of the German population. Comparing 2008 and 2013 demographic data across all 402 cities and counties in Germany shows material population declines in large parts of the country at the expense of a few growing locations to which parts of the population have migrated. Among the reasons for the geographic shift of the population are Germany s declining birth-rate results in lower density of similarly-aged persons, which in turn narrows the options for these age groups as points of interest disappear due to lack of demand. Increasing economic and social appeal of urban settings vs. rural areas. These trends are enforced by Increasing unattractiveness of places of origin as more people move out and growing attractiveness of Schwarmstädte as more people move in. Increasing number of households in urban areas as a result of more single households, longer life expectancy etc. Schwarmstädte Demographic development Total population Age group 20 to 34 Frankfurt/M. 7.8% 11.3% Leipzig 7.6% 14.6% Munich 7.1% 11.7% Offenbach 7.0% 15.0% Freiburg 6.7% 10.3% Dresden 6.1% 6.6% Darmstadt 5.7% 16.3% Landshut 5.6% 11.8% Münster 5.4% 8.9% Regensburg 5.2% 11.8% Berlin 5.0% 11.1% Karlsruhe 4.9% 15.1% Stuttgart 4.4% 9.1% Heidelberg 4.3% 6.7% Cologne 4.2% 8.6% Augsburg 3.9% 11.2% Bonn 3.7% 10.2% Kiel 3.5% 10.8% Mainz 3.4% 6.1% Braunschweig 3.3% 12.4% Jena 3.2% 3.2% Nuremberg 3.2% 8.9% Hamburg 3.2% 4.5% Düsseldorf 3.0% 8.4% Mannheim 2.9% 12.4% Erlangen 2.4% 8.8% Rostock 2.4% 4.5% Koblenz 2.3% 13.7% Trier 1.9% 6.9% Halle 0.8% 5.1% Germany 0.3% 3.4% Schwarmstädte with stronger growth of young generation and stronger overall population growth 1 The word Schwarmstadt is a combination of the German words for flock and city, trying to capture the migration movement of large parts of the (especially younger) generations into certain cities page 53
54 3 Portfolio Management Prognos Methodology Prognos is an independent research institute that benchmarks all 402 cities and counties in Germany ( Prognos Future Atlas Ranking ). Cities and counties are ranked across 8 categories ranging from 1 ( excellent potential ) to 8 ( extreme future risks ). Analysis comprises 29 socioeconomic indicators across four categories Demographics Labor market Innovation Prosperity The analysis looks at both the current strength and the dynamic development, allowing an assessment of the positive/negative momentum. The first Prognos ranking was published in 2004; updates have been made in 2007, 2010, 2013 and most recently in page 54
55 FFO per Share * Up 29.8% y-o-y The 19% Adj. EBITDA Operations * growth combined with reduced financing expenses and continuously low current income taxes translate into an absolute FFO growth of 29.8% on a per-share * basis. Prior-year current income taxes of 15.8m are now broken down between Operations and Sales. m (unless indicated otherwise) 9M M 2015 Delta Adj. EBITDA Operations * % FFO interest expense % Current income tax (Operations) % FFO % of which attributable to Vonovia s shareholders % of which attributable to Vonovia s hybrid capital investors % of which attributable to non-controlling interests % Capitalized maintenance % AFFO * % Current income tax (Sales) >100% Adjusted EBITDA Sales * % FFO % FFO 1 / share * (eop NOSH) % FFO 1 / share * (avg. NOSH) % AFFO / share * (eop NOSH) % AFFO / share * (avg. NOSH) % * Please see Glossary / Sources in the Appendix for further information. page 55
56 EPRA NAV * Impacted by Dividend Payout Accounting for 0.94 dividend ( 438m) paid in May 2016 the EPRA NAV is stable. Portfolio valuation will be accounted for in the Q4/FY 2016 results. m (unless indicated otherwise) Sep. 30, 2016 Dec. 31, 2015 Delta Equity attributable to Vonovia's shareholders 10, , % Deferred taxes on investment properties and assets held for sale 3, , % Fair value of derivative financial instruments % Deferred taxes on derivative financial instruments % EPRA NAV * 13, , % Goodwill -2, , % Adj. EPRA NAV * 11, , % EPRA NAV /share * % Adj. EPRA NAV /share * % 1 Adjusted for effects from cross currency swaps * Please see Glossary / Sources in the Appendix for further information. page 56
57 Reconciliation IFRS Profit to FFO m (unless indicated otherwise) 9M M 2015 Delta 0 PROFIT FOR THE PERIOD % Financial result % Income taxes % EBITDA increase mainly driven by rental business Depreciation >100% Income from fair value adjustments of investment properties = EBITDA IFRS % Non-recurring items % Total period adjustments from assets held for sale >100% Income from invetsments in other real estate companies >100% = ADJUSTED EBITDA % Adjusted EBITDA Sales * % Adjusted EBITDA Other >100% Adjusted EBITDA Extension * % = ADJUSTED EBITDA RENTAL * % Adjusted EBITDA Extension * % Adjusted EBITDA Other >100% Interest expense FFO % Increase of adjusted EBITDA Sales * mainly due to higher Non-core sales volume, higher Non-core step-ups Increase of adjusted EBITDA Extension * (+85%) reflects expansion strategy to the extent it is not accounted for under rental business Current income taxes FFO % = FFO % Capitalised maintenance % = AFFO % Current income taxes Sales >100% FFO 2 (FFO 1 incl. Adjusted EBITDA Sales * /current income taxes Sales) % FFO 1 per share in (eop NOSH) * % AFFO per share in (eop NOSH) * % Adjusted EBITDA Rental * reflects operational performance as well as acquisitions Number of shares (million) Note: 9M 2016 includes 9 months of GAGFAH and SÜDEWO contributions, while 9M 2015 only includes 7 months of GAGFAH, 6 months of Franconia and 3 months of SÜDEWO contributions * Please see Glossary / Sources in the Appendix for further information. page 57
FY2016 Earnings Call March 7, 2017 Rolf Buch, CEO Dr. A. Stefan Kirsten, CFO
 March 7, 2017 Rolf Buch, CEO Dr. A. Stefan Kirsten, CFO Highlights FFO Growth 2016 FFO1 per share * up 25.1%, driven by internal growth. 10% organic FFO1 growth guided for 2017 (i.e. excluding conwert).
Company Presentation Non-deal Asia Roadshow February 7-10, 2017
 Company Presentation Non-deal Asia Roadshow February 7-10, 2017 Market Company Strategy & Execution page 2 2006 2007 2008 2009 2010 2011 2012 2013 2014 2015 2016 2006 2007 2008 2009 2010 2011 2012 2013
13 th Kepler Cheuvreux German Corporate Conference Frankfurt, 22 January 2014 Rolf Buch, CEO
 1 Syndicate Analyst Presentation May 2013 13 th Kepler Cheuvreux German Corporate Conference Frankfurt, 22 January 2014 Rolf Buch, CEO Deutsche Annington: Innovation leader based on a long-term vision,
Vonovia Company Presentation. Vonovia Company Presentation October 18, 2017
 . Agenda 1 Who we are. Page 2 Vonovia. Germanys Leading Residential Real Estate Company. Management of 353,000 apartments in our possession. 1 million tenants nationwide. 13.5 years average tenure. Average
Q Results. Conference Call Dusseldorf, 30 April Rolf Buch, CEO Dr. A. Stefan Kirsten, CFO
 Deutsche Annington Immobilien SE Q1 2014 Results Conference Call Dusseldorf, 30 April 2014 Rolf Buch, CEO Dr. A. Stefan Kirsten, CFO Deutsche Annington Immobilien SE 30.04.2014 Presenting today Rolf Buch
Conference call presentation Q
 Conference call presentation Q1 2018 2018 Content 2 I. TAG highlights Q1 2018 II. TAG financials Q1 2018 III. TAG portfolio Q1 2018 IV. TAG outlook FY 2018 V. Appendix 3 5 12 16 19 Portfolio details, vacancy
Interim Financial Report Vonovia SE
 Interim Financial Report Vonovia SE for the first quarter of 2016 Key Figures in million Key Financial Figures 3M 2016 3M 2015 Change in % Rental income 392.0 263.6 48.7 Adjusted EBITDA Rental 269.0 177.1
9M 2013 Results. November 6, 2013
 Deutsche Annington Immobilien SE 9M 2013 Results November 6, 2013 Deutsche Annington Immobilien SE 06.11.2013 Disclaimer Confidentiality Declaration This presentation has been specifically prepared by
Deutsche Wohnen SE.» 9M 2017 results. Conference Call, 14 November 2017
 Deutsche Wohnen SE» 9M 2017 results Conference Call, 14 November 2017 1 » Agenda 1 Highlights 9M 2017 2 Portfolio 3 Financials 4 Appendix 2 » Highlights 9M 2017 Strong operating business L-f-l rental growth
Company Presentation. January 2018
 Company Presentation January 2018 Disclaimer This document is for informational purposes only. This document is not intended to form the basis of any investment decision and should not be considered as
9M 2018 RESULTS 09 NOVEMBER 2018 TLG IMMOBILIEN AG 9M 2018 RESULTS
 TLG IMMOBILIEN AG 9M 208 RESULTS DISCLAIMER This presentation includes statements, estimates, opinions and projections with respect to anticipated future performance of TLG IMMOBILIEN ("Forward-Looking
Interim Financial Report Vonovia SE
 Interim Financial Report Vonovia SE for the first half-year of 2016 Key Figures in million Key Financial Figures H1 2016 H1 2015 Change in % Rental income 774.7 628.0 23.4 Adjusted EBITDA Rental 535.6
CORESTATE Capital Group
 CORESTATE Capital Group Q3 2017 Earnings Presentation November 2017 Disclaimer This presentation contains forward-looking statements that involve a number of risks and uncertainties. Such statements are
LEG Immobilien AG H1 Results 2015
 LEG Immobilien AG H1 Results 2015 14 th August 2015 Disclaimer While the company has taken all reasonable care to ensure that the facts stated in this presentation are accurate and that the opinions contained
Trends in the Secondary Markets
 Trends in the Secondary Markets The Hidden Champions The Secondary Markets 1 1 Due to the high demand pressure and associated price rises in established office markets, smaller markets are becoming more
INTERIM FINANCIAL REPORT. First Quarter of 2014
 INTERIM FINANCIAL REPORT First Quarter of 2014 million 3M 2014 3M 2013 Change (%) Key Figures Rental income 180.5 182.0 0.8 Adjusted EBITDA Rental 109.5 109.3 0.2 Income from disposal of properties 60.2
CONDENSED INTERIM CONSOLIDATED FINANCIAL STATEMENTS
 CONDENSED INTERIM CONSOLIDATED FINANCIAL STATEMENTS H1JUNE 30, 2015 BOARD OF DIRECTORS REPORT CONDENSED INTERIM CONSOLIDATED FINANCIAL STATEMENTS JUNE 30, 2015 1 CONTENT Board of Directors Report 2-31
LEG Immobilien AG Q1 Results 2014
 LEG Immobilien AG Q1 Results 2014 15 th May 2014 Disclaimer While the company has taken all reasonable care to ensure that the facts stated in this presentation are accurate and that the opinions contained
Memorandum of Understanding Signed with France s Largest Residential Landlord Société Nationale Immobilière (SNI) Assessing the Potential of European
 Assessing the Potential of European") Memorandum of Understanding Signed with France s Largest Residential Landlord Société Nationale Immobilière (SNI) Executive Summary Vonovia has signed a Memorandum of Understanding (MoU) with SNI, the
Memorandum of Understanding Signed with France s Largest Residential Landlord Société Nationale Immobilière (SNI) Executive Summary Vonovia has signed a Memorandum of Understanding (MoU) with SNI, the
Company presentation November 2017
 Company presentation November 2017 1 CONTENT Content I. TAG overview and strategy 3 2 II. III. IV. TAG portfolio TAG services business TAG return on capex 7 12 16 V. TAG acquisitions and disposals 21 VI.
NINE MONTHS FINANCIAL RESULTS NOVEMBER 19, 2015
 NINE MONTHS FINANCIAL RESULTS NOVEMBER 19, 2015 01 ADO OVERVIEW AND INVESTMENT HIGHLIGHTS Overview ADO the pure play Berlin residential specialist Investment highlights 1 2 3 Berlin residential pure play
UBS Global Real Estate CEO/CFO Conference. December 1/2, 2015
 UBS Global Real Estate CEO/CFO Conference December 1/2, 2015 01 ADO OVERVIEW AND INVESTMENT HIGHLIGHTS Overview ADO the pure play Berlin residential specialist Investment highlights 1 2 3 Berlin residential
INTERIM REPORT ON THE 3RD QUARTER GROWING CASHFLOWS
 INTERIM REPORT 2017 ON THE 3RD QUARTER GROWING CASHFLOWS 2 Group financials Group financials 3 GROUP FINANCIALS in EUR m 01 / 01 09 / 30 / 2017 01 / 01 09 / 30 / 2016 Income statement key figures Rental
P R E S E N T A T I O N H1/ A U G U S T
 P R E S E N T A T I O N H1/2014 0 5 A U G U S T 2 0 1 4 D I S CLAIMER The statements contained herein may include statements of future expectations and other forward-looking statements that are based on
Quarterly Statement A S O F
 Quarterly Statement AS OF KEY FACTS Q3 / 2017 T 1 Key facts RESULTS OF OPERATIONS Q3 2017 Q3 2016 + / % / bp 01.01. 01.01. 30.09.2016 Rental income million 134.7 131.9 2.1 398.4 381.3 4.5 Net rental and
Company presentation April 2017
 Company presentation April 2017 CONTENT Content I. TAG overview and strategy 3 2 II. III. IV. TAG portfolio TAG return on capex TAG acquisitions and disposals 7 13 18 V. TAG financing structure 22 VI.
FINANCIAL STATEMENTS. For the year ended December 31, 2013
 2013CONSOLIDATED FINANCIAL STATEMENTS For the year ended December 31, 2013 BOARD OF DIRECTORS REPORT REPORT OF THE RÉVISEUR D ENTREPRISES AGRÉÉ (INDEPENDENT AUDITOR) OF COMPREHENSIVE INCOME OF FINANCIAL
CONFERENCE CALL. 9M 2015 Results
 CONFERENCE CALL 9M 2015 Results 13.11.2015 9M 2015 SHOPPING CENTERS Retail turnover 9M 2015 1) Retail sector % change rent-to-sales ratio in % % of sales % of space Department stores -2.3 6.0 7.8 13.5
INTERIM FINANCIAL REPORT. Third Quarter of 2014
 INTERIM FINANCIAL REPORT Third Quarter of 2014 DEUTSCHE ANNINGTON IMMOBILIEN SE INTERIM FINANCIAL REPORT FOR THE THIRD QUARTER OF 2014 CONTENTS 1 Key Figures 9M 2014 9M 2013 Change (%) million Rental income
Capital Markets Day 2016 / Essen / June 6 th Modernization Frederic Neumann / Managing Director Vonovia South
 Capital Markets Day 2016 / Essen / June 6 th 2016 Modernization Frederic Neumann / Managing Director Vonovia South Agenda Portfolio strategy & modernization track record From a single product program to
Strategic Financing of a Listed Company
 Strategic Financing of a Listed Company Christian Hillermann ADLER Real Estate AG Dr. Sven Janssen Oddo Seydler Bank AG Contents ADLER Real Estate AG company presentation 1. Company highlights 2. Event
CORESTATE Capital Holding Company presentation. January 2018
 CORESTATE Capital Holding Company presentation January 2018 Disclaimer This presentation contains forward-looking statements that involve a number of risks and uncertainties. Such statements are based
Housing as a commodity? Operative behavior of German publicly listed housing organizations Presenter: Prof. Dr. Stefan Kofner, MCIH Tirana, 05.
 Housing as a commodity? Operative behavior of German publicly listed housing organizations Presenter: Prof. Dr. Stefan Kofner, MCIH Tirana, 05. September, 2017 1. Publicly listed housing organizations
CAPTURE CHANCES DRIVE INNOVATION
 CAPTURE CHANCES DRIVE INNOVATION LEG Immobilien AG 10 August 2018 H1-2018 Results Disclaimer While the company has taken all reasonable care to ensure that the facts stated in this presentation are accurate
CAPTURE CHANCES DRIVE INNOVATION
 CAPTURE CHANCES DRIVE INNOVATION LEG Immobilien AG 9 November 2018 9M-2018 Results Disclaimer While the company has taken all reasonable care to ensure that the facts stated in this presentation are accurate
CORESTATE Capital Group A Fully Integrated Real Estate Investment Manager
 CORESTATE Capital Group A Fully Integrated Real Estate Investment Manager 1 CORESTATE at a Glance Real Estate Investment Management Platform Real estate investment manager specialized in the creation and
CORESTATE Capital. Company Presentation. February 2018
 CORESTATE Capital Company Presentation February 2018 Disclaimer This presentation contains forward-looking statements that involve a number of risks and uncertainties. Such statements are based on a number
BERLINSIDERS HALF YEAR FINANCIAL REPORT
 2 0 1 7 BERLINSIDERS HALF YEAR FINANCIAL REPORT 2017 KEY FIGURES HALF YEAR FINANCIAL REPORT 2017 KEY FIGURES KEY BALANCE SHEET FIGURES In EUR thousand Jun 30, 2017 Dec 31, 2016 Fair value of properties
FIRST QUARTER 2017 INTERIM STATEMENT
 DEMIRE Deutsche Mittelstand Real Estate AG FIRST QUARTER 2017 INTERIM STATEMENT Fiscal Year January 1 Dezember 31 2017 Foreword of the Executive Board Dear Shareholders, With the quarterly statement for
Deutsche Wohnen AG.» Company presentation. September 2012
 Deutsche Wohnen AG» Company presentation September 2012 1 » Agenda 1 Major highlights in H1/2012 2 BauBeCon acquisition 3 Proven asset and portfolio management track record in connection with the right
Growing Assets Q Figures
 2014 Growing Assets Q1 2014 Figures CONTENT Content 22 I. TAG Highlights FY 2013 / Q1 2014 3 II. TAG Strategy/ Efficiency: Growth and Margins 5 III. TAG Achievements: Vacancy reduction / rent increases
DEMIRE Deutsche Mittelstand Real Estate AG Conference Call Full Year Results 2017
 DEMIRE Deutsche Mittelstand Real Estate AG Conference Call Full Year Results 2017 26 Disclaimer This document is for informational purposes only. This document is not intended to form the basis of any
ANNUAL RESULTS 2015 MARCH 22, 2016
 ANNUAL RESULTS 2015 MARCH 22, 2016 01 OVERVIEW & INVESTMENT HIGHLIGHTS Overview ADO the pure-play Berlin residential specialist Investment highlights 1 2 3 4 Berlin residential pure play with a 1.5bn quality
CORESTATE Capital Group
 CORESTATE Capital Group A Fully Integrated Real Estate Investment Manager As of Q3 2016 1 CORESTATE at a Glance Real Estate Investment Management Platform Real estate investment manager specialized in
PRELIMINARY INDICATION FOR FULL YEAR 2012 RESULT
 PRELIMINARY INDICATION FOR FULL YEAR 2012 RESULT JANUARY 2013 AGENDA OVERVIEW OF EXTRAORDINARY EFFECTS AND IMPACT ON 2012 RESULT 1 2 EBT TARGET OF 50 MIO IN 2012 WRITE DOWN OF GOODWILL AND INTANGIBLE ASSETS
2017 HALF YEAR 25 JULY 2017
 2017 HALF YEAR RESULTS 25 JULY 2017 Strong financial results and robust balance sheet Driving performance through operational excellence and disciplined capital allocation High quality pipeline of growth
Catella Research. Housing Market Ranking Germany 2015 Regional Housing Markets under the Microscope
 Catella Research Housing Market Ranking Germany 2015 Regional Housing Markets under the Microscope About Catella Catella is a leading financial advisor and asset manager in Europe, active in the property,
Deutsche Annington Immobilien SE
 Deutsche Annington Immobilien SE Roadshow Frankfurt, 3 rd November 2014 Rolf Buch, CEO Dr. A. Stefan Kirsten, CFO Contents German Market 3 Operating performance 9M 2014 and Outlook 5 Group strategy 13
Growing Assets 9M 2013 Q1-Q3 2011
 2013 Growing Assets 9M 2013 Q1-Q3 2011 CONTENT Content 22 I. TAG Highlights 3 II. TAG FFO 2013 / Guidance 2014 5 III. TAG Strategy: Growth and Margins 7 IV. TAG Portfolio: Regions / Achievements / Capex
Condensed Interim Consolidated Financial Statements
 Condensed Interim Consolidated Financial Statements FOR THE NINE MONTH PERIOD ENDED SEPTEMBER 30, 2018 Berlin Munich Condensed Interim Consolidated Financial Statements FOR THE NINE MONTH PERIOD ENDED
Next Generation Real Estate. HY 2008 Figures. Colonia Real Estate AG HY 2008 Figures 15 th of August 2008 Cologne
 Next Generation Real Estate HY 2008 Figures Colonia Real Estate AG HY 2008 Figures 15 th of August 2008 Cologne Focused and Integrated Business Model Colonia Real Estate AG Investments Management Principal
CAPTURE CHANCES DRIVE INNOVATION
 CAPTURE CHANCES DRIVE INNOVATION LEG Immobilien AG 8 March 2018 FY-2017 Results Disclaimer While the company has taken all reasonable care to ensure that the facts stated in this presentation are accurate
FINANCIAL RESULTS Q3 2018
 FINANCIAL RESULTS Q3 2018 November 14, 2018 OVERVIEW & INVESTMENT HIGHLIGHTS Chapter 01 Kapitel Titel ADO THE PURE PLAY BERLIN RESIDENTIAL SPECIALIST Investment highlights 1 Berlin residential pure play
TAG Immobilien AG Q1-Q TAG I 1
 TAG Immobilien AG Q1-Q3 2011 Q1-Q3 2011 TAG I 1 Content I. Group overview page 3-5 TAG investment case, highlights Q3, Q4 Combined entity TAG Colonia II. Portfolio page 6-21 Overview Residential Salzgitter
2015 CONSOLIDATED FINANCIAL STATEMENTS FOR THE YEAR ENDED DECEMBER 31,
 2015 CONSOLIDATED FINANCIAL STATEMENTS FOR THE YEAR ENDED DECEMBER 31, CONTENT Board of Directors Report 02-45 Independent Auditors Report 46-47 Consolidated statement of comprehensive income 48-49 Consolidated
Germany Property Refocus on Fundamentals; Initiating on German Residential Property
 INDUSTRY NOTE Germany Property & Real Estate Germany Property Germany Property Refocus on Fundamentals; Initiating on German Residential Property Key Takeaway With the sector down by 2 from peak valuations
CORESTATE Capital Group A Leading Real Estate Investment Manager
 CORESTATE Capital Group A Leading Real Estate Investment Manager H1 2017 Earnings Presentation 16 August 2017 Page 1 CORESTATE Capital Holding S.A. Disclaimer This presentation contains forward-looking
BUWOG GROUP COMPANY PRESENTATION DEUTSCHE BANK GERMAN, SWISS & AUSTRIAN CONFERENCE BERLIN 8 JUNE 2016
 BUWOG GROUP COMPANY PRESENTATION DEUTSCHE BANK GERMAN, SWISS & AUSTRIAN CONFERENCE BERLIN 8 JUNE 2016 HIGHLIGHTS 9M 2015/16 Highlights BUSINESS MODEL AUSTRIA & GERMANY ASSET MANAGEMENT RESIDENTIAL ONLY
Bilfinger Berger: Entering new growth phase
 Bilfinger Berger: Entering new growth phase Roadshow London, Roland Koch, CEO Andreas Müller, Head of Corporate Accounting and Investor Relations Agenda 1. Bilfinger Berger Overview 2. Preliminary figures
CAPTURE CHANCES DRIVE INNOVATION
 CAPTURE CHANCES DRIVE INNOVATION LEG Immobilien AG 8May 2018 Q1-2018 Results Disclaimer While the company has taken all reasonable care to ensure that the facts stated in this presentation are accurate
THREE MONTH FINANCIAL RESULTS 2016 MAY 19, 2016
 THREE MONTH FINANCIAL RESULTS 20 MAY 19, 20 01 OVERVIEW & INVESTMENT HIGHLIGHTS Overview ADO the pure-play Berlin residential specialist Investment highlights Key portfolio metrics (end of Q1 20) 1 2 3
ACCENTRO Real Estate AG
 ACCENTRO Real Estate AG Germany s Market Leader in Residential Property Privatisation Company Presentation, 6th November 2018 Interim Financial Report for the 3rd quarter 2018, 30th September 2018 ACCENTRO
AROUNDTOWN S A. Condensed Interim Consolidated Financial Statements. For the three month period ended March 31, Berlin
 AROUNDTOWN S A Condensed Interim Consolidated Financial Statements For the three month period ended March 31, 2018 Berlin Düsseldorf Content Board of Directors Report 2 Interim consolidated statement of
Company presentation June 2017
 Company presentation June 2017 1 CONTENT Content I. TAG overview and strategy 3 2 II. III. IV. TAG portfolio TAG return on capex TAG acquisitions and disposals 7 13 18 V. TAG financing structure VI. TAG
FY2017 Annual General Meeting 19 April 2018
 FY2017 Annual General Meeting 19 April 2018 Agenda Key Highlights About Tikehau Capital European Market Review Portfolio Overview Financial Highlights Conclusion 2 Key Highlights FY2017 Key Highlights
TAG Immobilien AG preliminary figures
 TAG Immobilien AG Q1-Q3 2011 TAG I 1 Content I. Group overview page 3-6 II. Portfolio page 7-15 III. Group financials page 16-17 IV. Financial structure page 18-19 V. Share page 20-21 VI. Acquisitions
Agenda. About IREIT Global. Key Highlights. Portfolio Summary. Economy & Real Estate Review. Looking Ahead. Appendix : Overview of Tikehau Capital
 4Q 2017 and FY 2017 Results Presentation 14 February 2018 Agenda About IREIT Global Key Highlights Portfolio Summary Economy & Real Estate Review Looking Ahead Appendix : Overview of Tikehau Capital 2
Capital Market Press Conference 2013 / Frankfurt, 5 December 2013
 Capital Market Press Conference 2013 / 2014 Frankfurt, 5 December 2013 Key financial figures of KfW Group (IFRS) 2013: Solid business performance, decreasing profit, very sound capital basis 2011 2012
CONFERENCE CALL HALF-YEAR FINANCIAL REPORT AUGUST 2017
 CONFERENCE CALL HALF-YEAR FINANCIAL REPORT 207 6 AUGUST 207 RETAIL TURNOVER H 207 RETAILERS Retail sector % change to 206 rent-to-sales ratio in % % of sales % of space Department stores -.4 6.3 7.3 3.0
CONDENSED INTERIM CONSOLIDATED FINANCIAL STATEMENTS FOR THE NINE MONTH PERIOD ENDED SEPTEMBER 30, 2016 Q Cologne
 CONDENSED INTERIM CONSOLIDATED FINANCIAL STATEMENTS FOR THE NINE MONTH PERIOD ENDED SEPTEMBER 30, 2016 Q3 2016 Cologne Bremen CONDENSED INTERIM CONSOLIDATED FINANCIAL STATEMENTS FOR THE NINE MONTH PERIOD
DEMIRE Deutsche Mittelstand Real Estate AG
 DEMIRE Deutsche Mittelstand Real Estate AG First in Secondary Locations April 2017 DEMIRE Deutsche Mittelstand Real Estate AG April 2017 Agenda and Presentation Team Section Page Company Overview 4 Andreas
12 th Annual General Meeting. + Vienna, 8 May 2013
 12 th Annual General Meeting + Vienna, 8 May 2013 conwert is a fully integrated real estate company focusing on residential properties and apartment buildings in Germany and Austria. This focus is complemented
Bayer Annual Report To our Stockholders Investor Information. Jan Feb Mar Apr May June July Aug Sep Oct Nov Dec
 Bayer Annual Report 2015 39 Performance of Bayer Stock in 2015 [Graphic 2.1] (Indexed; 100 = Xetra closing price on December 31, 2014; source: Bloomberg) 130 120 110 100 90 80 Jan Feb Mar Apr May June
Deutsche Wohnen SE.» Q results. Conference Call, 15 May 2018
 Deutsche Wohnen SE» Q1 2018 results Conference Call, 15 May 2018 1 » Agenda 1 Highlights Q1 2018 2 Portfolio 3 Financials 4 Appendix 2 » Highlights Q1 2018 Operating business remains strong L-f-l rental
INVESTOR PRESENTATION
 INVESTOR PRESENTATION Table of Contents Introduction to SEGRO 3 Market drivers 10 High quality development pipeline 15 Balance sheet and financing 21 Operating performance 26 Portfolio overview 30 APP
CORESTATE Capital. Preliminary Results FY Management Presentation. 20 February 2018
 CORESTATE Capital Management Presentation Preliminary Results FY 2017 20 February 2018 Disclaimer This presentation contains forward-looking statements that involve a number of risks and uncertainties.
FINANCIAL RESULTS Q2 2018
 FINANCIAL RESULTS Q2 2018 August 15, 2018 OVERVIEW & INVESTMENT HIGHLIGHTS Chapter 01 Kapitel Titel ADO THE PURE PLAY BERLIN RESIDENTIAL SPECIALIST Investment highlights A focused residential portfolio(,4)
Fast and sustainable, profitable growth. Company profile (April 2019)
") Fast and sustainable, profitable growth. Company profile (April 219) FCR Immobilien AG business model FCR with a clear orientation and great potential for increase in value Clear profile FCR Immobilien
Fast and sustainable, profitable growth. Company profile (April 219) FCR Immobilien AG business model FCR with a clear orientation and great potential for increase in value Clear profile FCR Immobilien
as of Quarterly Report
 Quarterly Report as of KEY FIGURES KEY FIGURES LEG IMMOBILIEN AG table 1 Key figures 01.04. 01.04. +/ %/bp 01.01. 01.01. +/ %/bp RESULTS OF OPERATIONS Rental income 94.7 88.9 6.5 189.0 178.1 6.1 Net rental
Deutsche Wohnen SE.» Full year results Conference Call, 23 March 2018
 Deutsche Wohnen SE» Full year results 2017 Conference Call, 23 March 2018 1 » Table of content 1 Highlights 2017 2 Portfolio & valuation update 3 Financials 4 Guidance 5 Appendix 2 » Highlights FY 2017
Continuing the growth story: Acquisition of Brack Capital Properties. February 2018
 Continuing the growth story: Acquisition of Brack Capital Properties February 2018 Disclaimer This document has been prepared by ADLER Real Estate Aktiengesellschaft (the Company ) and is the responsibility
FY 2016 Results. 28 April DEMIRE Deutsche Mittelstand Real Estate AG April 2017
 FY 2016 Results 28 April 2017 Agenda Section Page Highlights 2016 3 Market Update 4 Portfolio Performance 5 Key Financials 9 Strategic Review and Next Steps 12 Share Information 13 Contact Details 14 2
BNP PARIBAS SECURITIES SERVICES
 BNP PARIBAS SECURITIES SERVICES PROVIDING RESPONSIBLE SERVICE TO OUR CLIENTS securities.bnpparibas.de The bank for a changing world 2 BNP PARIBAS GLOBALLY One of the leading banks in the eurozone 189,000
Fast and sustainable, profitable growth. Company profile (February 2019)
") Fast and sustainable, profitable growth. Company profile (February 219) Equity Story Highly profitable player with strong growth prospects on attractive real estate markets Sustainable, profitable business
Fast and sustainable, profitable growth. Company profile (February 219) Equity Story Highly profitable player with strong growth prospects on attractive real estate markets Sustainable, profitable business
Company Presentation. Mr. Claus-Matthias Böge, CEO. German Equity Forum Frankfurt am Main, 22 November The Art of Shopping
 1 The Art of Shopping Company Presentation Mr. Claus-Matthias Böge, CEO German Equity Forum Frankfurt am Main, 22 November 2005 The Art of Shopping Company 3 Equity Story Pure Player Deutsche EuroShop
comdirect bank German Corporate Conference Deutsche Bank Frankfurt, 1 June 2005 Dr. Andre Carls, CEO
 comdirect bank German Corporate Conference Deutsche Bank Frankfurt, 1 June 2005 Dr. Andre Carls, CEO Agenda 1 Overview and 2004 results New record result 2 Strategy and programme Growth and value added
Lindorff. Company Presentation. November 2016
 Lindorff Company Presentation November 06 Disclaimer IMPORTANT INFORMATION Not for distribution in or into the United States, Australia, Canada, Japan or any other jurisdiction in which such distribution
Deutsche Wohnen SE. Full Year Results 2018 Conference Call 26 March 2019
 Deutsche Wohnen SE Full Year Results 2018 Conference Call 26 March 2019 Agenda 01 02 03 04 Highlights Market and Portfolio Financials and Outlook Appendix deutsche-wohnen.com 2 Highlights FY 2018 Operating
2011 feelestate.de CONFERENCE CALL INTERIM REPORT H August 2011
 2011 feelestate.de CONFERENCE CALL INTERIM REPORT H1 2011 11 August 2011 H1 2011 Highlights H1 2011 January: Increase of the shareholding in Stadt-Galerie Hameln to 100% March: Opening of the Extension
TLG S TENDER OFFER FOR WCM: BUILDING THE LEADING GERMAN COMMERCIAL REAL ESTATE PLATFORM
 MAY 207 TLG IMMOBILIEN AG TLG S TENDER OFFER FOR WCM: BUILDING THE LEADING GERMAN COMMERCIAL REAL ESTATE PLATFORM DISCLAIMER This presentation is for information purposes only and neither constitutes an
Deutsche Wohnen SE.» Company presentation. November 2017
 Deutsche Wohnen SE» Company presentation November 2017 1 » Content 1 Deutsche Wohnen at a Glance 2 German Residential Real Estate Market 3 Portfolio and Business Segments 4 Key Financials 5 Strategic Focus
Summary 1-2. Chairman's and Managing Director's report 3-9. Independent auditor s review report 10
 REPORT AND ACCOUNTS June 2018 INDEX Page Summary 1-2 Chairman's and Managing Director's report 3-9 Independent auditor s review report 10 Condensed Consolidated Statements of Financial Position 11-12 Condensed
Performance at a glance
 Interim Report 1-9/2014 Usable space by usage type *) as of Performance at a glance 73.3% Residential 26.7% Commercial *) Fair value allocation as commercial or residential is based on the majority use
Half Year Results Sirius Real Estate Limited Half Year Results 30 September 2015
 Half Year Results 2015 Sirius Real Estate Limited Half Year Results 30 September 2015 Who Are We We are the largest branded provider of mixed-use conventional and flexible workspace in Germany 2 Highlights
On track! Results for Q1 Q3 2017
 On track! Results for Q1 Q3 2017 Technology-based financial services Investment highlights in Q1 Q3 2017 and forecast for 2017 Key figures for Q1 Q3 2017 (yoy) Revenue: 143.7 million (+27%) EBIT: 18.6
1Q2018 Results Presentation 10 May2018
 1Q2018 Results Presentation 10 May2018 Agenda About IREIT Global Key Highlights Portfolio Summary European Market Review Looking Ahead Appendix : Overview of Tikehau Capital 2 About IREIT Global About
Fiscal year 2011 off to a strong start
 Fiscal year 2011 off to a strong start Peter Löscher, President and CEO Joe Kaeser, CFO Q1 FY 11 Analyst call January 25, 2011 Copyright Siemens AG 2011. All rights reserved. Safe Harbour Statement This
Consolidated Financial Statements
 Consolidated Financial Statements FOR THE YEAR ENDED DECEMBER 31, 2017 Berlin Cologne Consolidated Financial Statements FOR THE YEAR ENDED DECEMBER 31, 2017 IMPRINT Publisher: Grand City Properties S.A.
TAG Immobilien AG Q1 - Q3 2012
 TAG Immobilien AG Q1 - Q3 2012 Q1-Q3 2011 TAG I 1 Content I. TAG Highlights Q3 2012 page 3 II. TAG FFO, Vacancy, Achievements, Investment Case Q3 2012 page 4-7 III. TAG Portfolio Q3 2012 page 8-10 IV.
Prime Office REIT-AG EXCELLENCE IN GERMAN REAL ESTATE. Roadshow FY 2011 results Zurich, London, Frankfurt, Brussels, Paris and Amsterdam April 2012
 Prime Office REIT-AG EXCELLENCE IN GERMAN REAL ESTATE Roadshow FY 2011 results Zurich, London, Frankfurt, Brussels, Paris and Amsterdam April 2012 0 Disclaimer The statements contained herein may include