CONDENSED INTERIM CONSOLIDATED FINANCIAL STATEMENTS
|
|
|
- Jeffrey Morrison
- 6 years ago
- Views:
Transcription


1 CONDENSED INTERIM CONSOLIDATED FINANCIAL STATEMENTS H1JUNE 30, 2015
2 BOARD OF DIRECTORS REPORT CONDENSED INTERIM CONSOLIDATED FINANCIAL STATEMENTS JUNE 30,

3 CONTENT Board of Directors Report 2-31 Interim consolidated statement of comprehensive income Interim consolidated statement of financial position Interim consolidated statement of changes in equity Interim consolidated statement of cash flows Condensed notes to the interim consolidated financial statements
4 BOARD OF DIRECTORS REPORT KEY FINANCIALS PRO-FORMA RENTAL AND OPERATING INCOME 1) ( thousands) EBITDA ( thousands) NET PROFIT ( thousands) EPS ( ) ADJUSTED EBITDA ( thousands) FFO I ( thousands) FFO I PER SHARE ( cent) H change H , % 46, , % 536, , % 505, % , % 61,089 16, % 40, % 8.04 TOTAL EQUITY ( thousands) EPRA NAV ( thousands) Dec 2013 Dec 2014 Jun 2015 Jun 2015 pro-forma 2) 871,664 1,221,661 1,743,391 2,063, ,049 1,273,270 1,853,020 2,173,020 LOAN-TO-VALUE 35% 19% 33% 20% EQUITY RATIO 46% 71% 56% 60% 1) assuming deconsolidation of GCP S.A. in ) including the effect of the 320 million capital increase of July

5 3
6 BOARD OF DIRECTORS REPORT THE COMPANY The Board of Directors of Aroundtown Property Holdings PLC and its investees (the Company, AT or the Group ) hereby submits the interim report as of June 30, The figures presented are based on the interim consolidated financial statements as of June 30, 2015, unless stated otherwise. AT is a specialist real estate investment group, focusing on value-add income generating properties primarily in the German real estate markets. The Group covers the main real estate segments which benefit from strong fundamentals and growth prospects: residential, commercial and hotel properties. The residential investments are carried out through Grand City Properties S.A. ( GCP ) held to 34% by AT, the hotel investments through Primecity Investment PLC ( PCI ) held to 63% by AT as of August 2015, and the commercial properties are held directly by AT through its non public subsidiaries. The Group s unique business model and experienced management team have led the Company to grow continuously for more than a decade. AT s properties generate strong operational results, best illustrated through run rates, annualizing the monthly results and excluding any operational improvements or further growth. Including signed deals, the Adjusted EBITDA run rate for July 15 is 167 million and the Funds from Operations I (FFO I) run rate is 97 million. Operating with a fully integrated real estate value chain the Company targets turnaround opportunities of mismanaged properties. In this real estate market AT picks cash generating properties with upside potential in rent and/or occupancy increase and consequential value. Through an intensive property turnaround, including operational and repositioning activities, AT further improves the portfolio results, creating secure and strong cash flow generating characteristics and great internalized growth potential. FINANCIAL POSITION HIGHLIGHTS thousands as of Dec 2014 Jun 2015 CASH AND LIQUID ASSETS 175, ,910 TOTAL ASSETS 1,721,569 3,094,934 TOTAL PRO-FORMA ASSETS 1) 2) 3,442,192 6,132,784 TOTAL EQUITY 1,221,661 1,743,391 TOTAL PRO-FORMA EQUITY 2) 1,221,661 2,063,391 TOTAL BANK DEBT 188, ,609 STRAIGHT BONDS 150, ,036 CONVERTIBLE BONDS 96, ,771 1) assuming full consolidation of GCP In ) including the effect of the 320 million capital increase of July


7 5

8 BOARD OF DIRECTORS REPORT ACHIEVEMENTS Private placement of Series A straight bonds at the amount of 161 million. The series was tapped to a total aggregate amount of 200 million in January 2015 Successful pre-ipo convertible bonds issuance of 450 million in April 2015 led by Deutsche Bank, Berenberg and Morgan Stanley as joint bookrunners Listing on Euronext Stock Exchange in Paris in June 2015 DEC 2014 APR 2015 JUN 2015 Listing 6

9 Successful capital increase of 320 million in July 2015 led by Berenberg and Société Générale as joint bookrunners. Free float increased to 24% Dividend policy resolved of 30% of FFO I starting in 2016 Successful portfolio growth with over 6 billion Group assets as of July 2015 JUL 2015 JUL 2015 JUL
10 BOARD OF DIRECTORS REPORT STRATEGY VALUE CREATION AT S VALUE CREATION STARTS PRIOR TO ACQUISITION STRONG CASH FLOW GENERATING PORTFOLIO WITH GROWTH POTENTIAL REPOSITIONING AND TURNAROUND ACTIVITIES ACQUISITION AND TAKE OVER DUE DILIGENCE DUE DILIGENCE AT s successful due diligence processes are based on the vast experience of all departments involved. After a potential property passes the initial indicative screening, each property is assessed, taking into account of the individuality of each project while ensuring the acquisition is in line with business strategy. The experience of the Group in analyzing mismanaged portfolios, identifying both the potential risks and the upside potential of each property, results in fast, but thorough and reliable screening procedures. During the due diligence phase the Group s construction team analyses potential capex requirements. These are subsequently priced in the valuation process to provide a fair assessment and ensure that the capex works can start smoothly after acquisition. For each property a detailed business plan is created in the due diligence phase, including an assessment of the portfolio fit and identification of feasible tenants. Choosing tenants prior to acquisition decreases risk on one hand, while on the other accelerates the takeover process. SOURCING AND TARGETING ACQUISITIONS SOURCING AND TARGETING ACQUISITIONS AT s property sourcing success stems from its unique network as well as reputation as a reliable real estate acquirer. The Group focuses on mismanaged properties characterized mainly by under market rent levels and/or high vacancy rates. Through its 11 year experience in the market the Group benefits from a preferred buyer status across its sourcing network. The Group sources deals from a large and diverse deal sourcing base, such as receivers, banks, loan funds, broker network, distressed owners, private and institutional investors and court auctions. The Group s primary focus is on German major cities and metropolitan areas with positive demographic prospects. The Group follows acquisition criteria, which ensure that its newly acquired properties fit to AT s business model: Upside potential through operational improvements Assets generating cash flows Vacancy reduction potential Rent level per sqm below market level (under-rented properties) Acquisition in densely populated areas and commercially attractive cities Purchase price below replacement costs and below market values Potential to reduce the cost per sqm significantly through operational improvements Through the broad coverage and knowledge of its management, AT considers the potential uses for the individual property. This includes altering its primary use which opens up opportunities for properties that experience demand shortages in their current market. Given the complexity and necessity for cross-segment experience in the successful completion of reclassification projects, AT s unique profile is a strong and sustainable competitive advantage. ACQUISITION AND TAKE OVER Due to a thorough cross-organizational process in the due diligence phase, once a property is acquired the actual takeover occurs efficiently. As liquidity plays a significant role in the acquisition of value add properties, AT benefits strongly from its liquidity and ability to acquire with existing resources and refinance at a later stage. The Group benefits from a strong and experienced legal department, which combined with close and longstanding relationships with external law firms enables AT to complete several deals simultaneously. REPOSITIONING AND TURNAROUND ACTIVITIES As a specific tailor made business plan is constructed for each property, and the weaknesses and strengths were mapped pre-acquisition, the execution of the turnaround process becomes easier and faster. The business plan input is integrated into AT s proprietary IT/software platform which enables the management to monitor all operational and financial parameters and fully control the turnaround progress. The success of the turnaround and repositioning of the properties are the result of the following actions: OPERATIONAL AND MARKETING INITIATIVES In the first instance repositioning activities aim at quickly improving the profitability of the acquired properties. Given the vacancy of the portfolio, targeted marketing activities are implemented to increase occupancy and thereby rental income. Vacancy reduction initiatives are tailored to the property at hand. Procedures applied to AT s commercial properties focus on establishing a network of internal and local external letting brokers, offering promotional features and building a reputation in the market for high service standards. Initiatives in the residential properties target relationship building with potential tenants and the community by collaborating with local governments, supporting community building projects and advertising on key real estate platforms. For the hotel assets, optimal operators are selected for the asset and a fixed long term lease contract entered into once the hotel is stabilized. 8


11 Rent increase and tenant restructuring, assessed in the due diligence process, are executed according to the business plan. Further, the operational improvements AT initiates improve the living quality or business environment for existing and future tenants. Thereby, the demand for these repositioned assets rises. Having established areas for operational improvements, the Group drills down on cost saving opportunities on a per unit basis, making use of modern technologies such as meters based on consumption. These efforts combined with cost savings achieved through vacancy reductions and economies of scale enable the Company to benefit from a significant improvement of the cost base. STRONG CASH FLOW GENERATING PORTFOLIO WITH GROWTH POTENTIAL Secure cash flows are continuously strengthened by ongoing cost controls and profitability improvements. Given vacancy and discount of the rental income to market rent prices, AT s portfolio exhibits further strong and lasting growth after the implementation of initial repositioning activities. In line with the Group s buy and hold strategy, with a strong focus on creating a long term stream of secure cash flows, this continuous internal growth ensures that AT can continue to grow organically without relying on further acquisitions. AT manages its entire real estate value chain, across acquisition, letting, upkeep and refurbishment. This integrated approach brings further efficiency benefits and a preferred landlord status to the Group and fast response times to its tenants. SMART CAPEX INVESTMENTS, WHEN REQUIRED AT addresses capex needs to keep the properties at good standards and addresses the requirements of its existing and prospective tenants. Capital improvements are discussed in close coordination with committed tenants allowing an efficient and cost effective implementation of the property conditions required for the pleasant living or successful operation of the tenant. The financial feasibility of the proposed alterations are balanced against the lease term, rental income and acquisition cost and bear quick returns over the investment period. RELATIONSHIP MANAGEMENT AT puts great emphasis on establishing strong relationships with its tenants to reduce churn rates, to predict as well as strengthen the tenant structure and thereby positively affect its cash flows in the future. The Company aims at offering a high quality service, for potential as well as existing tenants. The Group pays strong attention to the industry in which its commercial tenants operate and their individual success factors. The Group offers direct support in form of additions to the rental property such as parking facilities, space extensions to facilitate growth and smart space redesign to match modern office layouts. For its strong residential tenant base GCP provides a wide range of services including a 24/7 Service Center and invests into community building projects such as playgrounds and community centers. Further, the Group aims to establish personal relationships between its sales representatives and tenants, providing them with personal contact points, reacting promptly to problems and proactively prolonging existing contracts that expire soon to optimize and secure long-term revenues. TRADING DATA Placement Euronext Paris First listing Number of shares (as of 30 June 2015) 500,000,000 Number of shares (as of date of this report) 600,141,641 Number of shares on a fully diluted basis 627,478,754 (as of 30 June 2015) Number of shares on a fully diluted basis (as of the date of this report) 730,829,241 Free Float (as of the date of this report) 24% Symbol MLATP Market Cap (as of 26 August 2015) 1.9 bn 9


12 BOARD OF DIRECTORS REPORT KEY STRENGTHS EXPERIENCED MANAGEMENT AT s management can draw from a wealth of experience in the real estate and associated sectors. This enables the Group to continuously innovate, take strategic decisions quickly and accurately as well as successfully grow. Its remarkable growth over the recent years has created two key benefits in this regard, on one hand the ability to attract managers and employees that redefine the industry, on the other hand the internalization of a knowledge and experience pool at a fraction of the cost in relation to its portfolio. This knowledge is communicated and utilized across the Company and business units which shapes its processes and operational improvements, such as automated cost saving initiatives and automated rent increase processes. ROBUST FINANCIAL FLEXIBILITY AT s operations are based upon solid financing and its management can draw from many years of experience in raising capital. The Group works with leading German as well as international investment banks both as a direct source of bank loan funding and as bookrunners. Proven access to capital markets through numerous issuances of bonds, convertible bonds and hybrid notes as well as listing on public exchanges in each of its major subsidiaries and on the Group level provide experience and contacts to tap capital markets in the future. In the last two years, the Group has raised close to 3.5 billion capital through issuances of equity, bonds, convertible bonds and hybrid notes. Furthermore, the Group has a strong network with 20 commercial banks and has vast experience in obtaining bank debt with preferred conditions. AT s management possesses the knowledge that makes up its main competitive advantage, the ability to extract the potential from mismanaged assets. This includes the ability to execute the business plan successfully, which includes among others, the competence to assess the limiting factors that led to vacancy and execute reduction activities rapidly, putting in place cost effective measures, setting automated rent increase processes in place, understanding tenant structures and optimizing rental contracts in terms of lease maturity and income security, cross-sector experience to enable the extraction of the full value of the property and operations experience to monitor and reduce costs. DEAL SOURCING AND ABILITY TO CREATE ACCRETIVE GROWTH The Group s acquisition track record of over a decade has led the Group to hold a preferred acquirer status in the German real estate market, primarily due to its fast decision making, high deal execution rates and reliability. Given the wide coverage and knowledge, AT is able to assess all repositioning options, including optimizing the object s primary use. This improves efficiency and extracts value. The Group has a proven track record of acquiring properties which exhibit potential value gains and successfully turning these around. This ability is mirrored by a continuous pipeline and acquisition of attractive properties and the successful transition of the existing properties to stabilized assets. PROPRIETARY IT/SOFTWARE PLATFORM AT emphasizes the internalization of relevant skills to support innovation and improve processes. Its operations and growth are supported by a scalable proprietary IT/software system that connects all departments and all property units, enabling efficient monitoring and implementation of improvements. The platform constantly monitors vacancy and rents across AT s portfolio, ensuring yields are optimized and strict cost discipline is implemented. The Group s in-house software team continuously interacts with the operational teams and delivers fast and efficient solutions to the Company s operational needs. After a software solution is implemented, constant improvements and updates take place to adapt to any additional operational necessities arising. 10

13 FRUITFUL CAPITAL MARKET ACTIVITIES 3,500 3,000 2,500 2,000 1,500 1, GCP - Convertible bonds and capital increase 2012 new issuance aggregate GCP - Straight bonds and capital increase 2013 GCP - Series C - Convertibles Feb 2014 GCP - Series B - Tap issue Apr 2014 GCP - Series C - Tap issue Jun 2014 GCP - Series D - Issue Oct 2014 PCI - Convertibles - Issue Nov 2014 AT - Series A - Issue Dec 2014 AT - Series A - Tap Issue Jan 2015 PCI - Convertibles - Tap issue Feb 2015 GCP - Hybrid notes - Issue Feb 2015 GCP - Hybrid notes - Tap issue Mar 2015 GCP - Series E - Issue Apr 2015 AT - Convertibles Issue Apr 2015 ATcapital increase Jul 2015 GCP hybrid notes tap issue Jul 2015 The management also has set in place coverage by independent credit rating agencies in the past for Grand City Properties, covering all aspects from the initial rating to reaching an investment grade credit rating. This wealth of experience enables a smooth implementation of AT s growth ambitions through diversified financing adapted to the characteristics of the individual projects. 11
14 BOARD OF DIRECTORS REPORT PROVEN ABILITY TO ACCESS CAPITAL MARKETS JUL 2015 JUL 2015 APR 2015 APR 2015 MAR 2015 FEB 2015 FEB 2015 JAN 2015 DEC 2014 NOV 2014 OCT 2014 JUN 2014 APR 2014 FEB 2014 DEC 2013 OCT 2013 JUL 2013 FEB 2013 OCT 2012 JUL 2012 GCP tap issuance of perpetual hybrid notes of additional 100m. Morgan Stanley served as bookrunner AT increased capital by 320m. Berenberg and Société Générale acted as joint bookrunners AT issuance of 5 year convertible bond of 450m with a coupon of 3.0% p.a. (issued at 95.68%). Deutsche Bank, Berenberg and Morgan Stanley acted as joint bookrunners GCP issuance of 10 year straight bond of 400m with a coupon of 1.5% p.a. (issued at 96.76%). Deutsche Bank, J.P.Morgan and Morgan Stanley acted as joint bookrunners GCP tap issuance of the perpetual hybrid notes for additional 250 (issued at 97.04%); Morgan Stanley and J.P.Morgan served as bookrunners GCP issuance of perpetual hybrid notes of 150 million with a coupon of 3.75% (issued at 96.3%). Morgan Stanley served as bookrunner PCI tap issuance of 50 million on exisiting convertible bonds AT tap issuance of 39m of series A bond to a total aggregate amount of 200m AT issuance of series A straight bonds of 161 million (nominal value) with a coupon of 3% p.a. PCI issuance of convertible bonds at principal amount of 100 million GCP redemption of straight bonds with nominal amount of 350m. Issuance of 7 year straight bond of 500m with a coupon of 2% p.a. (issued at 95.6%). Morgan Stanley, J.P. Morgan and Deutsche Bank acted as joint bookrunners GCP tap issuance of convertible bonds with gross proceeds of 140m at % reflecting an effective yield of 0.5%. J.P. Morgan and Berenberg acted as bookrunners GCP tap issuance of existing straight bonds with gross proceeds of 160m at % with a yield-to-call of 3.85% and Morgan Stanley as bookrunner GCP issued 5 year convertible bonds of 150m and a coupon of 1.50% p.a. with J.P. Morgan, Berenberg and Deutsche Bank as joint bookrunners Capital increase of GCP of 175m with Berenberg and J.P. Morgan as joint bookrunners Full conversion of GCP s convertible bond into equity GCP issued a 5 year straight bond of 200m with a coupon of 6.25% p.a. GCP increased capital by 36m Issuance of 5 year convertible bond of 100m and a coupon of 8% p.a. by GCP, with Credit Suisse as bookrunner GCP increased capital by 15m 12


15 KEY STRENGTHS CONSERVATIVE FINANCING STRUCTURE AT s conservative capital structure approach is reflected in its LTV of 33% as of June The management views the debt ratios as a key source of competitive advantage and puts policies in place to keep financing costs low and a high portion of unencumbered assets. The low leverage of the Group enables further external growth, while still maintaining a conservative capital structure. The Group s growth is financed through diversified financing sources with long maturities. LOAN-TO-VALUE 55% 50% 45% 40% 35% 30% 25% 20% 15% 10% 5% 39% 35% Company BOD limit Company BOD policy 0% Dec 2012 Dec 2013 Dec 2014 Jun 2015 Jun 2015 pro-forma* * including the effect of the 320 million capital increase of July % UNENCUMBERED ASSETS AS OF JUNE % 20% encumbered 25% unencumbered 75% ICR H H In addition to its conservative capital structure and vast experience in accessing capital markets that enable AT to finance its future growth, the Company holds a high amount of liquid assets and thereby the ability to make additions to its portfolio on an opportunistic basis. As of June 2015 AT holds 225 million in cash and liquid assets and is further supported by an additional 320 million from the equity increase done in July


16 BOARD OF DIRECTORS REPORT 63% Vehicle with main focus: Hotel properties Camelbay 100% privately owned Commercial Portfolio 34% Vehicle with main focus: Residential properties public company public company 14

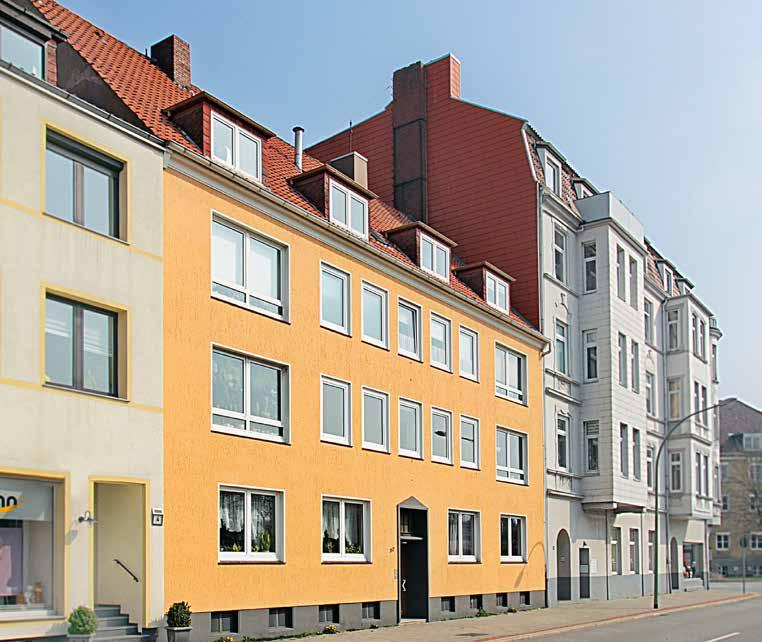
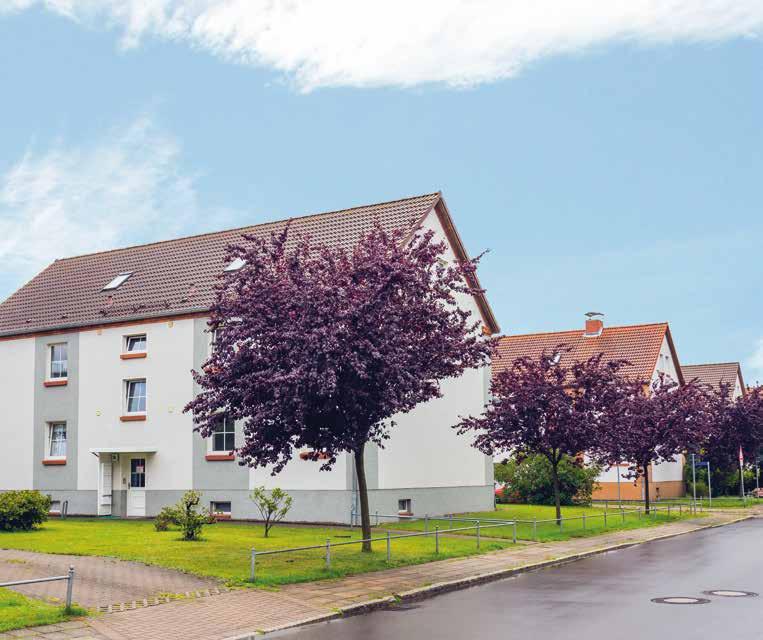
17 HOTEL PROPERTIES RESIDENTIAL PROPERTIES Kiel Stralsund / Rügen COMMERCIAL PROPERTIES Bremerhaven Hamburg Bremen Osnabrück Hamm Dortmund Essen Velbert Duisburg Monchengladbach Solingen Hagen Neuss Wuppertal Mettmann Düsseldorf Erkrath Cologne Hürth Bonn Hanover Braunschweig Bielefeld Kassel Halle Potsdam Dessau Leipzig Berlin Dresden Frankfurt Mainz Kaiserslautern Saarbrücken Mannheim Nuremberg Baden-Baden Stuttgart Munich Bad Reichenhall 15


18 BOARD OF DIRECTORS REPORT AT S PROPERTY PORTFOLIO COMMERICAL PROPERTIES AT holds through Camelbay, a wholly owned private subsidiary, commercial assets. The objects are in diverse urban centers with strong demographics and favorable economic fundamentals which provide tailwind for repositioning the portfolio. The investments are spread primarily across 2 major commercial real estate segments offering intra-diversification benefits to the Commercial Portfolio, primarily consisting of office and retail properties. The tenant base includes approximately 1,000 tenants spread across a wide range of sustainable market sectors. This further reduces cluster risk while a WALT of 5 years offers cash flow security. The Commercial Portfolio generates rental income at a run rate (July 15 annualized) of 92 million, reflecting an in-place rent of 6.5/m 2 and a vacancy rate of 15%. The portfolio exhibits strong growth potential, which partially is included in the July 15 FFO run rate of 53 million. TURNAROUND STAGES BY FAIR VALUE AND VACANCY RATES The management clusters the Commercial Portfolio into stages according to the vacancy rates of the properties to enable a simpler tracking of the turnaround progress. Commercial properties with more than 20% vacancy are classified to be in an early turnaround stage, those exhibiting between 10% and 20% vacancy as advanced turnaround and those that are occupied more than 90% in a stabilized stage. According to this definition 52% of the Commercial Portfolio is in a stabilized stage while 22% and 26% are in an advanced turnaround and early turnaround stage respectively. As acquired assets materialize their turnaround potential, as evident by the reducing vacancy level, they move across the stages and increase the stabilized portion. The ratio indicates that the Commercial Portfolio exhibits strong cash flow generating abilities while containing further upside potential. Advanced turnaround 22% Early turnaround process 26% Stabilized stage 52% 16

19 REGIONAL DISTRIBUTION (BY VALUE) ASSET TYPE (BY VALUE) Other 10% Stuttgart 3% Mannheim 3% Hamburg 6% Munich 20% Storage & Other 6% Industrial/Logistics 11% Kassel 7% Berlin 16% Office 54% Frankfurt 10% NRW 12% Hannover 13% Retail 29% 17

20 BOARD OF DIRECTORS REPORT GCP MAIN FOCUS: RESIDENTIAL PROPERTIES AT holds 34% of Grand City Properties ( GCP ), a leading market player in the German residential market. As of July 2015, Grand City Properties holds 66,000 units in its portfolio and manages additional 22,000 units for third parties. Its holdings are spread across densely populated areas, with a focus on North Rhine-Westphalia, Berlin and the metropolitan regions Leipzig, Halle and Dresden. GCP puts strong emphasis on growing relevant skills in-house to improve responsiveness and generate innovation across processes and departments. Through its 24/7 Service Center and by supporting community building initiatives Grand City Properties established an industry leading service level and lasting relationships with its tenants. REGIONAL DISTRIBUTION (BY VALUE) TURNAROUND STAGES BY UNITS AND VACANCY RATES CHANGE OVER TIME 60% 50% 40% 30% 20% 10% 0% Jul Jul Jul Stabilized stage Early turnaround Advanced turnaround GCP s success is mirrored in the strong performance in the debt and capital markets. In the first 7 months of the year the Company raised 900 million in aggregate amount, issuing 400 million in straight bonds of Series E and 500 million in perpetual hybrid notes in several issuances. GCP s cost of debt is 2%. Others 15% Bremen/Hamburg 5% Nuremberg-Fürth/Munich 4% Mannheim/KL/ Frankfurt/Mainz 6% North Rhine Westphalia 32% GCP holds investment grade credit ratings from Moody s Investors Service at Baa2 and BBB from Standard & Poor s Rating Services. GCP is listed on the Frankfurt stock exchange since 2012 and as of August 2015 has a market cap of 2 billion. GCP has outperformed the market continuously since its IPO, in share, convertible bond, straight bond and hybrid notes performances. Since March 2015, GCP is included in major FTSE EPRA/ NAREIT indices, including FTSE EPRA/NAREIT Global, Developed and Developed Europe. As a result of growing and stronger cash flows, GCP distributed a dividend of 0.20 per share based on its policy to distribute 30% of FFO I. PORTFOLIO GROWTH 88 Dresden/ Leipzig/Halle 21% Berlin 17% Units managed by GCP and owned by third parties Units owned by GCP Grand City Properties portfolio generates FFO at a run rate (July 2015 annualized) of 130 million and rental income at a run rate of 355 million. The current portfolio has an in-place rent of 5.3/m 2 at a vacancy rate on rentable sqm of 12%. Following significant growth, the Company believes that its current portfolio inhibits strong upside potential with 90% of its in-place rents below market levels and in excess of 30% potential on the current rental income run rate including vacancy reduction. GCP distinguishes in its portfolio between stabilized properties with vacancy rates below 5%, advanced turnaround properties with vacancy rates between 5% and 15% and early turnaround properties with vacancy rates above 15%. As of July 2015 approx. 42% of its portfolio (half of the portfolio in terms of value) fall within the stabilized segment, approx. 31% in advanced turnaround and 27% in early turnaround. The increase in the stabilized portion in comparison to year-end 2014, where 40% of the portfolio was stabilized, is a direct result of the successful turnaround execution of the Company JUL

21 SHARE PRICE PERFORMANCE COMPARISON Grand City Properties S.A. (GYC) +469% +56% FTSE EPRA/Nareit Germany Index (EPGR) (rebased) Jul 12 Sep 12 Nov 12 Jan 13 Mar 13 May 13 Jul 13 Sep 13 Nov 13 Jan 14 Mar 14 May 14 Jul 14 Sep 14 Nov 14 Jan 15 Mar 15 May 15 Aug 15 CONVERTIBLE BOND PRICE PERFORMANCE COMPARISON Feb 14 Apr 14 Jun 14 Aug 14 Oct 14 Dec 14 Feb 15 Apr 15 Jun 15 GYC DW LEG TAG Aug 15 SERIES D SPREAD OVER MID- -SWAP HYBRID NOTES SPREAD OVER MID- -SWAP : S&P rating upgrade to BBB- Oct 14 Dec : Moody s assignment of Baa2 rating Feb 15 Mar 15 May 15 Current Spread: 1.35% : S&P rating upgrade to BBB Jul 15 Aug Feb 15 Mar 15 Apr 15 May : S&P rating upgrade to BBB Jun 15 Current Spread: 3.93% Jul 15 Aug 15 RATING ACHIEVEMENTS Moody s Baa2 S&P BBB S&P BBB- S&P BB+ Feb 14 Jul 15 19
.")

22 BOARD OF DIRECTORS REPORT PCI MAIN FOCUS: HOTEL PROPERTIES The Group s hotel properties are held in Primecity ( PCI ), a specialist hotel real estate company with a strong growth record. Primecity is listed on the Euronext Paris stock exchange segment Alternext. The Company s hotel portfolio includes 52 hotels as of July 2015 with approximately 8,300 rooms ( Hotel Portfolio ). Most of Primecity s hotels are branded with globally leading brands and hold primarily 4 star ratings. PCI is an asset owner and monitors and communicates with the operator on an ongoing basis. PCI was listed in November 2014 on Euronext Paris stock exchange and as of August 2015 the market cap is 360 million. PCI targets its investments in underperforming assets which are located in commercially attractive locations primarily in Germany. These markets offer favorable fundamentals that will support profits and growth in the foreseeable future. The Hotel Portfolio is located in attractive tourism and business locations such as Berlin, Munich, Hamburg, Frankfurt, Dresden, Düsseldorf, Mannheim and Leipzig. PCI believes its business platform profits from its skilled personnel and reliable practices that enable PCI to continue to perform strongly and to further expand in the hotel property market. PCI believes that the business environment provides abundant acquisition opportunities in the attractive markets it targets, to support its external growth strategy in the medium to long term. HOTEL PORTFOLIO COMPOSITION BY STAR CATEGORY (BY VALUE) 15% 3 Stars 5% 2 Stars 80% 4 Stars PCI leases out the hotels to external hotel operators which are selected according to their capabilities, track record and experience. PCI is participating in the branding decision of the hotel, applying its expertise in selecting the optimal brand. An integral component of the business plan is a long term fixed rental lease, which increases the cash flow visibility. Primecity s 52 hotels generate lease revenue at a run rate of 44 million and FFO of 24 million as of July A strong deal pipeline and favorable market conditions provide further upside potential for the future. HOTEL ASSETS & ROOMS CAGR Hotel Rooms +103% 8, , Hotel Rooms 5, , Hotel Assets 2, Mar 15 Jun 15 Jul 15 20

23 HOTEL BRANDS 21
")
24 BOARD OF DIRECTORS REPORT NOTES ON BUSINESS PERFORMANCE SELECTED CONSOLIDATED INCOME STATEMENT DATA for the 6 months ended June 30, Revenue 46, ,809 Pro-forma - Rental and operating income* 46,172 10,542 Capital gains, property revaluations and other income 438, ,723 Share in profit from investment in equityaccounted investees 62, Property operating expenses (8,118) (43,677) Administrative and other expenses (2,363) (3,832) Operating profit 536, ,709 Adjusted EBITDA 61,089 25,652 Finance expenses (5,969) (15,007) Other financial results 11,291 8,204 Current tax expenses (2,448) (4,825) Deferred tax expenses (33,832) (9,510) Profit for the period 505, ,571 * assuming deconsolidation of GCP S.A. in 2014 REVENUE for the 6 months ended June 30, Rental and operating income 46, ,309 Revenue from sales of buildings - 14,500 Revenue 46, ,809 for the 6 months ended June 30, Pro-forma - Rental and operating income * 46,172 10,542 * assuming deconsolidation of GCP S.A. in 2014 In the first six months of 2015 the Group generated rental and operating income of 46.2 million, compared to million in the first six months The decrease in rental and operating income in comparison to the same period in 2014 is solely due to the deconsolidation of GCP at year-end 2014, as from 2015 the Company s interest in GCP s net profit is accounted for through share in profit from investment in equity accounted investees and not in each item of the P&L. Excluding the rental and operating income contribution of GCP in the first half of 2014, enabling suitable comparability between the two periods, rental and operating income rose from 10.5 million in H to 46.2 million in H1 2015, an increase of 338%. In the second quarter of 2015 alone the rental and operating income amounted to 26.1 million, a 30% increase in comparison to first quarter of 2015, mainly due to the growth of the portfolio. The reported rental and operating income figure does not reflect the full impact of the portfolio, as properties acquired during the period were unable to fully contribute for the whole period. AT follows a buy-and-hold strategy and sells mainly non-core assets. Whereas AT sold in 2014 through its investee, GCP, non-core assets which were presented as inventory for gross proceeds of 14.5 million the Company did not sell properties in the first six months of

25 SHARE IN PROFIT FROM INVESTMENT IN EQUITY-ACCOUNTED INVESTEES for the 6 months ended June 30, Share in profit from investment in equityaccounted investees 62, The share in profit from investment in equity accounted investees amounted in H to 62.2 million and represents AT s share in GCP s profit for this period and is a direct result of GCP s strong profitability and value creation. AT didn t have any material equity-accounted investee in the first six months of 2014, as GCP was consolidated during 2014, and thus the share in profit of investees for the comparable period amounted to below 1 million. The substantial difference is merely due to the deconsolidation and representation of GCP s contribution in this item. CAPITAL GAINS, PROPERTY REVALUATIONS AND OTHER INCOME for the 6 months ended June 30, Capital gains, property revaluations and other income 438, ,723 Capital gains, property revaluations and other income is mirroring the Group s value creation capability through its turnaround activities. This value creation is reflected through both revaluation gains and profit arising from business combinations, reflecting the increase in fair value of the Company s assets. In the first six months of 2015 capital gains, property revaluations and other income resulted in a million gain, up from 124 million in the first six months of The increase between the two periods is mainly due to the accumulation of commercial assets exhibited in the last 12 months and was supported by strong turnaround gains from the hotel portfolio. PROPERTY OPERATING EXPENSES for the 6 months ended June 30, Property operating expenses (8,118) (43,677) Property operating expenses amounted to 8.1 million in the first six months of 2015 compared to 43.7 million in the first six months of The difference is mainly a result of the deconsolidation of GCP at the end of Property operating expenses are related to ancillary costs recoverable from the tenants, such as insurance and energy expenses, as well as maintenance, personnel expenses related to the operations and other non-recoverable costs. ADMINISTRATIVE AND OTHER EXPENSES for the 6 months ended June 30, Administrative and other expenses (2,363) (3,832) Administrative and other expenses decreased from 3.8 million in the first half of 2014 to 2.4 million in the comparable period of The decrease is mainly a result from the deconsolidation of GCP at the end of Administrative and other expenses include among others personnel expenses, legal and auditing costs and marketing expenses. This item mainly consists of expenses from the Company s subsidiaries Primecity and Camelbay but also includes administrative expenses from the Aroundtown management level. The Group has successfully established a scalable platform that will enable it to effectively manage the deal flow expected due to its growth strategy and well stocked pipeline. The Company is following a successful value-add strategy and generally seeks to acquire mismanaged real estate properties which embed considerable upside potential. The upside is captured through the ability of the Company to implement its turnaround focused business plans, thereby increasing rents and occupancy levels, reducing costs and extending the WALT which leads to stronger cash flows and ultimately to value creation. The value creation of AT is applied on existing as well as newly acquired assets. In several cases, AT s turnaround strategy is being executed prior to finalizing the takeover of an asset, through negotiating terms with prospective tenants, optimizing the cost allocation and applying economies of scale benefits. The early involvement of the Group results in a significant value creation not long after the takeover process has been completed. 23
 Net finance expenses amounted to a net income of 5.3 million in the first six months of 2015, compared to an expense of 6.")

26 BOARD OF DIRECTORS REPORT NOTES ON BUSINESS PERFORMANCE NET FINANCE EXPENSES for the 6 months ended June 30, Finance expenses (5,969) (15,007) Other financial results 11,291 8,204 Net finance expenses 5,322 (6,803) Net finance expenses amounted to a net income of 5.3 million in the first six months of 2015, compared to an expense of 6.8 million in the first six months of the previous year. The change stems primarily from the deconsolidation of GCP as well as the positive result in other financial results. The latter are of non-recurring nature and mostly relate to the changes in fair value of derivatives and traded securities, and oneoff costs such as expenses from capital market activities. PROFIT FOR THE PERIOD for the 6 months ended June 30, Profit for the period 505, ,571 Basic earnings per share in Diluted earnings per share in The profit generated over the first six months of 2015 amounted to million. This strong result stems from the considerable growth of the Company, the value creation and the operational achievements that occurred over the first six months of the year. Earnings per share in H amounted to 0.83 per share, reflecting an increase of 388% in comparison to H Finance expenses decreased as a result of the deconsolidation of GCP from 15.0 million in the first half of 2014 to 6.0 million in the first half of Through its various capital market activities and recent bank debt raising the Group was able to benefit from favorable financing conditions resulting in low interest rates and long maturities. TAXATION for the 6 months ended June 30, Current tax expenses (2,448) (4,825) Deferred tax expenses (33,832) (9,510) Tax and deferred tax expenses (36,280) (14,335) Tax and deferred tax expenses increased from 14.3 million in H1 14 to 36.3 million in the first six months of 2015, a combined result of a decrease in current taxes and an increase in deferred taxes. The decrease in current tax expenses, which include income and property taxes, stems from the deconsolidation of GCP which was partially offset by the operational growth of the Group. Deferred tax expenses, a non-cash item which is connected to the revaluation gains, make up the majority of the rise in total tax expenses with 33.8 million and rose significantly due to the value creation of AT s assets over the period. This item mirrors on one side the Company s value creation ability and on the other its conservative deferred tax approach. 24

27 NOTES ON BUSINESS PERFORMANCE CASH FLOW for the 6 months ended June 30, Net cash provided by operating activities 50,607 68,841 Net cash used in investing activities (703,662) (393,799) Net cash provided by financing activities 707, ,854 Net increase in cash and cash equivalents 54,264 79,896 The net cash flow provided by operating activities amounted to 50.6 million for the first six months of The decrease compared to the comparable period in 2014 is the result from the deconsolidation of GCP starting The result in the first half year of 2014, without taking into account the GCP contribution, amounted to 8.3 million. The significant increase in net cash provided by the operating activities of the Hotel and Commercial assets is a result of the external growth over the first six months as well as the operational improvements of the existing assets. The increase in net cash used for investing activities reflects the Company s external growth which sources are reflected in the cash flow from financing activities such as two tap issuances of the straight bond in January 2015 and the convertible issued by PCI in February 2015 as well as the convertible bond issued on the AT level in April
 (123,723) Result on disposal of Inventories - trading properties - (250) Share in profit from investment in equity-accounted investees (62,160) (936) Adjustment for 2015 GCP operational")
28 BOARD OF DIRECTORS REPORT NOTES ON BUSINESS PERFORMANCE ADJUSTED EBITDA AND FFO for the 6 months ended June 30, EBITDA 536, ,112 Capital gains, property revaluations and other income (438,488) (123,723) Result on disposal of Inventories - trading properties - (250) Share in profit from investment in equity-accounted investees (62,160) (936) Adjustment for 2015 GCP operational contribution* 25,347 Adjustment for 2014 GCP actual holdings rate* - (32,551) Adjusted EBITDA 61,089 25,652 * in 2014 GCP was consolidated and the adjustment is to reflect the Company s share in GCP s adjusted EBITDA. Starting 2015 GCP is not consolidated, the respective result attributed to Aroundtown is added back. The adjusted EBITDA is a measure of the operational performance of the portfolio, calculated by deducting non-operational items such as capital gains, revaluations and disposal gains from the EBITDA. We further reconcile the calculation of the adjusted EBITDA to reflect the recurring operational results by adjusting the Group s investment in equity accounted investees. The adjusted EBITDA calculation substitutes the results of share of profit from investments in equity accounted investees, deriving from the total share in GCP s profit, with the Group s share in GCP s operational results, and thus presenting a strictly operational performance measurement. Adjusted EBITDA has amounted in the first six months of 2015 to 61.1 million, an increase of 138% compared to the first six months of The strong operational performance is due to the success of the turnaround process of the Group s assets, resulting in higher occupancy and higher rent and is supported by the significant portfolio growth between the two periods. As a significant amount of the portfolio was acquired at the end of the first half year of 2015 and had a small contribution to the periodic result, this item does not reflect the full effect of the total portfolio. The adjusted EBITDA monthly annualized run rate as of July 2015, reflecting the existing portfolio s monthly annualized adjusted EBITDA generation, without assuming any future operational improvements and further acquisitions amounts to 167 million. ADJ. EBITDA (in million) for the 6 months ended June 30, Adjusted EBITDA 61,089 25,652 Finance expenses (5,969) (15,007) Current tax expenses (2,448) (4,825) FFO I adjustment for GCP & PCI holdings rate* (12,487) 10,237 FFO I 40,185 16,057 FFO I per share (in cent) *in 2014 GCP was consolidated and the adjustment is to reflect the Company s share in GCP`s FFO I. Starting 2015 GCP is not consolidated, thus the respective result attributed to Aroundtown is added back. Furthermore, the FFO I calculation is adjusted to include AT s share in PCI in both periods. FFO I PER SHARE in cent CAGR 2012-July % H % H Run rate annualized (12*July 15) (H1*2) H


29 NOTES ON BUSINESS PERFORMANCE Funds From Operation I (FFO I) is a measure of the materialized bottom line operational profit, calculated by deducting current tax expenses and finance expenses from the adjusted EBITDA. We reconcile the calculation of the Group s FFO I to reflect the actual holding rate of AT in PCI and GCP and thus better indicate the operational profit attributed to the owners of the Company. Therefore, since the Group had a 56% holding in PCI in the first half of 2015, we deduct 44% of PCI s FFO I contribution in the adjustment. As of August 2015, the Group has increased its holdings in PCI to 63%. As GCP is not consolidated in 2015, we add back the relative GCP FFO I attributed to the holding of AT in GCP of 34%. Therefore, the respective actual FFO I of the Company amounted to 40.2 million in the first six months of 2015, which reflects a 150% increase compared to the respective period in Accordingly, the FFO I per share amounts to 0.08 per share. FFO I (in million) CAGR 2012-July % The periodic FFO I result does not reflect the full impact of the portfolio, as a significant amount of assets was added during and towards the end of the reporting period and has contributed only partially to the result. The monthly annualized FFO I run rate reflects the portfolio s full cash generating ability without accounting for operational improvements or further acquisitions. The FFO I run rate as of July 2015 amounts to 97 million. ASSETS Jun 2015 Dec 2014 as of Non-current assets 2,839,136 1,543,865 Current assets 255, ,704 Total assets 3,094,934 1,721,569 The Company s total assets increased by 80% in the first six months of 2015 from year-end 2014 to 3.1 billion, of which 2.8 billion refer only to non-current assets. The increase is the result from the materialized growth the Company is currently following. The growth is fueled by acquisitions, value creation and the share of the Company s interest in GCP s profits. Current assets are mainly made up of cash and liquid assets as the Company maintains its financial flexibility in order to take advantage of investment opportunities when they arise. As of June 30, 2015 the Group holds 225 million of cash and liquid assets. Including the July 2015 equity increase, the Group holds additional 320 million cash which provides substantial additional firepower for further acquisitions H Run rate annualized (12*July 15) (H1*2) The increase in the operational measures mirror the strong operational performance of the Group between the two reporting periods. Moreover, the higher growth in the FFO I in comparison to the adjusted EBITDA growth exhibits the Group s capability to decrease the cost of debt and extract further operational profits. 27

30 BOARD OF DIRECTORS REPORT NOTES ON BUSINESS PERFORMANCE LIABILITIES Jun 2015 Dec 2014 as of Total bank debt 292, ,209 Straight bonds 187, ,522 Convertible bonds 562,771 96,728 Deferred tax liabilities 105,434 46,614 Other long term liabilities and derivative financial instruments 108,634 6,198 Other current liabilities 95,059 11,637 Total liabilities 1,351, ,908 The Company seeks to maintain a well-balanced financing source structure of bank debt, straight and convertible bonds, whereas each financing option is evaluated based on keeping financing costs low and retaining a high degree of financial flexibility. The Company is utilizing the current interest environment and seeks to further capitalize on its market stand and reputation, also through its subsidiaries. The financing activities are conducted on the AT level as well as on the level of PCI, Camelbay and GCP. Besides an increase in bank debt of 104 million since year-end 2014 AT, together with its public entities, has been successfully active in the capital markets in the first six months of AT tapped up its existing straight bond in January 2015 by around 40 million to 200 million in total and issued a convertible bond at the principal amount of 450 million and a coupon of 3% p.a. in April Both issuances were executed even before the listing in June 2015, proving the Company s exceptional access to capital markets. In February 2015, AT s public subsidiary, PCI, tapped up its convertible bond as well by 50 million, totaling to 150 million. The balance of the convertible bonds have been offset by conversions and amounts to 563 million as of June 30, The financing structure reflects the strategic decision of the Board of Directors to operate in a conservative leverage environment, allowing the Company to carefully select only accretive growth opportunities and focus on the turnaround process of its assets in the long run. This conservative approach is reflected in the Company s strong interest coverage ratio of 6.0 and LTV of 33%. The increase of deferred tax liabilities results from the successful value creation of the Group s assets which result from the successful implementation of the turnaround strategy. The Company practices a conservative approach with regard to its deferred tax liabilities, accounting for the fully applicable German real estate tax (15.825%) for the theoretical sale of properties through asset deals. 28


31 NOTES ON BUSINESS PERFORMANCE NET DEBT Jun 2015 Dec 2014 as of Total bank debt and straight bonds 479, ,731 Cash and liquid assets 224, ,750 Total net debt without convertible bonds 254, ,981 Convertible bonds 562,771 96,728 Total net debt with convertible bonds 817, ,709 Taking into account the Company s balance of cash and liquid assets, the net debt balance as of June 2015 amounts to 255 million and including the convertible bonds to 818 million. After the reporting period additional 22 million of the convertible bonds have been converted. LOAN-TO-VALUE Jun 2015 Dec 2014 as of Investment property* 1,480, ,486 Investment in equityaccounted investees 969, ,435 Total Value 2,449,533 1,359,921 Total bank debt 292, ,209 Straight bonds 187, ,522 Convertible bonds 562,771 96,728 Minus: Cash and liquid assets 224, ,750 Net Debt 817, ,709 LTV 33% 19% Pro-forma LTV** 20% 19% * including advanced payments ** including the effect of the 320 milllion capital increase of July 2015 The Company s Loan-To-Value ( LTV ) as of June 30, 2015 was 33% up from 19% as of year-end The increase results from the growth of the Company which was partially financed with debt from a well-balanced mix of bank debt, straight and convertible bonds. The low LTV reflects the Company s conservative capital structure and also provides a substantial financial headroom to fund the Company s further growth. The pro-forma LTV includes the capital increase of 320 million which was carried out in July 2015 and amounts to 20%. The LTV is calculated as the difference between the sum of bonds and total bank debt offset by cash & liquid assets, divided by the sum of the investment properties (including advanced payments) and investments in equity accounted investees. 29

32 BOARD OF DIRECTORS REPORT NOTES ON BUSINESS PERFORMANCE EQUITY RATIO Jun 2015 Dec 2014 as of Total Equity 1,743,391 1,221,661 Total Assets 3,094,934 1,721,569 Equity Ratio 56% 71% Pro-forma Equity Ratio* 60% 71% * including the effect of the 320 milllion capital increase of July 2015 EPRA NAV Jun 2015 Dec 2014 as of Total Equity 1,743,391 1,221,661 Fair Value measurements of derivative financial instruments 4,195 4,995 Deferred tax liabilities 105,434 46,614 EPRA NAV 1,853,020 1,273,270 Pro-forma EPRA NAV* 2,173,020 1,273,270 TOTAL EQUITY (in million) 2,500 2,000 CAGR Jun 2015 pro-forma +119% 1,743 2,063 * including the effect of the 320 milllion capital increase of July 2015 EPRA NAV in June 30, 2015 amounted to 1.85 billion, up from 1.27 billion in year-end 2014, an increase of 46%. The increase results from the generated net profit in the first six months of 2015 and an increase in the balance of deferred tax liabilities. The significant increase in the EPRA NAV mirrors the Company s growth and the ability to create substantial value. Pro-forma EPRA NAV includes the capital increase of 320 million which was carried out in July 2015 and amounts to 2.17 billion. 1,500 1,222 EPRA NAV (in thousands) 2,500,000 1, ,000,000 CAGR Jun 2015 pro-forma +131% 1,853,020 2,173, ,500,000 1,273, June 2015 June 2015 pro-forma 1,000, , , , June 2015 June 2015 pro-forma 30


33 DISCLAIMER The financial data and results of the Group are affected by financial and operating results of its subsidiaries. Significance of the information presented in this report is examined from the perspective of the Company including its portfolio with the joint ventures. In several cases, additional information and details are provided in order to present a comprehensive representation of the subject described, which in the Group s view is essential to this report. These condensed interim consolidated financial statements have not been reviewed by the auditor. By order of the Board of Directors, Larnaca, Cyprus, August 28, 2015 Jelena Afxentiou Director Reshef Ish-Gur Director Elena Koushos Director 31
34 INTERIM CONSOLIDATED STATEMENT OF COMPREHENSIVE INCOME INTERIM CONSOLIDATED STATEMENT OF COMPREHENSIVE INCOME For the six months ended June 30, For the three months ended June 30, Note Revenue 46, ,809 26,075 54,402 Capital gains, property revaluations and other income 4 438, , ,711 45,088 Share in profit from investment in equity-accounted investees 62, , Property operating expenses (8,118) (43,677) (5,851) (21,809) Cost of buildings sold - (14,250) - - Administrative and other expenses (2,363) (3,832) (1,310) (2,126) Operating profit 536, , ,871 75,942 Finance expenses (5,969) (15,007) (2,834) (8,349) Other financial results 11,291 8, ,777 Net finance expenses 5,322 (6,803) (2,383) (1,572) Profit before tax 541, , ,488 74,370 Current tax expenses 5 (2,448) (4,825) (1,454) (3,219) Deferred tax expenses 5 (33,832) (9,510) (15,533) (3,165) Tax and deferred tax expenses (36,280) (14,335) (16,987) (6,384) Profit for the period 505, , ,501 67,986 Other comprehensive income for the period Total comprehensive income for the period 505, , ,501 67, The notes on pages 44 to 56 form an integral part of these interim consolidated financial statements.

35 INTERIM CONSOLIDATED STATEMENT OF COMPREHENSIVE INCOME (CONTINUED) For the six months ended June 30, For the three months ended June 30, Profit attributable to: Owners of the Company 416,402 86, ,456 36,648 Non-controlling interests 88,979 75,100 57,045 31,338 Total comprehensive income for the period 505, , ,501 67,986 Net earnings per share attributable to the owners of the Company (in euro): Basic earnings per share Diluted earnings per share The notes on pages 44 to 56 form an integral part of these interim consolidated financial statements. 33
36 INTERIM CONSOLIDATED STATEMENT OF FINANCIAL POSITION INTERIM CONSOLIDATED STATEMENT OF FINANCIAL POSITION June 30 December Unaudited Audited Assets Note Equipment and intangible assets 4,663 4,543 Investment property 6 1,469, ,303 Advanced payment for investment property 10,958 25,183 Investment in equity-accounted investees 969, ,435 Deferred tax assets Other long term assets 384, ,499 Non-current assets 2,839,136 1,543,865 Cash and cash equivalents 82,258 27,994 Short term deposits 2,768 1,718 Trade securities at fair value through profit and loss 139, ,038 Trade and other receivables 30,888 1,954 Current assets 255, ,704 Total assets 3,094,934 1,721, The notes on pages 44 to 56 form an integral part of these interim consolidated financial statements.


37 The notes on pages 44 to 56 form an integral part of these interim consolidated financial statements. 35
38 INTERIM CONSOLIDATED STATEMENT OF FINANCIAL POSITION INTERIM CONSOLIDATED STATEMENT OF FINANCIAL POSITION (CONTINUED) June 30 December Unaudited Audited Equity Note Share capital 8 5, Retained earnings and capital reserves 8 1,535,913 1,113,531 Equity attributable to the owners of the Company 1,540,913 1,113,569 Non-controlling interests 202, ,092 Total equity 1,743,391 1,221,661 Liabilities Loans and borrowings 7 240, ,964 Straight bonds 7 187, ,522 Convertible bonds 7 562,771 96,728 Derivative financial instruments 4,195 4,995 Deferred tax liabilities 105,434 46,614 Other long term liabilities 104,439 1,203 Non-current liabilities 1,204, ,026 Credit from financial institutions 44,501 42,390 Current portion of long term loans 7 7,927 6,855 Trade and other payables 87,258 8,725 Tax payable 1,875 1,756 Provisions and current liabilities 5,926 1,156 Current liabilities 147,487 60,882 Total liabilities 1,351, ,908 Total equity and liabilities 3,094,934 1,721,569 The Board of Directors of Aroundtown Property Holdings PLC authorized these condensed interim consolidated financial statements for issuance on August 28, Jelena Afxentiou Director Larnaca The notes on pages 44 to 56 form an integral part of these interim consolidated financial statements. Reshef Ish-Gur Director Larnaca Elena Koushos Director Larnaca


39 The notes on pages 44 to 56 form an integral part of these interim consolidated financial statements. 37
40 INTERIM CONSOLIDATED STATEMENT OF CHANGES IN EQUITY INTERIM CONSOLIDATED STATEMENT OF CHANGES IN EQUITY FOR THE SIX MONTH PERIOD ENDED JUNE 30, 2015 Share capital Attributable to the owners of the Company Other reserves Retained earnings Total Noncontrolling interests Total equity Balance as at December 31, 2014 (Audited) 38 7,416 1,106,115 1,113, ,092 1,221,661 Profit for the period , ,402 88, ,381 Other comprehensive income for the period Total comprehensive income for the period , ,402 88, ,381 Issuance of ordinary shares 4, ,962-4,962 Issuance of convertible bonds - 4,029-4,029-4,029 Non-controlling interests arising from initially consolidate companies ,075 7,075 Transactions with non-controlling interests - - 1,951 1,951 (1,668) 283 Balance as at June 30, 2015 (Unaudited) 5,000 11,445 1,524,468 1,540, ,478 1,743,391 Balance as at December 31, 2013 (Audited) 10 7, , , , ,664 Profit for the period ,471 86,471 75, ,571 Other comprehensive income for the period Total comprehensive income for the period ,471 86,471 75, ,571 Non-controlling interests arising from initially consolidate companies ,589 9,589 Transaction with non-controlling interests (6,509) (6,508) Balance as at June 30, 2014 (Unaudited) 10 7, , , ,084 1,036, The notes on pages 44 to 56 form an integral part of these interim consolidated financial statements.


41 The notes on pages 44 to 56 form an integral part of these interim consolidated financial statements. 39
42 INTERIM CONSOLIDATED STATEMENT OF CASH FLOWS INTERIM CONSOLIDATED STATEMENT OF CASH FLOWS Cash flows from operating activities Note For the six months ended June 30, Profit for the period 505, ,571 Adjustments for the profit: Depreciation and amortization Capital gains, property revaluations and other income (438,488) (123,723) Share in profit from investment in equity-accounted investees (62,160) (936) Finance expenses, net (5,322) 6,803 Tax and deferred tax expenses 5 36,280 14,335 35,742 58,453 Changes in: Change in inventories Trading property - 14,402 Trade and other receivables (10,655) (21,530) Trade and other payables 27,416 22,153 Provisions for other liabilities and charges (672) (491) 51,831 72,987 Tax paid (1,224) (4,146) Net cash provided by operating activities 50,607 68,841 Cash flows from investing activities Acquisitions and disposals of equipment and intangible assets, net (170) (1,179) Capex, investments and acquisition of investment property and advances paid (379,574) (313,978) Acquisition and disposals of subsidiaries, net of cash acquired or disposed 4 (265,317) (30,303) Investment in trade securities and other financial assets, net (58,601) (48,339) Net cash used in investing activities (703,662) (393,799) 40 The notes on pages 44 to 56 form an integral part of these interim consolidated financial statements.

43 The notes on pages 44 to 56 form an integral part of these interim consolidated financial statements. 41
 (6,406) Proceeds (repayments) of loans from financial institutions and others, net")
44 INTERIM CONSOLIDATED STATEMENT OF CASH FLOWS INTERIM CONSOLIDATED STATEMENT OF CASH FLOWS (CONTINUED) For the six months ended June 30, Note Cash flows from financing activities Proceeds from straight and convertible bonds, net 7 515, ,519 Amortization of loans from financial institutions (3,484) (6,406) Proceeds (repayments) of loans from financial institutions and others, net 212,941 (10,080) Transactions with non-controlling interests (8,586) (6,508) Finance expenses paid, net (8,647) (15,671) Net cash provided by financing activities 707, ,854 Increase in cash and cash equivalents 54,264 79,896 Cash and cash equivalents at the beginning of the period 27, ,443 Cash and cash equivalents at the end of the period 82, , The notes on pages 44 to 56 form an integral part of these interim consolidated financial statements.

45 The notes on pages 44 to 56 form an integral part of these interim consolidated financial statements. 43
46 CONDENSED NOTES TO THE INTERIM CONSOLIDATED FINANCIAL STATEMENTS CONDENSED NOTES TO THE INTERIM CONSOLIDATED FINANCIAL STATEMENTS 1. GENERAL (A) INCORPORATION AND PRINCIPAL ACTIVITIES Aroundtown Property Holdings PLC ( the Company ) was incorporated on May 7, 2004 as a private limited liability company under the Cyprus Companies Law, Cap Its Registered Office is at Faros Avenue, Spyros Thalassines Alkyonides, 7560 Pervolia, Larnaca, Cyprus. The Company, together with its investees (hereinafter: the Group ), is a specialist real estate investment group, focusing in the German real estate markets. The Group covers the main real estate properties which benefit from strong fundamentals and growth prospects: residential (through its holding in Grand City Properties S.A.), commercial and hotel properties. The Group s vision is buying, redeveloping, turning around and optimizing real estate properties in Germany. These condensed interim consolidated financial statements ( interim financial statements ) for the six month period ended June 30, 2015 consist of the financial statements of the Group. (B) CAPITAL AND BONDS INCREASES For information about bonds and capital increases, please see notes 7 and 8, respectively. (C) DEFINITIONS Throughout these notes to the interim financial statements: The Company Aroundtown Property Holdings PLC The Group The Company and its investees Subsidiaries Companies that are controlled by the Company (as defined in IFRS 10) and whose financial statements are consolidated with those of the Company Associates Companies over which the Company has significant influence (as defined in IAS 28) and that are not subsidiaries. The Company s investment therein is included in the consolidated financial statements of the Company using equity method of accounting Investees Subsidiaries, jointly controlled entities and associates GCP S.A. Grand City Properties S.A. (an associate of the Company) PCI; Camelbay Primecity Investment PLC, Camelbay Limited (a subsidiary of the Company) Related parties As defined in IAS 24 The period The six months ended on June 30,

47 45

48 CONDENSED NOTES TO THE INTERIM CONSOLIDATED FINANCIAL STATEMENTS 2. BASIS OF PREPARATION A. STATEMENT OF COMPLIANCE These condensed interim consolidated financial statements have been prepared in accordance with IAS 34 interim financial reporting. They do not include all the information required for a complete set of IFRS financial statements. However, selected explanatory notes are included to explain events and transactions that are significant to an understanding of the changes in the Group s financial position and performance since the last annual consolidated financial statements as at and for the year ended December 31, These condensed financial statements have not been reviewed by an auditor. For further information on the accounting and measurement policies used, please refer to the consolidated financial statements as at December 31, 2014, which are the basis for these interim consolidated financial statements. B. JUDGMENTS AND ESTIMATES In preparing these condensed interim consolidated financial statements, management applies judgments, estimates and assumptions that affect the application of accounting policies and the reported amounts of assets and liabilities, income and expenses. Actual results may differ from these estimates. The significant judgments made by management in applying the Group s accounting policies and the key sources of estimation uncertainty are consistent with those that applied to the consolidated financial statements as at and for the year ended December 31, These condensed interim consolidated financial statements were authorized to be issued by the Board of Directors on August 28,


49 2. BASIS OF PREPARATION (CONTINUED) C. OPERATING SEGMENTS The Group meets the definition of operating in one operating segment. An operating segment is a component of the Group that meets the following three criteria: Is engaged in business activities from which it may earn revenues and incur expenses, including revenues and expenses relating to intragroup transactions; whose operating results are regularly reviewed by the Group s chief operating decision maker to make decisions about resources to be allocated to the segment and assess its performance; and For which separate financial information is available. D. SEASONALITY OF OPERATIONS Rental income, other revenues and costs are received and incurred smoothly over the accounting period. Therefore no additional disclosures are made in the condensed interim consolidated financial statements. E. GOING CONCERN These condensed interim consolidated financial statements are prepared on a going concern basis. 47
 BASIS OF CONSOLIDATION The accounting policies adopted in the preparation of the condensed interim consolidated financial statements are consistent with those")
50 CONDENSED NOTES TO THE INTERIM CONSOLIDATED FINANCIAL STATEMENTS 3. SIGNIFICANT ACCOUNTING POLICIES (A) BASIS OF CONSOLIDATION The accounting policies adopted in the preparation of the condensed interim consolidated financial statements are consistent with those followed in the preparation of the Group s annual financial statements for the year ended on December 31, The following standards have been issued but are not yet effective for annual periods beginning on January 1, Those which may be relevant to the Group are set out below. The Group does not plan to early adopt these standards. (I) IFRS 9 FINANCIAL INSTRUMENTS (2009, 2010) IFRS 9 (2009) introduces new requirements for the classification and measurement of financial assets. Under IFRS 9 (2009), financial assets are classified and measured based on the business model in which they are held and the characteristics of their contractual cash flows. IFRS 9 (2010) introduces additional changes relating to financial liabilities. The IASB currently has an active project to make limited amendments to the classification and measurement requirements of IFRS 9 and to add new requirements to address the impairment of financial assets and hedge accounting. IFRS 9 is effective for annual reporting periods beginning on or after January 1, 2018, with early adoption permitted. (II) IFRS 15 REVENUE FROM CONTRACTS WITH CUSTOMERS IFRS 15 establishes a comprehensive framework for determining whether, how much and when revenue is recognized. It replaces existing revenue recognition guidance, including IAS 18 Revenue, IAS 11 Construction Contracts and IFRIC 13 Customers Loyalty Programs. IFRS 15 is effective for annual reporting periods beginning on or after January 1, 2017, with early adoption permitted. The Group has considered the above new standards and will continue to evaluate the impact on the Group s consolidated financial statements. At this time, the impact of the above publications is not expected to be material to the Group s consolidated financial statements. 48


51 49


52 CONDENSED NOTES TO THE INTERIM CONSOLIDATED FINANCIAL STATEMENTS 4. ACQUISITION, DISPOSAL AND DECONSOLIDATE OF SUBSIDIARIES During the reporting period the Group obtained control on several companies through business combinations. The significant net impacts on the interim consolidated statement of comprehensive income and interim consolidated statements of financial position of the Group are as follows: 5. TAXATION Tax and deferred tax expenses are recognized based on management s best estimate of the weighted average annual income tax rate expected for the full financial year multiplied by the pre-tax income of the interim reporting period. The Group tax and deferred tax expenses for the six months ended June 30, 2015, is euro 36,280 thousand (2014: euro 14,335 thousand). The Company recorded euro 1,463 thousand for corporation tax (2014: euro 1,497 thousand), euro 33,832 thousand for deferred tax and euro 985 thousand for property tax (2014: euro 9,510 thousand and euro 3,327 thousand, respectively). Investment property 435,679 Cash and Cash equivalents 8, ,592 Working capital, net (14,129) Other liabilities, net (45,372) Loans from banks (46,869) (106,370) Total identifiable net assets 338,222 Non-controlling interests arising from initial consolidation (7,075) Consideration paid regarding acquisition of subsidiaries (274,230) Profit arising from business combination 56,917 50
")

53 6. INVESTMENT PROPERTY Six months ended June 30 Year ended December Unaudited Audited Balance at the beginning of the period / year 426,303 1,545,051 Additions (disposals) and adjustments during the period / year 607,215 (1,852,774) Investment property arising from initial consolidations 435, ,026 Balance at the end of the period / year 1,469, ,303 51
 562,771 96,728 Straight bonds (D) 187,036 150,522 Total long term 989,988")

54 CONDENSED NOTES TO THE INTERIM CONSOLIDATED FINANCIAL STATEMENTS 7. LOANS AND BORROWINGS A. COMPOSITION June 30 December Unaudited Audited Long term Bank loans 240, ,964 Convertible bonds (B, C) 562,771 96,728 Straight bonds (D) 187, ,522 Total long term 989, ,214 Short term Bank loans 7,927 6,855 B. CONVERTIBLE BONDS IN PCI On November 13, 2014, PCI successfully completed with the placement of euro 100 million convertible bonds maturing in 2019, convertible into ordinary shares of PCI. The convertible bonds bear a coupon of 4% p.a., payable semi-annually in arrears. The initial conversion price was fixed at euro The bonds were issued at 100% of their principal amount and will be redeemed at maturity at 110% of their principal amount. On February 13, 2015, PCI successfully tapped up its convertible bond series with an additional principal amount of euro 50 million. The further convertible bond series was issued at 105% of their principal amount and has the same characteristics of the previous tranche issued in November 2014 and described above. Six months ended June 30 Year ended December Unaudited Audited Balance at the beginning of the period / year 97,254 - Proceeds from issuance of PCI convertible bond (1,000 notes at euro 100,000 par value each) - 100,000 Proceeds from issuance of PCI convertible bond (500 notes at euro 100,000 par value each) (a) 52,500 - Transaction costs (790) (1,782) Net proceeds during the period / year 51,710 98,218 Amount classified as non-controlling interests (a) (489) (1,067) Expenses for the period / year 3, Expenses paid (2,328) - Conversion to ordinary shares of PCI (8,893) (700) Carrying amount of liability at the end of the period / year 141,070 97,254 Non-current portion of Convertible bond series A 138,487 96,728 Accrued interest Total Convertible bond series A 139,218 97,254 Deferred income (a) 1,852 - (a) This amount includes additional euro 2.5 million that were received as part of the bond placement (reflects 5% of the par value), out of which euro 0.5 million were allocated as non-controlling interests according to external economic valuer. The residual amount of euro 2 million was allocated as a deferred income and presented in other long term liabilities account balance. 52

55 7. LOANS AND BORROWINGS (CONTINUED) C. CONVERTIBLE BONDS IN THE COMPANY On May 5, 2015, the Company has successfully completed with the placement of euro 450 million senior, unsecured convertible bonds convertible into new ordinary shares having a par value of euro The bonds were placed by the Company to institutional investor only, with a coupon of 3% p.a., maturity of five years, at an issue price of 95.68% of their principal amount, and will be redeemed at maturity at par. The initial conversion price was set at euro 3.53 (see also note 13a). Six months ended June 30 Year ended December 31, Balance at the beginning of the period / year - - Proceeds from issuance of convertible bond (4,500 notes at euro 100,000 par value each) 430,560 - Transaction costs (2,967) - Net proceeds during the period / year 427,593 - Amount classified as equity (4,029) - Expenses for the period / year 2,775 - Carrying amount of liability at the end of the period / year 426,339 - Non-current portion of Convertible bonds 424,284 - Accrued interest 2,055 - Total Convertible bonds 426,339 - D. STRAIGHT BONDS SERIES A On December 9, 2014, the Company has successfully completed with the placement of euro 161 million (nominal value) of unsubordinated, senior secured straight bonds maturing in December 2021 and bear a coupon of 3% p.a., payable semi-annually in arrears, for a consideration that reflects 94% of their principal amount. During the reporting period, the Company increased its series A bonds in an additional principal amount of euro 39 million for a price of 94% of the nominal value. Therefore the aggregated amount was euro 200 principal amount. Six months ended June 30 Year ended December 31, Unaudited Audited Balance at the beginning of the period / year 150,813 - Proceeds from issuance of Bond series A (1,610 notes at euro 100,000 par value) - 151,340 Proceeds from issuance of Bond series A (390 notes at euro 100,000 par value) 36,660 - Transaction costs (868) (894) Net proceeds during the period / year 35, ,446 Expenses for the period / year 3, Expenses paid (3,000) - Carrying amount of liability at the end of the period / year 187, ,813 Non-current portion of straight bond series A 187, ,522 Accrued interest Total straight bond series A 187, ,813 53
 SECURITY, NEGATIVE PLEDGE The obligations of the Company under the Bonds and any Further Secured Bonds are secured in favor of the Trustee for the benefit of the Trustee, the Bondholders and the")
 Limited, Luxembourg branch, (the Lux PrimeCity Account ); (c) a")
56 CONDENSED NOTES TO THE INTERIM CONSOLIDATED FINANCIAL STATEMENTS 7. LOANS AND BORROWINGS (CONTINUED) E. (1) SECURITY, NEGATIVE PLEDGE The obligations of the Company under the Bonds and any Further Secured Bonds are secured in favor of the Trustee for the benefit of the Trustee, the Bondholders and the holders of any Further Secured Bonds by: (a) a first-ranking charge, governed by the laws of Cyprus, over all ordinary shares held by the Company in its subsidiary, Zaplino Limited ( Zaplino ); (b) a first-ranking account pledge, governed by Luxembourg law, over the bank account held by the Company with Bank Hapoalim (Switzerland) Limited, Luxembourg branch, (the Lux PrimeCity Account ); (c) a first-ranking account pledge, governed by the laws of Cyprus, over the bank account held by the Company with Bank of Cyprus Public Co Ltd. (the Cyprus PrimeCity Account ); (d) first-ranking account pledges, governed by Luxembourg law, over each bank account held by Zaplino with Bank Hapoalim (Switzerland) Limited, Luxembourg branch, (the Zaplino Luxembourg Accounts ); and (e) an assignment by way of security, governed by the laws of Cyprus, of the Company s receivables and rights under, and claims against Zaplino for payment of principal and interest under, the loan agreements between the Company and Zaplino in an aggregate principal amount equal to the net issuance proceeds of the Bonds ( PrimeCity Loans ) and all other loan agreements (of whatever nature and for whatever purpose howsoever described) relating to any loan by the Company to Zaplino of the net issuance proceeds in respect of any Further Secured Bonds. (2) COVENANTS procure that Net Debt shall not exceed (i) at any time, 65% of the Portfolio Value and (ii) 60% of the Portfolio Value for a period of more than six (6) months; not pay a dividend as long as the Net Debt of the Group exceeds 50% of the Portfolio value; not open, maintain or hold any interest in, and will procure that Zaplino will not open, maintain or hold any interest, in each case directly or indirectly, in any account whatsoever with any bank or financial institution except for the Charged Accounts, unless the Issuer or Zaplino, respectively, grant a first-ranking security interest, satisfactory to the Trustee, over the respective account in favor of the Trustee, for the benefit of the Trustee and the Bondholders; and not, and will not permit any of its Subsidiaries to, directly or indirectly, create or permit to exist or become effective any consensual encumbrance or restriction on the ability of any Subsidiary of the Company to (i) make or pay dividends or any other distributions on its share capital to the Company or any of the Company s other Subsidiaries or grant to the Company or any of the Company s other Subsidiaries any other interest or participation in itself or (ii) (a) pay any indebtedness owed to the Company or any of the Company s other Subsidiaries (b) make loans or advances to the Company or any of the Company s other Subsidiaries or (c) transfer any of its properties or assets to the Company or any of the Company s other Subsidiaries. (f) a first-ranking charge, governed by the laws of Cyprus, over all ordinary shares held by the Company in its subsidiary, Camelbay; (g) an assignment by way of security, governed by the laws of Cyprus, of the Company s receivables and rights under, and claims against Camelbay for payment of principal and interest under, the loan agreements between the Company and Camelbay in an aggregate principal amount equal to the net issuance proceeds of the Bonds; and (h) a first-ranking account pledge governed by Luxembourg law, over the Interest Reserve Account. 54
 1,500,000,000 15,000 50,000 85.5 Issued and fully paid Balance as at January 1 (euro 0.01 each, and euro 1.71 each in 2014) 22,200 38 5,550 9.")
57 8. EQUITY A. SHARE CAPITAL June 30, 2015 December 31, 2014 Number of shares Unaudited In thousands of euro Number of shares Audited In thousands of euro Authorized Ordinary shares of euro 0.01 each (euro 1.71 each in 2014) 1,500,000,000 15,000 50, Issued and fully paid Balance as at January 1 (euro 0.01 each, and euro 1.71 each in 2014) 22, , Conversion of shares to nominal value of euro 0.01 per share 3,774, Issuance and payment on authorized shares 496,203,800 4,962 16, RELATED PARTY TRANSACTIONS The transactions and balances with related parties are as follows: (I) LOANS FROM SHAREHOLDERS AND RELATED COMPANIES (*) June 30 December 31 Unaudited Audited (II) INTEREST EXPENSES ON LOANS FROM SHAREHOLDERS AND RELATED COMPANIES For the three months ended March 31, (22) (19) (*) Presented as part of the other long term liabilities in the consolidated statement of financial position.. Balance at the end of the period / year 500,000,000 5,000 22, B. ISSUED CAPITAL 1. Upon incorporation on May 7, 2004, the total authorized, issued and fully paid ordinary share capital amounted to 5,550 units with a par value of euro 1.71 each. 2. On November 28, 2014, the Company issued 16,650 ordinary shares of euro 1.71 each. 3. In February 2015, as a part of capital restructuring process, the Company increased its authorized ordinary shares to 1,500,000,000, out of which the issued and fully paid was increased to 500,000,000, with an adjusted par value of euro 0.01 for each share. 4. On May 5, 2015, the Company successfully placed euro 450 million principal value of convertible bonds convertible into ordinary shares of the Company for an initial conversion price of euro 3.53 per share. These convertible bonds mature after five years and bear coupon of 3% p.a., payable in arrears. The issue price was 95.68% of the principal amount. 5. For a disclosure about an additional share issuance occurred after the reporting period, please refer to note 13a. C. OTHER RESERVES The other reserves comprised of shareholders loan that was converted to equity, which can be distributed at any time, as well as of an equity component which related to the convertible bonds of the Company. 55

58 CONDENSED NOTES TO THE INTERIM CONSOLIDATED FINANCIAL STATEMENTS 10. FINANCIAL INSTRUMENTS AND RISK MANAGEMENT FAIR VALUE HIERARCHY The table below analyzes financial instruments carried at fair value, by the levels in the fair value hierarchy. The different levels have been defined as follows: Level 1: quoted prices (unadjusted) in active markets for identical assets or liabilities. Level 2: inputs other than quoted prices included within Level 1 that are observable for the asset or liability, either directly (i.e. as prices) or indirectly (i.e. derived from prices). Level 3: Inputs for the asset or liabilities that are not based on observable market data (unobservable inputs). June 30, 2015 (Unaudited) Level 1 Level 2 Level 3 Total Trade securities at fair value through profit and loss 139, ,884 Total assets 139, ,884 Derivative financial instruments - 4,195-4,195 Total liabilities - 4,195-4,195 December 31, 2014 (Audited) Trade securities at fair value through profit and loss 146, ,038 Total assets 146, ,038 Derivative financial instruments - 4,995-4,995 Total liabilities - 4,995-4, COMMITMENTS The Group had no significant commitments as at June 30, CONTINGENT ASSETS AND LIABILITIES The Group had no significant contingent assets and liabilities as at June 30, EVENTS AFTER THE REPORTING PERIOD a) On July 13, 2015, the Company successfully issued additional 100,000,000 ordinary shares (of euro 0.01 nominal value each) for euro 3.2 each, by way of private placement to institutional investors ( New Shares ). As a result, the Company s share capital has been increased from euro 5,000 thousand by euro 1,000 thousand, to euro 6,000 thousand. The gross proceeds from the issuance of the New Shares were euro 320 million. The net proceeds will be used to fund the Group s growth strategy. Following the above mentioned New Shares issuance and in accordance with the terms and conditions of the Company s convertible bond series, the Company has adjusted the conversion price for its outstanding convertible bond from euro 3.53 per share to euro per share. b) On July , S&P raised the GCP S.A. s rating on its long-term corporate credit rating to BBB from BBB-. The rating of the GCP S.A. s senior secured and subordinated hybrid debt instruments improved by one notch as well to BBB for its senior secured debt and BB+ for its subordinated hybrid notes. 56
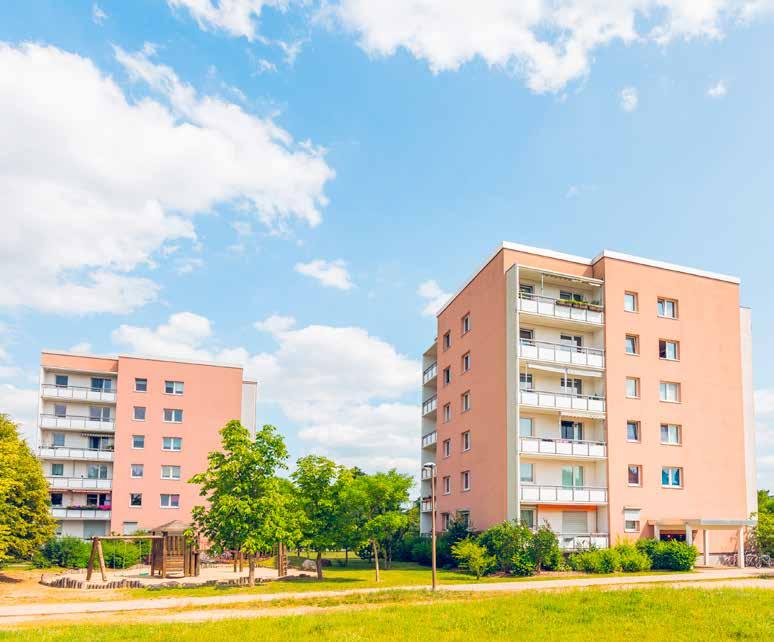

59 57

60 AROUNDTOWN PROPERTY HOLDINGS PLC Faros Avenue, Spyros Thalassines Alkyonides 7560 Pervolia, Larnaca Cyprus
2015 CONSOLIDATED FINANCIAL STATEMENTS FOR THE YEAR ENDED DECEMBER 31,
 2015 CONSOLIDATED FINANCIAL STATEMENTS FOR THE YEAR ENDED DECEMBER 31, CONTENT Board of Directors Report 02-45 Independent Auditors Report 46-47 Consolidated statement of comprehensive income 48-49 Consolidated
FINANCIAL STATEMENTS. For the year ended December 31, 2013
 2013CONSOLIDATED FINANCIAL STATEMENTS For the year ended December 31, 2013 BOARD OF DIRECTORS REPORT REPORT OF THE RÉVISEUR D ENTREPRISES AGRÉÉ (INDEPENDENT AUDITOR) OF COMPREHENSIVE INCOME OF FINANCIAL
CONDENSED INTERIM CONSOLIDATED FINANCIAL STATEMENTS. for the six month period ended June 30, 2015
 CONDENSED INTERIM CONSOLIDATED FINANCIAL STATEMENTS for the six month period ended June 30, 2015 CONTENT 2 Board of Directors report 2 19 Interim consolidated statement of comprehensive income 20 21 Interim
CONDENSED INTERIM CONSOLIDATED FINANCIAL STATEMENTS FOR THE NINE MONTH PERIOD ENDED SEPTEMBER 30, 2016 Q Cologne
 CONDENSED INTERIM CONSOLIDATED FINANCIAL STATEMENTS FOR THE NINE MONTH PERIOD ENDED SEPTEMBER 30, 2016 Q3 2016 Cologne Bremen CONDENSED INTERIM CONSOLIDATED FINANCIAL STATEMENTS FOR THE NINE MONTH PERIOD
Condensed Interim Consolidated Financial Statements
 Condensed Interim Consolidated Financial Statements FOR THE NINE MONTH PERIOD ENDED SEPTEMBER 30, 2018 Berlin Munich Condensed Interim Consolidated Financial Statements FOR THE NINE MONTH PERIOD ENDED
AROUNDTOWN S A. Condensed Interim Consolidated Financial Statements. For the three month period ended March 31, Berlin
 AROUNDTOWN S A Condensed Interim Consolidated Financial Statements For the three month period ended March 31, 2018 Berlin Düsseldorf Content Board of Directors Report 2 Interim consolidated statement of
CONSOLIDATED FINANCIAL STATEMENTS 2016
 CONSOLIDATED FINANCIAL STATEMENTS 2016 /Leipzig 1 2 /Halle CONSOLIDATED FINANCIAL STATEMENTS FOR THE YEAR ENDED DECEMBER 31, 2016 IMPRINT Publisher: Grand City Properties S.A. 24, Avenue Victor Hugo L-1750
Company Presentation. January 2018
 Company Presentation January 2018 Disclaimer This document is for informational purposes only. This document is not intended to form the basis of any investment decision and should not be considered as
Deutsche Wohnen SE.» 9M 2017 results. Conference Call, 14 November 2017
 Deutsche Wohnen SE» 9M 2017 results Conference Call, 14 November 2017 1 » Agenda 1 Highlights 9M 2017 2 Portfolio 3 Financials 4 Appendix 2 » Highlights 9M 2017 Strong operating business L-f-l rental growth
Consolidated Financial Statements
 Consolidated Financial Statements FOR THE YEAR ENDED DECEMBER 31, 2017 Berlin Cologne Consolidated Financial Statements FOR THE YEAR ENDED DECEMBER 31, 2017 IMPRINT Publisher: Grand City Properties S.A.
CONDENSED INTERIM CONSOLIDATED FINANCIAL STATEMENTS Q3 2017
 CONDENSED INTERIM CONSOLIDATED FINANCIAL STATEMENTS Q3 2017 /Hannover 1 /Frankfurt am Main CONDENSED INTERIM CONSOLIDATED FINANCIAL STATEMENTS FOR THE NINE MONTH PERIOD ENDED SEPTEMBER 30, 2017 IMPRINT
CORESTATE Capital Group
 CORESTATE Capital Group Q3 2017 Earnings Presentation November 2017 Disclaimer This presentation contains forward-looking statements that involve a number of risks and uncertainties. Such statements are
Baden-Baden CONSOLIDATED FINANCIAL STATEMENTS
 Baden-Baden CONSOLIDATED FINANCIAL STATEMENTS for the year ended December 31, 2016 Berlin CONTENT DECLARATION OF THE MEMBERS OF THE BOARD OF DIRECTORS 2-3 BOARD OF DIRECTORS REPORT 4-17 INDEPENDENT AUDITORS
Q EARNINGS CALL PRESENTATION NOVEMBER 2017
 Cologne Berlin Leipzig Q3 2017 EARNINGS CALL PRESENTATION NOVEMBER 2017 Munich Berlin Table of Contents 1 Highlights 2 Financial and Portfolio performance 3 ESG Outperformer 4 Appendix 2 1 Highlights High
PRESENTATION OF THE FINANCIAL RESULTS FOR THE YEAR 2017
 Cologne Mannheim Duisburg PRESENTATION OF THE FINANCIAL RESULTS FOR THE YEAR 2017 MARCH 2018 Essen Berlin Bremen Hannover Table of Contents 1 Highlights 2 3 4 5 Financial and Portfolio performance ESG
Prospectus. of 153,788,883 existing bearer shares (the Shares ), - each with a nominal value of 0.10 and full dividend rights from 1 January
, - each with a nominal value of 0.10 and full dividend rights from 1 January") Prospectus for the admission to trading on the regulated market of the Frankfurt Stock Exchange (Frankfurter Wertpapierbörse) with simultaneous admission to the sub-segment of the regulated market with
Prospectus for the admission to trading on the regulated market of the Frankfurt Stock Exchange (Frankfurter Wertpapierbörse) with simultaneous admission to the sub-segment of the regulated market with
UBS Global Real Estate CEO/CFO Conference. December 1/2, 2015
 UBS Global Real Estate CEO/CFO Conference December 1/2, 2015 01 ADO OVERVIEW AND INVESTMENT HIGHLIGHTS Overview ADO the pure play Berlin residential specialist Investment highlights 1 2 3 Berlin residential
NINE MONTHS FINANCIAL RESULTS NOVEMBER 19, 2015
 NINE MONTHS FINANCIAL RESULTS NOVEMBER 19, 2015 01 ADO OVERVIEW AND INVESTMENT HIGHLIGHTS Overview ADO the pure play Berlin residential specialist Investment highlights 1 2 3 Berlin residential pure play
9M 2018 RESULTS 09 NOVEMBER 2018 TLG IMMOBILIEN AG 9M 2018 RESULTS
 TLG IMMOBILIEN AG 9M 208 RESULTS DISCLAIMER This presentation includes statements, estimates, opinions and projections with respect to anticipated future performance of TLG IMMOBILIEN ("Forward-Looking
Trends in the Secondary Markets
 Trends in the Secondary Markets The Hidden Champions The Secondary Markets 1 1 Due to the high demand pressure and associated price rises in established office markets, smaller markets are becoming more
13 th Kepler Cheuvreux German Corporate Conference Frankfurt, 22 January 2014 Rolf Buch, CEO
 1 Syndicate Analyst Presentation May 2013 13 th Kepler Cheuvreux German Corporate Conference Frankfurt, 22 January 2014 Rolf Buch, CEO Deutsche Annington: Innovation leader based on a long-term vision,
LEG Immobilien AG Q1 Results 2014
 LEG Immobilien AG Q1 Results 2014 15 th May 2014 Disclaimer While the company has taken all reasonable care to ensure that the facts stated in this presentation are accurate and that the opinions contained
ANNUAL RESULTS 2015 MARCH 22, 2016
 ANNUAL RESULTS 2015 MARCH 22, 2016 01 OVERVIEW & INVESTMENT HIGHLIGHTS Overview ADO the pure-play Berlin residential specialist Investment highlights 1 2 3 4 Berlin residential pure play with a 1.5bn quality
Strategic Financing of a Listed Company
 Strategic Financing of a Listed Company Christian Hillermann ADLER Real Estate AG Dr. Sven Janssen Oddo Seydler Bank AG Contents ADLER Real Estate AG company presentation 1. Company highlights 2. Event
LEG Immobilien AG H1 Results 2015
 LEG Immobilien AG H1 Results 2015 14 th August 2015 Disclaimer While the company has taken all reasonable care to ensure that the facts stated in this presentation are accurate and that the opinions contained
BERLINSIDERS HALF YEAR FINANCIAL REPORT
 2 0 1 7 BERLINSIDERS HALF YEAR FINANCIAL REPORT 2017 KEY FIGURES HALF YEAR FINANCIAL REPORT 2017 KEY FIGURES KEY BALANCE SHEET FIGURES In EUR thousand Jun 30, 2017 Dec 31, 2016 Fair value of properties
BNP PARIBAS SECURITIES SERVICES
 BNP PARIBAS SECURITIES SERVICES PROVIDING RESPONSIBLE SERVICE TO OUR CLIENTS securities.bnpparibas.de The bank for a changing world 2 BNP PARIBAS GLOBALLY One of the leading banks in the eurozone 189,000
Conference call presentation Q
 Conference call presentation Q1 2018 2018 Content 2 I. TAG highlights Q1 2018 II. TAG financials Q1 2018 III. TAG portfolio Q1 2018 IV. TAG outlook FY 2018 V. Appendix 3 5 12 16 19 Portfolio details, vacancy
Half Year Results Sirius Real Estate Limited Half Year Results 30 September 2015
 Half Year Results 2015 Sirius Real Estate Limited Half Year Results 30 September 2015 Who Are We We are the largest branded provider of mixed-use conventional and flexible workspace in Germany 2 Highlights
CORESTATE Capital Holding Company presentation. January 2018
 CORESTATE Capital Holding Company presentation January 2018 Disclaimer This presentation contains forward-looking statements that involve a number of risks and uncertainties. Such statements are based
publity AG March 2016
 publity AG March 2016 Experienced and diverse management team with more than 20 years of professional experience in special situation real estate opportunities Thomas Olek Frederik Mehlitz Christoph Blacha
Summary 1-2. Chairman's and Managing Director's report 3-9. Independent auditor s review report 10
 REPORT AND ACCOUNTS June 2018 INDEX Page Summary 1-2 Chairman's and Managing Director's report 3-9 Independent auditor s review report 10 Condensed Consolidated Statements of Financial Position 11-12 Condensed
Next Generation Real Estate. HY 2008 Figures. Colonia Real Estate AG HY 2008 Figures 15 th of August 2008 Cologne
 Next Generation Real Estate HY 2008 Figures Colonia Real Estate AG HY 2008 Figures 15 th of August 2008 Cologne Focused and Integrated Business Model Colonia Real Estate AG Investments Management Principal
Memorandum of Understanding Signed with France s Largest Residential Landlord Société Nationale Immobilière (SNI) Assessing the Potential of European
 Assessing the Potential of European") Memorandum of Understanding Signed with France s Largest Residential Landlord Société Nationale Immobilière (SNI) Executive Summary Vonovia has signed a Memorandum of Understanding (MoU) with SNI, the
Memorandum of Understanding Signed with France s Largest Residential Landlord Société Nationale Immobilière (SNI) Executive Summary Vonovia has signed a Memorandum of Understanding (MoU) with SNI, the
Board of Directors' Report on the Corporation's State of Affairs
 Board of Directors' Report on the Corporation's State of Affairs Brack Capital Properties NV (hereinafter: "the Company") hereby submits the Board of Directors' report for a period of twelve months ending
Aroundtown SA LATEST RUN RATES CONFIRM GROWTH PHASE. FIRST BERLIN Equity Research. Operational PRICE TARGET Ar ou
 FIRST BERLIN Equity Research Aroundtown SA RATING Germany / Real Estate Operational Frankfurt Stock Exchange PRICE TARGET 8.20 Bloomberg: AT1 GR update Return Potential 26.1% ISIN: LU1673108939 Risk Rating
Deutsche Wohnen AG.» Company presentation. September 2012
 Deutsche Wohnen AG» Company presentation September 2012 1 » Agenda 1 Major highlights in H1/2012 2 BauBeCon acquisition 3 Proven asset and portfolio management track record in connection with the right
Quarterly Statement A S O F
 Quarterly Statement AS OF KEY FACTS Q3 / 2017 T 1 Key facts RESULTS OF OPERATIONS Q3 2017 Q3 2016 + / % / bp 01.01. 01.01. 30.09.2016 Rental income million 134.7 131.9 2.1 398.4 381.3 4.5 Net rental and
FY2016 Earnings Call March 7, 2017 Rolf Buch, CEO Dr. A. Stefan Kirsten, CFO
 March 7, 2017 Rolf Buch, CEO Dr. A. Stefan Kirsten, CFO Highlights FFO Growth 2016 FFO1 per share * up 25.1%, driven by internal growth. 10% organic FFO1 growth guided for 2017 (i.e. excluding conwert).
P R E S E N T A T I O N H1/ A U G U S T
 P R E S E N T A T I O N H1/2014 0 5 A U G U S T 2 0 1 4 D I S CLAIMER The statements contained herein may include statements of future expectations and other forward-looking statements that are based on
FIRST QUARTER 2017 INTERIM STATEMENT
 DEMIRE Deutsche Mittelstand Real Estate AG FIRST QUARTER 2017 INTERIM STATEMENT Fiscal Year January 1 Dezember 31 2017 Foreword of the Executive Board Dear Shareholders, With the quarterly statement for
Life Storage. September 2018 Investor Presentation
 Life Storage September 2018 Investor Presentation SAFE HARBOR STATEMENT FORWARD LOOKING STATEMENTS 2 This presentation may contain forward looking statements as defined in Section 27A of the Securities
THREE MONTH FINANCIAL RESULTS 2016 MAY 19, 2016
 THREE MONTH FINANCIAL RESULTS 20 MAY 19, 20 01 OVERVIEW & INVESTMENT HIGHLIGHTS Overview ADO the pure-play Berlin residential specialist Investment highlights Key portfolio metrics (end of Q1 20) 1 2 3
FINANCIAL RESULTS Q2 2018
 FINANCIAL RESULTS Q2 2018 August 15, 2018 OVERVIEW & INVESTMENT HIGHLIGHTS Chapter 01 Kapitel Titel ADO THE PURE PLAY BERLIN RESIDENTIAL SPECIALIST Investment highlights A focused residential portfolio(,4)
Aroundtown Property Holdings Plc.
 FIRST BERLIN Equity Research Aroundtown Property Holdings Plc. RATING Germany / Real Estate Q1/17 Frankfurt Stock Exchange PRICE TARGET 6.40 Bloomberg: AT1 GR Results Return Potential 38.5% ISIN: CY0105562116
COMPANY PRESENTATION DECEMBER 2017
 Cologne Berlin Leipzig COMPANY PRESENTATION DECEMBER 2017 Munich Berlin COMPANY OVERVIEW GCP is a specialist in residential real estate, value-add opportunities Key financials 1-9/2017 annualized in densely
Results presentation. Highlights. For the year-ended 31 March A distinctive specialist banking group
 Results presentation For the year-ended 31 March 26 A distinctive specialist banking group Highlights Constant pursuit of a sustainable, distinctive growth strategy Strong results 25 Investec plc relative
CPI PROPERTY GROUP first-time investment grade rating by Moody s, issuance of Eurobonds and initiation of large-scale refinancing operation
 Press Release Luxembourg, 27 November 2017 CPI PROPERTY GROUP first-time investment grade rating by Moody s, issuance of Eurobonds and initiation of large-scale refinancing operation Capital markets and
On track! Results for Q1 Q3 2017
 On track! Results for Q1 Q3 2017 Technology-based financial services Investment highlights in Q1 Q3 2017 and forecast for 2017 Key figures for Q1 Q3 2017 (yoy) Revenue: 143.7 million (+27%) EBIT: 18.6
Company presentation November 2017
 Company presentation November 2017 1 CONTENT Content I. TAG overview and strategy 3 2 II. III. IV. TAG portfolio TAG services business TAG return on capex 7 12 16 V. TAG acquisitions and disposals 21 VI.
Q3 results November 2017
 Q3 results 2017 28 November 2017 S IMMO Our process to value creation 1 Purchase Using market niches Opportunistic buying 2 Leveraging potential Convincing track record in property development 3 Sale Country
Real Estate Investment Company Grand City Properties Assigned 'BB-' Rating; Outlook Stable
 Research Update: Real Estate Investment Company Grand City Properties Assigned 'BB-' Rating; Outlook Stable Primary Credit Analyst: Maxime Puget, London (44) 20-7176-7239; Maxime_Puget@standardandpoors.com
CORESTATE Capital Group A Leading Real Estate Investment Manager
 CORESTATE Capital Group A Leading Real Estate Investment Manager H1 2017 Earnings Presentation 16 August 2017 Page 1 CORESTATE Capital Holding S.A. Disclaimer This presentation contains forward-looking
COMPANY PRESENTATION JUNE 2018
 Cologne Berlin Leipzig COMPANY PRESENTATION JUNE 2018 Munich Berlin COMPANY OVERVIEW GCP is a specialist in residential real estate, value-add opportunities Key financials 1-3/2018 annualized in densely
Life Storage Investor Presentation September 2017
 Life Storage Investor Presentation September 2017 Safe Harbor Statement This presentation may contain forward looking statements as defined in Section 27A of the Securities Act of 1933, and in Section
FINANCIAL RESULTS Q3 2018
 FINANCIAL RESULTS Q3 2018 November 14, 2018 OVERVIEW & INVESTMENT HIGHLIGHTS Chapter 01 Kapitel Titel ADO THE PURE PLAY BERLIN RESIDENTIAL SPECIALIST Investment highlights 1 Berlin residential pure play
COMPANY PRESENTATION MARCH 2018 (AS PER )
") COMPANY PRESENTATION MARCH 2018 (AS PER 31.12.2017) DIC ASSET AG KEY STRENGTHS INVESTMENT HIGHLIGHTS S-DAX listed player in the commercial real estate market in Germany, fully complying to highest market
COMPANY PRESENTATION MARCH 2018 (AS PER 31.12.2017) DIC ASSET AG KEY STRENGTHS INVESTMENT HIGHLIGHTS S-DAX listed player in the commercial real estate market in Germany, fully complying to highest market
GRAND CITY Properties S.A.
 FIRST BERLIN Equity Research GRAND CITY Properties S.A. RATING Luxembourg / Financial Services Q2/17 Frankfurt PRICE TARGET 26.00 Bloomberg: GYC GR Results Return Potential 42.7% ISIN: LU0775917882 Risk
Company Presentation. Mr. Claus-Matthias Böge, CEO. German Equity Forum Frankfurt am Main, 22 November The Art of Shopping
 1 The Art of Shopping Company Presentation Mr. Claus-Matthias Böge, CEO German Equity Forum Frankfurt am Main, 22 November 2005 The Art of Shopping Company 3 Equity Story Pure Player Deutsche EuroShop
S IMMO. Accumulate (old: Buy) Target: Euro (old: Euro 16.00)
 Target: Euro (old: Euro 16.00)") S IMMO Accumulate (old: Buy) Target: Euro 17.50 (old: Euro 16.00) 06 April 2018 Price (Euro) 16.50 52 weeks range 16.50 / 11.50 Key Data Country Austria Industry Real Estate Market Segment Prime Market
S IMMO Accumulate (old: Buy) Target: Euro 17.50 (old: Euro 16.00) 06 April 2018 Price (Euro) 16.50 52 weeks range 16.50 / 11.50 Key Data Country Austria Industry Real Estate Market Segment Prime Market
PRELIMINARY INDICATION FOR FULL YEAR 2012 RESULT
 PRELIMINARY INDICATION FOR FULL YEAR 2012 RESULT JANUARY 2013 AGENDA OVERVIEW OF EXTRAORDINARY EFFECTS AND IMPACT ON 2012 RESULT 1 2 EBT TARGET OF 50 MIO IN 2012 WRITE DOWN OF GOODWILL AND INTANGIBLE ASSETS
Housing as a commodity? Operative behavior of German publicly listed housing organizations Presenter: Prof. Dr. Stefan Kofner, MCIH Tirana, 05.
 Housing as a commodity? Operative behavior of German publicly listed housing organizations Presenter: Prof. Dr. Stefan Kofner, MCIH Tirana, 05. September, 2017 1. Publicly listed housing organizations
Company Presentation December 2016
 Company Presentation December 2016 Market German Residential Safe Harbor and Low Risk German residential market: important pillar of the German economy With a GDP contribution of more than 430bn the German
Capital Markets Day 2016 / Essen / June 6 th Modernization Frederic Neumann / Managing Director Vonovia South
 Capital Markets Day 2016 / Essen / June 6 th 2016 Modernization Frederic Neumann / Managing Director Vonovia South Agenda Portfolio strategy & modernization track record From a single product program to
Foxtons Interim results presentation For the period ended 30 June 2018
 Foxtons Interim results presentation For the period ended 30 June 2018 Important information This presentation includes statements that are, or may be deemed to be, forward-looking statements. These forward-looking
CORESTATE Capital. Company Presentation. February 2018
 CORESTATE Capital Company Presentation February 2018 Disclaimer This presentation contains forward-looking statements that involve a number of risks and uncertainties. Such statements are based on a number
Growing Assets 9M 2013 Q1-Q3 2011
 2013 Growing Assets 9M 2013 Q1-Q3 2011 CONTENT Content 22 I. TAG Highlights 3 II. TAG FFO 2013 / Guidance 2014 5 III. TAG Strategy: Growth and Margins 7 IV. TAG Portfolio: Regions / Achievements / Capex
istar Annual Report 2016
 istar Annual Report 2016 Annual Report 2016 2016 was a year of tangible progress for istar. The company set out to grow its earnings, capture unrecognized value and build a foundation for improved shareholder
0/0/0 255, 255, /60/ /221/221 30/60/ /153/ /177/ /217/47 116/222/ /204/ /62/152 0/159/147 M AY 17,
 M AY 17, 2017 1 2 ADO THE PURE PLAY BERLIN RESIDENTIAL SPECIALIST Investment highlights 1 2 3 4 Berlin residential pure play with a 2.3bn quality portfolio Efficient, fully integrated and scalable platform
S IMMO HY results August 2017
 S IMMO HY results 2017 29 August 2017 Ongoing success in 2017 Excellent HY results following record year 2016 Net income for the period more than tripled compared to HY 2015 Financing result improved by
Deutsche Wohnen SE.» Full year results Conference Call, 23 March 2018
 Deutsche Wohnen SE» Full year results 2017 Conference Call, 23 March 2018 1 » Table of content 1 Highlights 2017 2 Portfolio & valuation update 3 Financials 4 Guidance 5 Appendix 2 » Highlights FY 2017
DEMIRE Deutsche Mittelstand Real Estate AG. Fiscal Year 1 January 31 December 2017
 DEMIRE Deutsche Mittelstand Real Estate AG Third Quarter 2017 Interim Statement Fiscal Year 1 January 31 December 2017 Foreword of the Executive Board Dear Shareholders, It is with great satisfaction that
CAPTURE CHANCES DRIVE INNOVATION
 CAPTURE CHANCES DRIVE INNOVATION LEG Immobilien AG 10 August 2018 H1-2018 Results Disclaimer While the company has taken all reasonable care to ensure that the facts stated in this presentation are accurate
COLLATERALISED AND LIQUID ETC SIMPLE TRADING. SIMPLY COLLATERALISED. SIMPLY LIQUID. The bank for a changing world
 ETCs SIMPLE INVESTMENT IN COMMODITIES ETC COLLATERALISED AND LIQUID SIMPLE TRADING. SIMPLY COLLATERALISED. SIMPLY LIQUID. The bank for a changing world 4 WHY ETCs? 6 FUNCTIONING OF ETCs DAILY DETERMINATION
12 th Annual General Meeting. + Vienna, 8 May 2013
 12 th Annual General Meeting + Vienna, 8 May 2013 conwert is a fully integrated real estate company focusing on residential properties and apartment buildings in Germany and Austria. This focus is complemented
Company Presentation. Dr. Rüdiger Mrotzek Hans Richard Schmitz. February Preliminary Figures 2014
 Company Presentation Dr. Rüdiger Mrotzek Hans Richard Schmitz February 2015 Preliminary Figures 2014 Agenda 1 History / Capital markets track record 2 Portfolio / Investments 3 Asset Management 4 Financial
Company Presentation. Dr. Rüdiger Mrotzek Hans Richard Schmitz. May 2016
 Company Presentation Dr. Rüdiger Mrotzek Hans Richard Schmitz May 2016 Agenda 1 History / Capital markets track record 2 Portfolio-Management 3 Asset-Management 4 Financial Figures / Financial Position
CORESTATE Capital. Preliminary Results FY Management Presentation. 20 February 2018
 CORESTATE Capital Management Presentation Preliminary Results FY 2017 20 February 2018 Disclaimer This presentation contains forward-looking statements that involve a number of risks and uncertainties.
Q1 Results Conference Call May 29, 2008
 Q1 Results 2008 Conference Call May 29, 2008 Agenda Operational Update Financial Highlights Outlook 2 Agenda Operational Update Financial Highlights Outlook 3 Portfolio Overview Deutsche Wohnen Group Residential
Availability, Reliability, Ease. 11 September 2018
 Availability, Reliability, Ease 11 September 2018 LEGAL NOTICE This presentation has been prepared to inform investors and prospective investors in the secondary markets about the Group and does not constitute
CAPTURE CHANCES DRIVE INNOVATION
 CAPTURE CHANCES DRIVE INNOVATION LEG Immobilien AG 8May 2018 Q1-2018 Results Disclaimer While the company has taken all reasonable care to ensure that the facts stated in this presentation are accurate
Board of Directors' Report on the Corporation's State of Affairs
 Board of Directors' Report on the Corporation's State of Affairs Brack Capital Properties NV (hereinafter: "the Company") hereby submits the Board of Directors' report for a period of three months ending
Rolling Up German Real Estate
 Rolling Up German Real Estate Initiative Immobilien-Aktie Frankfurt / Main Frank Schaich, CEO Page 1 1. Snapshot 2. Fair Value s strategy 3. Real estate portfolio 4. Direct investments 5. Participations
RiverPark Floating Rate CMBS Fund (RCRIX)
") RiverPark Floating Rate CMBS Fund (RCRIX) Fourth Quarter 2017 Commentary and Outlook Thank you for investing in the RiverPark Floating Rate CMBS Fund (the Fund ) that we launched in October 2016. We have
RiverPark Floating Rate CMBS Fund (RCRIX) Fourth Quarter 2017 Commentary and Outlook Thank you for investing in the RiverPark Floating Rate CMBS Fund (the Fund ) that we launched in October 2016. We have
Deutsche Wohnen SE.» Q results. Conference Call, 15 May 2018
 Deutsche Wohnen SE» Q1 2018 results Conference Call, 15 May 2018 1 » Agenda 1 Highlights Q1 2018 2 Portfolio 3 Financials 4 Appendix 2 » Highlights Q1 2018 Operating business remains strong L-f-l rental
Company Presentation. Dr. Rüdiger Mrotzek Hans Richard Schmitz. April 2016
 Company Presentation Dr. Rüdiger Mrotzek Hans Richard Schmitz April 2016 Agenda 1 History / Capital markets track record 2 Portfolio-Management 3 Asset-Management 4 Financial Figures / Financial Position
Deutsche Wohnen A.G.
 CREDIT OPINION Update Deutsche Wohnen A.G. Update to Discussion of Key Credit Factors Summary Rating Rationale RATINGS Deutsche Wohnen A.G. Domicile Germany Long Term Rating A3 Type LT Issuer Rating -
FY2017 Annual General Meeting 19 April 2018
 FY2017 Annual General Meeting 19 April 2018 Agenda Key Highlights About Tikehau Capital European Market Review Portfolio Overview Financial Highlights Conclusion 2 Key Highlights FY2017 Key Highlights
Continuing the growth story: Acquisition of Brack Capital Properties. February 2018
 Continuing the growth story: Acquisition of Brack Capital Properties February 2018 Disclaimer This document has been prepared by ADLER Real Estate Aktiengesellschaft (the Company ) and is the responsibility
conwert Immobilien Hold (unchanged) Target: Euro (unchanged)
 Target: Euro (unchanged)") conwert Immobilien Hold (unchanged) Target: Euro 16.16 (unchanged) 05 May 17 Price (Euro) 16.50 52 weeks range 17.39 / 12.51 Record year 2016 with Euro 80m FFO I and 50% increase in net profit Hold and
conwert Immobilien Hold (unchanged) Target: Euro 16.16 (unchanged) 05 May 17 Price (Euro) 16.50 52 weeks range 17.39 / 12.51 Record year 2016 with Euro 80m FFO I and 50% increase in net profit Hold and
S IMMO Annual results for April 2018
 S IMMO Annual results for 2017 05 April 2018 We develop value Attractive properties & real values 1.2m m² space 6.1% Rental yield EUR 1,839,680,000 IFRS Property portfolio 94.8% 73% 27% Occupancy rate
Catella Research. Housing Market Ranking Germany 2015 Regional Housing Markets under the Microscope
 Catella Research Housing Market Ranking Germany 2015 Regional Housing Markets under the Microscope About Catella Catella is a leading financial advisor and asset manager in Europe, active in the property,
CAPTURE CHANCES DRIVE INNOVATION
 CAPTURE CHANCES DRIVE INNOVATION LEG Immobilien AG 9 November 2018 9M-2018 Results Disclaimer While the company has taken all reasonable care to ensure that the facts stated in this presentation are accurate
CONFERENCE CALL. 9M 2015 Results
 CONFERENCE CALL 9M 2015 Results 13.11.2015 9M 2015 SHOPPING CENTERS Retail turnover 9M 2015 1) Retail sector % change rent-to-sales ratio in % % of sales % of space Department stores -2.3 6.0 7.8 13.5
INTERIM REPORT ON THE 3RD QUARTER GROWING CASHFLOWS
 INTERIM REPORT 2017 ON THE 3RD QUARTER GROWING CASHFLOWS 2 Group financials Group financials 3 GROUP FINANCIALS in EUR m 01 / 01 09 / 30 / 2017 01 / 01 09 / 30 / 2016 Income statement key figures Rental
CONTENT. 01 Highlights. 02 Portfolio Performance. 03 Optimisation of Financing Structure. 04 FY 2017 Results. 05 Outlook FY
 CONTENT 01 Highlights 02 Portfolio Performance 03 Optimisation of Financing Structure 04 FY 2017 Results 05 Outlook FY 2017 2 IMMOFINANZ RESTRUCTURING 5/2015 12/2017 Sale of logistics asset class - focus
Preliminary Results. 22nd February 2018
 Preliminary Results 22nd February 2018 Mark Lewis Chief Executive Officer Matthew Price Chief Financial Officer Full year themes Diversified business delivering stable returns Doing a great job for our
quarterly financial report 30 September 2016
 quarterly financial report 30 September 2016 Q3 2016 KEY FIGURES AT A GLANCE (IFRS) thousand from the income statement 30 September 2016 30 September 2015 Income from rents and leases 45,341 38,199 Net
Akelius Residential Property AB
 Summary: Akelius Residential Property AB Primary Credit Analyst: Nicole Reinhardt, Frankfurt + (49)06933999303; nicole.reinhardt@spglobal.com Secondary Contact: Marie-Aude Vialle, London + 44(0)2071763655;
Macroeconomic Impact of the Subprime Crisis
 Franco German Council of Economic Advisors Paris, 5 February 2008 Dr. Stefan Kooths DIW Berlin, Macro Analysis and Forecasting Approach Assuming a strictly macroeconomic point of view - Thinking in aggregates