Deutsche Wohnen SE.» Q results. Conference Call, 15 May 2018
|
|
|
- Anna King
- 5 years ago
- Views:
Transcription

1 Deutsche Wohnen SE» Q results Conference Call, 15 May
2 » Agenda 1 Highlights Q Portfolio 3 Financials 4 Appendix 2
3 » Highlights Q Operating business remains strong L-f-l rental growth remains high with 4.4% for total letting portfolio for Berlin even at 5.1% Rent potential increased further to 37% in Berlin Attractive NOI margin of 79% Capex programme to accelerate rental and value growth fully on track Investments of almost EUR 350m or c. EUR 35 per sqm targeted for 2018 Bolt-on acquisitions of ~850 units in Core + locations through several deals ~500 units are located in Dresden/ Leipzig and 300 units in Berlin Market dynamics continue to be strong Despite realised l-f-l rental growth reversionary potential continues to be high at 35% in Core + Attractive spread between in-place and market rent multiples offer further potential for NAV growth 3
4 » Portfolio update Q significant reversionary potential Strategic cluster Residential units % of total measured by Fair Value In-place rent 1) EUR/sqm/month Fair Value EUR/sqm Multiple in-place rent Multiple market rent Rent potential 2) in % Vacancy in % Core + 140, % , % 2.1% Core 18, % , % 2.2% Non-core 1, % % 5.0% Total 160, % , % 2.1% Thereof Greater Berlin 114, % , % 2.1% Development of values in Berlin (EUR per sqm) DW development of multiples in Berlin 3,500 3,500 30x ,500 1, ,600 1, ,647 2, Fair Value Deutsche Wohnen CBRE asking price for Multi-Family-Houses Replacement costs 67% 25x 20x 15x 10x x spread x Q In-place rent multiple Market rent multiple 1) Contractually owed rent from rented apartments divided by rented area 2) Unrestricted residential units (letting portfolio); rent potential = new-letting rent compared to in-place rent (letting portfolio) 4
5 » Strong like-for-like development in particular in Berlin Like-for-like 31/03/2018 Residential units number In-place rent 2) 31/03/2018 EUR/sqm In-place rent 2) 31/03/2017 EUR/sqm Change y-o-y Vacancy 31/03/2018 in % Vacancy 31/03/2017 in % Change y-o-y Strategic core and growth regions Core + 131, % 1.7% 1.6% 0.1 pp Core 18, % 2.2% 2.0% 0.2 pp Letting portfolio 1) 150, % 1.8% 1.6% 0.2 pp Total 154, % 1.9% 1.7% 0.2 pp Thereof Greater Berlin 107, % 1.8% 1.6% 0.2 pp Strong like-for-like rental growth of 4.4%, in Berlin even more than 5% Vacancy slightly increased to 1.9%, however ~50bps capex driven vacancy 1) Excluding disposal portfolio and non-core portfolio 2) Contractually owed rent from rented apartments divided by rented area 5
6 » Value enhancing Capex programme is fully on track Q Q Modernization & Maintenance per sqm EUR m EUR / sqm 1) EUR m EUR / sqm 1) ~45 Maintenance (expensed through p&l) Modernization (capitalized on balance sheet) Total ~ ~9-10 ~ Q FY-2017 Q FY-2018e Capitalization rate 63.5% 54.2% Maintenance Modernization Significant increase in modernization investments to EUR per sqm (+45% yoy), due to progressing Capex programme Re-letting investment of EUR 100m p.a. to realize reversionary potential at an unlevered yield on cost of 12% 1) Annualized figure, based on the quarterly average area 6
7 » Stable margins and increased NOI per sqm in EUR m Q Q Income from rents (rental income) Income relating to utility/ ancillary costs Income from rental business Expenses relating to utility/ ancillary costs (105.0) (94.0) Rental loss (2.5) (1.2) Maintenance (22.1) (21.8) Others (1.4) (1.0) Earnings from Residential Property Management Personnel, general and administrative expenses (11.4) (10.6) Net Operating Income (NOI) NOI margin 79.0% 79.6% NOI in EUR / sqm / month Income split from rental business due to first time application of IFRS 15 - amended figures for Q accordingly Non recoverable expenses: 76.3% Development of NOI margin 79.6% Q1-2018: EUR -3.2m Q1-2017: EUR -2.2m 79.0% FY-2017 Q Q NOI margin Attractive NOI margin of 79% underscores operational efficiency 7
8 » Attractive margins of disposal business despite significant revaluations Disposals Privatization Institutional sales Total with closing in Q Q Q Q Q Q No. of units Proceeds (EUR m) Book value Price in EUR per sqm 2,423 1,843 1,017 1,126 n/a n/a Earnings (EUR m) Gross margin 49% 31% 7% 24% 27% 27% Cash flow impact (EUR m) Demand for property continues to be high and is reflected in higher prices per sqm Privatization business continues to deliver significant gross margins despite year end 2017 portfolio revaluation 8
9 » Target to double EBITDA contribution from Nursing and Assisted Living mid-term Operations (in EUR m) Q Q Total income Total expenses (22.2) (20.9) EBITDA operations EBITDA margin 5.5% 9.1% Lease expenses EBITDAR EBITDAR margin 21.7% 25.7% in EUR m Q Q Nursing & Living Other in EUR m Q Q Staff (13.1) (12.1) Rent / lease (inter-company) (3.7) (3.7) Other (5.4) (5.1) Assets (in EUR m) Q Q Lease income Total expenses (0.3) (0.1) Margin decline mainly from increasing staff expenses (use of temporary employees, wage inflation and additional headcount) EBITDA assets Operations & Assets (in EUR m) Q Q Total EBITDA Set out in the consolidated group financial statements as Earnings from nursing and assisted living Slight decrease of EBITDA contribution YoY due to wage inflation Occupancy level of facilities managed by Katharinenhof at 97.8% per Q
10 » EBITDA margin stable above 80% in EUR m Q Q Development of cost ratio Earnings from Residential Property Management Earnings from Disposals % 10.6% 10.4% Earnings from Nursing and Assisted Living Segment contribution margin Corporate expenses (20.0) (19.1) Other operating expenses/ income 0.5 (1.0) EBITDA One-offs Adj. EBITDA (incl. disposals) Earnings from Disposals (4.8) (8.6) Adj. EBITDA (excl. disposals) FY-2017 Q Q Cost Ratio (corporate expenses divided by gross rental income) Development of adj. EBITDA margin 77.1% 81.3% 81.5% FY-2017 Q Q Adj. EBITDA margin (excl. disposals) Stable adj. EBITDA margin (excl. disposals) above 80% despite increase in personnel expenses 10
11 » FFO I per share growth of 6% to improve throughout 2018 in EUR m Q Q FFO I margin development EBITDA (adjusted) Earnings from Disposals (4.8) (8.6) Long-term remuneration component (share based) % 64% 63% 67% 64% 69% Finance lease broadband cable network At equity valuation FY-2017 Q Q Interest expense/ income (recurring) (22.8) (24.6) Income taxes (10.5) (8.3) FFO I margin FFO I margin (pre-tax) Minorities (1.6) (2.0) FFO I Earnings from Disposals FFO II FFO I per share in EUR 1) Diluted number of shares 2) % change FFO per share development in EUR +6% +13% Diluted FFO I per share 2) in EUR FFO II per share in EUR 1) Undiluted Q Q Diluted FFO I margin improved by 2pp, mainly through operating performance and further lowering of financing costs 1) Based on weighted average shares outstanding (Q1 2018: 354,67m, Q1 2017: m) 2) Based on weighted average shares assuming full conversion of in the money convertible bonds 11
12 » EPRA NAV per share stable in Q in EUR m 31/03/ /12/2017 EPRA NAV per share (undiluted) in EUR Equity (before non-controlling interests) 9, ,888.2 Fair values of derivative financial instruments % % Deferred taxes (net) 2, ,786.6 EPRA NAV (undiluted) 12, ,676.8 Shares outstanding in m EPRA NAV per share in EUR (undiluted) Effects of exercise of convertibles 0.0 1) 0.0 1) EPRA NAV (diluted) 12, Shares diluted in m ) ) EPRA NAV per share in EUR (diluted) /12/ /12/ /03/2018 EPRA NAV per share (undiluted) Loan-to-value development 37.7% 34.5% 34.6% 31/12/ /12/ /03/2018 LTV development Next revaluation with H financials envisaged 1) Effects of convertible bonds are only considered if the respective instruments are in the money/ dilutive 2) Currently both convertible bonds are out-of-the-money; strike prices are at EUR and EUR as of 31-Mar
13 » Conservative long-term capital structure Rating A- / A3; stable outlook Ø maturity ~ 7.7 years % secured bank debt 66% % unsecured debt 34% Ø interest cost 1.3% (~88% hedged) LTV target range 35-40% Low leverage, long maturities and strong rating Flexible financing approach to optimize financing costs LTV at 34.6% as of Q (-1.5pp yoy) ICR (adjusted EBITDA excl. disposals / net cash interest) ~6.9x (+0.9x yoy) Short-term access to c. EUR 1bn liquidity through CP program and RCFs Maturity profile in EUR m based on notional amounts 1) Bonds & Private Placements (unsecured) Convertible Bonds Bank Debt >2028 Convertible Bonds 22% Debt structure 1) Bonds & Private Placements (unsecured) 12% 66% Bank Debt 1) As of 31 March 2018, excluding commercial papers 13
14 » Guidance unchanged FY-2017 FY-2018e Main drivers/ comments FFO I (EUR m) ~470 Operational performance Dividend per share (EUR) 0.80 ~0.86 Based on 65% pay-out ratio from FFO I and current shares outstanding LTV 34.5% 35-40% (target range) Aim to keep current rating Like-for-like rental growth 4.4% ~3% ~3% based on in-place rent in EUR/ sqm 4-5% based in P&L impact (timing effect) 14
15 » Appendix 15

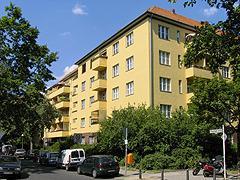
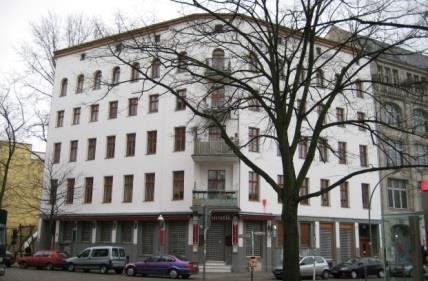
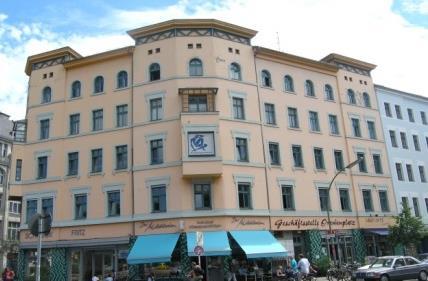
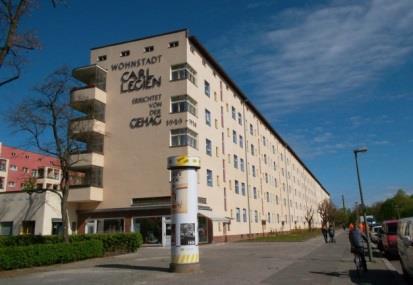
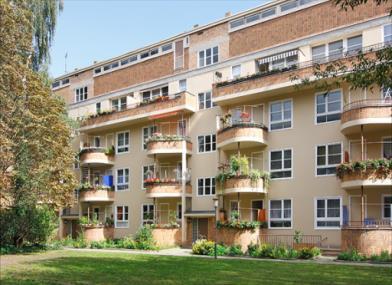
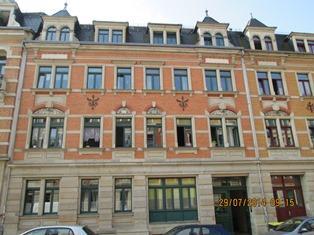
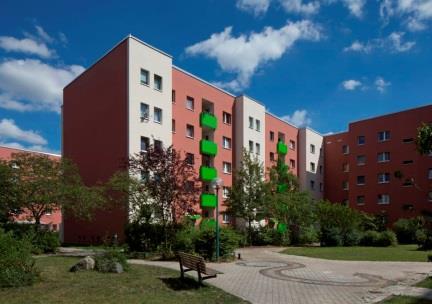
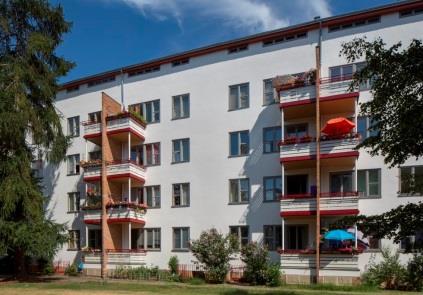
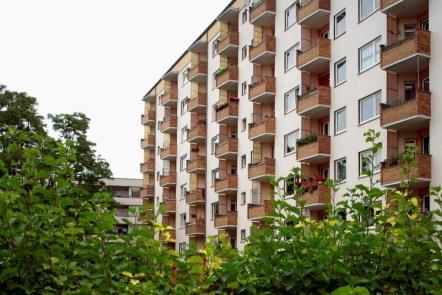
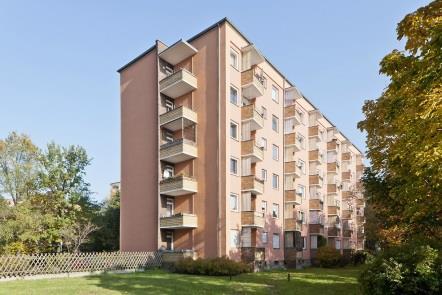
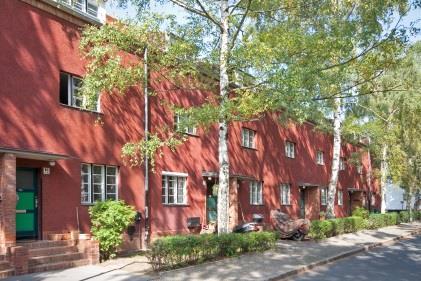
16 » Deutsche Wohnen's residential portfolio is best-in-class Südwestkorso, Berlin Siemensstadt, Berlin Otto-Suhr-Siedlung, Berlin Oranienkiez, Berlin Hellersdorf, Berlin Carl-Legien-Siedlung, Berlin Hufeisensiedlung, Berlin Dresden 16
17 » More than EUR 8bn value potential for residential portfolio Multiple Underlying rent (EUR m) Fair Value (EUR m) Fair Value (EUR/sqm) Description Current portfolio (31-Dec-2017) 25 x ,864 EUR 1,886 Fair Value of residential portfolio as of 31-Dec-2017 Rent potential operate stock 25 x 150 3,750 Based on difference of achieved re-letting rents and current in-place rent (excluding capex stock and rent restricted units) Rent potential capex stock 30 x 80 2,400 Based on difference of market rent post investment vs. current in-place rent As capex investments lead to fully refurbished stock, higher multiple applicable Regulation gap 25 x 75 1,875 Gap between currently observed market rent of c. EUR ) and new letting rent impacted by rent regulation (excluding capex stock) Estimated Potential 1,072 (ERV) 26,889 EUR 2,781 Estimated Fair Value based on today s observed market rent levels Estimated Rental Value (ERV) of >EUR 1 bn represents a Fair Value potential of almost EUR 2,800 per sqm and translates into more than 50% NAV upside potential 1) Empririca (on postal code basis) 17
18 » Significant scope for rent potential to widen further in Berlin Replacement costs Average replacement costs > EUR 3,500 per sqm, predominately driven by increase of prices for land plots Replacement costs at 1.7x DW Berlin book value New construction requires at least EUR 12 per sqm/ month to allow for 3.5% gross yield 1) Demand supply shortage expected to continue Current shortage of c. 100,000 units; expected to grow to > 200,000 units by 2030 New supply at current run rate of c. 14,000 units (thereof ~40% condominiums) is not sufficient Examples for development of land prices in Berlin (EUR/ sqm) 2) 2,000 1, Suburb location (Marzahn) Central location (Kreuzberg) 3,000 Average location (Treptow) For pick-up of new construction activity further increase of market rents required CAGR +73% +35% +34% Affordability Average DW apartment size of only 60 sqm offers competitive advantage in terms of affordability Increasing demand from 1-2 person(s) households Based on average DW in-place rent of EUR 6.52 per sqm and including ancillary costs average monthly rent appears affordable with EUR ~540 Market rent for fully refurbished apartment leading to average monthly rent of EUR ~810 DW in-place rent DW re-letting rent Market rent 3) Rent (EUR/sqm) Average ancillary cost (EUR/sqm) Average DW apartment size Average rent per month (EUR) Examples for rents in Berlin sqm 60 sqm 60 sqm EUR 541 EUR 685 EUR 810 Berlin rent levels screen well from an affordability perspective 1) Given development of replacement cost and social quota as part of zoning process 2) Source: Committee on Berlin Property Values (Gutachterausschuss Bodenrichtwerte) 3) Market rent for fully refurbished apartments in Berlin 18
19 » Re-letting rents continue to outpace in-place rents EUR / sqm DW rent development in Berlin % rent potential % rent potential Q New-letting rent (EUR/sqm) In-place rent (EUR/sqm) 30x 25x 20x 15x 10x x 13.1 DW development of multiples in Berlin x spread Q In-place rent multiple Market rent multiple Total rent potential for entire portfolio (incl. effects of capex program) stable at EUR 230m; unlocking that rent potential as key driver for organic NAV growth Spread between in-place and market multiples significantly widened over the last 5 years, implying significant further value upside potential over the coming years 19
20 » Current level of rents and prices offer significant growth potential Asking prices multifamily housing (in EUR / sqm) 1) Asking rents in German top cities (in EUR / sqm) 2) DW Berlin (book value) Dusseldorf 2,090 2, % DW Berlin (re-letting rent) Berlin % Berlin 2,647 Dusseldorf Cologne 2,656 Cologne Hamburg 2,936 Hamburg Frankfurt (Main) 3,377 Stuttgart Stuttgart 3,400 Frankfurt (Main) Munich 6, ,500 2,500 3,500 4,500 5,500 6,500 (EUR / sqm) Munich (EUR / sqm / month) Dynamic development of residential rents and prices for German top cities, based on strong demographic trends and fundamentals Deutsche Wohnen portfolio offers catch-up potential for rents and values CBRE s asking prices for multifamily housing are c. 27% above Deutsche Wohnen Fair Value per sqm CBRE asking rents c. 16% above current re-letting rent of Deutsche Wohnen portfolio in Berlin 1) CBRE median asking prices 2017, DW portfolio valuation 2) CBRE asking rents 2017, DW portfolio valuation 20
21 » Strong like-for-like development in particular in Berlin Like-for-like 31/03/2018 Residential units number In-place rent 2) 31/03/2018 EUR/sqm In-place rent 2) 31/03/2017 EUR/sqm Change y-o-y Vacancy 31/03/2018 in % Vacancy 31/03/2017 in % Change y-o-y Letting portfolio 1) 150, % 1.8% 1.6% 0.2 pp Core + 131, % 1.7% 1.6% 0.1 pp Greater Berlin 107, % 1.8% 1.6% 0.2 pp Rhine-Main 9, % 1.4% 1.5% -0.1 pp Rhineland 4, % 0.9% 1.1% -0.2 pp Mannheim/Ludwigshafen 4, % 0.9% 0.6% 0.3 pp Dresden / Leipzig 4, % 2.6% 2.4% 0.2 pp Other Core % 0.3% 0.2% 0.1 pp Core 18, % 2.2% 2.0% 0.2 pp Hanover / Brunswick 9, % 1.9% 1.9% 0.0 pp Kiel / Lübeck 4, % 1.9% 2.1% -0.2 pp Other Core 4, % 3.1% 2.2% 0.9 pp Total 154,408 3) % 1.9% 1.7% 0.2 pp 1) Excluding disposal portfolio and non-core portfolio; 2) Contractually owed rent from rented apartments divided by rented area; 3) Total L-f-l stock incl. Non-Core 21
22 <= 4, >= 9.01» Portfolio structure characteristics meeting strong demand Apartment size Ø 60 sqm Year of construction >= 75 sqm, 18% < 40 sqm, 11% 29.0% 30.8% 65 to < 75 sqm, 18% 40 to < 55 sqm, 30% 5.7% 15.9% 18.3% 0.4% 55 to < 65 sqm, 23% <= >= 2000 Rental restrictions (expiring over time) restricted; ~9% In-place rent (Ø 6.40 EUR/sqm/month) 16.2% 17.3% 16.2% 13.3% 9.6% 1.3% 2.0% 5.2% 6.2% 5.6% 4.4% 2.7% non-restricted; ~91% Note: figures as of 31-Dec
 Innovation 2 nd best performing European startup ecosystem with app.")
 3) Highest density of researchers and academics in Germany (per capita) 1) Population / economy 2017 Y-o-y Residential market characteristics 2017 Y-o-y")
 EUR 3,046 +1.9% Ø asking rent per sqm/month 5) EUR 9.83 +9.2% Ø asking price per sqm 5) EUR 2,647 +15.3% 1) https://www.berlin.")
23 » Berlin The place to be! Government High-tech Science Seat of parliament, government and professional associations 1) Innovation 2 nd best performing European startup ecosystem with app. 2,000 active tech Startups 2) 6,500 technology firms 15,000 IT students Forecast 2020: 100,000 new jobs 2) Tourism More than 12.9 million arrivals in 2017 (+1.8% compared to 2016) 3) Highest density of researchers and academics in Germany (per capita) 1) Population / economy 2017 Y-o-y Residential market characteristics 2017 Y-o-y Population Population forecast 2035 ~3.7m ~4.0m +1.1% Number of residential units 1.9m <1% New construction ,659 4) +27% Ø unemployment rate 9.0% -0.8pp Ø net household income per month 2) EUR 3, % Ø asking rent per sqm/month 5) EUR % Ø asking price per sqm 5) EUR 2, % 1) 4) Latest number available is of ) CBRE 5) CBRE asking rents and asking prices for multifamily housing 3) visitberlin / Berlin Institute for Statistics 23
24 » THE BERLIN-PORTFOLIO AT A GLANCE Reinickendorf # 9, % Mitte # 4, % Spandau # 13, % Pankow # 9, % Friedrichshain-Kreuzberg # 8, % Lichtenberg # 8, % Marzahn-Hellersdorf # 14, % Charlottenburg-Wilmersdorf # 7, % Treptow-Köpenick # 4, % Steglitz-Zehlendorf # 10, % > 3,000 > 5,000 >8,000 >10,000 Tempelhof-Schöneberg # 5, % Neukölln # 12, % # units in-place rent (EUR/m²) vacancy City of Berlin # 110, % Greater Berlin # 114, % 24
25 » Disposals business remains opportunistic 2,400 2,100 1,800 1,500 1, Development xxx of privatization business 44% 41% 39% 30% 2,086 1,564 1,394 1, % gross margin price in EUR/ sqm Development of institutional sales business 20,000 20% 8% 13% 20% 95% 15,000 92% 90% 91% 91% 14,811 10,000 12,669 90% 9,596 5, ,099 85% % gross margin Cumulative block sales % Core+ (by FV) Continuation of selective privatizations to validate price points in micro locations Continue to achieve attractive gross margins despite > EUR 7bn portfolio revaluations since 2014 Since 2014 realized prices increased by 77% No reliance on free cash flow generation to finance investment program Successful streamlining of portfolio in recent years ~15,000 units disposed at attractive margins since 2014 Non-Core disposals almost completed at prices significantly above book value Share of Core + increased to 92% Too early in cycle to accelerate privatization pace to turn book gains into cash returns for shareholders Opportunistic disposals at attractive prices possible to improve overall quality and further de-risk portfolio 25


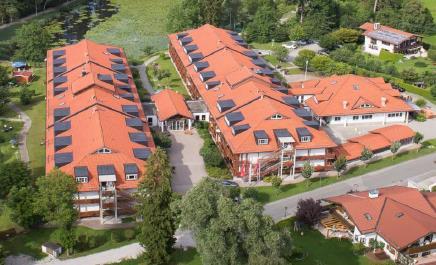

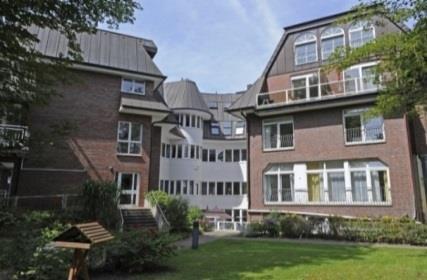
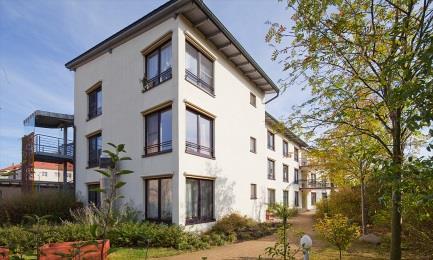
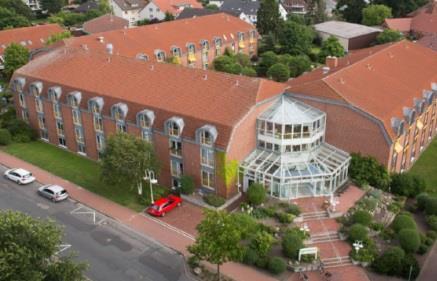
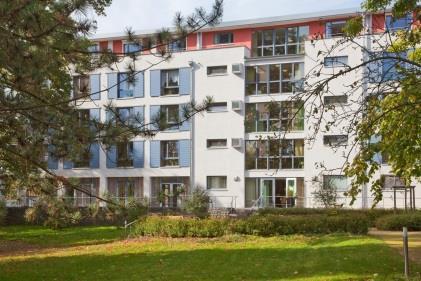
26 » Best in class Nursing and Assisted Living portfolio Uferpalais, Berlin Im Schlossgarten, Brandenburg Wolkenstein, Saxony Wilsdruff, Saxony Quellenhof, Saxony Am Schwarzen Berg, Lower Saxony Garpsen, Lower Saxony Am Auensee, Saxony Oberau, Bavaria Blankenese, Hamburg Zum Husaren, Hamburg Am Lunapark, Saxony 26
27 » Nursing and Assisted Living segment Nursing identified as attractive driver for further external growth Assets including operations Managed by owner 1) Other operators Region Facilities # Beds # Occupancy rate Greater Berlin 12 1, % Hamburg % Saxony % Lower Saxony % In-house operations 23 2, % Assets excluding operations Region Facilities # Beds # WALT Bavaria North-Rhine Westphalia Lower Saxony Rhineland-Palatinate Baden-Württemberg Other Total other operators 28 4, Total nursing 51 6,668 n/a Fragmented market with promising fundamental outlook offers room for consolidation Significant investments needed to absorb required capacity built-up in industry with inefficient access to capital Attractive risk adjusted yield spread compared to other real estate asset classes Proven operational know-how through Katharinenhof brand High occupancy rates of c. 98% Strong EBITDAR margins of c. 24%, putting DW in top decimal in terms of profitability Proven integration track record for acquired businesses Deutsche Wohnen business model superior to most peers As owner with operational 1) know-how exposed to lower risk and low cost of funding Expansion of day care and outpatient care with synergies to residential sector Focus on acquisition of real estate properties Preferably in combination with operational management to further enhance yields Adherence to strict acquisition criteria focussing on quality, market positioning and expected value upside Doubling of capacity mid-term envisaged FV of nursing assets amounts to EUR ~713m, translating into attractive RoCE of ~7% for low risk DW business model 1) Managed through participation in Katharinenhof 27
28 Year» Acquisition track record since 2013 Main acquisitions (>1,000 units deal size) Fair Value in EUR/sqm In-place rent in EUR/sqm Deal Residential units # Location At Acquisition 31/12/2017 At Acquisition 31/12/2017 Centuria 5,200 Berlin 711 1, % % Larry 6,500 Berlin 842 1, % % GSW 60,000 Berlin 960 2, % % Windmill ~4,600 Berlin 1,218 1,803 48% % Henry ~1,600 Berlin 1,302 1,835 41% % Accentro 1,200 Berlin 1,227 2,016 64% % Olav 15,200 1,342 1,774 32% % thereof ~5,200 Berlin 1,469 1,959 33% % ~3,800 Kiel 1,043 1,264 21% % ~1,000 other Core + 3,159 3,159 0% % Helvetica ~3,900 Berlin 2,390 2,645 11% % Total ~86,500 Acquisitions delivered attractive total returns through rent development and NAV uplift ~13% of acquired units have been sold at double digit gross margins to streamline portfolio quality 28
29 » Operational and financial improvements drive margins Adj. EBITDA margin (w/o disposals) FFO I margin 75% 77% Avg. cost of debt 3.2% 2.5% 1.8% 1.6% 1.3% 72% 48% 54% 58% 66% 68% 31% 35% Concentrated portfolio and successful integration of acquired businesses as well as further efficiency improvement of operational business let to best in class EBITDA margin Early and proactive management of liabilities to take advantage of attractive financing environment average cost of debt reduced by more than 50% since
30 » Strong generation of total shareholder return Development of dividend in EUR per share CAGR : +24% +8% +37% % % Development of EPRA NAV (undiluted) in EUR per share CAGR : +25% +20% +29% % % Yoy growth 2013(1) Yoy growth DW consistently generated high shareholder return based on capital growth and dividend payments while reducing its risk profile Considering suggested dividend of EUR 0.80 per share, DW delivered a shareholder return for 2017 of EUR 6.86 or c. 23 % of 2016 EPRA NAV (undiluted) 1) As reported, no scrip adjustment 30
31 » Bridge from adjusted EBITDA to profit in EUR m Q Q EBITDA (adjusted) Depreciation (1.9) (1.7) At equity valuation Financial result (net) (26.2) (38.3) EBT (adjusted) One-offs (2.6) (9.2) in EUR m Q Q Interest expenses (23.6) (24.7) In % of rental income ~12.2% ~13.7% Non-cash interest expenses (3.4) (13.7) (27.0) (38.4) Interest income Financial result (net) (26.2) (38.3) Valuation SWAP and convertible bonds (3.8) (31.1) EBT Current taxes (10.5) (9.7) Deferred taxes (14.3) (18.2) Profit Profit attributable to the shareholders of the parent company Earnings per share 1) ) Based on weighted average shares outstanding (Q1 2018: m; Q1 2017: m) 31
32 » Summary balance sheet Assets in EUR m 31/03/ /12/2017 Investment properties 19, ,628.4 Other non-current assets Derivatives Deferred tax assets Non current assets 19, ,766.5 Land and buildings held for sale Trade receivables Other current assets Cash and cash equivalents Current assets Equity and Liabilities in EUR m 31/03/ /12/2017 Total equity 10, ,211.0 Financial liabilities 4, ,751.1 Convertibles 1, ,669.6 Bonds Tax liabilities Deferred tax liabilities 2, ,496.7 Derivatives Other liabilities Total liabilities 10, ,328.4 Total equity and liabilities 20, ,539.4 Total assets 20, ,539.4 Investment properties represent ~95% of total assets Strong balance sheet structure offering comfort throughout market cycles 32


33 » Management board and areas of responsibilities Michael Zahn Chief Executive Officer (CEO) More than 20 years in the firm Areas of responsibility: Strategy Asset Management Controlling Strategic participations HR PR & Marketing Lars Wittan Chief Operating Officer (COO) Since 2007 at Deutsche Wohnen, since 2011 member of the management board Areas of responsibility: Letting business Rent development Portfolio investments New construction IT Philip Grosse Chief Financial Officer (CFO) Since 2013 at Deutsche Wohnen, since 2016 CFO Areas of responsibility: Accounting/ Tax Financing Treasury Investor Relations Legal/Compliance Risk Management 33
34 STI LTI» Executive Board compensation system as of 1 January Introduction of Share Ownership Guidelines (SOGs) 2 Conversion of the Stock Option Plan into a Performance Cash Plan Reduction of the plan s complexity and meeting of investor and proxy advisor expectations SOG s 1 Share Ownership Guidelines Obligation to hold a fixed number of Deutsche Wohnen shares Investment of the following amount over 4 years: Chief Executive Officer: 300% of base salary (pre-tax) Ordinary Board Member: 150% of base salary (pre-tax) 2 Performance period (4 years) Stock Option Plan (real shares) New plan type Performance Cash Plan Target Value (TV) in! x Relative share price development (50%) Performance 0%-250% Cumulative NAV growth p/s (50%) + Performance = 0%-250% 100% payout of the TV only if share price development has outperformed EPRA Germany index while cumulative NAV growth has been at least 20% over 4 years Cash Payout (Cap 250% of TV) Bonus Bonus Target Value (TV) in Non-Financial x Financial Targets (80%) + = Targets (20%) Cash Payout (Cap 125% of TV) Base salary Base salary STI = Short Term Incentive; LTI = Long Term Incentive 34
35 » Disclaimer This presentation contains forward-looking statements including assumptions, opinions and views of Deutsche Wohnen or quoted from third party sources. Various known and unknown risks, uncertainties and other factors could cause actual results, financial positions, the development or the performance of Deutsche Wohnen to differ materially from the estimations expressed or implied herein. Deutsche Wohnen does not guarantee that the assumptions underlying such forward-looking statements are free from errors nor do they accept any responsibility for the future accuracy of the opinions expressed in this presentation or the actual occurrence of the forecasted developments. No representation or warranty (expressed or implied) is made as to, and no reliance should be placed on, any information, including projections, estimates, targets and opinions, contained herein, and no liability whatsoever is accepted as to any errors, omissions or misstatements contained herein, and accordingly, none of Deutsche Wohnen SE or any of its affiliates (including subsidiary undertakings) or any of such person s officers, directors or employees accepts any liability whatsoever arising directly or indirectly from the use of this document. Deutsche Wohnen does not undertake any obligation to publicly release any revisions to these forward-looking statements to reflect events or circumstances after the date of this presentation. 35
36 Deutsche Wohnen SE Mecklenburgische Straße Berlin Phone: Fax: Deutsche Wohnen SE
Deutsche Wohnen SE.» Full year results Conference Call, 23 March 2018
 Deutsche Wohnen SE» Full year results 2017 Conference Call, 23 March 2018 1 » Table of content 1 Highlights 2017 2 Portfolio & valuation update 3 Financials 4 Guidance 5 Appendix 2 » Highlights FY 2017
Deutsche Wohnen SE.» 9M 2017 results. Conference Call, 14 November 2017
 Deutsche Wohnen SE» 9M 2017 results Conference Call, 14 November 2017 1 » Agenda 1 Highlights 9M 2017 2 Portfolio 3 Financials 4 Appendix 2 » Highlights 9M 2017 Strong operating business L-f-l rental growth
Deutsche Wohnen SE. Full Year Results 2018 Conference Call 26 March 2019
 Deutsche Wohnen SE Full Year Results 2018 Conference Call 26 March 2019 Agenda 01 02 03 04 Highlights Market and Portfolio Financials and Outlook Appendix deutsche-wohnen.com 2 Highlights FY 2018 Operating
Deutsche Wohnen SE.» Company presentation. November 2017
 Deutsche Wohnen SE» Company presentation November 2017 1 » Content 1 Deutsche Wohnen at a Glance 2 German Residential Real Estate Market 3 Portfolio and Business Segments 4 Key Financials 5 Strategic Focus
Deutsche Wohnen SE.» H results. Conference Call, 14 August 2018
 Deutsche Wohnen SE» H1 2018 results Conference Call, 14 August 2018 1 » Agenda 1 Highlights 2 3 4 2 » Highlights H1 2018 Strong operational business L-f-l growth strong at 4.5% for the total portfolio,
Deutsche Wohnen AG.» Company presentation. September 2012
 Deutsche Wohnen AG» Company presentation September 2012 1 » Agenda 1 Major highlights in H1/2012 2 BauBeCon acquisition 3 Proven asset and portfolio management track record in connection with the right
UBS Global Real Estate CEO/CFO Conference. December 1/2, 2015
 UBS Global Real Estate CEO/CFO Conference December 1/2, 2015 01 ADO OVERVIEW AND INVESTMENT HIGHLIGHTS Overview ADO the pure play Berlin residential specialist Investment highlights 1 2 3 Berlin residential
NINE MONTHS FINANCIAL RESULTS NOVEMBER 19, 2015
 NINE MONTHS FINANCIAL RESULTS NOVEMBER 19, 2015 01 ADO OVERVIEW AND INVESTMENT HIGHLIGHTS Overview ADO the pure play Berlin residential specialist Investment highlights 1 2 3 Berlin residential pure play
ANNUAL RESULTS 2015 MARCH 22, 2016
 ANNUAL RESULTS 2015 MARCH 22, 2016 01 OVERVIEW & INVESTMENT HIGHLIGHTS Overview ADO the pure-play Berlin residential specialist Investment highlights 1 2 3 4 Berlin residential pure play with a 1.5bn quality
THREE MONTH FINANCIAL RESULTS 2016 MAY 19, 2016
 THREE MONTH FINANCIAL RESULTS 20 MAY 19, 20 01 OVERVIEW & INVESTMENT HIGHLIGHTS Overview ADO the pure-play Berlin residential specialist Investment highlights Key portfolio metrics (end of Q1 20) 1 2 3
Group interim report as of 30 June Creating today the city of tomorrow
 Creating today the city of tomorrow Contents 2 Group key figures 3 Group interim management report 18 Group interim financial statements 35 Further information 2 Deutsche Wohnen SE Group key figures Group
Q1 Results Conference Call May 29, 2008
 Q1 Results 2008 Conference Call May 29, 2008 Agenda Operational Update Financial Highlights Outlook 2 Agenda Operational Update Financial Highlights Outlook 3 Portfolio Overview Deutsche Wohnen Group Residential
0/0/0 255, 255, /60/ /221/221 30/60/ /153/ /177/ /217/47 116/222/ /204/ /62/152 0/159/147 M AY 17,
 M AY 17, 2017 1 2 ADO THE PURE PLAY BERLIN RESIDENTIAL SPECIALIST Investment highlights 1 2 3 4 Berlin residential pure play with a 2.3bn quality portfolio Efficient, fully integrated and scalable platform
9M 2018 RESULTS 09 NOVEMBER 2018 TLG IMMOBILIEN AG 9M 2018 RESULTS
 TLG IMMOBILIEN AG 9M 208 RESULTS DISCLAIMER This presentation includes statements, estimates, opinions and projections with respect to anticipated future performance of TLG IMMOBILIEN ("Forward-Looking
FINANCIAL RESULTS Q2 2018
 FINANCIAL RESULTS Q2 2018 August 15, 2018 OVERVIEW & INVESTMENT HIGHLIGHTS Chapter 01 Kapitel Titel ADO THE PURE PLAY BERLIN RESIDENTIAL SPECIALIST Investment highlights A focused residential portfolio(,4)
Conference call presentation Q
 Conference call presentation Q1 2018 2018 Content 2 I. TAG highlights Q1 2018 II. TAG financials Q1 2018 III. TAG portfolio Q1 2018 IV. TAG outlook FY 2018 V. Appendix 3 5 12 16 19 Portfolio details, vacancy
Company Presentation. January 2018
 Company Presentation January 2018 Disclaimer This document is for informational purposes only. This document is not intended to form the basis of any investment decision and should not be considered as
ACCENTRO Real Estate AG
 ACCENTRO Real Estate AG Germany s Market Leader in Residential Property Privatisation Company Presentation, 6th November 2018 Interim Financial Report for the 3rd quarter 2018, 30th September 2018 ACCENTRO
ANNUAL REPORT2016 THINKING AHEAD FOR THE CITY OF TOMORROW
 ANNUAL REPORT2016 THINKING AHEAD FOR THE CITY OF TOMORROW GROUP KEY FIGURES OF THE DEUTSCHE WOHNEN AG Profit and loss statement 2016 2015 Change Rental income EUR m 704.5 634.0 11.1 % Earnings from Residential
12 th Annual General Meeting. + Vienna, 8 May 2013
 12 th Annual General Meeting + Vienna, 8 May 2013 conwert is a fully integrated real estate company focusing on residential properties and apartment buildings in Germany and Austria. This focus is complemented
Strategic Financing of a Listed Company
 Strategic Financing of a Listed Company Christian Hillermann ADLER Real Estate AG Dr. Sven Janssen Oddo Seydler Bank AG Contents ADLER Real Estate AG company presentation 1. Company highlights 2. Event
PRELIMINARY INDICATION FOR FULL YEAR 2012 RESULT
 PRELIMINARY INDICATION FOR FULL YEAR 2012 RESULT JANUARY 2013 AGENDA OVERVIEW OF EXTRAORDINARY EFFECTS AND IMPACT ON 2012 RESULT 1 2 EBT TARGET OF 50 MIO IN 2012 WRITE DOWN OF GOODWILL AND INTANGIBLE ASSETS
FINANCIAL RESULTS Q3 2018
 FINANCIAL RESULTS Q3 2018 November 14, 2018 OVERVIEW & INVESTMENT HIGHLIGHTS Chapter 01 Kapitel Titel ADO THE PURE PLAY BERLIN RESIDENTIAL SPECIALIST Investment highlights 1 Berlin residential pure play
FIRST QUARTER 2017 INTERIM STATEMENT
 DEMIRE Deutsche Mittelstand Real Estate AG FIRST QUARTER 2017 INTERIM STATEMENT Fiscal Year January 1 Dezember 31 2017 Foreword of the Executive Board Dear Shareholders, With the quarterly statement for
Company presentation November 2017
 Company presentation November 2017 1 CONTENT Content I. TAG overview and strategy 3 2 II. III. IV. TAG portfolio TAG services business TAG return on capex 7 12 16 V. TAG acquisitions and disposals 21 VI.
Creating today the city of tomorrow
 To our shareholders 1 Management report of the company and the group and annual financial statements for the financial year 2017 Creating today the city of tomorrow Combined management report 1 Foundations
VALUE. QUALITY. RESPONSIBILITY.
 VALUE. QUALITY. RESPONSIBILITY. SUSTAINABLE PORT- FOLIO MANAGEMENT WITH A COMMITMENT TO QUALITY Deutsche Wohnen, with its focus on Berlin, is one of the leading publicly listed property companies in Europe.
interim report Q To our shareholders interim report GSW IMMOBILIEN AG Q MY BERLIN. MY HOME.
 GsW interim report Q1-2013 To our shareholders interim report GSW IMMOBILIEN AG Q1-2013 MY BERLIN. MY HOME. Highlights Operational Highlights 31.03.2013 31.03.2012 Vacancy rate (residential) 2.7 % 3.3
TAG Immobilien AG Q1-Q TAG I 1
 TAG Immobilien AG Q1-Q3 2011 Q1-Q3 2011 TAG I 1 Content I. Group overview page 3-5 TAG investment case, highlights Q3, Q4 Combined entity TAG Colonia II. Portfolio page 6-21 Overview Residential Salzgitter
MARKET REPORT 2017/2018. Accelerating success. Office and Investment Market Berlin
 MARKET REPORT /2018 Accelerating success. Office and Investment Market Berlin Market Overview Office Leasing TOP 7 BERLIN DÜSSELDORF FRANKFURT HAMBURG COLOGNE MUNICH STUTTGART STOCK OF OFFICE SPACE 90.52
BERLINSIDERS HALF YEAR FINANCIAL REPORT
 2 0 1 7 BERLINSIDERS HALF YEAR FINANCIAL REPORT 2017 KEY FIGURES HALF YEAR FINANCIAL REPORT 2017 KEY FIGURES KEY BALANCE SHEET FIGURES In EUR thousand Jun 30, 2017 Dec 31, 2016 Fair value of properties
13 th Kepler Cheuvreux German Corporate Conference Frankfurt, 22 January 2014 Rolf Buch, CEO
 1 Syndicate Analyst Presentation May 2013 13 th Kepler Cheuvreux German Corporate Conference Frankfurt, 22 January 2014 Rolf Buch, CEO Deutsche Annington: Innovation leader based on a long-term vision,
Quarterly Statement A S O F
 Quarterly Statement AS OF KEY FACTS Q3 / 2017 T 1 Key facts RESULTS OF OPERATIONS Q3 2017 Q3 2016 + / % / bp 01.01. 01.01. 30.09.2016 Rental income million 134.7 131.9 2.1 398.4 381.3 4.5 Net rental and
interim report h To our shareholders interim report GSW IMMOBILIEN AG H MY BERLIN. MY HOME.
 GsW interim report h1-2013 To our shareholders interim report GSW IMMOBILIEN AG H1-2013 MY BERLIN. MY HOME. Highlights Operational highlights 30.06.2013 30.06.2012 Vacancy rate (residential) 2.7 % 3.2
Growing Assets Q Figures
 2014 Growing Assets Q1 2014 Figures CONTENT Content 22 I. TAG Highlights FY 2013 / Q1 2014 3 II. TAG Strategy/ Efficiency: Growth and Margins 5 III. TAG Achievements: Vacancy reduction / rent increases
DEUTSCHE WOHNEN. leading performance leading company
 magazine of the annual report 2013 DEUTSCHE WOHNEN is one of Europe s listed real estate companies in terms of market capitalisation. Our operational focus is on the management and development of our residential
BUWOG GROUP COMPANY PRESENTATION DEUTSCHE BANK GERMAN, SWISS & AUSTRIAN CONFERENCE BERLIN 8 JUNE 2016
 BUWOG GROUP COMPANY PRESENTATION DEUTSCHE BANK GERMAN, SWISS & AUSTRIAN CONFERENCE BERLIN 8 JUNE 2016 HIGHLIGHTS 9M 2015/16 Highlights BUSINESS MODEL AUSTRIA & GERMANY ASSET MANAGEMENT RESIDENTIAL ONLY
Condensed Interim Consolidated Financial Statements
 Condensed Interim Consolidated Financial Statements FOR THE NINE MONTH PERIOD ENDED SEPTEMBER 30, 2018 Berlin Munich Condensed Interim Consolidated Financial Statements FOR THE NINE MONTH PERIOD ENDED
10th Annual General Meeting. Vienna, 20 May 2011
 10th Annual General Meeting Vienna, 20 May 2011 Market overview and company development 2010 Earnings performance and balance sheet indicators 2010 Implementation of strategy Overview 1 st Quarter 2011
Westgrund AG Overview
 February 2015 Westgrund AG Overview Geographical focus on Northern and Eastern Germany Köln 6 3 Bremen 31 Frankfurt Hamburg Hannover 24 München WESTGRUND Real estate portfolio based on sqm 6 30 Leipzig
AROUNDTOWN S A. Condensed Interim Consolidated Financial Statements. For the three month period ended March 31, Berlin
 AROUNDTOWN S A Condensed Interim Consolidated Financial Statements For the three month period ended March 31, 2018 Berlin Düsseldorf Content Board of Directors Report 2 Interim consolidated statement of
Q HIGHLIGHTS MEUR MEUR % MEUR MEUR 48.4 MEUR 94.8 MEUR % 1.87% +2.2% +1.9 PP +3.5% +73.8% + >100% +19.9% +81.
 Q1-2 2018 HIGHLIGHTS STRENGTHENED OPERATING PERFORMANCE Occupancy rate 94.7% Rental income MEUR 119.0 Rental income lfl MEUR 98.2 +1.9 PP +3.5% +2.2% KPIs SIGNIFICANTLY IMPROVED Results of AM MEUR 94.8
P R E S E N T A T I O N H1/ A U G U S T
 P R E S E N T A T I O N H1/2014 0 5 A U G U S T 2 0 1 4 D I S CLAIMER The statements contained herein may include statements of future expectations and other forward-looking statements that are based on
First Quarter 2017 Interim Statement
 DEMIRE Deutsche Mittelstand Real Estate AG First Quarter 2017 Interim Statement Fiscal Year January 1 Dezember 31 2017 Foreword of the Executive Board Dear Shareholders, With the quarterly statement for
FY2016 Earnings Call March 7, 2017 Rolf Buch, CEO Dr. A. Stefan Kirsten, CFO
 March 7, 2017 Rolf Buch, CEO Dr. A. Stefan Kirsten, CFO Highlights FFO Growth 2016 FFO1 per share * up 25.1%, driven by internal growth. 10% organic FFO1 growth guided for 2017 (i.e. excluding conwert).
Roadshow Presentation. Dr. Rüdiger Mrotzek Hans Richard Schmitz January 2016
 Roadshow Presentation Dr. Rüdiger Mrotzek Hans Richard Schmitz January 2016 Creating sustainable shareholder value Key investment highlights Increasing portfolio quality Enhancing efficiency, increasing
Summary 1-2. Chairman's and Managing Director's report 3-9. Independent auditor s review report 10
 REPORT AND ACCOUNTS June 2018 INDEX Page Summary 1-2 Chairman's and Managing Director's report 3-9 Independent auditor s review report 10 Condensed Consolidated Statements of Financial Position 11-12 Condensed
Q Results. Conference Call Dusseldorf, 30 April Rolf Buch, CEO Dr. A. Stefan Kirsten, CFO
 Deutsche Annington Immobilien SE Q1 2014 Results Conference Call Dusseldorf, 30 April 2014 Rolf Buch, CEO Dr. A. Stefan Kirsten, CFO Deutsche Annington Immobilien SE 30.04.2014 Presenting today Rolf Buch
S IMMO HY results August 2017
 S IMMO HY results 2017 29 August 2017 Ongoing success in 2017 Excellent HY results following record year 2016 Net income for the period more than tripled compared to HY 2015 Financing result improved by
ACCENTRO Real Estate AG
 ACCENTRO Real Estate AG Germany s Market Leader in Residential Property Privatisation Company Presentation, 9 August 2018 Half-Year Financial Report, 30 June 2018 ACCENTRO AG 1 AGENDA 1 Overview and business
Company presentation April 2017
 Company presentation April 2017 CONTENT Content I. TAG overview and strategy 3 2 II. III. IV. TAG portfolio TAG return on capex TAG acquisitions and disposals 7 13 18 V. TAG financing structure 22 VI.
Q3 results November 2017
 Q3 results 2017 28 November 2017 S IMMO Our process to value creation 1 Purchase Using market niches Opportunistic buying 2 Leveraging potential Convincing track record in property development 3 Sale Country
DEMIRE Deutsche Mittelstand Real Estate AG. Fiscal Year 1 January 31 December 2017
 DEMIRE Deutsche Mittelstand Real Estate AG Third Quarter 2017 Interim Statement Fiscal Year 1 January 31 December 2017 Foreword of the Executive Board Dear Shareholders, It is with great satisfaction that
CORESTATE Capital Group
 CORESTATE Capital Group Q3 2017 Earnings Presentation November 2017 Disclaimer This presentation contains forward-looking statements that involve a number of risks and uncertainties. Such statements are
Growing Assets 9M 2013 Q1-Q3 2011
 2013 Growing Assets 9M 2013 Q1-Q3 2011 CONTENT Content 22 I. TAG Highlights 3 II. TAG FFO 2013 / Guidance 2014 5 III. TAG Strategy: Growth and Margins 7 IV. TAG Portfolio: Regions / Achievements / Capex
Company presentation June 2017
 Company presentation June 2017 1 CONTENT Content I. TAG overview and strategy 3 2 II. III. IV. TAG portfolio TAG return on capex TAG acquisitions and disposals 7 13 18 V. TAG financing structure VI. TAG
Next Generation Real Estate. HY 2008 Figures. Colonia Real Estate AG HY 2008 Figures 15 th of August 2008 Cologne
 Next Generation Real Estate HY 2008 Figures Colonia Real Estate AG HY 2008 Figures 15 th of August 2008 Cologne Focused and Integrated Business Model Colonia Real Estate AG Investments Management Principal
S IMMO. Accumulate (old: Buy) Target: Euro (old: Euro 16.00)
 Target: Euro (old: Euro 16.00)") S IMMO Accumulate (old: Buy) Target: Euro 17.50 (old: Euro 16.00) 06 April 2018 Price (Euro) 16.50 52 weeks range 16.50 / 11.50 Key Data Country Austria Industry Real Estate Market Segment Prime Market
S IMMO Accumulate (old: Buy) Target: Euro 17.50 (old: Euro 16.00) 06 April 2018 Price (Euro) 16.50 52 weeks range 16.50 / 11.50 Key Data Country Austria Industry Real Estate Market Segment Prime Market
Results FY 2017 Schaeffler AG. Conference Call March 7, 2018 Munich
 Results FY 2017 Schaeffler AG Conference Call Munich Disclaimer This presentation contains forward-looking statements. The words "anticipate", "assume", "believe", "estimate", "expect", "intend", "may",
TLG S TENDER OFFER FOR WCM: BUILDING THE LEADING GERMAN COMMERCIAL REAL ESTATE PLATFORM
 MAY 207 TLG IMMOBILIEN AG TLG S TENDER OFFER FOR WCM: BUILDING THE LEADING GERMAN COMMERCIAL REAL ESTATE PLATFORM DISCLAIMER This presentation is for information purposes only and neither constitutes an
DEMIRE Deutsche Mittelstand Real Estate AG Conference Call Full Year Results 2017
 DEMIRE Deutsche Mittelstand Real Estate AG Conference Call Full Year Results 2017 26 Disclaimer This document is for informational purposes only. This document is not intended to form the basis of any
TAG Immobilien AG preliminary figures
 TAG Immobilien AG Q1-Q3 2011 TAG I 1 Content I. Group overview page 3-6 II. Portfolio page 7-15 III. Group financials page 16-17 IV. Financial structure page 18-19 V. Share page 20-21 VI. Acquisitions
Prime Office REIT-AG EXCELLENCE IN GERMAN REAL ESTATE. Roadshow FY 2011 results Zurich, London, Frankfurt, Brussels, Paris and Amsterdam April 2012
 Prime Office REIT-AG EXCELLENCE IN GERMAN REAL ESTATE Roadshow FY 2011 results Zurich, London, Frankfurt, Brussels, Paris and Amsterdam April 2012 0 Disclaimer The statements contained herein may include
9M 2013 Results. November 6, 2013
 Deutsche Annington Immobilien SE 9M 2013 Results November 6, 2013 Deutsche Annington Immobilien SE 06.11.2013 Disclaimer Confidentiality Declaration This presentation has been specifically prepared by
FY 2016 Results. 28 April DEMIRE Deutsche Mittelstand Real Estate AG April 2017
 FY 2016 Results 28 April 2017 Agenda Section Page Highlights 2016 3 Market Update 4 Portfolio Performance 5 Key Financials 9 Strategic Review and Next Steps 12 Share Information 13 Contact Details 14 2
2017 HALF YEAR 25 JULY 2017
 2017 HALF YEAR RESULTS 25 JULY 2017 Strong financial results and robust balance sheet Driving performance through operational excellence and disciplined capital allocation High quality pipeline of growth
FINANCIAL STATEMENTS. For the year ended December 31, 2013
 2013CONSOLIDATED FINANCIAL STATEMENTS For the year ended December 31, 2013 BOARD OF DIRECTORS REPORT REPORT OF THE RÉVISEUR D ENTREPRISES AGRÉÉ (INDEPENDENT AUDITOR) OF COMPREHENSIVE INCOME OF FINANCIAL
Germany Property Refocus on Fundamentals; Initiating on German Residential Property
 INDUSTRY NOTE Germany Property & Real Estate Germany Property Germany Property Refocus on Fundamentals; Initiating on German Residential Property Key Takeaway With the sector down by 2 from peak valuations
Board of Directors' Report on the Corporation's State of Affairs
 Board of Directors' Report on the Corporation's State of Affairs Brack Capital Properties NV (hereinafter: "the Company") hereby submits the Board of Directors' report for a period of twelve months ending
Corporate. Presentation September 2017
 Corporate www.larespana.com Presentation September 2017 Snapshot 2 First IPO of a Spanish REIT listed on the Spanish Stock Exchange Shareholder Structure Focused on creating both sustainable income and
ADO Properties (ADJ.DE)
") Europe/Germany Equity Research Real Estate Management & Development Rating OUTPERFORM Price (02 Nov 16, ) 32.93 Target price ( ) 38.50 Market Cap ( m) 1,452.0 Enterprise value ( m) 2,360.7 *Stock ratings
Europe/Germany Equity Research Real Estate Management & Development Rating OUTPERFORM Price (02 Nov 16, ) 32.93 Target price ( ) 38.50 Market Cap ( m) 1,452.0 Enterprise value ( m) 2,360.7 *Stock ratings
CONSOLIDATED FINANCIAL STATEMENTS 2016
 CONSOLIDATED FINANCIAL STATEMENTS 2016 /Leipzig 1 2 /Halle CONSOLIDATED FINANCIAL STATEMENTS FOR THE YEAR ENDED DECEMBER 31, 2016 IMPRINT Publisher: Grand City Properties S.A. 24, Avenue Victor Hugo L-1750
Interim Financial Report Vonovia SE
 Interim Financial Report Vonovia SE for the first quarter of 2016 Key Figures in million Key Financial Figures 3M 2016 3M 2015 Change in % Rental income 392.0 263.6 48.7 Adjusted EBITDA Rental 269.0 177.1
This document is a non-binding translation only. For the binding document please refer to the German version, published under
 Q1 Interim Report First Quarter 2015 This document is a non-binding translation only. For the binding document please refer to the German version, published under www.adler-ag.com 2 Interim report for
Autumn Presentation. la foncière parisienne
 Autumn 2017 Presentation I. Background II. Portfolio centered on Paris Central Business District III. Key aspects of TERREÏS Model IV. H1 2017 Results 2 TERREÏS at a glance Property investment company
LEG Immobilien AG Q1 Results 2014
 LEG Immobilien AG Q1 Results 2014 15 th May 2014 Disclaimer While the company has taken all reasonable care to ensure that the facts stated in this presentation are accurate and that the opinions contained
TAG Immobilien AG. FY 2010 figures. FY 2010 Figures TAG I 1
 TAG Immobilien AG FY 2010 figures FY 2010 Figures TAG I 1 Content I. Group overview Investment case/ Strategy, Structure Highlights Combined Entity TAG CRE page 3-9 II. Portfolio page 10-19 Overview Residential
LEG Immobilien AG H1 Results 2015
 LEG Immobilien AG H1 Results 2015 14 th August 2015 Disclaimer While the company has taken all reasonable care to ensure that the facts stated in this presentation are accurate and that the opinions contained
INTERIM REPORT ON THE 3RD QUARTER GROWING CASHFLOWS
 INTERIM REPORT 2017 ON THE 3RD QUARTER GROWING CASHFLOWS 2 Group financials Group financials 3 GROUP FINANCIALS in EUR m 01 / 01 09 / 30 / 2017 01 / 01 09 / 30 / 2016 Income statement key figures Rental
FY2017 Annual General Meeting 19 April 2018
 FY2017 Annual General Meeting 19 April 2018 Agenda Key Highlights About Tikehau Capital European Market Review Portfolio Overview Financial Highlights Conclusion 2 Key Highlights FY2017 Key Highlights
CPI PROPERTY GROUP reports financial information for the first quarter of 2018
 Press Release Luxembourg, 31th May 2018 CPI PROPERTY GROUP reports financial information for the first quarter of 2018 CPI PROPERTY GROUP (hereinafter CPIPG, the Company or together with its subsidiaries
the new dimension for annual financial statement and management report for the financial year 2012
 the new dimension for annual financial statement and management report for the financial year 2012 Deutsche Wohnen AG Annual Financial Statement and Management Report for the Financial Year 2012 mmanagement
Capital Markets Day ProSiebenSat.1 Media AG. Financials. Axel Salzmann, October 5, 2011
 Capital Markets Day ProSiebenSat.1 Media AG Financials Axel Salzmann, October 5, 211 P7S1 has transformed its financial profile 1 We achieved a significant cost reduction and margin uplift 2 We optimized
Consolidated Financial Statements
 Consolidated Financial Statements FOR THE YEAR ENDED DECEMBER 31, 2017 Berlin Cologne Consolidated Financial Statements FOR THE YEAR ENDED DECEMBER 31, 2017 IMPRINT Publisher: Grand City Properties S.A.
Investor presentation H results
 Investor presentation H1 2011 results Recent highlights New lettings in Belgian and US office portfolio. Occupancy rate improving Heads of terms agreed for hotel in Eilan-project: 20 yr fixed lease, operator
TAG Immobilien AG. Transformation
 TAG Immobilien AG Transformation 2011-2012 Q1-Q3 2011 TAG I 1 Content I. Highlights 2011/ Group overview including DKB page 3-8 II. Portfolio TAG excluding DKB page 9-19 III. TAG Group financials 2011
Elia Group FY2017. At the interest of society
 Elia Group FY2017 At the interest of society 2 Elia Group FY 2017 Chris Peeters Chief Executive Officer Disclaimer You must read the following before continuing. This presentation is only provided for
Conference Call 1st quarter 2018
 Conference Call 1st quarter 2018 Dr. Rüdiger Mrotzek Hans Richard Schmitz Dr. Rüdiger Mrotzek Hans Richard Schmitz 25 April 2018 First quarter 2018 Highlights Berlin Positive operational business development
CONTENT. 01 Highlights. 02 Portfolio Performance. 03 Optimisation of Financing Structure. 04 FY 2017 Results. 05 Outlook FY
 CONTENT 01 Highlights 02 Portfolio Performance 03 Optimisation of Financing Structure 04 FY 2017 Results 05 Outlook FY 2017 2 IMMOFINANZ RESTRUCTURING 5/2015 12/2017 Sale of logistics asset class - focus
S IMMO Annual results for April 2018
 S IMMO Annual results for 2017 05 April 2018 We develop value Attractive properties & real values 1.2m m² space 6.1% Rental yield EUR 1,839,680,000 IFRS Property portfolio 94.8% 73% 27% Occupancy rate
2017 Annual Results. 12 March la foncière parisienne
 2017 Annual Results 12 March 2018 Content I. Introduction II. Portfolio III. Rental business IV. Financial results V. Outlook 2 2017 key figures EPRA liquidation NAV Rental income strategic assets (Offices
CONDENSED INTERIM CONSOLIDATED FINANCIAL STATEMENTS
 CONDENSED INTERIM CONSOLIDATED FINANCIAL STATEMENTS H1JUNE 30, 2015 BOARD OF DIRECTORS REPORT CONDENSED INTERIM CONSOLIDATED FINANCIAL STATEMENTS JUNE 30, 2015 1 CONTENT Board of Directors Report 2-31
Q Earnings Presentation. Rainer Beaujean, Speaker of the Management Board and CFO April 12, 2018
 Q1 2018 Earnings Presentation Rainer Beaujean, Speaker of the Management Board and CFO April 12, 2018 Disclaimer This presentation may contain certain forward-looking statements, including assumptions,
Company Presentation. March 2018 Ströer SE & Co. KGaA
 Company Presentation March 2018 Ströer SE & Co. KGaA INDEX 01 02 03 04 Company Overview Financials and Strategy Guidance 2018 Financial Calendar 2 Ströer At a Glance 2018 Multichannel Media Sales House
Baden-Baden CONSOLIDATED FINANCIAL STATEMENTS
 Baden-Baden CONSOLIDATED FINANCIAL STATEMENTS for the year ended December 31, 2016 Berlin CONTENT DECLARATION OF THE MEMBERS OF THE BOARD OF DIRECTORS 2-3 BOARD OF DIRECTORS REPORT 4-17 INDEPENDENT AUDITORS
Company Presentation. Dr. Rüdiger Mrotzek Hans Richard Schmitz. May 2016
 Company Presentation Dr. Rüdiger Mrotzek Hans Richard Schmitz May 2016 Agenda 1 History / Capital markets track record 2 Portfolio-Management 3 Asset-Management 4 Financial Figures / Financial Position
S IMMO Q3 results November 2018
 S IMMO Q3 results 2018 27 November 2018 We develop value Highlights Q3 2018 Gross profit exceeds previous year s level Earnings per share increased to EUR 1.20 Record FFO I (almost +30% compared to previous
Schaeffler AG 17 th GCC Kepler Cheuvreux. Jan 17, 2018 Frankfurt
 Schaeffler AG 17 th GCC Kepler Cheuvreux Jan 17, 2018 Frankfurt Disclaimer This presentation contains forward-looking statements. The words "anticipate", "assume", "believe", "estimate", "expect", "intend",
CAPTURE CHANCES DRIVE INNOVATION
 CAPTURE CHANCES DRIVE INNOVATION LEG Immobilien AG 10 August 2018 H1-2018 Results Disclaimer While the company has taken all reasonable care to ensure that the facts stated in this presentation are accurate
2011 first-half earnings
 2011 first-half earnings Bernard Michel Non-executive chairman Christophe Clamageran Chief executive officer Gilles Bonnier Chief financial officer Paris, July 27, 2011 H1 2011 snapshot in mn June 30,