Deutsche Wohnen SE.» H results. Conference Call, 14 August 2018
|
|
|
- Anne Hood
- 5 years ago
- Views:
Transcription

1 Deutsche Wohnen SE» H results Conference Call, 14 August
2 » Agenda 1 Highlights
3 » Highlights H Strong operational business L-f-l growth strong at 4.5% for the total portfolio, 5.3% in Berlin Continued high rent potential of >30% across portfolio Good growth in core business letting, leading to improved NOI margin of 79.4% (+2pp yoy) Strong FFO I per share growth of 11% to EUR 0.70 Updated valuation based on refined clustering of portfolio EUR 680m portfolio revaluation leads to average FV of EUR 1,961 per sqm L-f-l valuation uplift in Berlin almost 5% EPRA NAV growth of 4.7% to EUR per share Expansion of Nursing & Assisted Living Acquisition of 30 nursing & assisted living facilities with c. 4,700 care places Mainly located in metropolitan areas Acquisition price of EUR 680m at ~5% EBITDA yield on a fully integrated basis Full year guidance confirmed 3
4 » Concentrated portfolio with high reversionary potential Strategic cluster Residential units (#) % of total (measured by fair value) In-place rent 1) 30/06/2018 (EUR/sqm/month) New-letting rent 30/06/2018 (EUR/sqm/month) Rent potential 2) 30/06/2018 (in %) Vacancy 30/06/2018 (in %) Strategic core and growth regions 160, % % 2.1% Core + 141, % % 2.0% Core 18, % % 2.4% Non-core 1, % % 5.4% Total 161, % % 2.1% Thereof Greater Berlin 114, % % 2.0% Reversionary potential across entire portfolio constant at 31% (36% in Berlin) Vacancy of 2.1%, of which ~50bps capex driven 1) Contractually owed rent from rented apartments divided by rented area 2) Unrestricted residential units (letting portfolio); rent potential = new-letting rent compared to in-place rent 4
5 » Strong like-for-like rental growth Like-for-like 30/06/2018 Residential units (#) In-place rent 1) 30/06/2018 (EUR/sqm) In-place rent 1) 30/06/2017 (EUR/sqm) Change (y-o-y) Vacancy 30/06/2018 (in %) Vacancy 30/06/2017 (in %) Change (y-o-y) Strategic core and growth regions Core + 135, % 1.8% 1.7% 0.1 pp Core 18, % 2.4% 2.1% 0.3 pp Letting portfolio 2) 154, % 1.9% 1.7% 0.2 pp Total 158, % 2.0% 1.8% 0.2 pp Thereof Greater Berlin 112, % 1.9% 1.8% 0.1 pp Like-for-like rental growth in Berlin continues to be strong with 5.3% Tenant turnover stable at 8% across entire portfolio, around 7% in Berlin 1) Contractually owed rent from rented apartments divided by rented area 2) Excluding non-core and disposal stock 5
6 » Regions Highlights Residential units (#) FV 30/06/2018 (EUR m) FV 30/06/2018 (EUR/sqm) Value uplift of EUR 680m mainly reflects widening of rent potential Multiple in-place rent 30/06/2018 Multiple re-letting rent 30/06/2018 Multiple in-place rent 31/12/2017 Fair Value 31/12/2017 (EUR/sqm) Core + 141,323 18,285 2, ,000 Greater Berlin 114,226 15,282 2, ,090 Core 18,886 1,376 1, ,149 Non-Core 1, Total 161,468 19,716 1, ,886 DW development of multiples in Berlin 27.1x 27.8x 23.7x 7.6x spread 18.7x 16.1x 20.2x 20.2x 18.9x 2.6x 15.7x 13.5x H Multiple in-place rent Multiple re-letting rent Total portfolio valued at EUR 19.7bn Core + amounts to EUR 2,085 per sqm, Berlin at EUR 2,186 per sqm Unchanged valuation in Berlin based on reletting rent multiples 6
7 » L-f-l valuation uplift of almost 5% in Berlin Components of valuation uplift 1) (EUR bn) Key regions % of portfolio (based on FV) Like-for-like valuation uplift H Core + 93% 4.3% Greater Berlin 78% 4.6% Rhine-Main 6% 3.4% Rhineland 2% 3.2% Dresden / Leipzig 4% 4.4% 18.9 EUR 680m valuation uplift Mannheim / Ludwigshafen 2% 1.0% Core 7% 0.1% Fair Value Dec-2017 Acquisitions and Investments Disposals Yield compression Performance Fair Value Jun-2018 Hanover / Brunswick 4% 0.1% Kiel / Lübeck 2% 0.1% Total 100% 3.6% Major source of valuation uplift is Core + with 95% in Berlin Latest valuation reflects updated clustering of our portfolio and takes into account recent developments in micro locations 1) Excluding Nursing and Assisted Living as well as unbuilt land 7
8 » Investments into the portfolio accelerate H H Modernization & Maintenance per sqm (annualized) EUR m EUR / sqm 1) EUR m EUR / sqm 1) up to 45 Maintenance (expensed through p&l) Modernization (capitalized on balance sheet) up to ~9-10 H FY-2017 H FY-2018e Total Maintenance Modernization Significant increase in modernization investments to up to EUR ~35 per sqm, due to progressing Capex programme Re-letting investments continue to build up 12% yield on cost 1) Annualized figure, based on the quarterly average area 8
9 » Strong letting business in EUR m H H Income from rents (rental income) Income relating to utility/ ancillary costs Income from rental business Expenses relating to utility/ ancillary costs (167.4) (186.0) Rental loss (3.4) (2.5) Maintenance (44.0) (49.7) Others (3.5) (2.7) Earnings from Residential Property Management Personnel, general and administrative expenses (23.6) (22.6) Net Operating Income (NOI) NOI margin 79.4% 77.4% NOI in EUR / sqm / month Income from rents up 5.7% mainly on the back of rent increases and smaller acquisitions Development of NOI margin 91.0% 91.0% 90.8% 78.5% 77.4% 79.4% H H H NOI margin NOI margin (adj. for maintenance) Attractive NOI margin of 79.4% despite capex induced increase in vacancy related costs 9
10 » Disposal business delivers attractive margins Disposals Privatization Institutional sales Total with closing in H H H H H H No. of units , ,807 Proceeds (EUR m) Book value (EUR m) Price in EUR per sqm 2,411 1,925 1, n/a n/a Earnings (EUR m) Gross margin 41% 33% 11% 16% 26% 20% Cash flow impact (EUR m) Realized prices in privatization reach EUR 2,411/sqm on average. Average selling prices in Berlin at EUR 2,500/sqm Table only considers disposals that already had transfer of titles 10
11 » Stable EBITDA contribution from Nursing and Assisted Living Operations (in EUR m) H H Total income Total expenses (44.9) (41.7) EBITDA operations EBITDA margin 6.3% 9.2% Lease expenses 1) EBITDAR EBITDAR margin 22.3% 25.5% Assets (in EUR m) H H Lease income Total expenses (1.1) (0.4) in EUR m H H Nursing & Assisted Living Other in EUR m H H Staff (26.7) (24.2) Rent / lease (inter-company) 1) (7.5) (7.3) Other (10.7) (10.2) Margin decline mainly from delayed opening of one newly built facility as well as increasing staff expenses EBITDA assets Operations & Assets (in EUR m) H H Total EBITDA Set out in the consolidated group financial statements as Earnings from nursing and assisted living Occupancy level of facilities managed by KATHARINENHOF at 99.2% per H ) The delta between lease expenses (operations) and lease income assets derives from one nursing facility which is only operated but not owned by Deutsche Wohnen group. 11
12 » Attractive acquisitions of 30 facilities in nursing segment signed Object of purchase Purchase price EUR 680m EBITDA yield Expected closing 30 nursing facilities with ~4,700 beds Almost 90% in metropolitan areas ~ 5% EBITDA yield after integration Q Assets and operations: 13 facilities with ~2,700 beds in Hamburg Minority participation in market leading operator of acquired facilities Average occupancy level of 92% significantly above German average of 85% Targeted portfolio investments provide significant upside to income and profitability Assets only: 17 facilities with ~2,000 beds Above average macro and micro locations High quality assets with limited capex needs including 5 high end facilities (Kursana Villas) Managed by renowned operators with WALT of >12 years FV of all nursing assets (pro-forma for signed acquisitions) will amount to c. EUR 1.3 bn and is expected to deliver an unlevered RoCE (FV of assets divided by EBITDA) of c. 6.5% on a fully integrated run-rate basis 12


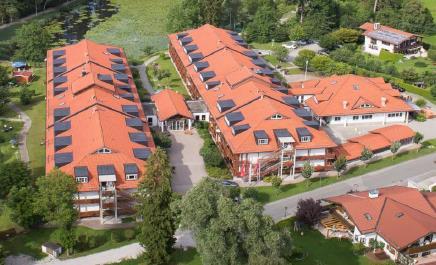
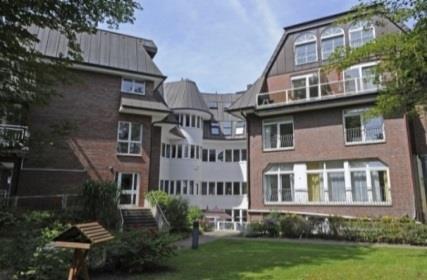
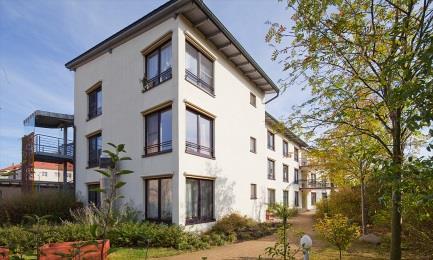
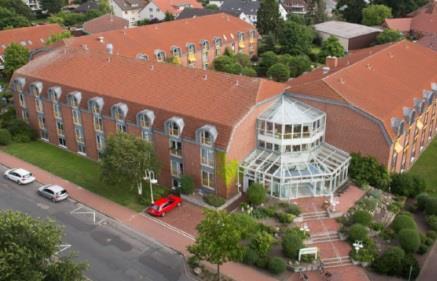
13 » Overview of signed nursing facilities P&W, Moosberg, Hamburg P&W, Alsterberg, Hamburg P&W, Farmsen, Hamburg P&W, Lutherpark, Hamburg Casa Reha Niddaauen, Frankfurt a. M. Kursana Villa, Frankfurt a. M. Kursana Villa, Königstein Kursana Villa, Wiesbaden Korian Angerhof, Glienicke bei Berlin Kursana Domizil, Potsdam Casa Reha Gilberghof, Siegen Kursana Villa, Bonn Facilities are predominately in metropolitan regions (Hamburg, Frankfurt, Berlin) and of premium quality 13
14 » Robust growth of EBITDA margin to 82% in EUR m H H Development of cost ratio Earnings from Residential Property Management Earnings from Disposals % 10.9% 10.6% Earnings from Nursing and Assisted Living Segment contribution Corporate expenses (41.1) (39.9) Other operating expenses/income (0.5) (0.5) EBITDA One-offs H H H Cost ratio (Corporate expenses divided by rental income) Development of adj. EBITDA margin 1) 82.0% 79.3% 76.6% Adj. EBITDA (incl. disposals) Earnings from Disposals (9.0) (20.5) Adj. EBITDA (excl. disposals) H H H adj. EBITDA margin (excl. disposals) EBITDA margin increased by 2.7pp on the back of strong earnings growth from residential property management 1) Defined as adj. EBITDA divided by rental income 14
15 » FFO I per share growth of 11% yoy to EUR 0.70 in EUR m H H EBITDA (adjusted) Earnings from Disposals (9.0) (20.5) Long-term remuneration component (share based) Finance lease broadband cable network At equity valuation FFO I margin development 63.5% 65.5% 69.8% 58.1% 60.2% 64.2% FY-2017 H H Interest expense/ income (recurring) (46.3) (49.5) Income taxes (21.7) (19.2) FFO I margin FFO I margin (pre-tax) Minorities (3.2) (3.1) FFO I Earnings from Disposals FFO II FFO I per share in EUR 1) Diluted number of shares 2) % change FFO per share development in EUR +11% +17% Diluted FFO I per share 2) in EUR FFO II per share in EUR 1) Undiluted H H Diluted FFO I margin improved by 4pp with strong top-line growth 1) Based on weighted average shares outstanding (H m and H m shares) 2) Based on weighted average shares assuming full conversion of in the money convertible bonds 15
16 » EPRA NAV per share increased by almost 5% in H in EUR m 30/06/ /12/2017 Equity (before non-controlling interests) 10, ,888.2 Fair values of derivative financial instruments EPRA NAV per share (undiluted) in EUR % % +6% Deferred taxes (net) 3, ,786.6 EPRA NAV (undiluted) 13, ,676.8 Shares outstanding in m EPRA NAV per share in EUR (undiluted) /12/ /06/ /12/ /06/2018 EPRA NAV per share (undiluted) Effects of exercise of convertibles 0.0 1) 0.0 1) EPRA NAV (diluted) 13, Shares diluted in m ) ) EPRA NAV per share in EUR (diluted) ) Effects of convertible bonds are only considered if the respective instruments are in the money/ dilutive 2) Currently both convertible bonds are out-of-the-money 16
17 » Conservative long-term capital structure Rating Ø maturity A- / A3; stable outlook ~ 7.7 years Low leverage, long maturities and strong rating Flexible financing approach to optimize financing costs % secured bank debt 67% % unsecured debt 33% Ø interest cost 1.3% (~89% hedged) LTV target range 35-40% LTV at 33.8% as of Q (-3.1pp yoy), pro-forma for signed acquisition ~38% ICR (adjusted EBITDA excl. disposals / net cash interest) ~6.9x (+1.0x yoy) Short-term access to c. EUR 1bn liquidity through CP program and RCFs Maturity profile in EUR m based on notional amounts 1) Debt structure 1) Bank Debt Convertible Bonds Bonds Pvt. Placements >2028 Convertible Bonds Private Placements Bonds 7% 5% 21% 67% Bank Debt 1) As of 30 June 2018, excluding commercial papers 17
18 »
19 » Nursing & Assisted Living Sector update
20 » Why we target to increase our investment in nursing market Increasing demand for nursing Well funded long-term care insurance Strong demographic trends Robust cash flows Fragmented market with need for consolidation Growth opportunities Attractive risk/ return profile Track record c. 20 years of experience in nursing through GEHAG Competitive advantage by applying DW group financing conditions Financing Full value generation chain Capability to manage assets & operations leads to higher profitability and lower risk profile 20
21 » Nursing identified as attractive driver for further external growth Operator Facilities # Beds # KATHARINENHOF 1) 24 2,642 P&W 1) 13 2,691 Pro Seniore 22 3,396 Korian 14 1,617 Kursana Orpea Alloheim Other Total 89 12,200 Fragmented market with promising fundamental outlook offers room for consolidation Significant investments needed to absorb required capacity builtup in industry with inefficient access to capital Attractive risk adjusted yield spread compared to other real estate asset classes Proven operational know-how through KATHARINENHOF 1) brand High occupancy rates of c. 99% 2) leading to superior profitability Proven integration track record for acquired businesses Deutsche Wohnen business model superior to most peers As owner with operational know-how 1) exposed to lower risk and low cost of funding Expansion of day care and outpatient care with synergies to residential sector Focus on acquisition of real estate properties Preferably in combination with operational management to further enhance yields Adherence to strict acquisition criteria focussing on quality, market positioning and expected value upside Top 5 private operators in Germany Through recent acquisitions we strongly extended our market share footprint in Germany. Our facilities are mainly managed by the top 5 private operators in Germany 1) Managed through partnership structures 2) Excluding new facility in Chemnitz as this is in ramp-up phase 21
22 Germany Italy Portugal Greece Slovenia Croatia Lithuania Spain Latvia Austria Europe (EU28) Netherlands Finland Hungary Estonia Romania France Sweden Malta Poland United Kingdom Slovakia Luxembourg Cyprus Ireland Highlights» Solid funding base supported by strong demographic trends Healthcare expenditure increasing in Germany 195 With >11% of GDP Germany is among top healthcare spenders in Europe Other Healthcare expenditures (EUR bn) Nursing expenditure (EUR bn) Source: Federal Statistical Office, PKV Pflegedatenbank Germany`s population among oldest in Europe Median age Care dependent people by age groups 0.7% 0.6% 2.0% 3.2% 5.4% 9.9% 21.1% 39.7% 66.1% Growth forecast for inpatient and outpatient care 3.5% 0-<15 15-<60 60-<65 65-<70 70-<75 75-<80 80-<85 85-<90 >90 Total People in need of care (2015) Source: Latest analysis of the German Federal Statistical Office made in 2017 in m Today 3.5% of German population are care dependent. Inpatient care is expected to grow by 400k, outpatient care by 300k until e 2045e 2060e ~ 70% Inpatient care ~ 30% Outpatient care Source: European Statistical Office, 2017 Source: Federal Statistical Office,
23 » Demographic trends in Germany underpin rising demand Increasing share of age groups 65+ and 80+ Ageing population leads to increasing demand for nursing homes % 17% 23% Nursing care market driven by (irreversible) demographic trends - increasing demand for social, medical and nursing services 77% Main reasons for aging German population are: Decreasing birth rates 8% 29% Ageing of former baby boomer generations Increasing life expectancy 2030E 71% 21% Until 2030 the age group >80 years is expected to increase by more than 30% Approx. 8% of the German population will be >80 years in E 66% 13% 21% 34% Increased demand for specialized facilities to serve e.g. Alzheimer s disease / dementia The requirement for professional service structures in nursing care are further boosted by ongoing trends: Increasing mobility Bigger distance between family members Age groups: Higher share of employment of all family members Source: Latest forcast of the German Federal Statistical Office made in
24 » Forecast - required additional nursing home beds by federal state Additional demand for care beds by 2030 (constant nursing home ratio 2013)¹ Additional demand for care beds by 2030 (nursing home ratio %)² Schleswig-Holstein 16,357 Hamburg 5,566 Mecklenburg- West Pomerania 6,882 Schleswig-Holstein 23,403 Hamburg 9,495 Mecklenburg- West Pomerania 12,308 Bremen 2,038 Brandenburg 11,224 Bremen 3,720 Brandenburg 19,744 Lower Saxony 34,401 North Rhine-Westphalia 47,906 Hesse 20,014 Berlin 15,991 Saxony-Anhalt 7,591 Saxony 13,322 Lower Saxony 57,431 North Rhine-Westphalia 89,539 Hesse 36,085 Berlin 26,177 Saxony-Anhalt 13,916 Saxony 23,777 Rhineland- Palatinate 13,130 Thuringia 7,039 Rhineland- Palatinate 22,885 Thuringia 13,257 Saarland 2,565 Saarland 5,060 Baden-Württemberg 41,630 Bavaria 48,597 Baden-Württemberg 65,944 Bavaria 76,776 = 293,336 = 498,817 Number of care beds: 2,000 <6,000 6,000 <10,000 10,000 <16,000 16,000 <40,000 40,000 <50,000 Number of care beds: 3,000 <10,000 10,000 <16,000 16,000 <25,000 25,000 <60,000 60,000 <90,000 Source: Federal Statistical Office 2015, Georg Consulting (2016) In all federal states and in almost all urban districts strong demand for additional nursing homes beds Good location for nursing property good location for residential property 1) Scenario assumes constant proportion of the number of people in need of care to the number of nursing homes as in 2013 (basic ratio) 2) Scenario assumes 5 percentage-point increase in the number of people in need of care compared to
25 » Highly fragmented market structure for nursing home operators Nursing home operators split by type (# of beds) Source: Federal Statistical Office of Germany, 2017 Operator 42% 5% Source: % Non-profit operators Private operators Public operators Top private operators (by # of beds) # of facilities # of beds Market share (%) Korian , % Alloheim Gruppe , % Pro Seniore , % Orpea / Silver Care , % Kursana 97 10, % Vitanas 51 7, % Azurit 72 7, % Nursing home operator market is very fragmented Top ten private operators only c. 12% market share, expected to increase further Private operators manage c. 42% Many small (family) operators, often with less than 10 facilities and capex backlog Occupancy levels vary widely across operators and regions Average occupancy rate of only c. 85% Free capacity in many instances does not fulfil today s standards for nursing homes (i.e.: free capacity available capacity) Significant consolidation trend among private operators in recent years 3 of the top 5 operators are international companies Consolidation is expected to continue and to accelerate professionalism (and therewith profitability) of overall sector Private operators increase their capacity the fastest (by acquisition or greenfield projects); growth of non-profit operators limited by funding constraints 25
26 » Transaction market for nursing home properties % Source: CBRE 2018, DW in EUR m Nursing homes yield spread significantly above other asset classes Nursing homes yield spread to 10y Bund Berlin residential Nursing homes Prime office Germany Transaction volumes in nursing home property market 3,000 Nursing home property market accounts for c. 1.8% of overall commercial real estate transaction volume in 2017 Nursing home properties offer attractive yields at low risk: Fundamentals for niche sector remain strong and promising for the long-term Transaction prices are still demonstrating significant yield premiums to comparable asset classes Transaction volumes increased significantly over past years Professional investors represented largest purchaser group over last years Key limiting factor of further increased transaction volumes is scarcity of supply despite positive macro outlook , H Source: CBRE,
27 » Overview of elderly care market in Germany Description Payment regulation Nursing homes (inpatient care) Covers all levels of inpatient care Focus on high care degrees Daycare programs located in nursing homes Short-term inpatient care, if need of care is only temporarily Reimbursement level depending on extend of care required (5 degrees available) Long-term care insurance (LTC) covers a monthly allowance, remainder has to be paid by pension / private wealth Social security system covers if of no private wealth available Outpatient care Covers all levels of outpatient care incl. domestic support Focus on low care degrees Services are delivered at home or in assisted living facility Reimbursement level depending on level of care required Social LTC insurance pays defined allowance, per month for either: Professional outpatient care service For a relative to take on care Remainder to be paid by pension / private wealth Assisted living Special form of outpatient care with focus on premium customers Apartments are rented out incl. complementary LTC packages and availablity of extra services Relatively unregulated market in terms of rent regulation Not reimbursed by LTC insurance 27
28 » Overview of regulatory environment for nursing homes (1/2) New homes authorization No formal permission (except for building laws) required to set up new nursing homes Operators entitled to enter into new supply contract with Care Funds (Pflegekassen) as soon as structural requirements for operating a nursing home are met Quality requirements Independent operators (MDK 1) ) check process structure and performance quality Frequency of quality assurance audits of outpatient and inpatient care has historically increased Mandatory publication of MDK quality reports of each nursing home planned through latest regulatory initiatives to increase transparency Prices for nursing care services strictly regulated and negotiated with authorities and revised every 1-2 years, usually above cost inflation Pricing & financing Total cost for a nursing home place is funded by the respective resident, care fund and, if required, social welfare (depending on residents' income) Vast majority of nursing services costs is financed by care fund; level of reimbursements are defined by laws, depending on level of care required Accommodation & catering as well as investment costs are, in principle, financed by resident (or social welfare system); investment rates are set freely for resident not receiving public aid Operators are free to generate additional revenues from secondary services, financed by respective resident 1) MDK German Health Insurance Medical Service 28
29 » Overview of regulatory environment for nursing homes (2/2) Standard daily cost breakdown of nursing homes 25% 15% 60% Nursing services costs Accomodation & catering costs Investment costs Germany is one of few countries which requires all citizens to have either public or private long-term care insurance Care Funds (Pflegekassen) provide a cost cover for care related services to the operator, based on the level of patient care necessary Source: Knight Frank Research, 2014 Funding of nursing home costs Average Payment Breakdown Care Funds supported by mandatory social insurance as provided by care insurance law 1) Funded at a contribution rate of 2.5% of gross salary and 2.8% respectively for childless employees 45% 55% Residents (pension, savings) or social welfare Care Funds (Pflegekassen) In addition to national regulation, there are different regional legislations on fit-out standards, multioccupancy ratios minimum room measurement and employee skills (not homogeneous) Source: Knight Frank Research, 2014 Germany has one of the most stable funding systems for long-term care in Europe 1) Pflegeversicherungsgesetz 29


30 » Best in class Nursing and Assisted Living portfolio Uferpalais, Berlin Im Schlossgarten, Brandenburg Wolkenstein, Saxony Wilsdruff, Saxony Quellenhof, Saxony Am Schwarzen Berg, Lower Saxony Garpsen, Lower Saxony Am Auensee, Saxony Oberau, Bavaria Blankenese, Hamburg Zum Husaren, Hamburg Am Lunapark, Saxony 30
31 » Sustainability at Deutsche Wohnen


32 » Strategic sustainability targets (1/2) Strategic targets Examples of operationalized targets Corporate management Strategic management of sustainability activities Embed DW s sustainability philosophy more strongly in minds of business partners Expand stakeholder dialogue Establish sustainability committee Integration of long term sustainability targets in management incentivation Code of conduct for business partners Regular stakeholder surveys Portfolio & new construction Employees High level of customer satisfaction Portfolio to provide up-to-date, future proof quality criteria Create new housing in conurbations Targeted recruitment and integration of new employees Keep employee retention level high Adjust staff development to the requirements of the new working world Ensure there is no discrimination Derive measures after conducting regular tenant surveys Investment programme to refurbish and modernise c. 30,000 units 2,500 new units in-line with sustainability criteria planned for new construction until 2022 Staff recommendation programme Conduct regular employee surveys Expand long-term incentive systems Talent programme for junior staff Comply with Code of Conduct 32
 for smart home technology Society")

33 » Strategic sustainability targets (2/2) Strategic targets Examples of operationalized targets Environment & climate Save 20,000 t of CO2 emissions from 2022 onwards Replace outdated heat generation plants with modern systems Reduce the portfolio of oil-fuelled properties, switching to eco-friendly energy sources Initiate a mass pilot project (3,000 units) for smart home technology Society Expand, continue and structure corporate social responsibility activities Promote a vibrant neighbourhood structure Implement guideline for social and cultural activities Support of youth sport 4-5% of new letting space for social and charitable purposes CSR Reporting Deutsche Wohnen provides sustainability report in accordance with GRI since 2013 ESG ratings with focus on real estate industry (EPRA sbpr, GRESB) CEO responsibility and CSR management within strategy division 33
34 German average (160 kwh/ sqm) Highlights» Focus on energy efficiency Energy intensity of the residential units (in kwh/sqm) ~ 75% ~ 25% 26% 21% 22% 17% 6% 8% >75 (A/B) (C) (D) ( E) (F) >200 (G/H) Given our continued attention to energy efficiency, already 75% of our portfolio perform better than the average residential property in Germany (160 kwh/ sqm per annum) 34
35 » Portfolio and financials
36 » Current level of rents and prices offer significant growth potential Asking prices multifamily housing (in EUR / sqm) 1) Asking rents in German top cities (in EUR / sqm) 2) DW Berlin (book value) Dusseldorf Berlin Cologne Hamburg Frankfurt (Main) Stuttgart Munich 2,186 3,220 3,270 3,200 3,150 4,200 4, % 6,980 2,000 4,000 6,000 8,000 (EUR / sqm) H DW Berlin (re-letting rent) Dusseldorf Cologne Berlin Hamburg Stuttgart Frankfurt (Main) Munich % (EUR / sqm / month) H Dynamic development of residential rents and prices for German top cities, based on strong demographic trends and fundamentals 1) JLL median asking prices based on Immodaten.net including all age clusters, DW portfolio valuation 2) JLL median asking prices based on Immodaten.net including furnished apartments and all age clusters, DW portfolio data 36
37 » Re-letting rents have outpaced in-place rents EUR / sqm DW rent development in Berlin % rent potential H In-place rent (EUR/sqm) 36% rent potential Re-letting rent (EUR/sqm) 30.0x 25.0x 20.0x 15.0x 10.0x DW development of multiples in Berlin 27.1x 27.8x 23.7x 7.6x spread 18.7x 16.1x 18.9x 20.2x 20.2x 2.6x 15.7x 13.5x H Multiple in-place rent Multiple re-letting rent Despite strong regulation rent potential significantly increased since 2014 as new-letting rents have grown much faster than (regulated) in-place rents Spread between in-place and re-letting rent multiples significantly widened over the last years, implying significant further value upside over the coming years 37
38 » Significant scope for rent potential to widen further in Berlin Replacement costs Average replacement costs > EUR 3,500 per sqm, predominately driven by increase of prices for land plots Replacement costs at 1.7x DW Berlin book value New construction requires at least EUR 12 per sqm/ month to allow for 3.5% gross yield 1) Demand supply shortage expected to continue Current shortage of c. 100,000 units; expected to grow to > 200,000 units by 2030 New supply at current run rate of c. 14,000 units (thereof ~40% condominiums) is not sufficient Examples for development of land prices in Berlin (EUR/ sqm) 2) 2,000 1, Suburb location (Marzahn) Central location (Kreuzberg) 3,000 Average location (Treptow) For pick-up of new construction activity further increase of market rents required CAGR +73% +35% +34% Affordability Average DW apartment size of only 60 sqm offers competitive advantage in terms of affordability Increasing demand from 1-2 person(s) households Based on average DW in-place rent of EUR 6.58 per sqm and including ancillary costs average monthly rent appears affordable with EUR ~545 Market rent for fully refurbished apartment leading to average monthly rent of EUR ~810 DW in-place rent DW re-letting rent Market rent 3) Rent (EUR/sqm) Average ancillary cost (EUR/sqm) Average DW apartment size Average rent per month (EUR) Examples for rents in Berlin sqm 60 sqm 60 sqm EUR 545 EUR 688 EUR 810 Berlin rent levels screen well from an affordability perspective 1) Given development of replacement cost and social quota as part of zoning process 2) Source: Committee on Berlin Property Values (Gutachterausschuss Bodenrichtwerte) 3) Market rent for fully refurbished apartments in Berlin 38
39 » Highlights Attractive spread between in-place and re-letting rent multiples offer further potential for NAV growth Regions Residential units (#) FV 30/06/2018 (EUR m) FV 30/06/2018 (EUR/sqm) Multiple in-place rent 30/06/2018 Multiple re-letting rent 30/06/2018 Multiple in-place rent 31/12/2017 Fair Value 31/12/2017 (EUR/sqm) Core + 141,323 18,285 2, ,000 Greater Berlin 114,226 15,282 2, ,090 Rhine-Main 9,938 1,238 1, ,942 Dresden/ Leipzig 6, , ,618 Rhineland 5, , ,285 Mannheim / Ludwigshafen 4, , ,151 Other Core , ,149 Core 18,886 1,376 1, ,149 Hanover / Brunswick 9, , ,164 Kiel / Lübeck 4, , ,218 Core cities Eastern Germany 4, , ,053 Non-Core 1, Total 161,468 19,716 1, ,886 39
40 » Strong like-for-like development as of 30 June 2018 Like-for-like 30/06/2017 Residential units (#) In-place rent 2) 30/06/2018 (EUR/sqm) In-place rent 2) 30/06/2018 (EUR/sqm) Change (y-o-y) Vacancy 30/06/2018 (in %) Vacancy 30/06/2017 (in %) Change (y-o-y) Letting portfolio 1) 154, % 1.9% 1.7% +0.2pp Core + 135, % 1.8% 1.7% +0.1pp Greater Berlin 112, % 1.9% 1.8% +0.1pp Rhine-Main 9, % 1.6% 1.5% +0.1pp Rhineland 4, % 0.7% 0.8% -0.1pp Mannheim/Ludwigshafen 4, % 1.4% 0.6% +0.8pp Dresden/ Leipzig 4, % 2.3% 2.2% +0.1pp Sonstige Core % 0.8% 0.7% +0.1pp Core 18, % 2.4% 2.1% +0.3pp Hanover / Brunswick 8, % 2.0% 1.7% +0.3pp Kiel / Lübeck 4, % 2.4% 2.1% +0.3pp Core cities Eastern Germany 4, % 3.4% 3.0% +0.4pp Total 158,347 3) % 2.0% 1.8% +0.2pp 1) Excluding non-core and disposal stock; 2) Contractually owed rent from rented apartments divided by rented area 3) Total l-f-l stock incl. Non-Core 40
41 » Bridge from adjusted EBITDA to profit in EUR m H H EBITDA (adjusted) Depreciation (4.0) (3.5) At equity valuation Financial result (net) (52.9) 1) (61.4) 1) EBT (adjusted) Valuation properties One-offs (4.2) (22.1) Valuation SWAP and convertible bonds (63.8) (124.7) EBT Current taxes (19.7) (20.6) in EUR m H H Interest expenses (47.8) (49.8) In % of gross rents ~12% ~14% Non-cash interest expenses (6.6) (11.9) Interest income Financial result (net) (52.9) (61.4) One-offs consist of EUR 1.2m refinancing costs mainly related to prepayment fees, EUR 4m project and transaction related costs as well as EUR 1.2m onetime interest earnings related to tax reimbursements Deferred taxes (208.0) (293.5) Profit Profit attributable to the shareholders of the parent company Earnings per share 2) ) Adjusted for Valuation of SWAPs and convertible bonds 2) Based on weighted average shares outstanding (H1-17: m; H1-16: m) 41
42 » Summary balance sheet Assets Equity and Liabilities in EUR m 30/06/ /12/2017 Investment properties 20, ,628.4 Other non-current assets Derivatives Deferred tax assets Non current assets 20, ,766.5 Land and buildings held for sale Trade receivables Other current assets in EUR m 30/06/ /12/2017 Total equity 10, ,211.0 Financial liabilities 4, ,751.1 Convertibles 1, ,669.6 Bonds Tax liabilities Deferred tax liabilities 2, ,496.7 Derivatives Other liabilities Cash and cash equivalents Current assets Total assets 21, ,539.4 Total liabilities 11, ,328.4 Total equity and liabilities 21, ,539.4 Investment properties represent ~95% of total assets Strong balance sheet structure offering comfort throughout market cycles 42
43 » Disposals business remains opportunistic 2,400 2,100 1,800 1,500 1, Development xxx of privatization business 44% 41% 39% 30% 2,086 1,564 1,394 1, % gross margin price in EUR/ sqm Development of institutional sales business 20,000 20% 8% 13% 20% 95% 15,000 92% 90% 91% 91% 14,811 10,000 12,669 90% 9,596 5, ,099 85% % gross margin Cumulative block sales % Core+ (by FV) Continuation of selective privatizations to validate price points in micro locations Continue to achieve attractive gross margins despite > EUR 7bn portfolio revaluations since 2014 Since 2014 realized prices increased by 77% No reliance on free cash flow generation to finance investment program Successful streamlining of portfolio in recent years ~15,000 units disposed at attractive margins since 2014 Non-Core disposals almost completed at prices significantly above book value Share of Core + increased to 92% Too early in cycle to accelerate privatization pace to turn book gains into cash returns for shareholders Opportunistic disposals at attractive prices possible to improve overall quality and further de-risk portfolio 43
44 Year Highlights» Acquisition track record since 2013 Main acquisitions (>1,000 units deal size) Fair Value in EUR/sqm In-place rent in EUR/sqm Deal Residential units # Location At Acquisition 31/12/2017 At Acquisition 31/12/2017 Centuria 5,200 Berlin 711 1, % % Larry 6,500 Berlin 842 1, % % GSW 60,000 Berlin 960 2, % % Windmill ~4,600 Berlin 1,218 1,803 48% % Henry ~1,600 Berlin 1,302 1,835 41% % Accentro 1,200 Berlin 1,227 2,016 64% % Olav 15,200 1,342 1,774 32% % thereof ~5,200 Berlin 1,469 1,959 33% % ~3,800 Kiel 1,043 1,264 21% % ~1,000 other Core + 3,159 3,159 0% % Helvetica ~3,900 Berlin 2,390 2,645 11% % Total ~86,500 Acquisitions delivered attractive total returns through rent development and NAV uplift ~13% of acquired units have been sold at double digit gross margins to streamline portfolio quality 44
45 » Operational and financial improvements drive margins Adj. EBITDA margin (w/o disposals) FFO I margin 75% 77% Avg. cost of debt 3.2% 2.5% 1.8% 1.6% 1.3% 72% 48% 54% 58% 66% 68% 31% 35% Concentrated portfolio and successful integration of acquired businesses as well as further efficiency improvement of operational business let to best in class EBITDA margin Early and proactive management of liabilities to take advantage of attractive financing environment average cost of debt reduced by more than 50% since
46 » Strong generation of total shareholder return Development of dividend in EUR per share CAGR : +24% +8% +37% % % Development of EPRA NAV (undiluted) in EUR per share CAGR : +25% +20% +29% % % Yoy growth 2013(1) Yoy growth DW consistently generated high shareholder return based on capital growth and dividend payments while reducing its risk profile Considering suggested dividend of EUR 0.80 per share, DW delivered a shareholder return for 2017 of EUR 6.86 or c. 23 % of 2016 EPRA NAV (undiluted) 1) As reported, no scrip adjustment 46
47 » Guidance unchanged in H FY-2017 H Reported Guidance in H confirmed FFO I (EUR m) ~ 470 Operational performance Reported Guidance Dividend per share (EUR) 0.80 Reported ~ 0.86 Guidance Based on 65% pay-out ratio from FFO I and current shares outstanding LTV 34.5% ~ 35-40% (target range) Aim to keep current rating Reported Guidance Like-for-like rental frowth 4.4% Reported ~ 3% Guidance ~ 3% based on in-place rent in EUR/ sqm 4-5% based in P&L impact (timing effect) 47

48 » Deutsche Wohnen's residential portfolio is best-in-class Südwestkorso, Berlin Siemensstadt, Berlin Otto-Suhr-Siedlung, Berlin Oranienkiez, Berlin Hellersdorf, Berlin Carl-Legien-Siedlung, Berlin Hufeisensiedlung, Berlin Dresden 48
49 <= 4, >= 9.01 Highlights» Portfolio structure characteristics meeting strong demand Apartment size Ø 60 sqm Year of construction >= 75 sqm, 18% < 40 sqm, 11% 29.0% 30.8% 65 to < 75 sqm, 18% 40 to < 55 sqm, 30% 5.7% 15.9% 18.3% 0.4% 55 to < 65 sqm, 23% <= >= 2000 Rental restrictions (expiring over time) restricted; ~9% In-place rent (Ø 6.40 EUR/sqm/month) 16.2% 17.3% 16.2% 13.3% 9.6% 1.3% 2.0% 5.2% 6.2% 5.6% 4.4% 2.7% non-restricted; ~91% Note: figures as of 31-Dec
50 » The Berlin portfolio at a glance Reinickendorf # 9, % Pankow # 9, % Mitte # 4, % Friedrichshain-Kreuzberg # 8, % Spandau # 13, % Lichtenberg # 8, % Marzahn-Hellersdorf # 14, % Charlottenburg-Wilmersdorf # 7, % Treptow-Köpenick # 4, % Steglitz-Zehlendorf # 10, % Tempelhof-Schöneberg # 5, % Neukölln # 12, % > 3,000 > 5,000 >8,000 >10,000 # units in-place rent (EUR/m²) vacancy City of Berlin # 110, % Greater Berlin # 114, % 50
 Innovation 2 nd best performing European startup ecosystem with app.")
 3) Highest density of researchers and academics in Germany (per capita) 1) Population / economy 2017 Y-o-y Residential market characteristics 2017 Y-o-y")
 EUR 3,046 +1.9% Ø asking rent per sqm/month 5) EUR 9.83 +9.2% Ø asking price per sqm 5) EUR 2,647 +15.3% 1) https://www.berlin.")
51 » Berlin The place to be! Government High-tech Science Seat of parliament, government and professional associations 1) Innovation 2 nd best performing European startup ecosystem with app. 2,000 active tech Startups 2) 6,500 technology firms 15,000 IT students Forecast 2020: 100,000 new jobs 2) Tourism More than 12.9 million arrivals in 2017 (+1.8% compared to 2016) 3) Highest density of researchers and academics in Germany (per capita) 1) Population / economy 2017 Y-o-y Residential market characteristics 2017 Y-o-y Population Population forecast 2035 ~3.7m ~4.0m +1.1% Number of residential units 1.9m <1% New construction ,659 4) +27% Ø unemployment rate 9.0% -0.8pp Ø net household income per month 2) EUR 3, % Ø asking rent per sqm/month 5) EUR % Ø asking price per sqm 5) EUR 2, % 1) 4) Latest number available is of ) CBRE 5) CBRE asking rents and asking prices for multifamily housing 3) visitberlin / Berlin Institute for Statistics 51
52 STI LTI Highlights» Executive Board compensation system as of 1 January Introduction of Share Ownership Guidelines (SOGs) 2 Conversion of the Stock Option Plan into a Performance Cash Plan Reduction of the plan s complexity and meeting of investor and proxy advisor expectations SOG s 1 Share Ownership Guidelines Obligation to hold a fixed number of Deutsche Wohnen shares Investment of the following amount over 4 years: Chief Executive Officer: 300% of base salary (pre-tax) Ordinary Board Member: 150% of base salary (pre-tax) 2 Performance period (4 years) Stock Option Plan (real shares) New plan type Performance Cash Plan Target Value (TV) in! x Relative share price development (50%) Performance 0%-250% Cumulative NAV growth p/s (50%) + Performance = 0%-250% 100% payout of the TV only if share price development has outperformed EPRA Germany index while cumulative NAV growth has been at least 20% over 4 years Cash Payout (Cap 250% of TV) Bonus Bonus Target Value (TV) in Non-Financial x Financial Targets (80%) + = Targets (20%) Cash Payout (Cap 125% of TV) Base salary Base salary STI = Short Term Incentive; LTI = Long Term Incentive 52
53 Disclaimer This presentation contains forward-looking statements including assumptions, opinions and views of Deutsche Wohnen or quoted from third party sources. Various known and unknown risks, uncertainties and other factors could cause actual results, financial positions, the development or the performance of Deutsche Wohnen to differ materially from the estimations expressed or implied herein. Deutsche Wohnen does not guarantee that the assumptions underlying such forward-looking statements are free from errors nor do they accept any responsibility for the future accuracy of the opinions expressed in this presentation or the actual occurrence of the forecasted developments. No representation or warranty (expressed or implied) is made as to, and no reliance should be placed on, any information, including projections, estimates, targets and opinions, contained herein, and no liability whatsoever is accepted as to any errors, omissions or misstatements contained herein, and accordingly, none of Deutsche Wohnen SE or any of its affiliates (including subsidiary undertakings) or any of such person s officers, directors or employees accepts any liability whatsoever arising directly or indirectly from the use of this document. Deutsche Wohnen does not undertake any obligation to publicly release any revisions to these forward-looking statements to reflect events or circumstances after the date of this presentation. 53
54 Deutsche Wohnen SE Mecklenburgische Straße Berlin Phone: Fax: Deutsche Wohnen SE
Deutsche Wohnen SE.» Q results. Conference Call, 15 May 2018
 Deutsche Wohnen SE» Q1 2018 results Conference Call, 15 May 2018 1 » Agenda 1 Highlights Q1 2018 2 Portfolio 3 Financials 4 Appendix 2 » Highlights Q1 2018 Operating business remains strong L-f-l rental
Deutsche Wohnen SE.» 9M 2017 results. Conference Call, 14 November 2017
 Deutsche Wohnen SE» 9M 2017 results Conference Call, 14 November 2017 1 » Agenda 1 Highlights 9M 2017 2 Portfolio 3 Financials 4 Appendix 2 » Highlights 9M 2017 Strong operating business L-f-l rental growth
Deutsche Wohnen SE.» Full year results Conference Call, 23 March 2018
 Deutsche Wohnen SE» Full year results 2017 Conference Call, 23 March 2018 1 » Table of content 1 Highlights 2017 2 Portfolio & valuation update 3 Financials 4 Guidance 5 Appendix 2 » Highlights FY 2017
Deutsche Wohnen SE. Full Year Results 2018 Conference Call 26 March 2019
 Deutsche Wohnen SE Full Year Results 2018 Conference Call 26 March 2019 Agenda 01 02 03 04 Highlights Market and Portfolio Financials and Outlook Appendix deutsche-wohnen.com 2 Highlights FY 2018 Operating
Deutsche Wohnen SE.» Company presentation. November 2017
 Deutsche Wohnen SE» Company presentation November 2017 1 » Content 1 Deutsche Wohnen at a Glance 2 German Residential Real Estate Market 3 Portfolio and Business Segments 4 Key Financials 5 Strategic Focus
Deutsche Wohnen AG.» Company presentation. September 2012
 Deutsche Wohnen AG» Company presentation September 2012 1 » Agenda 1 Major highlights in H1/2012 2 BauBeCon acquisition 3 Proven asset and portfolio management track record in connection with the right
UBS Global Real Estate CEO/CFO Conference. December 1/2, 2015
 UBS Global Real Estate CEO/CFO Conference December 1/2, 2015 01 ADO OVERVIEW AND INVESTMENT HIGHLIGHTS Overview ADO the pure play Berlin residential specialist Investment highlights 1 2 3 Berlin residential
NINE MONTHS FINANCIAL RESULTS NOVEMBER 19, 2015
 NINE MONTHS FINANCIAL RESULTS NOVEMBER 19, 2015 01 ADO OVERVIEW AND INVESTMENT HIGHLIGHTS Overview ADO the pure play Berlin residential specialist Investment highlights 1 2 3 Berlin residential pure play
ANNUAL RESULTS 2015 MARCH 22, 2016
 ANNUAL RESULTS 2015 MARCH 22, 2016 01 OVERVIEW & INVESTMENT HIGHLIGHTS Overview ADO the pure-play Berlin residential specialist Investment highlights 1 2 3 4 Berlin residential pure play with a 1.5bn quality
12 th Annual General Meeting. + Vienna, 8 May 2013
 12 th Annual General Meeting + Vienna, 8 May 2013 conwert is a fully integrated real estate company focusing on residential properties and apartment buildings in Germany and Austria. This focus is complemented
THREE MONTH FINANCIAL RESULTS 2016 MAY 19, 2016
 THREE MONTH FINANCIAL RESULTS 20 MAY 19, 20 01 OVERVIEW & INVESTMENT HIGHLIGHTS Overview ADO the pure-play Berlin residential specialist Investment highlights Key portfolio metrics (end of Q1 20) 1 2 3
Group interim report as of 30 June Creating today the city of tomorrow
 Creating today the city of tomorrow Contents 2 Group key figures 3 Group interim management report 18 Group interim financial statements 35 Further information 2 Deutsche Wohnen SE Group key figures Group
PRELIMINARY INDICATION FOR FULL YEAR 2012 RESULT
 PRELIMINARY INDICATION FOR FULL YEAR 2012 RESULT JANUARY 2013 AGENDA OVERVIEW OF EXTRAORDINARY EFFECTS AND IMPACT ON 2012 RESULT 1 2 EBT TARGET OF 50 MIO IN 2012 WRITE DOWN OF GOODWILL AND INTANGIBLE ASSETS
Q1 Results Conference Call May 29, 2008
 Q1 Results 2008 Conference Call May 29, 2008 Agenda Operational Update Financial Highlights Outlook 2 Agenda Operational Update Financial Highlights Outlook 3 Portfolio Overview Deutsche Wohnen Group Residential
9M 2018 RESULTS 09 NOVEMBER 2018 TLG IMMOBILIEN AG 9M 2018 RESULTS
 TLG IMMOBILIEN AG 9M 208 RESULTS DISCLAIMER This presentation includes statements, estimates, opinions and projections with respect to anticipated future performance of TLG IMMOBILIEN ("Forward-Looking
Acquisition of Casa Reha
 Major step in Korian s expansion in Germany PARIS 10 NOVEMBER 2015 1 Disclaimer 2 Casa Reha: A strategic acquisition Major achievement in Germany Reinforced leadership in the most dynamic European market
Company Presentation. January 2018
 Company Presentation January 2018 Disclaimer This document is for informational purposes only. This document is not intended to form the basis of any investment decision and should not be considered as
FIRST QUARTER 2017 INTERIM STATEMENT
 DEMIRE Deutsche Mittelstand Real Estate AG FIRST QUARTER 2017 INTERIM STATEMENT Fiscal Year January 1 Dezember 31 2017 Foreword of the Executive Board Dear Shareholders, With the quarterly statement for
0/0/0 255, 255, /60/ /221/221 30/60/ /153/ /177/ /217/47 116/222/ /204/ /62/152 0/159/147 M AY 17,
 M AY 17, 2017 1 2 ADO THE PURE PLAY BERLIN RESIDENTIAL SPECIALIST Investment highlights 1 2 3 4 Berlin residential pure play with a 2.3bn quality portfolio Efficient, fully integrated and scalable platform
Westgrund AG Overview
 February 2015 Westgrund AG Overview Geographical focus on Northern and Eastern Germany Köln 6 3 Bremen 31 Frankfurt Hamburg Hannover 24 München WESTGRUND Real estate portfolio based on sqm 6 30 Leipzig
13 th Kepler Cheuvreux German Corporate Conference Frankfurt, 22 January 2014 Rolf Buch, CEO
 1 Syndicate Analyst Presentation May 2013 13 th Kepler Cheuvreux German Corporate Conference Frankfurt, 22 January 2014 Rolf Buch, CEO Deutsche Annington: Innovation leader based on a long-term vision,
ACCENTRO Real Estate AG
 ACCENTRO Real Estate AG Germany s Market Leader in Residential Property Privatisation Company Presentation, 6th November 2018 Interim Financial Report for the 3rd quarter 2018, 30th September 2018 ACCENTRO
FINANCIAL RESULTS Q2 2018
 FINANCIAL RESULTS Q2 2018 August 15, 2018 OVERVIEW & INVESTMENT HIGHLIGHTS Chapter 01 Kapitel Titel ADO THE PURE PLAY BERLIN RESIDENTIAL SPECIALIST Investment highlights A focused residential portfolio(,4)
Conference call presentation Q
 Conference call presentation Q1 2018 2018 Content 2 I. TAG highlights Q1 2018 II. TAG financials Q1 2018 III. TAG portfolio Q1 2018 IV. TAG outlook FY 2018 V. Appendix 3 5 12 16 19 Portfolio details, vacancy
ANNUAL REPORT2016 THINKING AHEAD FOR THE CITY OF TOMORROW
 ANNUAL REPORT2016 THINKING AHEAD FOR THE CITY OF TOMORROW GROUP KEY FIGURES OF THE DEUTSCHE WOHNEN AG Profit and loss statement 2016 2015 Change Rental income EUR m 704.5 634.0 11.1 % Earnings from Residential
Strategic Financing of a Listed Company
 Strategic Financing of a Listed Company Christian Hillermann ADLER Real Estate AG Dr. Sven Janssen Oddo Seydler Bank AG Contents ADLER Real Estate AG company presentation 1. Company highlights 2. Event
Roadshow Presentation. Dr. Rüdiger Mrotzek Hans Richard Schmitz January 2016
 Roadshow Presentation Dr. Rüdiger Mrotzek Hans Richard Schmitz January 2016 Creating sustainable shareholder value Key investment highlights Increasing portfolio quality Enhancing efficiency, increasing
VALUE. QUALITY. RESPONSIBILITY.
 VALUE. QUALITY. RESPONSIBILITY. SUSTAINABLE PORT- FOLIO MANAGEMENT WITH A COMMITMENT TO QUALITY Deutsche Wohnen, with its focus on Berlin, is one of the leading publicly listed property companies in Europe.
2017 BAVARIA S ECONOMY FACTS AND FIGURES
 Bavarian Ministry of Economic Affairs and Media, Energy and Technology 2017 BAVARIA S ECONOMY FACTS AND FIGURES www.stmwi.bayern.de As of August 2017 Area km² 70,550 70,550 70,550 Population (31.12.) 1)
FINANCIAL RESULTS Q3 2018
 FINANCIAL RESULTS Q3 2018 November 14, 2018 OVERVIEW & INVESTMENT HIGHLIGHTS Chapter 01 Kapitel Titel ADO THE PURE PLAY BERLIN RESIDENTIAL SPECIALIST Investment highlights 1 Berlin residential pure play
Memorandum of Understanding Signed with France s Largest Residential Landlord Société Nationale Immobilière (SNI) Assessing the Potential of European
 Assessing the Potential of European") Memorandum of Understanding Signed with France s Largest Residential Landlord Société Nationale Immobilière (SNI) Executive Summary Vonovia has signed a Memorandum of Understanding (MoU) with SNI, the
Memorandum of Understanding Signed with France s Largest Residential Landlord Société Nationale Immobilière (SNI) Executive Summary Vonovia has signed a Memorandum of Understanding (MoU) with SNI, the
BREKO Broadband Study 2017
 BREKO Broadband Study 2017 Market survey among BREKO members For the BREKO Broadband Study 2017, all BREKO network operators were interviewed (nationwide). The study comprises data from around 90% of all
DEMIRE Deutsche Mittelstand Real Estate AG Conference Call Full Year Results 2017
 DEMIRE Deutsche Mittelstand Real Estate AG Conference Call Full Year Results 2017 26 Disclaimer This document is for informational purposes only. This document is not intended to form the basis of any
Company presentation November 2017
 Company presentation November 2017 1 CONTENT Content I. TAG overview and strategy 3 2 II. III. IV. TAG portfolio TAG services business TAG return on capex 7 12 16 V. TAG acquisitions and disposals 21 VI.
Key Data Content Federal Republic of Germany Facts and Figures. Labour market/ Social security. Environment/ Health. States in comparison
 Key Data 2016 Federal Republic of Germany Facts and Figures Population/Employment Economy/Finance Income Labour market/ Social security Working hours Content 2016 Apprenticeship Environment/ Health States
DEMIRE Deutsche Mittelstand Real Estate AG. Fiscal Year 1 January 31 December 2017
 DEMIRE Deutsche Mittelstand Real Estate AG Third Quarter 2017 Interim Statement Fiscal Year 1 January 31 December 2017 Foreword of the Executive Board Dear Shareholders, It is with great satisfaction that
9M 2013 Results. November 6, 2013
 Deutsche Annington Immobilien SE 9M 2013 Results November 6, 2013 Deutsche Annington Immobilien SE 06.11.2013 Disclaimer Confidentiality Declaration This presentation has been specifically prepared by
First Quarter 2017 Interim Statement
 DEMIRE Deutsche Mittelstand Real Estate AG First Quarter 2017 Interim Statement Fiscal Year January 1 Dezember 31 2017 Foreword of the Executive Board Dear Shareholders, With the quarterly statement for
Creating today the city of tomorrow
 To our shareholders 1 Management report of the company and the group and annual financial statements for the financial year 2017 Creating today the city of tomorrow Combined management report 1 Foundations
2017 HALF YEAR 25 JULY 2017
 2017 HALF YEAR RESULTS 25 JULY 2017 Strong financial results and robust balance sheet Driving performance through operational excellence and disciplined capital allocation High quality pipeline of growth
Company Presentation. Dr. Rüdiger Mrotzek Hans Richard Schmitz. May 2016
 Company Presentation Dr. Rüdiger Mrotzek Hans Richard Schmitz May 2016 Agenda 1 History / Capital markets track record 2 Portfolio-Management 3 Asset-Management 4 Financial Figures / Financial Position
Q HIGHLIGHTS MEUR MEUR % MEUR MEUR 48.4 MEUR 94.8 MEUR % 1.87% +2.2% +1.9 PP +3.5% +73.8% + >100% +19.9% +81.
 Q1-2 2018 HIGHLIGHTS STRENGTHENED OPERATING PERFORMANCE Occupancy rate 94.7% Rental income MEUR 119.0 Rental income lfl MEUR 98.2 +1.9 PP +3.5% +2.2% KPIs SIGNIFICANTLY IMPROVED Results of AM MEUR 94.8
10th Annual General Meeting. Vienna, 20 May 2011
 10th Annual General Meeting Vienna, 20 May 2011 Market overview and company development 2010 Earnings performance and balance sheet indicators 2010 Implementation of strategy Overview 1 st Quarter 2011
Condensed Interim Consolidated Financial Statements
 Condensed Interim Consolidated Financial Statements FOR THE NINE MONTH PERIOD ENDED SEPTEMBER 30, 2018 Berlin Munich Condensed Interim Consolidated Financial Statements FOR THE NINE MONTH PERIOD ENDED
BUWOG GROUP COMPANY PRESENTATION DEUTSCHE BANK GERMAN, SWISS & AUSTRIAN CONFERENCE BERLIN 8 JUNE 2016
 BUWOG GROUP COMPANY PRESENTATION DEUTSCHE BANK GERMAN, SWISS & AUSTRIAN CONFERENCE BERLIN 8 JUNE 2016 HIGHLIGHTS 9M 2015/16 Highlights BUSINESS MODEL AUSTRIA & GERMANY ASSET MANAGEMENT RESIDENTIAL ONLY
TAG Immobilien AG Q1-Q TAG I 1
 TAG Immobilien AG Q1-Q3 2011 Q1-Q3 2011 TAG I 1 Content I. Group overview page 3-5 TAG investment case, highlights Q3, Q4 Combined entity TAG Colonia II. Portfolio page 6-21 Overview Residential Salzgitter
DUNDEE INTERNATIONAL REIT Annual Report
 DUNDEE INTERNATIONAL REIT 2011 Annual Report Contents 1 Letter to unitholders 3 Management s discussion and analysis 3 SECTION I OVERVIEW AND FINANCIAL HIGHLIGHTS 4 Basis of presentation 5 Background 5
German Medical Association
 German Medical Association Federation of the German Chambers of Physicians The German Health Care System Workshop of the Serbian Medical Chamber 08 February 2018 Dr. Ramin Parsa-Parsi Head of the Department
DEUTSCHE WOHNEN. leading performance leading company
 magazine of the annual report 2013 DEUTSCHE WOHNEN is one of Europe s listed real estate companies in terms of market capitalisation. Our operational focus is on the management and development of our residential
Company Presentation. Dr. Rüdiger Mrotzek Hans Richard Schmitz. April 2016
 Company Presentation Dr. Rüdiger Mrotzek Hans Richard Schmitz April 2016 Agenda 1 History / Capital markets track record 2 Portfolio-Management 3 Asset-Management 4 Financial Figures / Financial Position
P R E S E N T A T I O N H1/ A U G U S T
 P R E S E N T A T I O N H1/2014 0 5 A U G U S T 2 0 1 4 D I S CLAIMER The statements contained herein may include statements of future expectations and other forward-looking statements that are based on
Provide Domicile GmbH - Investor Report
 - Investor Report Determination Date 20.03.2014 Collection Period 01.12.2013 to 28.02.2014 Interest Accrual Period 06.01.2014 to 07.04.2014 Fixed EURIBOR 0,284 % The Bank and Servicer The Servicer The
CORESTATE Capital Group
 CORESTATE Capital Group Q3 2017 Earnings Presentation November 2017 Disclaimer This presentation contains forward-looking statements that involve a number of risks and uncertainties. Such statements are
MARKET REPORT 2017/2018. Accelerating success. Office and Investment Market Berlin
 MARKET REPORT /2018 Accelerating success. Office and Investment Market Berlin Market Overview Office Leasing TOP 7 BERLIN DÜSSELDORF FRANKFURT HAMBURG COLOGNE MUNICH STUTTGART STOCK OF OFFICE SPACE 90.52
Quarterly Statement A S O F
 Quarterly Statement AS OF KEY FACTS Q3 / 2017 T 1 Key facts RESULTS OF OPERATIONS Q3 2017 Q3 2016 + / % / bp 01.01. 01.01. 30.09.2016 Rental income million 134.7 131.9 2.1 398.4 381.3 4.5 Net rental and
Growing Assets Q Figures
 2014 Growing Assets Q1 2014 Figures CONTENT Content 22 I. TAG Highlights FY 2013 / Q1 2014 3 II. TAG Strategy/ Efficiency: Growth and Margins 5 III. TAG Achievements: Vacancy reduction / rent increases
FY2017 Annual General Meeting 19 April 2018
 FY2017 Annual General Meeting 19 April 2018 Agenda Key Highlights About Tikehau Capital European Market Review Portfolio Overview Financial Highlights Conclusion 2 Key Highlights FY2017 Key Highlights
FINANCIAL STATEMENTS. For the year ended December 31, 2013
 2013CONSOLIDATED FINANCIAL STATEMENTS For the year ended December 31, 2013 BOARD OF DIRECTORS REPORT REPORT OF THE RÉVISEUR D ENTREPRISES AGRÉÉ (INDEPENDENT AUDITOR) OF COMPREHENSIVE INCOME OF FINANCIAL
Interim Financial Report Vonovia SE
 Interim Financial Report Vonovia SE for the first quarter of 2016 Key Figures in million Key Financial Figures 3M 2016 3M 2015 Change in % Rental income 392.0 263.6 48.7 Adjusted EBITDA Rental 269.0 177.1
Provide Domicile GmbH - Investor Report
 - Investor Report Determination Date 29.12.2009 Collection Period 01.09.2009 to 30.11.2009 Interest Accrual Period 05.10.2009 to 05.01.2010 Fixed EURIBOR 0,754 % The Bank and Servicer The Servicer The
FY 2016 Results. 28 April DEMIRE Deutsche Mittelstand Real Estate AG April 2017
 FY 2016 Results 28 April 2017 Agenda Section Page Highlights 2016 3 Market Update 4 Portfolio Performance 5 Key Financials 9 Strategic Review and Next Steps 12 Share Information 13 Contact Details 14 2
Year end report. January-December st of January 2018 Mikael Ericson, President and CEO Erik Forsberg, CFO
 Year end report January-December 2017 31 st of January 2018 Mikael Ericson, President and CEO Erik Forsberg, CFO Agenda 1. Highlights for the fourth quarter and FY 2017 2. Key messages from Capital Markets
BERLINSIDERS HALF YEAR FINANCIAL REPORT
 2 0 1 7 BERLINSIDERS HALF YEAR FINANCIAL REPORT 2017 KEY FIGURES HALF YEAR FINANCIAL REPORT 2017 KEY FIGURES KEY BALANCE SHEET FIGURES In EUR thousand Jun 30, 2017 Dec 31, 2016 Fair value of properties
Company presentation April 2017
 Company presentation April 2017 CONTENT Content I. TAG overview and strategy 3 2 II. III. IV. TAG portfolio TAG return on capex TAG acquisitions and disposals 7 13 18 V. TAG financing structure 22 VI.
interim report h To our shareholders interim report GSW IMMOBILIEN AG H MY BERLIN. MY HOME.
 GsW interim report h1-2013 To our shareholders interim report GSW IMMOBILIEN AG H1-2013 MY BERLIN. MY HOME. Highlights Operational highlights 30.06.2013 30.06.2012 Vacancy rate (residential) 2.7 % 3.2
AROUNDTOWN S A. Condensed Interim Consolidated Financial Statements. For the three month period ended March 31, Berlin
 AROUNDTOWN S A Condensed Interim Consolidated Financial Statements For the three month period ended March 31, 2018 Berlin Düsseldorf Content Board of Directors Report 2 Interim consolidated statement of
Growing Assets 9M 2013 Q1-Q3 2011
 2013 Growing Assets 9M 2013 Q1-Q3 2011 CONTENT Content 22 I. TAG Highlights 3 II. TAG FFO 2013 / Guidance 2014 5 III. TAG Strategy: Growth and Margins 7 IV. TAG Portfolio: Regions / Achievements / Capex
ACCENTRO Real Estate AG
 ACCENTRO Real Estate AG Germany s Market Leader in Residential Property Privatisation Company Presentation, 9 August 2018 Half-Year Financial Report, 30 June 2018 ACCENTRO AG 1 AGENDA 1 Overview and business
2017 Figures summary 1
 Annual Press Conference on January 18 th 2018 EIB Group Results 2017 2017 Figures summary 1 European Investment Bank (EIB) financing EUR 69.88 billion signed European Investment Fund (EIF) financing EUR
DUNA HOUSE GROUP Highlights. March 2018
 DUNA HOUSE GROUP 2017 Highlights March 2018 DISCLAIMER This presentation shall not be considered as an offer or an invitation to tender concerning the purchase, subscription or any other transaction of
interim report Q To our shareholders interim report GSW IMMOBILIEN AG Q MY BERLIN. MY HOME.
 GsW interim report Q1-2013 To our shareholders interim report GSW IMMOBILIEN AG Q1-2013 MY BERLIN. MY HOME. Highlights Operational Highlights 31.03.2013 31.03.2012 Vacancy rate (residential) 2.7 % 3.3
S IMMO. Accumulate (old: Buy) Target: Euro (old: Euro 16.00)
 Target: Euro (old: Euro 16.00)") S IMMO Accumulate (old: Buy) Target: Euro 17.50 (old: Euro 16.00) 06 April 2018 Price (Euro) 16.50 52 weeks range 16.50 / 11.50 Key Data Country Austria Industry Real Estate Market Segment Prime Market
S IMMO Accumulate (old: Buy) Target: Euro 17.50 (old: Euro 16.00) 06 April 2018 Price (Euro) 16.50 52 weeks range 16.50 / 11.50 Key Data Country Austria Industry Real Estate Market Segment Prime Market
European Real Estate Market H
 European Real Estate Market H1 2 18 The European Union MACROECONOMIC OVERVIEW 18. Contribution of some Member States to the EU-28 GDP (million euro) Globally, economic growth remains solid, but less synchronized
Company presentation June 2017
 Company presentation June 2017 1 CONTENT Content I. TAG overview and strategy 3 2 II. III. IV. TAG portfolio TAG return on capex TAG acquisitions and disposals 7 13 18 V. TAG financing structure VI. TAG
This document is a non-binding translation only. For the binding document please refer to the German version, published under
 Q1 Interim Report First Quarter 2015 This document is a non-binding translation only. For the binding document please refer to the German version, published under www.adler-ag.com 2 Interim report for
Company Presentation. Dr. Rüdiger Mrotzek Hans Richard Schmitz. February Preliminary Figures 2014
 Company Presentation Dr. Rüdiger Mrotzek Hans Richard Schmitz February 2015 Preliminary Figures 2014 Agenda 1 History / Capital markets track record 2 Portfolio / Investments 3 Asset Management 4 Financial
Facts and Figures Investment Market for Residential Portfolios Germany 2016
 Facts and Figures Investment Market for Residential Portfolios Germany 2016 As a general rule, the most successful man in life is the man who has the best information. Quote from Benjamin Disraeli If you
Next Generation Real Estate. HY 2008 Figures. Colonia Real Estate AG HY 2008 Figures 15 th of August 2008 Cologne
 Next Generation Real Estate HY 2008 Figures Colonia Real Estate AG HY 2008 Figures 15 th of August 2008 Cologne Focused and Integrated Business Model Colonia Real Estate AG Investments Management Principal
Credit Linked Notes STABILITY CMBS GmbH
 Communications Issuer Administrator STABILITY CMBS 2007 GmbH Wilmington Trust SP Services (Frankfurt) GmbH Steinweg 3 5 6033 Frankfurt am Main, Germany Tel: +49 (69) 2992 5385 Fax: +49 (69) 2992 5387 Wilmington
EIOPA Statistics - Accompanying note
 EIOPA Statistics - Accompanying note Publication references: Published statistics: [Balance sheet], [Premiums, claims and expenses], [Own funds and SCR] Disclaimer: Data is drawn from the published statistics
Corporate. Presentation September 2017
 Corporate www.larespana.com Presentation September 2017 Snapshot 2 First IPO of a Spanish REIT listed on the Spanish Stock Exchange Shareholder Structure Focused on creating both sustainable income and
Facts and Figures Investment Market for Residential Portfolios Germany 2017
 Facts and Figures Investment Market for Residential Portfolios Germany 2017 Much as I know, I wish I knew more. Quote from Wolfgang von Goethe If you require any further information, please do not hesitate
Continuing the growth story: Acquisition of Brack Capital Properties. February 2018
 Continuing the growth story: Acquisition of Brack Capital Properties February 2018 Disclaimer This document has been prepared by ADLER Real Estate Aktiengesellschaft (the Company ) and is the responsibility
Live Long and Prosper? Demographic Change and Europe s Pensions Crisis. Dr. Jochen Pimpertz Brussels, 10 November 2015
 Live Long and Prosper? Demographic Change and Europe s Pensions Crisis Dr. Jochen Pimpertz Brussels, 10 November 2015 Old-age-dependency ratio, EU28 45,9 49,4 50,2 39,0 27,5 31,8 2013 2020 2030 2040 2050
TAG Immobilien AG. Transformation
 TAG Immobilien AG Transformation 2011-2012 Q1-Q3 2011 TAG I 1 Content I. Highlights 2011/ Group overview including DKB page 3-8 II. Portfolio TAG excluding DKB page 9-19 III. TAG Group financials 2011
S IMMO HY results August 2017
 S IMMO HY results 2017 29 August 2017 Ongoing success in 2017 Excellent HY results following record year 2016 Net income for the period more than tripled compared to HY 2015 Financing result improved by
Capital Markets Day ProSiebenSat.1 Media AG. Financials. Axel Salzmann, October 5, 2011
 Capital Markets Day ProSiebenSat.1 Media AG Financials Axel Salzmann, October 5, 211 P7S1 has transformed its financial profile 1 We achieved a significant cost reduction and margin uplift 2 We optimized
INTERIM REPORT ON THE 3RD QUARTER GROWING CASHFLOWS
 INTERIM REPORT 2017 ON THE 3RD QUARTER GROWING CASHFLOWS 2 Group financials Group financials 3 GROUP FINANCIALS in EUR m 01 / 01 09 / 30 / 2017 01 / 01 09 / 30 / 2016 Income statement key figures Rental
TAG Immobilien AG preliminary figures
 TAG Immobilien AG Q1-Q3 2011 TAG I 1 Content I. Group overview page 3-6 II. Portfolio page 7-15 III. Group financials page 16-17 IV. Financial structure page 18-19 V. Share page 20-21 VI. Acquisitions
Interim Financial Report Vonovia SE
 Interim Financial Report Vonovia SE for the first half-year of 2016 Key Figures in million Key Financial Figures H1 2016 H1 2015 Change in % Rental income 774.7 628.0 23.4 Adjusted EBITDA Rental 535.6
Fast and sustainable, profitable growth. Company profile (April 2019)
") Fast and sustainable, profitable growth. Company profile (April 219) FCR Immobilien AG business model FCR with a clear orientation and great potential for increase in value Clear profile FCR Immobilien
Fast and sustainable, profitable growth. Company profile (April 219) FCR Immobilien AG business model FCR with a clear orientation and great potential for increase in value Clear profile FCR Immobilien
Company Presentation HAMBORNER REIT AG. Preliminary figures fiscal year 2013 February 2014
 Company Presentation HAMBORNER REIT AG Preliminary figures fiscal year 2013 February 2014 Agenda 1 2 3 4 History / Capital markets track record Organisation / Portfolio / Investments 2013 Asset Management
Fast and sustainable, profitable growth. Company profile (February 2019)
") Fast and sustainable, profitable growth. Company profile (February 219) Equity Story Highly profitable player with strong growth prospects on attractive real estate markets Sustainable, profitable business
Fast and sustainable, profitable growth. Company profile (February 219) Equity Story Highly profitable player with strong growth prospects on attractive real estate markets Sustainable, profitable business
EIOPA Statistics - Accompanying note
 EIOPA Statistics - Accompanying note Publication reference: Published statistics: [Balance sheet], [Premiums, claims and expenses], [Own funds and SCR] Disclaimer: Data is drawn from the published statistics
Consolidated Financial Statements
 Consolidated Financial Statements FOR THE YEAR ENDED DECEMBER 31, 2017 Berlin Cologne Consolidated Financial Statements FOR THE YEAR ENDED DECEMBER 31, 2017 IMPRINT Publisher: Grand City Properties S.A.
Germany Property Refocus on Fundamentals; Initiating on German Residential Property
 INDUSTRY NOTE Germany Property & Real Estate Germany Property Germany Property Refocus on Fundamentals; Initiating on German Residential Property Key Takeaway With the sector down by 2 from peak valuations
FY2016 Earnings Call March 7, 2017 Rolf Buch, CEO Dr. A. Stefan Kirsten, CFO
 March 7, 2017 Rolf Buch, CEO Dr. A. Stefan Kirsten, CFO Highlights FFO Growth 2016 FFO1 per share * up 25.1%, driven by internal growth. 10% organic FFO1 growth guided for 2017 (i.e. excluding conwert).
BRIGHT OUTLOOK TOGETHER WE BUILD THE FUTURE. HERE AND NOW.
 BRIGHT OUTLOOK TOGETHER WE BUILD THE FUTURE. HERE AND NOW. www.berlinovo.de The leading real estate service provider of Berlin The Berlinovo Immobilien Gesellschaft mbh (berlinovo) is a large real estate
TAG Immobilien AG. FY 2010 figures. FY 2010 Figures TAG I 1
 TAG Immobilien AG FY 2010 figures FY 2010 Figures TAG I 1 Content I. Group overview Investment case/ Strategy, Structure Highlights Combined Entity TAG CRE page 3-9 II. Portfolio page 10-19 Overview Residential
INTERIM FINANCIAL REPORT. First Quarter of 2014
 INTERIM FINANCIAL REPORT First Quarter of 2014 million 3M 2014 3M 2013 Change (%) Key Figures Rental income 180.5 182.0 0.8 Adjusted EBITDA Rental 109.5 109.3 0.2 Income from disposal of properties 60.2