Deutsche Wohnen SE.» Company presentation. November 2017
|
|
|
- Edgar Clarence Dawson
- 6 years ago
- Views:
Transcription

1 Deutsche Wohnen SE» Company presentation November
2 » Content 1 Deutsche Wohnen at a Glance 2 German Residential Real Estate Market 3 Portfolio and Business Segments 4 Key Financials 5 Strategic Focus 6 Key Investment Highlights 7 Appendix 2


3 1» Deutsche Wohnen business model Made in Germany 1 ~160,000 residential units and 51 Nursing & Assisted Living facilities with Fair Value of EUR ~18 bn 2 Focus on metropolitan areas in Germany, 75% of assets in Berlin 3 3 rd largest listed landlord in Europe with market cap of ~EUR 13bn 4 Committed to total shareholder return: dividend + NAV growth 5 Conservative financing structure with low leverage (35 40% LTV) and A- / A3 rating 3
4 2» German Residential is resilient throughout recessions Germany: GDP and rent growth 12% 10% 8% Avg. German GDP growth 1.5% CAGR Top 6 cities German rent growth 3.4% CAGR Berlin rent growth 3.8% 6% 4% 2% 0% -2% -4% -6% -8% German GDP growth Top 6 cities rent growth Berlin rent growth Source: Statista, bulwiengesa. Top 6 cities considered are Dusseldorf, Frankfurt am Main, Hamburg, Cologne, Munich, Stuttgart While German GDP strongly decreased in 2009, rental growth (based on asking rents) in Berlin and Germany remained positive 4
5 Berlin Hamburg Bavaria Baden- Wuerttemberg Hesse North Rhine Westphalia Lower Saxony Bremen Rhineland-Palatinate Schleswig-Holstein Saxony Brandenburg Mecklenburg- Western Pomerania Saarland Thuringia Saxony-Anhalt 2» Market and sector specific trends underpin the investment case 300, , , ,000 Net immigration and new construction in Berlin Increasing shortage 144, , , (5) Berlin with strongest population growth forecast Development of residents: Boomtown Berlin Change in number of residents (in %) Berlin expected to grow by c. 500k inhabitants by (0.1) (3.0) (4.4) (4.8) 100,000 96,000 (10) (15) (6.8) (10.2) (10.6) 49,000 45,009 50,000 31,350 20,628 12,058 5, Cumulated population growth Cumulated new construction Source: Amt für Statistik Berlin / Brandenburg Source: iwd, Population forecast as of 29 September 2017 Supply demand imbalance has significantly widened in recent years in Berlin with no indication of reversal of trend Demographic forecasts show strongest growth for federal state of Berlin with c. 500k additional inhabitants by
6 2» Current level of rents and prices offer significant growth potential Asking prices multifamily housing (in EUR / sqm) Asking rents in German top cities (in EUR / sqm) DW Berlin (book value) 1,884 DW Berlin (re-letting rent) 8.31 Dusseldorf 2,499 Berlin 9.79 Cologne 2,627 Dusseldorf Berlin 2,650 Cologne Hamburg 2,820 Hamburg Frankfurt (Main) 3,406 Stuttgart Stuttgart 3,412 Frankfurt (Main) Munich 6, ,500 2,500 3,500 4,500 5,500 6,500 (EUR / sqm) M 2017 Source: CBRE Median asking prices, DW portfolio valuation Munich (EUR / sqm / month) M 2017 Source: CBRE Median of asking rents, DW re-letting rent Dynamic development of residential rents and prices for German top cities, based on strong demographic trends and fundamentals Deutsche Wohnen portfolio offers catch-up potential for rents and values CBRE s asking prices for multifamily housing are c. 40% above Deutsche Wohnen fair value per sqm CBRE asking rents c. 18% above current re-letting rent of Deutsche Wohnen portfolio in Berlin Source: CBRE ; CBRE adjusts values for outlliers, same rent offers in different apartment searches and excludes new construction as well as furnished flats 6
7 3» Our Residential Letting Business Focused quality portfolio in dynamic growth regions in Germany Strategic cluster Residential units % of total measured by fair value In-place rent 1) EUR/sqm/month Fair value EUR/sqm Multiple in-place rent Multiple market rent Rent potential 2) in % Vacancy in % Strategic core and growth regions 159, % , % 2.1% Core + 140, % , % 2.0% Core 18, % , % 2.2% Non-core 1, % % 5.7% Total 160, % , % 2.1% Thereof Greater Berlin 114, % , % 2.0% Total portfolio valued at market rent multiple of 17.5x (5.7% gross yield) Rent potential stable at 27% for the total portfolio and 30% for Core + / Berlin 1) Contractually owed rent from rented apartments divided by rented area; 2) Unrestricted residential units (letting portfolio); rent potential = new-letting rent compared to in-place rent (letting portfolio) 7
8 » 3 Our Residential Letting Business Re-letting rents have outpaced in-place rents EUR / sqm DW rent development in Berlin 17% rent potential M 2017 New-letting rent (EUR/sqm) 30% rent potential In-place rent (EUR/sqm) 30.0x 25.0x 20.0x 15.0x 10.0x DW development of multiples in Berlin 23.7x 24.7x 18.7x 6.3x spread 16.1x 14.4x 18.9x 18.4x 1.3x 15.7x 13.1x 13.5x M 2017 In-place rent multiple Market rent multiple Reversionary potential remains high at 30%, in-place multiple slightly decreased in Q3 as rent increases through Mietspiegel became effective Total rent potential for entire portfolio (incl. effects of capex program) increased to c. EUR 230m; unlocking that rent potential will require c. EUR 1.5bn investments over next 5 years (capex program plus re-letting investments) Spread between in-place and market multiples significantly widened over the last 4.5 years, implying significant further value upside over the coming years 8
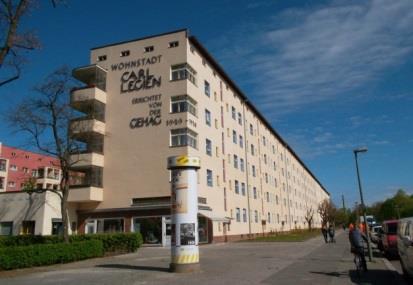
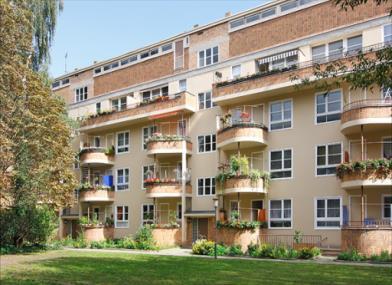
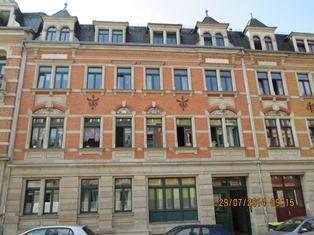
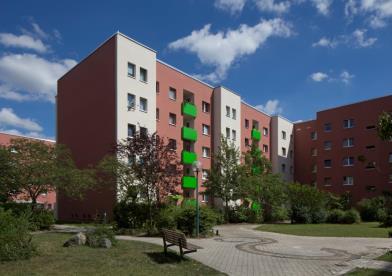
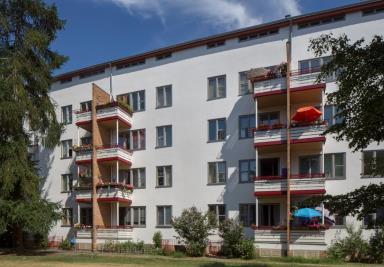
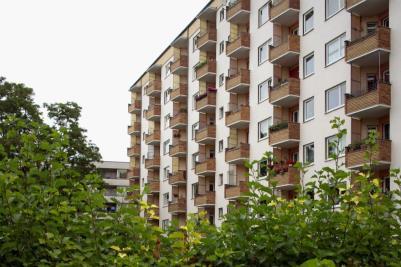
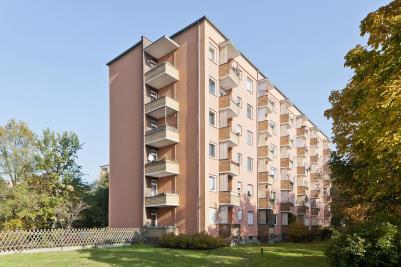
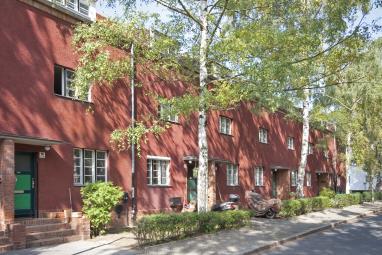
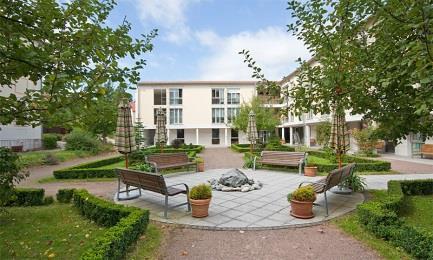
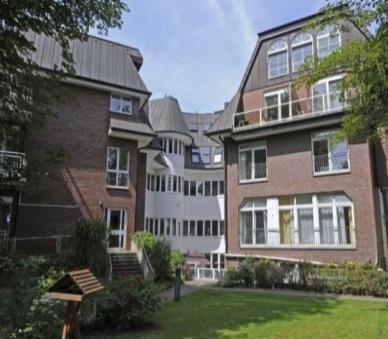
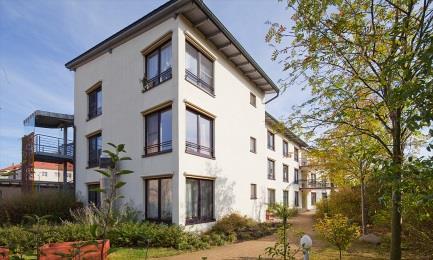
9 3» Our Residential Letting Business Deutsche Wohnen's portfolio is best-in-class Südwestkorso, Berlin Siemensstadt, Berlin Otto-Suhr-Siedlung, Berlin Oranienkiez, Berlin Hellersdorf, Berlin Carl-Legien-Siedlung, Berlin Hufeisensiedlung, Berlin Dresden 9
10 » 3 Our Disposal segment Disposals business remains opportunistic xxx Development of privatization business Development of institutional sales business 2,400 2,100 1,800 1,500 1, % 41% 39% 29% 2,047 1,564 1,394 1,181 FY 2014 FY 2015 FY M 2017 % gross margin price in EUR/ sqm 20,000 95% 20% 8% 13% 16% 92% 15,000 91% 91% 90% 14,272 10,000 12,669 90% 9,596 5,000 2, % FY 2014 FY 2015 FY M 2017 % gross margin Cumulative block sales % Core+ (by FV) Continuation of selective privatizations to validate price points in micro locations Continue to achieve attractive gross margins despite > EUR 6bn portfolio revaluations since 2014 Since 2014 realized prices increased by 73% No reliance on free cash flow generation to finance investment program Successful streamlining of portfolio in recent years >14,000 units disposed at attractive margins since 2014 Non-Core disposals almost completed at prices significantly above book value Share of Core + increased to 92% Too early in cycle to accelerate privatization pace to turn book gains into cash returns for shareholders Opportunistic disposals at attractive prices possible to improve overall quality and further de-risk portfolio 10
11 Other operators Managed by owner 3» Nursing & Assisted Living segment Nursing identified as attractive driver for further external growth Assets including operations Region Facilities # Beds # Occupancy rate Greater Berlin 12 1, % Hamburg % Saxony % Lower Saxony % In-house operations 23 2, % Assets excluding operations Region Facilities # Beds # WALT Bavaria North-Rhine Westphalia Lower Saxony Rhineland-Palatinate Baden-Württemberg Other Total other operators 28 4, Total nursing 51 6,668 n/a Fragmented market with promising fundamental outlook offers room for consolidation Significant investments needed to absorb required capacity built-up in industry with inefficient access to capital Attractive risk adjusted yield spread compared to other real estate asset classes Proven operational know-how through Katharinenhof brand High occupancy rates of c. 98% Strong EBITDAR margins of c. 25%, putting DW in top decimal in terms of profitability Proven integration track record for acquired businesses Deutsche Wohnen business model superior to most peers As owner with operational know-how exposed to lower risk and low cost of funding Expansion of day care and outpatient care with synergies to residential sector Focus on acquisition of real estate properties Preferably in combination with operational management to further enhance yields Adherence to strict acquisition criteria focussing on quality, market positioning and expected value upside Doubling of capacity mid-term envisaged FV of nursing assets amounts to EUR ~690m, translating into attractive RoCE of ~7% for low risk DW business model 11


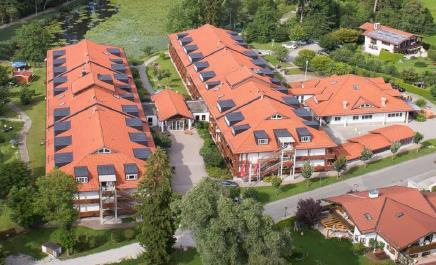


12 3» Nursing & Assisted Living segment Uferpalais, Berlin Im Schlossgarten, Brandenburg Wolkenstein, Saxony Wilsdruff, Saxony Quellenhof, Saxony Am Schwarzen Berg, Lower Saxony Garpsen, Lower Saxony Am Auensee, Saxony Oberau, Bavaria Blankenese, Hamburg Zum Husaren, Hamburg Am Lunapark, Saxony 12
13 4» Operational and financial improvements drive margins Adj. EBITDA margin (w/o disposals) FFO I margin 78.7% Avg. cost of debt 71.8% 74.9% 3.2% 2.5% 1.8% 1.6% 1.4% 59.6% 54.5% 47.9% 66.3% 67.5% 30.7% 34.7% FY 2013 FY 2014 FY 2015 FY M 2017 FY 2013 FY 2014 FY 2015 FY M 2017 Concentrated portfolio and successful integration of acquired businesses as well as further efficiency improvement of operational business let to best in class EBITDA margin Early and proactive management of liabilities to take advantage of attractive financing environment average cost of debt reduced by more than 50% since
14 4» Strong generation of total shareholder return Development of dividend in EUR per share Development of EPRA NAV (undiluted) in EUR per share Yoy growth Dividend per share +29% +23% +37% +6% CAGR e: +23% thereof 0.94 per 9M CAGR M 2017: +21% +29% +23% % % e Dividend per share FFO I per share M 2017 Yoy growth EPRA NAV (undiluted) in EUR per share Deutsche Wohnen consistently generated high shareholder return with an EPRA NAV CAGR of >21% and a dividend CAGR of 23% for e while reducing its risk profile Considering a dividend of EUR 0.74 per share, Deutsche Wohnen delivered a shareholder return for 2016 of EUR 7.40 or 32% of 2015 EPRA NAV (undiluted) 14
15 4» Conservative long term capital structure Rating Ø maturity 1) A- / A3; stable outlook ~ 8.2 years Low leverage, long maturities and strong rating Flexible financing approach to optimize financing costs unencumbered assets increased to > EUR 4bn % secured bank debt 1) 66% % unsecured debt 1) 34% No significant maturities until and including 2019 LTV at 37.0% as of 9M 2017 (-0.7pp vs year end) Ø interest cost 1) 1.4% (~87% hedged) ICR (adjusted EBITDA excl. disposals / net cash interest) 5.9x (+0.5x yoy) LTV target range 35-40% Short term access to c. EUR 1bn liquidity through Commercial Paper programme and RCFs Maturity profile in EUR m based on notional amounts 2) pro forma refinancing October 2017 Bank Debt Convertible Bonds Bonds ) pro forma convertible refinancing October ) Excluding commercial papers 15
16 4» Full year guidance remains unchanged Guidance update Main drivers FFO I (EUR m) 384 ~425 Operational performance and recent acquisitions Dividend per share (EUR) 0.74 ~0.78 Based on 65% pay-out ratio from FFO I and current shares outstanding LTV 37.7% 35-40% (target range) Aim to keep current rating Like-for-like rental growth 2.9% >4% In Berlin we expect up to 5% lfl rental growth 16
17 » Key strategic priorities to accelerate rental and value growth 5 To unlock reversionary potential, reletting investments of EUR 7,800 on average per unit invested, at a return of 12% (yield on cost) Investments existing stock Complex Capex programme for 30,000 units by 2021, thereof almost 50% are in assignment or execution phase Almost doubling of reversionary potential post capex to 50% - total EUR 230m Significant fair value uplift margin post capitalized investments expected Investments new construction Mid-term pipeline of ~3,700 units, thereof almost 50% in planning phase with construction work starting in 2018 Monetization of existing land bank through redensification / addition of floors on top of existing buildings ROI of ~60% for redensification measures expected Opportunistic acquisitions in residential in metropolitan areas Bolt-on acquisitions Challenging market with low supply and demanding prices Opportunistic acquisitions in Nursing & Assisted Living or development of new facilities Target to double EBITDA contribution from Nursing & Assisted Living from 7% to 15% in the mid-term 17
18 6» Highlights of business model 1 Resilient and growing residential real estate market in Germany 2 Focused quality portfolio in dynamic growth regions in Germany 3 High quality asset base with high rent and value upside potential 4 Low risk and efficient financing structure 5 Strong and predictable cash flow generation Yield and value upside at low risk profile 18
19 » Appendix (9M 2017) 19
20 » Highlights 9M 2017 Strong operating business L-f-l rental growth of 4.2% for letting portfolio for Berlin even at 5.0% as Mietspiegel effects start to come through Adjusted EBITDA (excl. disposals) up 7.5% yoy to EUR 435.3m Attractive NOI margin of 77.4% despite increased maintenance costs Capex programme to accelerate rental and value growth fully on track Modernization expenses increased by 70% to EUR 142.1m yoy or EUR per sqm (annualized) Successful refinancing of EUR 400m convertible bond due 2021 Attractive terms for new EUR 800m convertible bond (0.6% coupon, 61% premium to EPRA NAV) Diluted FFO I up 15% yoy at EUR 0.94 per share (pro-forma for convertible refinancing) Convertible bond due 2021 successfully refinanced Market dynamics continue to be strong Despite realised l-f-l rental growth reversionary potential continues to be high at 30% in Core+ Attractive spread between in-place and market rent multiples offer further potential for NAV growth 20
21 » Strong like-for-like development in particular in Berlin Like-for-like 30/09/2017 Residential units number In-place rent 2) 30/09/2017 EUR/sqm In-place rent 2) 30/09/2016 EUR/sqm Change y-o-y Vacancy 30/09/2017 in % Vacancy 30/09/2016 in % Change y-o-y Strategic core and growth regions Core + 131, % 1.6% 1.5% 0.1 pp Core 18, % 2.2% 1.8% 0.3 pp Letting portfolio 1) 150, % 1.7% 1.5% 0.2 pp Total 155, % 1.9% 1.6% 0.2 pp Thereof Greater Berlin 108, % 1.7% 1.5% 0.2 pp Strong like for like rental growth of 4.2% in letting portfolio, in Berlin even 5.0% as Mietspiegel adjustments start to kick-in Tenant turnover stable at 8% for total portfolio, Berlin at 7% Vacancy slightly increased, due to Capex measures (~45bps capex driven vacancy) 1) Excluding disposal portfolio and non-core portfolio; 2) Contractually owed rent from rented apartments divided by rented area 21
22 » Strong like-for-like development in particular in Berlin (2) Like-for-like 30/09/2017 Residential units Number Letting portfolio 1) 150,302 In-place rent 2) 30/09/2017 EUR/sqm In-place rent 2) 30/09/2016 EUR/sqm Change y-o-y Vacancy 30/09/2017 in % Vacancy 30/09/2016 in % Change y-o-y % 1.7% 1.5% 0.2 pp Core + 131, % 1.6% 1.5% 0.1 pp Greater Berlin 108, % 1.7% 1.5% 0.2 pp Rhine-Main 8, % 1.8% 1.4% 0.4 pp Rhineland 4, % 0.6% 1.2% pp Mannheim/Ludwigshafen 4, % 0.7% 0.6% 0.1 pp Dresden / Leipzig 3, % 2.2% 2.4% -0.2 pp Sonstige Core + 1, % 0.5% 1.3% -0.8 pp Core 18, % 2.2% 1.8% 0.3 pp Hanover / Brunswick 9, % 1.9% 1.9% 0.0 pp Kiel / Lübeck 4, % 2.3% 1.6% 0.7 pp Core Cities Eastern Germany 4, % 2.7% 2.0% 0.7 pp Total 155,238 3) % 1.9% 1.6% 0.2 pp 1) Excluding disposal portfolio and non-core portfolio; 2) Contractually owed rent from rented apartments divided by rented area; 3) Total L-f-l stock incl. Non-Core 22
23 » Focused and increasing investments into the portfolio 9M M 2016 Modernization & Maintenance per sqm EUR m EUR / sqm 1) EUR m EUR / sqm 1) ~30 Maintenance (expensed through p&l) Modernization (capitalized on balance sheet) ~ 20 Total ~ 10 Capitalization rate 65.7% 56.5% FY 2014 FY 2015 FY 2016 FY 2017e Value enhancing Capex programme is fully on track Re-letting investment of EUR 100m p.a. to realize 30% reversionary potential at an unlevered yield on cost of 12% Significant increase in modernization expenses to EUR per sqm (+68% yoy), maintenance and modernization per sqm almost reached guided level of EUR ~30 per sqm for 2017, thereof EUR ~10 per sqm expensed through p&l (maintenance) 1) Annualized figure, based on the quarterly average area 23
24 » NOI margin at 77.4% in EUR m 9M M 2016 Rental income Non-recoverable expenses (8.0) (6.2) Rental loss (4.3) (4.8) Maintenance (74.1) (64.4) Others (5.4) (6.0) Earnings from Residential Property Management Maintenance expenses as a percentage of rental income increased from 12.2% to 13.4% Personnel, general and administrative expenses (33.0) (30.1) Net Operating Income (NOI) NOI margin 77.4% 78.8% NOI in EUR / sqm / month in EUR m 9M M 2016 Development of NOI margin 88.6% 91.0% 90.8% 76.2% 78.8% 77.4% Net operating income (NOI) Cash interest expenses (71.7) (76.0) Cash flow from portfolio after cash interest expenses M M M 2017 NOI margin NOI margin (adj. for maintenance) Adjusted for higher maintenance in 9M 2017 NOI margin remained stable 24
25 » Attractive margins of disposal business despite significant revaluations Disposals Privatization Institutional sales Total with closing in 9M M M M M M 2016 No. of units 571 1,061 1,603 2,544 2,174 3,605 Proceeds (EUR m) Book value Price in EUR per sqm 2,047 1, n.m. n.m. Earnings (EUR m) Gross margin 29% 40% 16% 12% 21% 22% Cash flow impact (EUR m) Demand for property continues to be high; a total of 3,072 units were sold, of which 2,174 units had transfer of ownership in the first nine months of 2017 Too early in cycle to accelerate privatization pace to turn book gains into cash returns for shareholders Continued strong demand for residential properties used for portfolio clean-up in non-core regions 25
26 » Increasing FFO contribution from Nursing and Assisted Living Operations (in EUR m) 9M M 2016 Total income Total expenses (63.1) (47.1) EBITDA operations EBITDA margin 9.1% 10.1% Lease expenses 11.2 (2) 9.7 (1) EBITDAR EBITDAR margin 25.2% 28.6% Assets (in EUR m) 9M M 2016 Lease income 31.4 (2) 8.9 (1) Total expenses (0.8) (0.5) EBITDA assets in EUR m 9M M 2016 Nursing Living Other in EUR m 9M M 2016 Staff (36.9) (26.7) Rent / lease (11.2) (9.7) Other (15.0) (10.7) Slight margin decline in operational business from the integration of 3 facilities in Hamburg acquired in Q Ramp-up of one fully refurbished facility currently running at improved occupancy level of ~90% Operations & Assets (in EUR m) 9M M 2016 Total EBITDA Interest expenses (3.1) (3.3) FFO I contribution Set out in the consolidated group financial statements as Earnings from nursing and assisted living Includes payments to operational partner Continued high occupancy rate of c. 98% through Katharinenhof participation is a testimonial of good operational performance 1) The delta between lease expenses (operations) and lease income assets derives from one nursing facility wich is only operated but not owned by Deutsche Wohnen group 2) Since January 1, 2017, 28 nursing facilities rented to third parties are included in lease income 26
27 » EBITDA margin continues to be strong in EUR m 9M M 2016 Earnings from Residential Property Management Earnings from Disposals Earnings from Nursing and Assisted Living % Development of cost ratio 10.0% 10.5% Segment contribution margin Corporate expenses (58.1) (52.4) Other operating expenses/income (5.3) (1.0) EBITDA One-offs Adj. EBITDA (incl. disposals) Earnings from Disposals (28.5) (46.4) Adj. EBITDA (excl. disposals) Q Q Q Cost ratio (corporate expenses / gross rental income) Development of adj. EBITDA margin 78.7% 77.0% 72.2% Q Q Q Adj. EBITDA margin (excl. disposals) Slightly higher cost ratio due to increased personnel expenses, primarily driven by new hiring to execute capex programme as well as increases of compensation for existing staff Increased earnings from residential property management and acquisitions in nursing and assisted living led to further increase of adj. EBITDA margin by 1.7pp (excl. disposals) 27
28 » FFO growth of 9% mainly driven by operations and acquisitions in EUR m 9M M 2016 FFO I margin development EBITDA (adjusted) Earnings from Disposals (28.5) (46.4) 61.6% 57.6% 59.6% 64.8% Long-term remuneration component (share based) % 48.4% At equity valuation Interest expense/ income (recurring) (74.2) (78.6) Income taxes (28.8) (21.3) 9M M M 2017 FFO I margin FFO I margin pre taxes Minorities (4.8) (5.2) FFO I FFO per share development in EUR Earnings from Disposals FFO II % change +4% % +15% 0.94 FFO I per share in EUR 1) Diluted number of shares 2) Diluted FFO I per share 2) in EUR Pro-forma diluted number of shares 3) Pro-forma diluted FFO I per share 3) in EUR FFO II per share in EUR 1) Undiluted Diluted Pro-forma diluted Q Q (3) FFO I margin improved by 2pp, mainly through operating performance and further lowering of financing costs 1) Based on weighted average shares outstanding (9M 2017: 351.3m; 9M 2016: 337.4m) 2) Based on weighted average shares assuming full conversion of in the money convertible bonds 3) Based on weighted average shares assuming convertible bond 2021 is fully taken out 28
29 » EPRA NAV per share stable in 9M 2017 in EUR m 30/09/ /12/2016 EPRA NAV (1) per share (undiluted) in EUR Equity (before non-controlling interests) 8, ,965.6 Fair values of derivative financial instruments % % Deferred taxes (net) 2, ,004.4 EPRA NAV (undiluted) 11, ,017.0 Shares outstanding in m EPRA NAV per share in EUR (undiluted) /12/ /12/ /09/2017 EPRA NAV per share (undiluted) Effects of exercise of convertibles EPRA NAV (diluted) 11, ,009.3 Shares diluted in m EPRA NAV per share in EUR (diluted) Next revaluation with FY 2017 financials envisaged 1) EPRA NAVs as reported 29
30 » Bridge from adjusted EBITDA to profit in EUR m 9M M 2016 EBITDA (adjusted) Depreciation (5.2) (4.6) At equity valuation Financial result (net) (91.4) (88.5) EBT (adjusted) Valuation properties One-offs (32.3) (6.4) Valuation SWAP and convertible bonds (178.3) (155.2) EBT 1, Current taxes (30.2) (21.3) Deferred taxes (307.6) (245.6) in EUR m 9M M 2016 Interest expenses (74.8) (79.3) In % of rental income ~14% ~15% Non-cash interest expenses (17.2) (9.9) (92.0) (89.2) Interest income Financial result (net) (91.4) (88.5) Non-cash interest expense increased mainly due to redemption of subsidized loans (accounted below its nominal value) Thereof EUR (181.5 m) from convertible bonds (increase in market value because of positive share price performance) and EUR 3.2m from valuation of derivatives Profit Profit attributable to the shareholders of the parent company Earnings per share 1) ) Based on weighted average shares outstanding (9M 2017: 351.3m; 9M 2016: 337.4m); 30
31 » Summary balance sheet Assets in EUR m 30/09/ /12/2016 Investment properties 17, ,005.1 Other non-current assets Deferred tax assets Non current assets 18, ,114.4 Land and buildings held for sale Trade receivables Other current assets Cash and cash equivalents Current assets Total assets 18, ,783.6 Equity and Liabilities in EUR m 30/09/ /12/2016 Total equity 9, ,234.0 Financial liabilities 4, ,600.0 Convertibles 1, ,045.1 Bonds Tax liabilities Deferred tax liabilities 1, ,687.1 Derivatives Other liabilities Total liabilities 9, ,549.6 Total equity and liabilities 18, ,783.6 Investment properties represent ~95% of total assets Strong balance sheet structure offering comfort throughout market cycles 31
32 » Early refinancing of the convertible bonds due 2020 and 2021 Refinancing CB 2020 in Feb 2017 Refinancing CB 2021 in Sep 2017 Notional amount 250m 800m 400m 800m Issue date Nov 2013 Feb 2017 Aug 2014 Oct 2017 Maturity Nov 2020 Jul 2024 Sep 2021 Jan 2026 Coupon p.a % 0.325% 0.875% 0.600% Initial conversion premium 30.0% 53.0% 27.5% 40.0% Conversion price (current) Premium to EPRA NAV per share* -44.7% 53.1% -34.8% 61.2% Tendered notes ~100% n/a ~100% n/a Purchase price (approx.) 472m n/a 730m n/a Underlying shares 14.3m 16.6m 19.4m 15.7m *as of 30/09/2017 Deeply in the money convertibles refinanced with out of the money convertibles, thereby reducing dilution risk for shareholders Mitigation of the refinancing risk and utilisation of the attractive financing environment Full flexibility to redeem convertible bonds in cash and/or shares, thereby effective tool to manage capital structure Prolongation of the overall maturity profile to ~8.2 years 32
33 » THE BERLIN-PORTFOLIO AT A GLANCE Reinickendorf # 9, % Mitte # 4, % Spandau # 13, % Pankow # 9, % Friedrichshain-Kreuzberg # 8, % Lichtenberg # 8, % Marzahn-Hellersdorf # 14, % Charlottenburg-Wilmersdorf # 7, % Treptow-Köpenick # 4, % Steglitz-Zehlendorf # 10, % > 3,000 > 5,000 >8,000 >10,000 Tempelhof-Schöneberg # 5, % Neukölln # 12, % # units in-place rent (EUR/m²) vacancy City of Berlin # 110, % Greater Berlin # 114, % 33
34 » Appendix (Miscellaneous) 34
 ~4.")
35 » Berlin's key facts Population Residential units Population Berlin ~3.5m Number of residential units 1,916,517 Number of households ~2m Home ownership ratio ~15% Population forecast (2035) ~4.0m Completed new construction ~11,000 Vacancy and rents Economic data Average vacancy rate 1.2% Average unemployment rate 9.8% Average in-place rent (Mietspiegel 2017) 6.39/sqm/month Net household income per month ~ 2,900 Average asking rent (CBRE 9M 2017) 9.79/sqm/month Biggest employers: Deutsche Bahn, Charité, Vivantes, BVG, Siemens, Deutsche Post Source: Statistical Office Berlin-Brandenburg; Federal Employment Agency; CBRE; Senatsverwaltung für Stadtentwicklung 35
36 » Unique market characteristics in German Housing Market Germany - Home ownership ratio Berlin Home ownership ratio < 20% 48% 52% > 80% Homeowner Non-Homeowner Homeowner Non-Homeowner Source: Eurostat Source: CBRE, UBS Homeownership Germany vs Europe Germany UK France Netherlands EU Average Italy Spain 51.9% 63.5% 64.1% 69.0% 69.4% 72.9% 77.8% 36
37 » Mechanisms of rent development in dynamic markets like Berlin Current regulations Unrestricted units New letting Existing contracts Indefinite rental contracts Freedom of contract at market rent level BUT rental cap at customary rent +10% (so called Mietpreisbremse) Exceptions from rental cap: new construction and extensively refurbished units Maximum increase of 15% in 3 years Not higher than the so called local costumary rent" proven by: Official rent table (Mietspiegel) or 3 comparable apartments or A report of an official surveyer OR Lease contracts with: indexation bound to CPI; graduated rents In case of modernisation works: 11% of modernisation cost can be charged to the tenant (per sqm/ per month) BUT hardship clause (monthly rent not allowed to exceed 30% of available net household income) effectively leads to lower apportionment Restricted units Cost rent principle only changes of the cost rent allow rent increases Cost rent calculation strictly regulated by law Many different social housing programs with special calculation rules Effects of the regulations: - slower rental growth (it takes longer to reach market rent level) - new residential construction becomes economically difficult 37
38 London Milan Stockholm Amsterdam Madrid Paris Zurich Brussels Berlin Vienna» Valuation in perspective of rent potential and affordability Affordability of average Deutsche Wohnen flat in Berlin Housing cost ratios across major European cities 4) DW in-place Market rent Rent (EUR/sqm) ) Average ancillary cost (EUR/sqm) % 33% 32% 30% 29% 27% 25% DW 22% 18-25% 19% Average DW apartment size 60 sqm Average rent per month 2) EUR 532 EUR 750 Average net household income 1) EUR 2,990 Housing cost ratio 3) 18% 25% Gross initial yield (%) DW in-place valuation (EUR 1,884 / sqm) 4.1% 6.4% Source: CBRE EMEA Residential Market Report 2016 More than 80% of DW portfolio consists of apartment sizes of less than 75 sqm, average apartment size of only 60 sqm leads to advantage in terms of affordability Based on DW in-place rent, 18% of household income is spent for housing Assuming CBRE market rents, the housing cost ratio amounts to 25%, which is still far below the usually applied 30% affordability hurdle Huge gap between in-place rent and market rent multiples offers further upside 1) CBRE Berlin housing market report ) Including ancillary costs 3) (Average size x gross rent (net rent + ancillary cost)) / average household income 4) Average asking rent for a 70 sqm apartment / average purchasing power per household 38
39 Share price ( ) Share price (, indexed to DWNI)» Deutsche Wohnen well positioned in capital markets Share Price Development LTM LTM +23.5% L30D +2.7% Okt 16 Nov 16 Dez 16 Jan 17 Feb 17 Mrz 17 Apr 17 Mai 17 Jun 17 Jul 17 Aug 17 Sep 17 Deutsche Wohnen EPRA Europe MDAX 7% 93% Share Free Float and Top Shareholders Segmentation of 93% Free Float 70% 10% 1) Factset, Voting Rights Announcements 2) Market Data as of September % 7% 5% Massachusetts Financial Services Company BlackRock Norges Bank Vonovia SE Other Shareholder L3Y EPRA NAV vs Share Premium to EPRA NAV = 14.3% 0 Okt 14 Mai 15 Dez 15 Jul 16 Feb 17 Sep 17 Share price EPRA NAVps Share price (29 Sept-17) EPRA NAV (H1 2017) 39

 1924: Foundation 1961 79: Constructon of largescale housing developments 2004: Privatisation")
40 » History of Deutsche Wohnen GEHAG (Berlin) 1924: Foundation 1925: Beginning of modern housing development Deutsche Wohnen (Frankfurt) 2006: Acquisition of Eisenbahn-Siedlungs- Gesellschaft and Fortimo GmbH 1998: Privatisation 1998: Deutsche Wohnen AG started its operational activities 1999: IPO 2007: Merger 2010: Moving up to MDAX 2012: Acquisition of the BauBeCon Group with around 23,400 residential units 2013: Takeover of GSW Immobilien AG 2017: Increased focus on internal growth GSW (Berlin) 1924: Foundation : Constructon of largescale housing developments 2004: Privatisation 2011: IPO 40


41 » Management board and areas of responsibilities Michael Zahn Chief Executive Officer (CEO) More than 20 years in the firm Areas of responsibility: Strategy Rent development & investments Strategic participations HR PR & Marketing Lars Wittan Chief Investment Officer (CIO) Since 2007 at Deutsche Wohnen, since 2011 member of the management board Areas of responsibility: Asset Management Accounting/Tax Controlling Risk Management IT/Organisation Philip Grosse Chief Financial Officer (CFO) Since 2013 at Deutsche Wohnen, since 2016 CFO Areas of responsibility: Equity Financing Debt Financing Treasury Investor Relations Legal/Compliance 41
42 » Disclaimer This presentation contains forward-looking statements including assumptions, opinions and views of Deutsche Wohnen or quoted from third party sources. Various known and unknown risks, uncertainties and other factors could cause actual results, financial positions, the development or the performance of Deutsche Wohnen to differ materially from the estimations expressed or implied herein. Deutsche Wohnen does not guarantee that the assumptions underlying such forward-looking statements are free from errors nor do they accept any responsibility for the future accuracy of the opinions expressed in this presentation or the actual occurrence of the forecasted developments. No representation or warranty (expressed or implied) is made as to, and no reliance should be placed on, any information, including projections, estimates, targets and opinions, contained herein, and no liability whatsoever is accepted as to any errors, omissions or misstatements contained herein, and accordingly, none of Deutsche Wohnen SE or any of its affiliates (including subsidiary undertakings) or any of such person s officers, directors or employees accepts any liability whatsoever arising directly or indirectly from the use of this document. Deutsche Wohnen does not undertake any obligation to publicly release any revisions to these forward-looking statements to reflect events or circumstances after the date of this presentation. 42
43 Deutsche Wohnen SE Mecklenburgische Straße Berlin Phone: Fax: Deutsche Wohnen SE
Deutsche Wohnen SE.» 9M 2017 results. Conference Call, 14 November 2017
 Deutsche Wohnen SE» 9M 2017 results Conference Call, 14 November 2017 1 » Agenda 1 Highlights 9M 2017 2 Portfolio 3 Financials 4 Appendix 2 » Highlights 9M 2017 Strong operating business L-f-l rental growth
Deutsche Wohnen SE.» Q results. Conference Call, 15 May 2018
 Deutsche Wohnen SE» Q1 2018 results Conference Call, 15 May 2018 1 » Agenda 1 Highlights Q1 2018 2 Portfolio 3 Financials 4 Appendix 2 » Highlights Q1 2018 Operating business remains strong L-f-l rental
Deutsche Wohnen SE.» Full year results Conference Call, 23 March 2018
 Deutsche Wohnen SE» Full year results 2017 Conference Call, 23 March 2018 1 » Table of content 1 Highlights 2017 2 Portfolio & valuation update 3 Financials 4 Guidance 5 Appendix 2 » Highlights FY 2017
Deutsche Wohnen SE. Full Year Results 2018 Conference Call 26 March 2019
 Deutsche Wohnen SE Full Year Results 2018 Conference Call 26 March 2019 Agenda 01 02 03 04 Highlights Market and Portfolio Financials and Outlook Appendix deutsche-wohnen.com 2 Highlights FY 2018 Operating
Deutsche Wohnen SE.» H results. Conference Call, 14 August 2018
 Deutsche Wohnen SE» H1 2018 results Conference Call, 14 August 2018 1 » Agenda 1 Highlights 2 3 4 2 » Highlights H1 2018 Strong operational business L-f-l growth strong at 4.5% for the total portfolio,
Deutsche Wohnen AG.» Company presentation. September 2012
 Deutsche Wohnen AG» Company presentation September 2012 1 » Agenda 1 Major highlights in H1/2012 2 BauBeCon acquisition 3 Proven asset and portfolio management track record in connection with the right
UBS Global Real Estate CEO/CFO Conference. December 1/2, 2015
 UBS Global Real Estate CEO/CFO Conference December 1/2, 2015 01 ADO OVERVIEW AND INVESTMENT HIGHLIGHTS Overview ADO the pure play Berlin residential specialist Investment highlights 1 2 3 Berlin residential
NINE MONTHS FINANCIAL RESULTS NOVEMBER 19, 2015
 NINE MONTHS FINANCIAL RESULTS NOVEMBER 19, 2015 01 ADO OVERVIEW AND INVESTMENT HIGHLIGHTS Overview ADO the pure play Berlin residential specialist Investment highlights 1 2 3 Berlin residential pure play
ANNUAL RESULTS 2015 MARCH 22, 2016
 ANNUAL RESULTS 2015 MARCH 22, 2016 01 OVERVIEW & INVESTMENT HIGHLIGHTS Overview ADO the pure-play Berlin residential specialist Investment highlights 1 2 3 4 Berlin residential pure play with a 1.5bn quality
THREE MONTH FINANCIAL RESULTS 2016 MAY 19, 2016
 THREE MONTH FINANCIAL RESULTS 20 MAY 19, 20 01 OVERVIEW & INVESTMENT HIGHLIGHTS Overview ADO the pure-play Berlin residential specialist Investment highlights Key portfolio metrics (end of Q1 20) 1 2 3
Group interim report as of 30 June Creating today the city of tomorrow
 Creating today the city of tomorrow Contents 2 Group key figures 3 Group interim management report 18 Group interim financial statements 35 Further information 2 Deutsche Wohnen SE Group key figures Group
12 th Annual General Meeting. + Vienna, 8 May 2013
 12 th Annual General Meeting + Vienna, 8 May 2013 conwert is a fully integrated real estate company focusing on residential properties and apartment buildings in Germany and Austria. This focus is complemented
Q1 Results Conference Call May 29, 2008
 Q1 Results 2008 Conference Call May 29, 2008 Agenda Operational Update Financial Highlights Outlook 2 Agenda Operational Update Financial Highlights Outlook 3 Portfolio Overview Deutsche Wohnen Group Residential
9M 2018 RESULTS 09 NOVEMBER 2018 TLG IMMOBILIEN AG 9M 2018 RESULTS
 TLG IMMOBILIEN AG 9M 208 RESULTS DISCLAIMER This presentation includes statements, estimates, opinions and projections with respect to anticipated future performance of TLG IMMOBILIEN ("Forward-Looking
0/0/0 255, 255, /60/ /221/221 30/60/ /153/ /177/ /217/47 116/222/ /204/ /62/152 0/159/147 M AY 17,
 M AY 17, 2017 1 2 ADO THE PURE PLAY BERLIN RESIDENTIAL SPECIALIST Investment highlights 1 2 3 4 Berlin residential pure play with a 2.3bn quality portfolio Efficient, fully integrated and scalable platform
FIRST QUARTER 2017 INTERIM STATEMENT
 DEMIRE Deutsche Mittelstand Real Estate AG FIRST QUARTER 2017 INTERIM STATEMENT Fiscal Year January 1 Dezember 31 2017 Foreword of the Executive Board Dear Shareholders, With the quarterly statement for
PRELIMINARY INDICATION FOR FULL YEAR 2012 RESULT
 PRELIMINARY INDICATION FOR FULL YEAR 2012 RESULT JANUARY 2013 AGENDA OVERVIEW OF EXTRAORDINARY EFFECTS AND IMPACT ON 2012 RESULT 1 2 EBT TARGET OF 50 MIO IN 2012 WRITE DOWN OF GOODWILL AND INTANGIBLE ASSETS
Strategic Financing of a Listed Company
 Strategic Financing of a Listed Company Christian Hillermann ADLER Real Estate AG Dr. Sven Janssen Oddo Seydler Bank AG Contents ADLER Real Estate AG company presentation 1. Company highlights 2. Event
13 th Kepler Cheuvreux German Corporate Conference Frankfurt, 22 January 2014 Rolf Buch, CEO
 1 Syndicate Analyst Presentation May 2013 13 th Kepler Cheuvreux German Corporate Conference Frankfurt, 22 January 2014 Rolf Buch, CEO Deutsche Annington: Innovation leader based on a long-term vision,
VALUE. QUALITY. RESPONSIBILITY.
 VALUE. QUALITY. RESPONSIBILITY. SUSTAINABLE PORT- FOLIO MANAGEMENT WITH A COMMITMENT TO QUALITY Deutsche Wohnen, with its focus on Berlin, is one of the leading publicly listed property companies in Europe.
Conference call presentation Q
 Conference call presentation Q1 2018 2018 Content 2 I. TAG highlights Q1 2018 II. TAG financials Q1 2018 III. TAG portfolio Q1 2018 IV. TAG outlook FY 2018 V. Appendix 3 5 12 16 19 Portfolio details, vacancy
Company Presentation. January 2018
 Company Presentation January 2018 Disclaimer This document is for informational purposes only. This document is not intended to form the basis of any investment decision and should not be considered as
TAG Immobilien AG Q1-Q TAG I 1
 TAG Immobilien AG Q1-Q3 2011 Q1-Q3 2011 TAG I 1 Content I. Group overview page 3-5 TAG investment case, highlights Q3, Q4 Combined entity TAG Colonia II. Portfolio page 6-21 Overview Residential Salzgitter
FINANCIAL RESULTS Q2 2018
 FINANCIAL RESULTS Q2 2018 August 15, 2018 OVERVIEW & INVESTMENT HIGHLIGHTS Chapter 01 Kapitel Titel ADO THE PURE PLAY BERLIN RESIDENTIAL SPECIALIST Investment highlights A focused residential portfolio(,4)
ACCENTRO Real Estate AG
 ACCENTRO Real Estate AG Germany s Market Leader in Residential Property Privatisation Company Presentation, 6th November 2018 Interim Financial Report for the 3rd quarter 2018, 30th September 2018 ACCENTRO
Company presentation November 2017
 Company presentation November 2017 1 CONTENT Content I. TAG overview and strategy 3 2 II. III. IV. TAG portfolio TAG services business TAG return on capex 7 12 16 V. TAG acquisitions and disposals 21 VI.
ANNUAL REPORT2016 THINKING AHEAD FOR THE CITY OF TOMORROW
 ANNUAL REPORT2016 THINKING AHEAD FOR THE CITY OF TOMORROW GROUP KEY FIGURES OF THE DEUTSCHE WOHNEN AG Profit and loss statement 2016 2015 Change Rental income EUR m 704.5 634.0 11.1 % Earnings from Residential
DEMIRE Deutsche Mittelstand Real Estate AG. Fiscal Year 1 January 31 December 2017
 DEMIRE Deutsche Mittelstand Real Estate AG Third Quarter 2017 Interim Statement Fiscal Year 1 January 31 December 2017 Foreword of the Executive Board Dear Shareholders, It is with great satisfaction that
Growing Assets 9M 2013 Q1-Q3 2011
 2013 Growing Assets 9M 2013 Q1-Q3 2011 CONTENT Content 22 I. TAG Highlights 3 II. TAG FFO 2013 / Guidance 2014 5 III. TAG Strategy: Growth and Margins 7 IV. TAG Portfolio: Regions / Achievements / Capex
BUWOG GROUP COMPANY PRESENTATION DEUTSCHE BANK GERMAN, SWISS & AUSTRIAN CONFERENCE BERLIN 8 JUNE 2016
 BUWOG GROUP COMPANY PRESENTATION DEUTSCHE BANK GERMAN, SWISS & AUSTRIAN CONFERENCE BERLIN 8 JUNE 2016 HIGHLIGHTS 9M 2015/16 Highlights BUSINESS MODEL AUSTRIA & GERMANY ASSET MANAGEMENT RESIDENTIAL ONLY
FINANCIAL RESULTS Q3 2018
 FINANCIAL RESULTS Q3 2018 November 14, 2018 OVERVIEW & INVESTMENT HIGHLIGHTS Chapter 01 Kapitel Titel ADO THE PURE PLAY BERLIN RESIDENTIAL SPECIALIST Investment highlights 1 Berlin residential pure play
Creating today the city of tomorrow
 To our shareholders 1 Management report of the company and the group and annual financial statements for the financial year 2017 Creating today the city of tomorrow Combined management report 1 Foundations
9M 2013 Results. November 6, 2013
 Deutsche Annington Immobilien SE 9M 2013 Results November 6, 2013 Deutsche Annington Immobilien SE 06.11.2013 Disclaimer Confidentiality Declaration This presentation has been specifically prepared by
Quarterly Statement A S O F
 Quarterly Statement AS OF KEY FACTS Q3 / 2017 T 1 Key facts RESULTS OF OPERATIONS Q3 2017 Q3 2016 + / % / bp 01.01. 01.01. 30.09.2016 Rental income million 134.7 131.9 2.1 398.4 381.3 4.5 Net rental and
Growing Assets Q Figures
 2014 Growing Assets Q1 2014 Figures CONTENT Content 22 I. TAG Highlights FY 2013 / Q1 2014 3 II. TAG Strategy/ Efficiency: Growth and Margins 5 III. TAG Achievements: Vacancy reduction / rent increases
Next Generation Real Estate. HY 2008 Figures. Colonia Real Estate AG HY 2008 Figures 15 th of August 2008 Cologne
 Next Generation Real Estate HY 2008 Figures Colonia Real Estate AG HY 2008 Figures 15 th of August 2008 Cologne Focused and Integrated Business Model Colonia Real Estate AG Investments Management Principal
Westgrund AG Overview
 February 2015 Westgrund AG Overview Geographical focus on Northern and Eastern Germany Köln 6 3 Bremen 31 Frankfurt Hamburg Hannover 24 München WESTGRUND Real estate portfolio based on sqm 6 30 Leipzig
Company Presentation. Dr. Rüdiger Mrotzek Hans Richard Schmitz. April 2016
 Company Presentation Dr. Rüdiger Mrotzek Hans Richard Schmitz April 2016 Agenda 1 History / Capital markets track record 2 Portfolio-Management 3 Asset-Management 4 Financial Figures / Financial Position
Company presentation April 2017
 Company presentation April 2017 CONTENT Content I. TAG overview and strategy 3 2 II. III. IV. TAG portfolio TAG return on capex TAG acquisitions and disposals 7 13 18 V. TAG financing structure 22 VI.
Company Presentation. Dr. Rüdiger Mrotzek Hans Richard Schmitz. May 2016
 Company Presentation Dr. Rüdiger Mrotzek Hans Richard Schmitz May 2016 Agenda 1 History / Capital markets track record 2 Portfolio-Management 3 Asset-Management 4 Financial Figures / Financial Position
interim report Q To our shareholders interim report GSW IMMOBILIEN AG Q MY BERLIN. MY HOME.
 GsW interim report Q1-2013 To our shareholders interim report GSW IMMOBILIEN AG Q1-2013 MY BERLIN. MY HOME. Highlights Operational Highlights 31.03.2013 31.03.2012 Vacancy rate (residential) 2.7 % 3.3
Roadshow Presentation. Dr. Rüdiger Mrotzek Hans Richard Schmitz January 2016
 Roadshow Presentation Dr. Rüdiger Mrotzek Hans Richard Schmitz January 2016 Creating sustainable shareholder value Key investment highlights Increasing portfolio quality Enhancing efficiency, increasing
DEMIRE Deutsche Mittelstand Real Estate AG Conference Call Full Year Results 2017
 DEMIRE Deutsche Mittelstand Real Estate AG Conference Call Full Year Results 2017 26 Disclaimer This document is for informational purposes only. This document is not intended to form the basis of any
First Quarter 2017 Interim Statement
 DEMIRE Deutsche Mittelstand Real Estate AG First Quarter 2017 Interim Statement Fiscal Year January 1 Dezember 31 2017 Foreword of the Executive Board Dear Shareholders, With the quarterly statement for
DEUTSCHE WOHNEN. leading performance leading company
 magazine of the annual report 2013 DEUTSCHE WOHNEN is one of Europe s listed real estate companies in terms of market capitalisation. Our operational focus is on the management and development of our residential
interim report h To our shareholders interim report GSW IMMOBILIEN AG H MY BERLIN. MY HOME.
 GsW interim report h1-2013 To our shareholders interim report GSW IMMOBILIEN AG H1-2013 MY BERLIN. MY HOME. Highlights Operational highlights 30.06.2013 30.06.2012 Vacancy rate (residential) 2.7 % 3.2
Company Presentation HAMBORNER REIT AG. Preliminary figures fiscal year 2013 February 2014
 Company Presentation HAMBORNER REIT AG Preliminary figures fiscal year 2013 February 2014 Agenda 1 2 3 4 History / Capital markets track record Organisation / Portfolio / Investments 2013 Asset Management
ADO Properties (ADJ.DE)
") Europe/Germany Equity Research Real Estate Management & Development Rating OUTPERFORM Price (02 Nov 16, ) 32.93 Target price ( ) 38.50 Market Cap ( m) 1,452.0 Enterprise value ( m) 2,360.7 *Stock ratings
Europe/Germany Equity Research Real Estate Management & Development Rating OUTPERFORM Price (02 Nov 16, ) 32.93 Target price ( ) 38.50 Market Cap ( m) 1,452.0 Enterprise value ( m) 2,360.7 *Stock ratings
FY2016 Earnings Call March 7, 2017 Rolf Buch, CEO Dr. A. Stefan Kirsten, CFO
 March 7, 2017 Rolf Buch, CEO Dr. A. Stefan Kirsten, CFO Highlights FFO Growth 2016 FFO1 per share * up 25.1%, driven by internal growth. 10% organic FFO1 growth guided for 2017 (i.e. excluding conwert).
Credit Linked Notes STABILITY CMBS GmbH
 Communications Issuer Administrator STABILITY CMBS 2007 GmbH Wilmington Trust SP Services (Frankfurt) GmbH Steinweg 3 5 6033 Frankfurt am Main, Germany Tel: +49 (69) 2992 5385 Fax: +49 (69) 2992 5387 Wilmington
Q Results. Conference Call Dusseldorf, 30 April Rolf Buch, CEO Dr. A. Stefan Kirsten, CFO
 Deutsche Annington Immobilien SE Q1 2014 Results Conference Call Dusseldorf, 30 April 2014 Rolf Buch, CEO Dr. A. Stefan Kirsten, CFO Deutsche Annington Immobilien SE 30.04.2014 Presenting today Rolf Buch
Condensed Interim Consolidated Financial Statements
 Condensed Interim Consolidated Financial Statements FOR THE NINE MONTH PERIOD ENDED SEPTEMBER 30, 2018 Berlin Munich Condensed Interim Consolidated Financial Statements FOR THE NINE MONTH PERIOD ENDED
INTERIM REPORT ON THE 3RD QUARTER GROWING CASHFLOWS
 INTERIM REPORT 2017 ON THE 3RD QUARTER GROWING CASHFLOWS 2 Group financials Group financials 3 GROUP FINANCIALS in EUR m 01 / 01 09 / 30 / 2017 01 / 01 09 / 30 / 2016 Income statement key figures Rental
Investment Market Germany. PROVADA 5 th June 2013
 Investment Market Germany PROVADA 5 th June 2013 In Europe, which country/region do you believe to be the most attractive for making investment purchases in 2013? 40 35 2012 2013 2012 (n=341) 2013 (n=361)
10th Annual General Meeting. Vienna, 20 May 2011
 10th Annual General Meeting Vienna, 20 May 2011 Market overview and company development 2010 Earnings performance and balance sheet indicators 2010 Implementation of strategy Overview 1 st Quarter 2011
CONDENSED INTERIM CONSOLIDATED FINANCIAL STATEMENTS
 CONDENSED INTERIM CONSOLIDATED FINANCIAL STATEMENTS H1JUNE 30, 2015 BOARD OF DIRECTORS REPORT CONDENSED INTERIM CONSOLIDATED FINANCIAL STATEMENTS JUNE 30, 2015 1 CONTENT Board of Directors Report 2-31
Company presentation June 2017
 Company presentation June 2017 1 CONTENT Content I. TAG overview and strategy 3 2 II. III. IV. TAG portfolio TAG return on capex TAG acquisitions and disposals 7 13 18 V. TAG financing structure VI. TAG
Facts and Figures Investment Market for Residential Portfolios Germany 2017
 Facts and Figures Investment Market for Residential Portfolios Germany 2017 Much as I know, I wish I knew more. Quote from Wolfgang von Goethe If you require any further information, please do not hesitate
Interim Financial Report Vonovia SE
 Interim Financial Report Vonovia SE for the first quarter of 2016 Key Figures in million Key Financial Figures 3M 2016 3M 2015 Change in % Rental income 392.0 263.6 48.7 Adjusted EBITDA Rental 269.0 177.1
Credit Linked Notes STABILITY CMBS GmbH
 Credit Linked Notes STABILITY CMBS 2007 GmbH Communications Issuer Administrator STABILITY CMBS 2007 GmbH Wilmington Trust SP Services (Frankfurt) GmbH Steinweg 3 5 6033 Frankfurt am Main, Germany Tel:
P R E S E N T A T I O N H1/ A U G U S T
 P R E S E N T A T I O N H1/2014 0 5 A U G U S T 2 0 1 4 D I S CLAIMER The statements contained herein may include statements of future expectations and other forward-looking statements that are based on
Memorandum of Understanding Signed with France s Largest Residential Landlord Société Nationale Immobilière (SNI) Assessing the Potential of European
 Assessing the Potential of European") Memorandum of Understanding Signed with France s Largest Residential Landlord Société Nationale Immobilière (SNI) Executive Summary Vonovia has signed a Memorandum of Understanding (MoU) with SNI, the
Memorandum of Understanding Signed with France s Largest Residential Landlord Société Nationale Immobilière (SNI) Executive Summary Vonovia has signed a Memorandum of Understanding (MoU) with SNI, the
Continuing the growth story: Acquisition of Brack Capital Properties. February 2018
 Continuing the growth story: Acquisition of Brack Capital Properties February 2018 Disclaimer This document has been prepared by ADLER Real Estate Aktiengesellschaft (the Company ) and is the responsibility
This document is a non-binding translation only. For the binding document please refer to the German version, published under
 Q1 Interim Report First Quarter 2015 This document is a non-binding translation only. For the binding document please refer to the German version, published under www.adler-ag.com 2 Interim report for
Germany Property Refocus on Fundamentals; Initiating on German Residential Property
 INDUSTRY NOTE Germany Property & Real Estate Germany Property Germany Property Refocus on Fundamentals; Initiating on German Residential Property Key Takeaway With the sector down by 2 from peak valuations
CORESTATE Capital Group
 CORESTATE Capital Group Q3 2017 Earnings Presentation November 2017 Disclaimer This presentation contains forward-looking statements that involve a number of risks and uncertainties. Such statements are
Company Presentation. Dr. Rüdiger Mrotzek Hans Richard Schmitz. February Preliminary Figures 2014
 Company Presentation Dr. Rüdiger Mrotzek Hans Richard Schmitz February 2015 Preliminary Figures 2014 Agenda 1 History / Capital markets track record 2 Portfolio / Investments 3 Asset Management 4 Financial
AROUNDTOWN S A. Condensed Interim Consolidated Financial Statements. For the three month period ended March 31, Berlin
 AROUNDTOWN S A Condensed Interim Consolidated Financial Statements For the three month period ended March 31, 2018 Berlin Düsseldorf Content Board of Directors Report 2 Interim consolidated statement of
TAG Immobilien AG preliminary figures
 TAG Immobilien AG Q1-Q3 2011 TAG I 1 Content I. Group overview page 3-6 II. Portfolio page 7-15 III. Group financials page 16-17 IV. Financial structure page 18-19 V. Share page 20-21 VI. Acquisitions
Interim Results Half Year July 2018
 Interim Results Half Year 2018 July 2018 NSI will be the leading specialist in the Dutch office market, with a strong and efficient platform that will drive returns through pro-active asset management,
Provide Domicile GmbH - Investor Report
 - Investor Report Determination Date 20.03.2014 Collection Period 01.12.2013 to 28.02.2014 Interest Accrual Period 06.01.2014 to 07.04.2014 Fixed EURIBOR 0,284 % The Bank and Servicer The Servicer The
Facts and Figures Investment Market for Residential Portfolios Germany 2016
 Facts and Figures Investment Market for Residential Portfolios Germany 2016 As a general rule, the most successful man in life is the man who has the best information. Quote from Benjamin Disraeli If you
DUNDEE INTERNATIONAL REIT Annual Report
 DUNDEE INTERNATIONAL REIT 2011 Annual Report Contents 1 Letter to unitholders 3 Management s discussion and analysis 3 SECTION I OVERVIEW AND FINANCIAL HIGHLIGHTS 4 Basis of presentation 5 Background 5
BERLINSIDERS HALF YEAR FINANCIAL REPORT
 2 0 1 7 BERLINSIDERS HALF YEAR FINANCIAL REPORT 2017 KEY FIGURES HALF YEAR FINANCIAL REPORT 2017 KEY FIGURES KEY BALANCE SHEET FIGURES In EUR thousand Jun 30, 2017 Dec 31, 2016 Fair value of properties
TLG S TENDER OFFER FOR WCM: BUILDING THE LEADING GERMAN COMMERCIAL REAL ESTATE PLATFORM
 MAY 207 TLG IMMOBILIEN AG TLG S TENDER OFFER FOR WCM: BUILDING THE LEADING GERMAN COMMERCIAL REAL ESTATE PLATFORM DISCLAIMER This presentation is for information purposes only and neither constitutes an
TAG Immobilien AG. FY 2010 figures. FY 2010 Figures TAG I 1
 TAG Immobilien AG FY 2010 figures FY 2010 Figures TAG I 1 Content I. Group overview Investment case/ Strategy, Structure Highlights Combined Entity TAG CRE page 3-9 II. Portfolio page 10-19 Overview Residential
BRIGHT OUTLOOK TOGETHER WE BUILD THE FUTURE. HERE AND NOW.
 BRIGHT OUTLOOK TOGETHER WE BUILD THE FUTURE. HERE AND NOW. www.berlinovo.de The leading real estate service provider of Berlin The Berlinovo Immobilien Gesellschaft mbh (berlinovo) is a large real estate
Housing as a commodity? Operative behavior of German publicly listed housing organizations Presenter: Prof. Dr. Stefan Kofner, MCIH Tirana, 05.
 Housing as a commodity? Operative behavior of German publicly listed housing organizations Presenter: Prof. Dr. Stefan Kofner, MCIH Tirana, 05. September, 2017 1. Publicly listed housing organizations
INTERIM FINANCIAL REPORT. First Quarter of 2014
 INTERIM FINANCIAL REPORT First Quarter of 2014 million 3M 2014 3M 2013 Change (%) Key Figures Rental income 180.5 182.0 0.8 Adjusted EBITDA Rental 109.5 109.3 0.2 Income from disposal of properties 60.2
S IMMO. Accumulate (old: Buy) Target: Euro (old: Euro 16.00)
 Target: Euro (old: Euro 16.00)") S IMMO Accumulate (old: Buy) Target: Euro 17.50 (old: Euro 16.00) 06 April 2018 Price (Euro) 16.50 52 weeks range 16.50 / 11.50 Key Data Country Austria Industry Real Estate Market Segment Prime Market
S IMMO Accumulate (old: Buy) Target: Euro 17.50 (old: Euro 16.00) 06 April 2018 Price (Euro) 16.50 52 weeks range 16.50 / 11.50 Key Data Country Austria Industry Real Estate Market Segment Prime Market
LEG Immobilien AG Q1 Results 2014
 LEG Immobilien AG Q1 Results 2014 15 th May 2014 Disclaimer While the company has taken all reasonable care to ensure that the facts stated in this presentation are accurate and that the opinions contained
Results Q IMPORTANT NOTE: The Results Q do not yet include the asset transfer to FMS-WM as of Oct 1, 2010
 Results Q3 21 IMPORTANT NOTE: The Results Q3 21 do not yet include the asset transfer to FMS-WM as of Oct 1, 21 Investor Relations Presentation November 16, 21 HRE Group Overview Q3 21 pre-tax loss reduced
FY2017 Annual General Meeting 19 April 2018
 FY2017 Annual General Meeting 19 April 2018 Agenda Key Highlights About Tikehau Capital European Market Review Portfolio Overview Financial Highlights Conclusion 2 Key Highlights FY2017 Key Highlights
PB Consumer PB Consumer GmbH Steinweg Frankfurt am Main Germany fax: +49 (0) Deutsche Postbank AG
 Deutsche Postbank AG") Deal Name: Issuer: GmbH Steinweg 3-5 60313 Frankfurt am Main Germany fax: +49 (0)69 2992-5387 Seller of the Receivables: Servicer Name: Reporting Entity: Germany Contact Persons: Mr. Sven Thomas Mr. Thomas
Deal Name: Issuer: GmbH Steinweg 3-5 60313 Frankfurt am Main Germany fax: +49 (0)69 2992-5387 Seller of the Receivables: Servicer Name: Reporting Entity: Germany Contact Persons: Mr. Sven Thomas Mr. Thomas
MARKET REPORT 2017/2018. Accelerating success. Office and Investment Market Berlin
 MARKET REPORT /2018 Accelerating success. Office and Investment Market Berlin Market Overview Office Leasing TOP 7 BERLIN DÜSSELDORF FRANKFURT HAMBURG COLOGNE MUNICH STUTTGART STOCK OF OFFICE SPACE 90.52
Debt barometer 1st quarter 2016: Continued decline in private insolvencies - the numbers are rising in five German states
 Debt barometer 1st quarter 2016: Continued decline in private insolvencies - the numbers are rising in five German states 1. Overview: Low unemployment and rising real incomes provide less private insolvencies
S IMMO Q3 results November 2018
 S IMMO Q3 results 2018 27 November 2018 We develop value Highlights Q3 2018 Gross profit exceeds previous year s level Earnings per share increased to EUR 1.20 Record FFO I (almost +30% compared to previous
Provide Domicile GmbH - Investor Report
 - Investor Report Determination Date 29.12.2009 Collection Period 01.09.2009 to 30.11.2009 Interest Accrual Period 05.10.2009 to 05.01.2010 Fixed EURIBOR 0,754 % The Bank and Servicer The Servicer The
Acquisition of Casa Reha
 Major step in Korian s expansion in Germany PARIS 10 NOVEMBER 2015 1 Disclaimer 2 Casa Reha: A strategic acquisition Major achievement in Germany Reinforced leadership in the most dynamic European market
Q HIGHLIGHTS MEUR MEUR % MEUR MEUR 48.4 MEUR 94.8 MEUR % 1.87% +2.2% +1.9 PP +3.5% +73.8% + >100% +19.9% +81.
 Q1-2 2018 HIGHLIGHTS STRENGTHENED OPERATING PERFORMANCE Occupancy rate 94.7% Rental income MEUR 119.0 Rental income lfl MEUR 98.2 +1.9 PP +3.5% +2.2% KPIs SIGNIFICANTLY IMPROVED Results of AM MEUR 94.8
On track! Results for Q1 Q3 2017
 On track! Results for Q1 Q3 2017 Technology-based financial services Investment highlights in Q1 Q3 2017 and forecast for 2017 Key figures for Q1 Q3 2017 (yoy) Revenue: 143.7 million (+27%) EBIT: 18.6
Autumn Presentation. la foncière parisienne
 Autumn 2017 Presentation I. Background II. Portfolio centered on Paris Central Business District III. Key aspects of TERREÏS Model IV. H1 2017 Results 2 TERREÏS at a glance Property investment company
S IMMO HY results August 2017
 S IMMO HY results 2017 29 August 2017 Ongoing success in 2017 Excellent HY results following record year 2016 Net income for the period more than tripled compared to HY 2015 Financing result improved by
LEG Immobilien AG H1 Results 2015
 LEG Immobilien AG H1 Results 2015 14 th August 2015 Disclaimer While the company has taken all reasonable care to ensure that the facts stated in this presentation are accurate and that the opinions contained
CONTENT. 01 Highlights. 02 Portfolio Performance. 03 Optimisation of Financing Structure. 04 FY 2017 Results. 05 Outlook FY
 CONTENT 01 Highlights 02 Portfolio Performance 03 Optimisation of Financing Structure 04 FY 2017 Results 05 Outlook FY 2017 2 IMMOFINANZ RESTRUCTURING 5/2015 12/2017 Sale of logistics asset class - focus
Agenda. About IREIT Global. Key Highlights. Portfolio Summary. Economy & Real Estate Review. Looking Ahead. Appendix : Overview of Tikehau Capital
 4Q 2017 and FY 2017 Results Presentation 14 February 2018 Agenda About IREIT Global Key Highlights Portfolio Summary Economy & Real Estate Review Looking Ahead Appendix : Overview of Tikehau Capital 2
TAG Immobilien AG. Transformation
 TAG Immobilien AG Transformation 2011-2012 Q1-Q3 2011 TAG I 1 Content I. Highlights 2011/ Group overview including DKB page 3-8 II. Portfolio TAG excluding DKB page 9-19 III. TAG Group financials 2011
FINANCIAL STATEMENTS. For the year ended December 31, 2013
 2013CONSOLIDATED FINANCIAL STATEMENTS For the year ended December 31, 2013 BOARD OF DIRECTORS REPORT REPORT OF THE RÉVISEUR D ENTREPRISES AGRÉÉ (INDEPENDENT AUDITOR) OF COMPREHENSIVE INCOME OF FINANCIAL
Company Presentation. Annual report Dr. Rüdiger Mrotzek Hans Richard Schmitz
 Company Presentation Annual report 2016 Dr. Rüdiger Mrotzek Hans Richard Schmitz April 2017 Agenda 1 History / Capital markets track record 2 Portfolio-Management 3 Asset-Management 4 Financial Figures
2015 CONSOLIDATED FINANCIAL STATEMENTS FOR THE YEAR ENDED DECEMBER 31,
 2015 CONSOLIDATED FINANCIAL STATEMENTS FOR THE YEAR ENDED DECEMBER 31, CONTENT Board of Directors Report 02-45 Independent Auditors Report 46-47 Consolidated statement of comprehensive income 48-49 Consolidated