Corporate Presentation Lehman Brothers Leaders in Energy and Commodities 2008 Conference
|
|
|
- Timothy Austin
- 6 years ago
- Views:
Transcription
1 NLMK Novolipetsk Steel Corporate Presentation Lehman Brothers Leaders in Energy and Commodities 2008 Conference London, June 3, 2008
2 Disclaimer This document is confidential and has been prepared by NLMK (the Company ) solely for use at the investor presentation of the Company and may not be reproduced, retransmitted or further distributed to any other person or published, in whole or in part, for any other purpose. This document does not constitute or form part of any advertisement of securities, any offer or invitation to sell or issue or any solicitation of any offer to purchase or subscribe for, any shares in the Company or Global Depositary Shares (GDSs), nor shall it or any part of it nor the fact of its presentation or distribution form the basis of, or be relied on in connection with, any contract or investment decision. No reliance may be placed for any purpose whatsoever on the information contained in this document or on assumptions made as to its completeness. No representation or warranty, express or implied, is given by the Company, its subsidiaries or any of their respective advisers, officers, employees or agents, as to the accuracy of the information or opinions or for any loss howsoever arising, directly or indirectly, from any use of this presentation or its contents. This document is for distribution only in the United Kingdom and the presentation is being made only in the United Kingdom to persons having professional experience in matters relating to investments falling within Article 19(1) of the Financial Services and Markets Act 2000 (Financial Promotion) Order 2005 (the Order ) or high net worth entities, and other persons to whom it may otherwise lawfully be communicated, falling within Article 49(2) of the Order (all such persons together being referred to as relevant persons ). Any person who is not a relevant person should not act or rely on this presentation or any of its contents. The distribution of this document in other jurisdictions may be restricted by law and any person into whose possession this document comes should inform themselves about, and observe, any such restrictions. This document may include forward-looking statements. These forward-looking statements include matters that are not historical facts or statements regarding the Company s intentions, beliefs or current expectations concerning, among other things, the Company s results of operations, financial condition, liquidity, prospects, growth, strategies, and the industry in which the Company operates. By their nature, forwarding-looking statements involve risks and uncertainties because they relate to events and depend on circumstances that may or may not occur in the future. The Company cautions you that forward-looking statements are not guarantees of future performance and that the Company s actual results of operations, financial condition and liquidity and the development of the industry in which the Company operates may differ materially from those made in or suggested by the forward-looking statements contained in this document. In addition, even if the Company s results of operations, financial condition and liquidity and the development of the industry in which the Company operates are consistent with the forward-looking statements contained in this document, those results or developments may not be indicative of results or developments in future periods. The Company does not undertake any obligation to review or confirm analysts expectations or estimates or to update any forward-looking statements to reflect events that occur or circumstances that arise after the date of this presentation. By attending this presentation you agree to be bound by the foregoing terms. 2
3 Table of Contents 1. NLMK Today 4 2. Domestic Growth 8 3. Maxi-Group Global Growth FY2007 Performance Outlook Appendices 31 3
4 NLMK Key Facts Global presence NLMK Group Crude steel Rolled steel 9 2m t 9.2m 5 4m t 5.4m JV with Duferco 2007 production includes Lipetsk production site, DanSteel, VIZ-Stal and Maxi-Group (December 2007 production results) 2007 production volumes 2007 shipments including Sharon Coating Crude steel Rolled steel 2 1m t2 2.1m 4 2m t3 4.2m 4


5 NLMK Key Facts Market leadership in slabs and high value-added added products Sales revenue: by region 1 Global market position World EU Top 5 producers (market share) 75% 80% 75% #1-2 #1-2 #2 by product 1 Domestic market position FY2007 US GAAP financial results 2. including JV with Duferco Group production volumes 3. Metal Expert, company estimates 5
6 2007: Delivering on Strategic Objectives Gaining global leadership Efficiency leader in the World steel industry Superior 2007 financial results: revenues up by 28%, operating income up by 34%, EBITDA growth of 28% 44% EBITDA margin for the second consecutive year Sustainable EBITDA margin over 40% for the last 5 years Securing leadership in the Russian domestic market Acquisition of Maxi-Group 2.4 million tonnes of long products add-on 2 nd Stage of Technical Upgrade: new BF, converter, HDG line projects started, t revamps of BOF and HR shops Strengthening vertical integration Stoilensky GOK continuous low cost supply of iron ore Altai-koks expansion by 0.8 million tonnes provides for 100% self-sufficiency in coke Maxi-Group facilities are second largest scrap collector in Russia Captive logistics company, NTK owns over 2,800 rail cars and provides over 50% of the Group s rail freight On the fast track with product mix improvement Production gains +51% in transformer steel, +11% in galvanized steel 10% decrease in slabs sales 5.2 million tonnes of finished products in overseas operations with growing share of HVA products 6
7 Table of Contents 1. NLMK Today 4 2. Domestic Growth 8 3. Maxi-Group Global Growth FY2007 Performance Outlook Appendices 31 7
8 Enhancement of Production Platform Capex drives improvements in volume and efficiency Main Goals Increase steel production Quality improvements Fast growth of HVA products Efficiency gains Galvanizing line No.4 (300,000 t) 2 Ladle furnaces 2008E 9.4 m t 5.3 m t 3 Pre-painting line No.3 (200,000 t) Cold-rolling mills (110,000 t x 2) Vacuum degasser 2 Ladle furnaces 2009E 9.5 m t 5.3 m t 3 Total Investment Capex USD8.5bn 1 BF No.7 (3.4 m t) Vacuum degasser BOF (300 t) Pulverized coal injection (PCI) Cold-rolling mill (350,000 t) 2010E 11.3 m t 5.4 m t 3 60% energy selfsufficiency Pelletizing plant (3.0 m tpy) BF No.4 revamp BOF steel Pelletizing plant (6 m tpy) Zhernovskoe-1 EAF steel (3 m t of coking coal) (casting & rolling mill 1.5 m tpy) E 2011E 11.7 m t 5.8 m t 3 16 m t m t 2,3 Crude steel production Flat steel production 2 1. Excluding Maxi-Group and raw materials assets capex 2. Numbers for the main production site 3. Projected production capacity by the end of
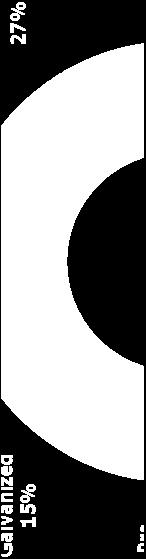
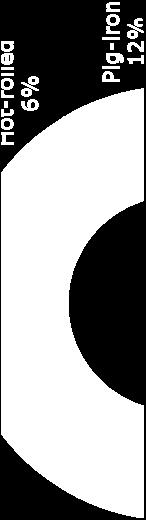
9 Domestic Market Strategy Preferred supplier for growing industries ~23% of sales Hot-rolled steel Cold-rolled steel Galvanized steel Pre-painted steel Electrical steel ~ 64% of sales 880,000 t 763,000 t 426,000 t 340,000 t 202,000 t Total 2,786,000 t ~ 5% of sales Machine-building & automotive industry Cold-rolled & galvanized steel Construction Galvanized, pre-painted painted, hot- rolled steel Power-equipment manufacturing Electrical steel Domestic market share 31% >30% c70% c.70% 9


 increase by 2012 Source:")
10 Domestic Market Strategy - Construction Growing multi-product segment Non-residential construction Roll-formed sections Hot-rolled steel Water pipes Sectioned pipes Angles and shapes Hot dip-galvanized steel Framed sections Internal hardware Vent and ceiling Water-gas pipes systems Sandwich panels Corrugated board Pre-painted steel Residential construction ti Metal tiles Siding Construction growth Over 60% of NLMK s domestic sales go into construction Over 30% share in the Russian construction flat steel segment 32% salable products (HRC, galvanized and prepained steel) increase by 2012 Source: Goskomstat, company estimates 10

")
11 Domestic Market Strategy Machinery Maintain leadership and capture growth Pre-painted steel Galvanized steel Cold-rolled steel Hot-rolled steel Steel service centers Direct supply Press shops Passenger and commercial cars Machinery and equipment Yellow goods White goods Machine building and white goods segments enjoy strong investments inflow and government support Over 2.8 million washing-machines to be produced in Russia by 2010 about 40% growth 29% salable products (HRC, CRC, galvanized and pre-painted painted steel) increase by 2012 Russian industrial sector growth 2007 vs Source: Goskomstat, company estimates 11


12 Domestic Market Strategy - Automotive Bid for higher quality for global customers Russian auto-steel market Auto manufacturing in Russia annual growth of 6% for pcs.,0 Source: company estimates Auto producers Renault Volvo Auto parts producers Magnetto Gonvarri NLMK client base Direct supply contract Certificate Rolled product supply for interior/exterior parts production Customer base includes all major local auto producers Source: Company estimates Duferco JV case NLMK supplies slabs to Duferco JV for auto sheet manufacturing Major global auto producers consume Duferco JV products NLMK gains recognition from leading auto producers launching operations in Russia NLMK transfers auto sheet technology from Duferco JV facilities 12
13 Table of Contents 1. NLMK Today 4 2. Domestic Growth 8 3. Maxi-Group Global Growth FY2007 Performance Outlook Appendices 31 13
14 Maxi-Group Business Model Dynamic regionalized production and distribution model Maxi-Group s targets supply of simple product mix to regional consumers using cost advantages in local scrap sourcing, local mini-mill production and local distribution. Maxi-Group wins customers when proximity to demand and quick turnaround times are important. Maxi-Group targets regions with demand/supply imbalances to develop new production facilities. Well-developed scrap collecting and processing facilities provide efficient raw materials supply. St. Petersburg Central Russia Urals Siberia 40% of rebar consumption Moscow 8-10% annual demand growth for long products W.Siberia is a leading pipe market Far East development plans Scrap collection area Yekaterinburg Novosibirsk Sales area Production facilities Scrap collecting facilities 14
 New facilities 2008-2011 2011 Capex: USD 1.")

 300 scrap yards: 3 m t scrap Central Russia Long products: 0.9 m t Billets: +1.")
 Siberia Siberia Scrap Division* Seamless pipes:1.")

15 Maxi-Group Development Plans Pursuing capacity growth and value enhancing opportunities Existing facilities (capacity as at ) New facilities Capex: USD 1.8 bn¹ New facilities Capex: USD 2.0 bn¹ Billets: 2.4 m t Urals Re-bar: 1.32 m t Metal-ware: 0.55 m t Seamless pipes: 0.45 m t Channels: 0.5 m t Seamless pipes: +0.5 m t (TBC) Urals Scrap Division* Wire rods: 1.0 m t (2008) 300 scrap yards: 3 m t scrap Central Russia Long products: 0.9 m t Billets: +1.5 m t Center Scrap Division* Billets: +2.0 m t Long products: +0.8 m t Flat products: +1.9 m t (TBC) Siberia Siberia Scrap Division* Seamless pipes:1.0 m t (TBC) *By 2015 combined capacity of all scrap yards to reach 7.8 million tonnes million t Maxi-Group investment program is currently under review and may therefore undergo material changes. 2. Volumes does not include to-be-confirmed (TBC) projects. 15


16 Maxi-Group Financial Highlights 2007E highlights 1 Revenue and EBITDA 1 Revenue USD 1150 million EBITDA USD 250 million EBITDA margin 22% External debt USD 1.8 billion as at USD,00 Production costs are 75% scrap 100% of scrap supplied internally New technology and equipment lowers costs Billets cost structure 9M 2007 Low transportationt ti costs due to locall scrap collection and customers Production costs, 9M Billets USD 356 per tonne Rebar USD 406 per tonne Wire rod USD 416 per tonne 1. Management estimate based on Russian Accounting Standards (RAS) 2. Based on non-consolidated Russian Accounting Standards 16
17 Table of Contents 1. NLMK Today 4 2. Domestic Growth 8 3. Maxi-Group Global Growth FY2007 Performance Outlook Appendices 30 17


18 Global Growth Strategy Improving earnings quality by increasing internal slab re-rolling Global slab supply is expected to grow faster Slab supply than supply of finished product E NLMK plans to decrease share of slabs at the DanSteel A/S 0.6 m t 0.6 m t open market Duferco JV 0.3 m t 3.6 m t Earnings per tonne of finished products are Free market m t 2.3 m t greater then those of slabs Share of sales 30% 19% USD Earnings per tonne 3 Slab distribution balance 1. excluding sales to DanSteel and Duferco JV companies 2. supply to DanSteel and Duferco JV companies 3. FY 2007 results for Lipetsk production site based on Russian Accounting Standards (RAS) management accounts 2 18


19 Joint Venture with Duferco Group Pursuing dynamic growth in finished output Production profiles make NLMK and Duferco natural partners. Total synergy effect: USD55 m per annum for Access to distribution and service network Technology transfer and certification of upstream products with EU customers Total investment capex of EUR400 million Duferco JV production by 2012E: Joint Venture slab supply balance E JV internal slabs 1.7 m t 2.8 m t NLMK slabs to JV 0.4 m t 3.6 m t External slabs to JV 2.1 m t 0 Joint Venture salable product mix 2007 vs. 2012E m t m t +39% of finished products +56% of HVA products 19


20 Global High-value-added Market Presence Global niche player high-margin product development Over 20% EBITDA generated from transformer (GO) steel while it represents only 5% of sales by volumes NLMK s transformer steel production NLMK - 20% globally. 4 producers maintain over 60% global transformer steel market share High entry barriers to the segment World electric power generation Transformer steel market Source: Energy Information Administration (EIA); World Markets Research Center, company estimates 20
21 Future M&A approach Pursuing value enhancing opportunities M&A opportunities Downstream vertical integration Gaining niche market share Large scale horizontal acquisitions Key drivers: Securing slab supply Improving earnings quality Technology transfer Key drivers: Commercial synergies due to market share increase Optimization of product mix and logistics Cost savings on R&D Key drivers: Fast growth of earnings Regional and product diversification One-time sizable growth Example: Sharon Coating (former Winner Steel) acquisition Example: VIZ-Stal acquisition Duferco JV and DanSteel thick plate market share Example: Joint venture with Duferco 21
22 Table of Contents 1. NLMK Today 4 2. Domestic Growth 8 3. Maxi-Group Global Growth FY2007 Performance Outlook Appendices 31 22
23 Financial performance Record results sustainable profitability Revenue: USD 7,719 million (+28% y-o-y) Operating profit: USD 2,998 million (+34%) EBITDA 1 : USD 3,366 million (+28%) EBITDA margin: 44% Net profit: USD 2,247 million (+9%) Net profit excluding one-off activities 2 : USD 2,183 million (+37%) Operating cash flow: USD 2,524 million (+59%) Cash and cash equivalents as of : USD 1,155 million EPS USD (+9%) EBIT/tonne of steel in 2007: USD 322 (+ 29%) 1 EBITDA is calculated as the sum total of net profit, net interest expense, income tax, loss on disposal of fixed assets, impairment losses, accretion expense on asset retirement obligation, depreciation and amortization (without gain (loss) on investments, income from discontinued operations, gain from disposal of subsidiaries and gain on loan restructuring). 2 losses / gains on investments, gain from disposal of subsidiaries and gain from operations of discontinued subsidiary 23


24 Sustainable Financial Performance Strong cash generation through the cycle Historical performance EBITDA 1 EBITDA CAGR of 50% Average EBITDA margin above 40% Average ROE of ~35% 2007 financial highlights Sales revenue of USD7,719 m EBITDA of USD3,366 m, margin of 44% Operating cash flow of USD2,524 m Net income of USD2,247 m EBITDA per tonne, 2007 USD
25 Financial Position Strong balance sheet and corporate ratings Leading credit ratings among Russian steelmakers NLMK is comfortable with 30% gearing NLMK is well protected against a possible liquidity idit crisis i Strong financial position and cash flow generation provides flexibility for further growth through global acquisitions NLMK Net Debt, 12M 07 MMK Severstal Capex coverage ratio for 12M is 2.6 Source: Bloomberg LP S&P BB- BB BB+ Evraz MMK NLMK Severstal Moody s Ba3 Ba2 Ba1 MMK NLMK Severstal Evraz Fitch BB- BB BB+ Severstal Evraz MMK 1 Capex coverage ratio = Free cash flow from operations / Capex 2 Free cash-flow = Cash flow from operations total Capex NLMK bln USD Net debt / EBITDA, 12M 07 Source: Bloomberg LP 25


26 Costs Maintained cost leadership НЛМК 2007 slab cash cost on consolidated basis is USD 221 Iron ore accounts for 7.7% of consolidated production cost Major cost items: coal, labour, energy and depreciation Cash cost by product, 2006 vs Consolidated cash cost,
27 Table of Contents 1. NLMK Today 4 2. Domestic Growth 8 3. Maxi-Group Global Growth FY2007 Performance Outlook Appendices 31 27
28 Outlook Revised steel price forecast for 2008 Current forecast Favorable market situation with global steel prices stable or increasing compared to 2007 We expect revenue to grow up to 60% y-o-y y EBITDA is expected to exceed the 2007 level by 35-40% Key market drivers Commodities cycle on the rise with iron ore and coal prices to grow in 2008 Slowdown in the growth rate of Chinese steel industry. Removal of export tax rebates by the Chinese government Growing demand in the Russian market supported by strong economic growth, infrastructure boom. No significant plans announced to introduce new rolling capacity in 2008 Price discipline due to high degree of concentration in core markets (EU, US, Russia, Brazil) and ongoing industry consolidation 28
29 Outlook Long-term sustainable development We are pursuing the following strategic goals: Increase efficient self-sufficiency in basic raw materials Maintain key competitive advantage in low cost production of slabs Fully capture growing demand in the Russian market Strengthen market presence in HVA product niches in core export markets Capex program brings over 45% increase in EBITDA after 2011 Be profitability leader in steel industry Participate in international industry consolidation 29
30 Table of Contents 1. NLMK Today 4 2. Domestic Growth 8 3. Maxi-Group Global Growth FY2007 Performance Outlook Appendices 31 30


31 2007 Sales Domestic vs. export, tonnes Domestic market Export market Transformer steel 2% Transformer steel 5% Total Domestic sales in million tonnes Total Export sales in million tonnes 31
32 Automotive industry Car manufacturers Vsevolozhsk Ford Motor Company European Russia S.Peterburg 1 - Toyota 2 - GM (Chevrolet, Opel) 3 - Nissan 4 Suzuki 5 - Hyundai Kaluga 1 - Volkswagen 2 Mitsubishi 3 PSA Peugeot Citroen Moscow 1 - Avtoframos (Renault) 2 - SeAZ (Oka) Kaluga Vsevolozhsk S. Petersburg MOSCOW Nizhniy Novgorod Izhevsk 1 - Izh-Avto (KIA) 2 - Izh-Avto (Lada) Special economic zone Elabuga 1- Great Wall 2 - Severstal-Avto Nizhniy Novgorod 1 - GAZ (Volga, Siber) 2 - GAZ-GM 3 ZAZ Taganrog Alabuga Ulyanovsk 39 Togliatti Izhevsk Naberezhnye Chelny Naberezhnye Chelny ZMA (Severstal-avto) - Ssang Yong - Fiat Taganrog Tagaz (Hyundai) Ulianovsk UAZ Novouralsk Novouralsk Autos and engines of Urals (AMUR) (Geely, ZX) Togliatti 1 - Avto VAZ 2 - GM-AvtoVAZ 32
33 White goods sector Manufacturers of domestic appliances S.Peterburg 1 BSH 2 Electrolux European Russia Kaliningrad 1 - Snaige Smolensk 1 Smolensk Alexandrov 1 Vestel S. Petersburg Ruza 1 LG Podolsk 1 Exquisit Lipetsk 1 Indesit Kaliningrad Smolensk Ruza Podolsk Alexandrov NLMK Kirzhach Lipetsk Saratov Kirov Zelenodolsk Kirzhach 1- Beko Zelenodolsk 1- Pozis Kirov 1 Vesta Saratov 1 SEPOZES 33
34 Consolidated Statement of Income НЛМК Q4 2007/ /2006 Q Q Q (mln. US D) + / % + / % Sales revenue 7,719 6,046 1, % 2,174 1, % Production o cost (3,569) (2,716) (853) 31.4% (1,044) (862) (182) 21.1% Depreciation and amortization (408) (358) (50) 13.9% (111) (99) (11) 11.2% Gross profit 3,742 2, % 1, % General and administrative expenses (215) (189) (26) 13.9% (56) (52) (4) 8.4% S elling expenses (443) (325) (117) 36.1% (125) (106) (18) 17.4% Taxes other than income tax (80) (57) (23) 39.8% (21) (19) (2) 8.1% Impairment losses (137) 137 (100.0%) Accretion expense on asset retirement obligations (6) (20) 14 (68.7%) (0.1) (0.0) (0.0) 66.7% Operating income 2,998 2, % % Loss on disposals of property, plant and equipment (27) (4) (24) 661.7% (3) (5) 2 (43.4%) Gains / (losses) on investments (24) 401 (424) (105.9%) (20) () (20) Interest income (12) (10.8%) % Interest expense (31) (30) (2) 5.8% (17) (3) (14) 511.0% Foreign currency exchange loss, net 80 (75) 155 (207.4%) (16) (39.3%) Gain from disposal of subsidiaries % Other expense, net (23) (27) 4 (14.5%) (19) (5) (15) 299.5% Income from continuing operations before income tax and minority interest 3,157 2, % (34) (4.0% ) Income tax (837) (707) (130) 18.5% (196) (217) 21 (9.8% ) Income from continuing operations before minority interest 2,320 1, % (13) (2.1% ) Minority interest (23) (26) 2 (8.9%) (5) (6) 1 (20.4%) Equity in net earnings/(losses) of associate (50) 1 (51) (24) (34) 9 (27.0%) Income from continuing operations 2,246 1, % (3) (0.4% ) Income from discontinuing operations (176) (99.3% ) Net income 2,247 2, % (3) (0.4% ) EBITDA 3,366 2, % % 34
35 Consolidated Balance Sheet НЛМК as at as at as at as at as at (mln. US D) ASSETS C urrent assets 4,388 3,904 3,629 3,484 3,050 Cash and cash equivalents 1,155 1,388 1, Short term investments Accounts receivable, net 1,696 1,194 1,110 1,252 1,150 Inventories, net 1,236 1, Other current assets, net Restricted cash 9 8 C urrent assets, held for sale 44 Non current assets 8,688 6,105 5,783 5,821 5,667 Long term investments, net Property, plant and equipment, net 64 6, , , , ,988 Intangible assets G oodwill 1, Other non current assets, net Non current assets, held for sale 114 Total assets 13,076 10,009 9,412 9,305 8,717 L IAB IL ITIE S AND STOCKHOLDERS EQUITY C urrent liabilities 3, Accounts payable and other liabilities 1, Short term borrowings 1, C urrent income tax liability C urrent liabilities, held for sale 41 Non current liabilities Long term borrowings Deferred income tax liability Other long term liabilities Non current liabilities, held for sale 175 Total liabilities i 3,978 1,631 1,576 1,762 1,774 Minority interest Stockholders equity 8,992 8,258 7,726 7,406 6,809 Common stock Statutory reserve Additional paid in capital Other comprehensive income 1,182 1, Retained earnings 7,526 6,936 6,704 6,443 5,986 Total liabilities and stockholders equity 13,076 10,009 9,412 9,305 8,717 35
36 Consolidated Cash Flow Statement НЛМК Q4 2007/ /2006 Q Q Q (mln. US D) + / % + / % Cash flow from operating ac tivities Net income 2,247 2, % (3) (0.4% ) Adjustments to reconcile net income to net cash provided by operating activities Minority interest (1) (4.6%) 5 6 (1) (20.3% ) Depreciation and amortization % % Loss on disposals of property, plant and equipment % 3 5 (2) (43.4% ) (Gain)/loss on inves tments 24 (401) 424 (105.9% ) Gain from disposal of subsidiaries (83) (83) (1) (82) 81 Gain from operations of discontinued subsidiary (1) (228) 226 (99.4%) () 80 (80) (100.0% ) Equity in net earnings of associate 50 (1) 51 ( %) (9) (27.0% ) Defferd income tax (benefit)/expense 38 (39) 77 (197.9% ) (19) 10 (29) (300.8% ) Gain on loan restructuring Impairment losses 137 (137) (100.0% ) Accretion expense on asset retirement obligations 6 20 (14) (68.7%) 66.7% Other movements (5) (23.6%) % Changes in operating assets and liabilities Increase in accounts receivables (92) (141) 49 (34.9% ) (30) (44) 13 (30.7% ) Increase in inventories (200) (160) (40) 25.1% (48) (72) 24 (33.3% ) Decrease/(increase) in other current assets (44) (17) (27) 158.1% (1) (33) 32 (97.6% ) Increase in loans provide by the subsidiary bank (106) (70) (36) 52.3% (1) (1) (1) 66.3% Increase in accounts payable and oher liabilities 243 (23) 266 (1150.1%) (106) 11 (118) Increase/(decrease) in current income tax payable (34) 32 (66) (204.1% ) (13) (0.2) (13) Net cash provided from operating ac tivities 2,524 1, % (67) (11.0% ) Cash flow from investing ac tivities Acquisitions of s ubsidiaries (1,348) 1,348 (100.0% ) Acquisitions of associates 24 (806) 830 (103.0% ) Proceeds from disposal of discontinued operations 303 (303) (100.0% ) Proceeds from adjustment of the original purchase price of s ubsidiaries (1) (1) (327.0% ) Proceeds from sale of property, plant and equipment (3) (21.1%) % Purchases and construction of property, plant and equipment (958) (619) (339) 54.8% (342) (221) (121) 54.9% Proceeds from sale of inves tments (454) (97.5% ) 5 5 Purchase of inves tments (199) (55) (145) 264.3% (154) (9) (145) % Loan is sued (134) (134) 2 (3) 6 (164.8% ) Disposal of s ubsidiaries, net of cash disposed $106,800 (60) (60) (0.2) (0.4) (51.2% ) Movement of restricted cash (1) (1) (400.9% ) Net cash used in inves ting ac tivities (1,268) (2,043) 775 (37.9%) (461) (233) (227) 97.4% Cash flow from financing ac tivities Proceeds from borrowings and notes payable % % Repayments of borrowings and notes payable (452) (183) (268) 146.5% (193) (34) (159) 472.8% Capital lease payments (3) (3) (1) (1) () 87.5% Proceeds from disposal of assets to the company under common control Payments to controlling shareholders for transfer of interests in subsidiary (104) 104 (100.0%) 0% Dividends paid to previous shareholder of acquired company (84) 84 (100.0% ) Dividends paid to minority shareholder of existing subsidiaries (19) (20) 1 (5.3%) 2 (13) 16 (117.9% ) Dividends to shareholders (703) (767) 64 (8.3%) (355) (343) (12) 3.5% Net cash used in financing ac tivities (830) (933) 104 (11.1%) (318) (381) 63 (16.6% ) Net increas e / (decrease) in cash and cash equivalents 427 (1,391) 1,818 (130.7%) (234) (2) (231) % Effect of exchange rate changes on cash and cash equivalents (69) (52.4%) (0.3) 42 (43) (100.7% ) Cash and cash equivalents at the beginning of the period 665 1,924 (1,259) (65.4%) 1,388 1, % Cash and cash equivalents at the end of the period , % , ,388 (234) (16.8% ) 36
37 Novolipetsk Steel Investor Relations 18, bldg 1 Bakhrushina ul , Moscow Russia t f info@nlmk.msk.ru
Novolipetsk Steel. Corporate presentation Global Metals & Mining Conference Bank of America / Merrill Lynch. Barcelona, May 2009
 Novolipetsk Steel Corporate presentation Global Metals & Mining Conference Bank of America / Merrill Lynch Barcelona, 12 14 May 2009 Disclaimer This document is confidential and has been prepared by NLMK
Novolipetsk Steel (NLMK) Duferco Joint Venture
 Duferco Joint Venture") NLMK Novolipetsk Steel (NLMK) Duferco Joint Venture November 2006-1- Disclaimer This document is confidential and has been prepared by NLMK (the Company ) solely for use at the investor presentation of
NLMK Novolipetsk Steel (NLMK) Duferco Joint Venture November 2006-1- Disclaimer This document is confidential and has been prepared by NLMK (the Company ) solely for use at the investor presentation of
HIGH VALUE ADDED PRODUCTS: OPPORTUNITIES AND RISKS Andrey Laptev, Head of Corporate Strategy June 26 th, 2012
 HIGH VALUE ADDED PRODUCTS: OPPORTUNITIES AND RISKS Andrey Laptev, Head of Corporate Strategy June 26 th, 2012 Disclaimer These materials are confidential and have been prepared by OAO Severstal (Severstal)
MAGNITOGORSK IRON & STEEL WORKS. Magnitogorsk Steel (MMK) Q2 and H IFRS Financial Results Presentation
 Q2 and H IFRS Financial Results Presentation") MAGNITOGORSK IRON & STEEL WORKS Magnitogorsk Steel (MMK) and H1 212 IFRS Financial Results Presentation MMK Group Highlights Financials Revenue USD 2,516 mln 4% growth q-o-q Operating profit USD 95 mln
MAGNITOGORSK IRON & STEEL WORKS Magnitogorsk Steel (MMK) and H1 212 IFRS Financial Results Presentation MMK Group Highlights Financials Revenue USD 2,516 mln 4% growth q-o-q Operating profit USD 95 mln
IFRS Financial Statements for Q4 and FY 2014
 214 ACHIEVEMENTS 1 Record > 1.6 bln USD EBITDA MMK MC Dynamics, mln USD 2 577 2 5 2 Net debt down 1 bln USD -2% 2 63 2 3 FCF yield 37% 1 5 4 Lost opportunity of FMG stake sale in early 214 1 5 Social life:
Investor Presentation. Heavy plate rolling mill starts operating in July at the Ouro Branco mill (MG)
") Investor Presentation Heavy plate rolling mill starts operating in July at the Ouro Branco mill (MG) Agenda Outlook Gerdau Highlights 2 Economic outlook GDP Growth 2014 2015f 2016f World 3.4% 3.1% 3.2%
Investor Presentation Heavy plate rolling mill starts operating in July at the Ouro Branco mill (MG) Agenda Outlook Gerdau Highlights 2 Economic outlook GDP Growth 2014 2015f 2016f World 3.4% 3.1% 3.2%
Investor Presentation. Heavy plate rolling mill starts operating in July at the Ouro Branco mill (MG)
") Investor Presentation Heavy plate rolling mill starts operating in July at the Ouro Branco mill (MG) Agenda Outlook Gerdau Highlights 2 Economic Outlook GDP Growth 2014 2015f 2016f World 3.4% 3.1% 3.4%
Investor Presentation Heavy plate rolling mill starts operating in July at the Ouro Branco mill (MG) Agenda Outlook Gerdau Highlights 2 Economic Outlook GDP Growth 2014 2015f 2016f World 3.4% 3.1% 3.4%
November 2017 NLMK. Corporate Presentation
 November 217 NLMK Corporate Presentation DISCLAIMER This document is confidential and has been prepared by NLMK (the Company ) solely for use at the presentation of the Company and may not be reproduced,
January 2018 NLMK. Corporate Presentation
 January 218 NLMK Corporate Presentation DISCLAIMER This document is confidential and has been prepared by NLMK (the Company ) solely for use at the presentation of the Company and may not be reproduced,
efficiency leadership
 ABOUT NLMK Report 2015 efficiency leadership ABOUT US/ REPORT 2015 2015 HIGHLIGHTS Record high sales: 15.9 m t (+5% y-o-y) Largest steel manufacturer in Russia with a share of 22% Revenue: $8 bn (-23%
1Q 2017 RESULTS PRESENTATION
 1Q 2017 RESULTS PRESENTATION May 31, 2017 Disclaimer This presentation does not constitute or form part of and should not be construed as, an offer to sell or issue or the solicitation of an offer to buy
FY 2017 RESULTS PRESENTATION
 FY 2017 RESULTS PRESENTATION April 5, 2018 Disclaimer This presentation does not constitute or form part of and should not be construed as, an offer to sell or issue or the solicitation of an offer to
Investor Presentation January 2016
 Investor Presentation Forward-Looking Statements This presentation contains certain forward-looking statements and information relating to S.A. and its subsidiaries (collectively, ) that are based on the
Hyundai Steel (004020)
") Earnings Review February 1, 213 12M rating BUY (Maintain) 12M TP W111, from W111, Hyundai Steel (42) Astonishing earnings in many aspects Above In line Below Up/downside +34% Stock Data KOSPI (Jan 31,
Earnings Review February 1, 213 12M rating BUY (Maintain) 12M TP W111, from W111, Hyundai Steel (42) Astonishing earnings in many aspects Above In line Below Up/downside +34% Stock Data KOSPI (Jan 31,
MMK Group financial statements
 MMK Group financial statements Key consolidated results for Q4 and FY 2015 (USD mln) Q4 2015 Q3 2015 % FY 2015 FY 2014 % Revenue 1,181 1,502-21.4% 5,839 7,952-26.6% Cost of sales -893-1,036-13.8% -4,054-6,212-34.7%
ThyssenKrupp Steel, London, August ThyssenKrupp Steel
 , London, August 2008 0 , London, August 2008 28 Disclaimer The information set forth and included in this presentation is not provided in connection with an offer or solicitation for the purchase or sale
MMK Group financial statements
 MMK Group financial statements Key consolidated results for Q4 2017 and FY 2017 (USD mln) Q4 2017 Q3 2017 % FY 2017 FY 2016 % Revenue 1,948 2,012-3.2% 7,546 5,630 34.0% Cost of sales -1,298-1,410-7.9%
Investor Presentation
 Investor Presentation 2017 www.gerdau.com 1 Outlook Gerdau Highlights 2 Better outlook for steel consumption Region / Country (in mt and %) 2017f 17/16 World 1,535 1.3% European Union 158 0.5% NAFTA 135
Investor Presentation
 March, 2010 1 Disclaimer This document can contain statements which constitute forward-looking statements. Such forward-looking statements are dependent on estimates, data or methods that may be incorrect
Investor Presentation
 Investor Presentation 2017 www.gerdau.com 1 Outlook Gerdau Highlights 2 Better outlook for steel consumption Region / Country (in mt and %) 2017f 17/16 World 1,535 1.3% European Union 158 0.5% NAFTA 135
Analysts and Investors Briefing September 4, ThyssenKrupp
 Analysts and Investors Briefing September 4, 2009 0 Analysts and Investors Briefing September 4, 2009 1 Summary Update on today s Supervisory Board Meeting on: New Organization Restructuring Concept Capex
BNP PARIBAS FIRST CLASS EXPERTISE IN THE METALS & MINING SECTOR
 BNP PARIBAS FIRST CLASS EXPERTISE IN THE METALS & MINING SECTOR NICOLAS BERTRAND ANTOINE SEVRAY CORPORATE & INSTITUTIONAL BANKING RISK ANTICIPATION INDUSTRY RESEARCH Paris, 30/11/2015 General approach
Annual Financial Results. for the twelve months ended 31 December 2009
 Annual Financial Results for the twelve months ended 31 December 2009 1 Introduction and overview Nonkululeko Nyembezi-Heita, CEO 2 Overview (2009 vs 2008) Headline loss of R440m Headline loss per share
MECHEL REPORTS THE 2016 FINANCIAL RESULTS
 MECHEL REPORTS THE 2016 FINANCIAL RESULTS Consolidated revenue 276.0 bln rubles, EBITDA * - 66.2 bln rubles Net profit, attributable to shareholders of Mechel PAO 7.1 bln rubles Moscow, Russia April 26,
Financial Year 2006/07
 Financial Year Investor Relations June 2007 www.voestalpine.com - Status Quo Revenue EBITDA EBIT FY 7.05 bn 1.37 bn 1.01 bn Divisions Steel Railway Automotive Profilform Systems Revenue/Division 49 % 27
Investor Presentation 2017
 Investor Presentation 2017 Gerdau steel in the world www.gerdau.com 1 Outlook Gerdau Highlights 2 Economic outlook GDP Growth 2016 2017f 2018f World 3.1% 3.5% 3.6% US 1.6% 2.3% 2.5% Brazil -3.6% 0.5% 2.5%
$350m Eurobond Request for covenant reset. February 2013
 $350m Eurobond Request for covenant reset February 2013 Operational Performance Annual production rates 2010 2012 Mln t *Coke 6% moisture including metallurgical coke, foundry coke, coke nut, coke breeze,
3rd Basic Materials Seminar, Exane BNP Paribas, London, March 19, ThyssenKrupp
 3rd Basic Materials Seminar, Exane BNP Paribas, London, March 19, 2008 0 3rd Basic Materials Seminar, Exane BNP Paribas, London, March 19, 2008 1 Agenda Peter Urban Vice Chairman and CFO Steel AG Overview
O.P. Jindal Group and JSW Group Overview
 July 01, 20091 Group Overview 2 O.P. Jindal Group and JSW Group Overview P R Jindal Sajjan Jindal Ratan Jindal Naveen Jindal Jindal Saw Jindal Stainless Jindal Steel & Power Ltd. Power Steel Infrastructure
MECHEL REPORTS THE 2013 FINANCIAL RESULTS
 MECHEL REPORTS THE 2013 FINANCIAL RESULTS Revenue amounted to $8.6 billion Consolidated adjusted EBITDA amounted to $730 million Net loss attributable to shareholders of Mechel OAO amounted to $2.9 billion
METALLOINVEST ANNOUNCES 2017 IFRS FINANCIAL RESULTS
 METALLOINVEST ANNOUNCES 2017 IFRS FINANCIAL RESULTS Moscow, Russia 15 March 2018 Metalloinvest ( the Company ), a leading global iron ore and HBI producer, and one of the regional producers of high-quality
SeverStal. Investor Day. 16 February 2007
 SeverStal Investor Day 16 February 2007 2 Agenda» Business Model and Strategic Priorities» Q&A» Coffee break» Corporate Governance» Q&A» Conclusion 3 Disclaimer These materials may contain projections
Investor Presentation October 2016
 Investor Presentation Forward-Looking Statements This presentation contains certain forward-looking statements and information relating to S.A. and its subsidiaries (collectively, ) that are based on the
EVRAZ GROUP. 1H 2010 Financial and Operating Results. 2 September 2010
 EVRAZ GROUP 1H 21 Financial and Operating Results 2 September 21 Disclaimer 2 This document does not constitute or form part of and should not be construed as, an offer to sell or issue or the solicitation
Highveld Steel and Vanadium. Annual Results 31 December 2009
 Highveld Steel and Vanadium Corporation Limited Annual Results 31 December 2009 Disclaimer 2 Forward looking statements This document may contain forward looking information and statements about Highveld
Erdemir Group 2011 First Quarter Consolidated Financial Results. 06 May 2011
 Erdemir Group 2011 First Quarter Consolidated Financial Results 06 May 2011 2 / 26 DISCLAIMER Ereğli Demir Çelik Fabrikaları T.A.Ş. (Erdemir) may, when necessary, make written or verbal announcements about
Investor Presentation. March 2018
 Investor Presentation As of March 7, 2018 Forward-Looking Statements This presentation contains certain forward-looking statements and information relating to S.A. and its subsidiaries (collectively, )
Russia s market for new light vehicles: Outlook and analysis Stanley Root 19 January 2012
 www.pwc.ru/automotive Russia s market for new light vehicles: Outlook and analysis Stanley Root 19 January 2012 Contents 1. Global car production overview 2. Overview of the new Russian light vehicles
JSW reports flat sales in Q3 FY
 Press Release 28.01.2009 JSW reports flat sales in Q3 FY 2008-09 JSW reported flat sales in the 3rd quarter when the world steel demand and prices fell significantly mainly due to change in the product
: Sumitomo Metal Industries, Ltd. Consolidated Financial Situation and Business Results for the Third Quarter of FY 2009 (ending March 31, 2010)
") Sumitomo Metal Industries, Ltd. Consolidated Financial Situation and Business Results for the Third Quarter of FY 2009 (ending March 31, 2010) The following information was originally prepared and published
Sumitomo Metal Industries, Ltd. Consolidated Financial Situation and Business Results for the Third Quarter of FY 2009 (ending March 31, 2010) The following information was originally prepared and published
Months Consolidated Results. 28 April 2015
 1 28.04.2015 2015 3 Months Consolidated Results 28 April 2015 2 28.04.2015 DISCLAMIER Ereğli Demir Çelik Fabrikaları T.A.Ş. (Erdemir) may, when necessary, make written or verbal announcements about forward-looking
Investor Presentation. June 2018
 Investor Presentation As of June 1, 2018 Forward-Looking Statements This presentation contains certain forward-looking statements and information relating to S.A. and its subsidiaries (collectively, )
Investor Presentation
 Investor Presentation 2017 www.gerdau.com 1 Outlook Gerdau Highlights 2 Region / Country (in Mt and %) 2017f 17/16 World 1,622 7.0% European Union 162 2.5% Better outlook for steel consumption NAFTA 139
Investor Presentation. January 2019
 Investor Presentation January 2019 As Ternium of January I 2019 25, 2019 1 Forward-Looking Statements This presentation contains certain forward-looking statements and information relating to Ternium S.A.
Investor Presentation
 March, 2010 1 Disclaimer This document can contain statements which constitute forward-looking statements. Such forward-looking statements are dependent on estimates, data or methods that may be incorrect
MECHEL REPORTS THE FY2018 FINANCIAL RESULTS
 MECHEL REPORTS THE FY2018 FINANCIAL RESULTS Consolidated revenue 312.6 bln rubles (+5% compared to FY2017) EBITDA * 75.7 bln rubles (-7% compared to FY2017) Profit attributable to equity shareholders of
Investor Presentation August 2018
 Investor Presentation As of August 22, 2018 Forward-Looking Statements This presentation contains certain forward-looking statements and information relating to S.A. and its subsidiaries (collectively,
MECHEL REPORTS THE 9M 2017 FINANCIAL RESULTS
 MECHEL REPORTS THE 9M 2017 FINANCIAL RESULTS Consolidated revenue 222.8 bln rubles (+13% compared to 9M2016) EBITDA * - 59.1 bln rubles (+42% compared to 9M2016) Net profit, attributable to equity shareholders
Marshall Motor Holdings plc 2017 Full year results presentation March 2018
 Marshall Motor Holdings plc 2017 Full year results presentation March 2018 INTRODUCTION 2 AGENDA Full year Highlights Financial Overview Operating and Strategic Review Current Trading and Outlook Summary
Erdemir Group Months Consolidated Financial Results
 1 / 35 Erdemir Group 2014 6 Months Consolidated Financial Results 12 August 2014 2 / 35 DISCLAIMER Ereğli Demir Çelik Fabrikaları T.A.Ş. (Erdemir) may, when necessary, make written or verbal announcements
Investor Presentation
 Investor Presentation 2017 www.gerdau.com 1 Outlook Gerdau Highlights 2 Region / Country (in Mt and %) 2017f 17/16 18/17 World 1,622 7.0% 1.6% European Union 162 2.5% 1.4% Better outlook for steel consumption
Acquisition of Musa Motors, Russia. 24 th April 2008
 Acquisition of Musa Motors, Russia André Lacroix Group Chief Executive Barbara Richmond Group Finance Director 4 th April 008 Important Notice The information in this document does not constitute or form
Second Quarter 2018 Questions and Answers
 Second Quarter 2018 Questions and Answers Page 1 Forward-Looking Statements This document may contain forward-looking information and statements about ArcelorMittal and its subsidiaries. These statements
Erdemir Group 2009 Consolidated Financial Results
 Erdemir Group 2009 Consolidated Financial Results 22 February 2010 1 /28 DISCLAIMER Ereğli Demir Çelik Fabrikaları T.A.Ş. (Erdemir) may, when necessary, make written or verbal announcements about forward-looking
2017 Interim Results Corporate Presentation. 25 August 2017
 2017 Interim Results Corporate Presentation 25 August 2017 0 Disclaimer This document may contain forward-looking statements that reflect risks and uncertainties. These forward-looking statements are generally
Annual Financial Results
 Mittal Steel South Africa Limited Annual Financial Results for the 12 months ended December 2006 market & operations Rick Reato Introduction and Overview Earnings remain strong at R4.6bn - Earnings per
MECHEL REPORTS THE 9M 2018 FINANCIAL RESULTS
 MECHEL REPORTS THE 9M 2018 FINANCIAL RESULTS Consolidated revenue 237.0 bln rubles (+6% compared to 9M 2017) EBITDA * 60.6 bln rubles (+3% compared to 9M 2017) Profit attributable to equity shareholders
2QFY14 Results Presentation
 2QFY14 Results Presentation 1 Key highlights 3QFY14 Standalone performance Consolidated performance Key update Highest ever Crude Steel production: 3.19 million tonnes Gross Turnover: `12,651 crores Net
Erdemir Group Months Consolidated Financial Results
 1 / 35 Erdemir Group 2014 9 Months Consolidated Financial Results 28 October 2014 2 / 35 DISCLAIMER Ereğli Demir Çelik Fabrikaları T.A.Ş. (Erdemir) may, when necessary, make written or verbal announcements
Transforming tomorrow
 Transforming tomorrow Bank of America Merrill Lynch Global Metals and Mining Conference May 2010 Disclaimer Forward-Looking Statements This document may contain forward-looking information and statements
Situation in the Russian automotive market and opportunities for the automotive suppliers
 Boris Firsov Principal Roland Berger Strategy Consultants Russian-Japanese_Investment _Forum-E.ppt 1 Situation in the Russian automotive market and opportunities for the automotive suppliers 1st Russian-Japanese
FISCAL YEAR 2004/05. Investor Relations June
 FISCAL YEAR 2004/05 Investor Relations June 2005 www.voestalpine.com HIGHLIGHTS 2004/05 All-time high sales of 5.8 bn and EBIT of 553 (continued operations) Not included: 50 one-off-costs liquidation Matzner
Comments on the business review and on the consolidated financial statements 3
 2014 Annual results CONTENTS Key figures 1 1 Comments on the business review and on the consolidated financial statements 3 1.1. Business review 4 1.2. Results of operations 9 1.3. Financial structure
2Q2015 IFRS CONSOLIDATED FINANCIAL RESULTS
 Q5 IFRS CONSOLIDATED FINANCIAL RESULTS SEPTEMBER, 5 Alexander Ivannikov Head of the Department Q5 IFRS CONSOLIDATED FINANCIAL RESULTS DISCLAIMERS This presentation has been prepared by PJSC Gazprom (the
Strategic Initiatives and Outlook Update
 Strategic Initiatives and Outlook Update Paul O Malley, Managing Director and Chief Executive Officer Charlie Elias, Chief Financial Officer 26 October 2015 BlueScope Steel Limited. ASX Code: BSL Important
Evraz Group S.A. Unaudited Interim Condensed Consolidated Financial Statements. Six-month period ended 30 June 2016
 Unaudited Interim Condensed Consolidated Financial Statements Six-month period ended 30 June 2016 Unaudited Interim Condensed Consolidated Financial Statements Six-month period ended 30 June 2016 Contents
X 5. Winning Customers With The Power Of 5. FY 2008 Operational & Financial Results Q Operational Performance
 X 5 Winning Customers With The Power Of 5 FY 2008 Operational & Financial Results Q1 2009 Operational Performance Conference Call Presentation to Investors and Analysts Moscow, 14 April 2009 p. 1 Disclaimer
Q Management Discussion and Analysis
 May 15, 2017 Q1 2017 - Management Discussion and Analysis The first quarter of 2017 brought an improvement in demand for steel and resulted in the increase of production in the European Union by 3.8% with
Months Consolidated Results. 25 April 2016
 1 25.04.2016 2016 3 Months Consolidated Results 25 April 2016 2 25.04.2016 DISCLAMIER Ereğli Demir Çelik Fabrikaları T.A.Ş. (Erdemir) may, when necessary, make written or verbal announcements about forward-looking
MMK CORPORATE PRESENTATION
 MMK CORPORATE PRESENTATION APRIL 216 MMK THE VALUE STORY 9 MMK Fully Renewed Story But Still Undervalued Should Change in Future due to Long Term Sustainability One of TOP-3 global steel players High EBITDA
5405:JP. April 27, 2012
 5405:JP SMMLY:US 1 April 27, 2012 Forward-looking Statement This presentation contains certain forward-looking statements. The Company has tried, whenever possible, to identify these forward-looking statements
Conference Call Second Quarter 2008 Earnings
 Conference Call Second Quarter 2008 Earnings Paulo Penido Pinto Marques CFO and Investor Relations Director August 14, 2008 1 Disclaimer Declarations relative to business perspectives of the Company, operating
Martin Lindqvist, President & CEO Marco Wirén, CFO February 11, 2011
 Results for the fourth quarter 2010 Martin Lindqvist, President & CEO Marco Wirén, CFO February 11, 2011 Forward-looking statements The presentation and the materials constituting it contain certain statements
EARNINGS PRESENTATION
 EARNINGS PRESENTATION Fourth Quarter & Full Year 2017 Aleris Corporation March 19, 2018 Forward-Looking and Other Information IMPORTANT INFORMATION This information is current only as of its date and may
CHELYABINSK ZINC PLANT. Credit Suisse 2008 Global Steel and Mining Conference London, UK September 24, 2008
 CHELYABINSK ZINC PLANT Credit Suisse 28 Global Steel and Mining Conference London, UK Disclaimer This Presentation (the Presentation ) of JSC Chelyabinsk Zinc Plant (the Company ) has been prepared solely
Financial results. For the six months ended 30 June 2017
 Financial results For the six months ended 3 June 217 Disclaimer Forward-looking statements This presentation includes forward-looking information and statements about ArcelorMittal South Africa ( AMSA
Steel Focus: Summary ASEAN steel Industry from SEAISI Conference 2010
 Steel Focus: Summary ASEAN steel Industry from SEAISI Conference 2010 Indonesia In 2009, GDP expanded by 4.5%. An economic expansion was due to the stimulus economic structure in the country which depends
Martin Lindqvist, President & CEO Marco Wirén, CFO April 29, 2011
 Results for the first quarter 2011 Martin Lindqvist, President & CEO Marco Wirén, CFO April 29, 2011 Forward-looking statements The presentation and the materials constituting it contain certain statements
India Growth Story. Steel Market Asia Conference Ashok Bhardwaj. 19 th -20 th November Intercontinental Grand Stanford - Hong Kong
 India Growth Story Steel Market Asia Conference 2012 19 th -20 th November - 2012 Intercontinental Grand Stanford - Hong Kong Ashok Bhardwaj (Director - Marketing) JSW Steel Limited India Urbanization
Financial Presentation 4Q / FY 2017 IFRS Results
 Financial Presentation 4Q / FY 217 IFRS Results March 1, 218 Disclaimer No representation or warranty (express or implied) is made as to, and no reliance should be placed on, the fairness, accuracy or
Investor Day Isbergues November 26, Sandeep Jalan Chief Financial Officer. Aperam 0
 Investor Day Isbergues November 26, 2014 Sandeep Jalan Chief Financial Officer Aperam 0 Disclaimer Forward-Looking Statements This document may contain forward-looking information and statements about
Investor presentation. May 2015
 Investor presentation May 2015 Disclaimer Forward-Looking Statements This document may contain forward-looking information and statements about ArcelorMittal and its subsidiaries. These statements include
Domestic progress overwhelmed by global difficulties
 Domestic progress overwhelmed by global difficulties Presentation to The Association of Women in the Metal Industries 2015 Annual Conference Tucson, AZ November 13, 2015 Domestic progress overwhelmed by
FY10/3Q Consolidated Results Highlights
 February 4, 2011 1 Forward-looking Statement This presentation contains certain forward-looking statements. The Company has tried, whenever possible, to identify these forwardlooking statements using words
The LEONI Group. The Quality Connection
 The LEONI Group 2013 The Quality Connection Contents 1. LEONI Group 2. LEONI Divisions 3. Report 1 st 4 th Quarter 2013 4. Outlook 5. Appendix LEONI AG 2 LEONI Group Divisions 2013 Divisions Sales breakdown
ANN JOO RESOURCES BERHAD 22 ND ANNUAL GENERAL MEETING DATO LIM HONG THYE, GROUP MANAGING DIRECTOR 30 MAY 2018
 ANN JOO RESOURCES BERHAD 22 ND ANNUAL GENERAL MEETING DATO LIM HONG THYE, GROUP MANAGING DIRECTOR 30 MAY 2018 INDUSTRY OVERVIEW INDUSTRY PERFORMANCE STEEL BAR PRICES (SOUTHEAST ASIA) 2004-2008 Commodities
JSW Steel post 17% higher EBIDTA at `4,501 crores
 Press Release February 06, 2019 JSW Steel post 17% higher EBIDTA at `4,501 crores Mumbai, India: JSW Steel Limited ( JSW Steel or the Company ) today reported its results for the third quarter and the
Emerging markets and mining growth
 Emerging markets and mining growth Aditya Mittal CFO and member of Group Management Board Plant Tour Brazil - 24-26 March 21 Disclaimer Forward-Looking Statements This document may contain forward-looking
Financial Presentation 4Q/ FY 2018 IFRS Results
 Financial Presentation 4Q/ FY 218 IFRS Results March 1, 219 Disclaimer No representation or warranty (express or implied) is made as to, and no reliance should be placed on, the fairness, accuracy or completeness
Interim report Q1/2013. Sakari Tamminen, President & CEO Rautaruukki Corporation 25 April 2013
 Interim report Q1/2013 Sakari Tamminen, President & CEO Rautaruukki Corporation 25 April 2013 Agenda Q1 in brief, key figures Financial performance Business area performance Business environment Key actions
Presentation of FY 2017 Results. February 26 th, 2018
 Presentation of FY 2017 Results February 26 th, 2018 Gestamp 2018 Disclaimer This presentation has been prepared solely for use at this presentation of our results as of and for the quarter ended December
ArcelorMittal Fact Book
 ArcelorMittal Fact Book 2006 ArcelorMittal Fact Book 2006 01 02 At a glance 04 Company Profile 08 Highlights 10 Market and Industry 12 Key Figures 13 Steel Consumption and Markets 15 Steel Production by
2014 IFRS CONSOLIDATED FINANCIAL RESULTS
 24 IFRS CONSOLIDATED FINANCIAL RESULTS APRIL 29, 25 Alexander Ivannikov First Deputy CFO 24 IFRS CONSOLIDATED FINANCIAL RESULTS 2 DISCLAIMERS This presentation has been prepared by JSC Gazprom (the Company
Third Quarter Earnings November 8, 2018
 Third Quarter Earnings November 8, 2018 Forward Looking Statements & Disclosures Forward Looking Statement: With the exception of the historical information contained in this presentation, the matters
METALLOINVEST ANNOUNCES FINANCIAL RESULTS FOR THE FULL YEAR 2015
 METALLOINVEST ANNOUNCES FINANCIAL RESULTS FOR THE FULL YEAR 2015 Moscow, Russia 16 March 2016 Metalloinvest ( the Company ), a leading global iron ore and HBI producer, and a regional high quality steel
Text. improvement in earnings. Textdemand drove continued
 Good Textdemand drove continued improvement in earnings Text Presentation of the Q2/2018 results Martin Lindqvist, President & CEO Håkan Folin, CFO July 20, 2018 Agenda Market and demand trends Performance
Press Release January 28, 2008
 Press Release January 28, 2008 6714 Pointe Inverness Way, Suite 200 Fort Wayne, IN 46804-7932 260.459.3553 Phone 260.969.3590 Fax www.steeldynamics.com Steel Dynamics Reports Strong 2007 Fourth Quarter
4Q2010 Conference Call Gerdau S.A. Consolidated IFRS
 4Q2010 Conference Call Gerdau S.A. Consolidated IFRS André Gerdau Johannpeter President and CEO Osvaldo B. Schirmer Vice-President and IRO March 3, 2011 1 Global Context 2010 vs. 2009 Growth of 15% in
Tata Steel Ltd. - FPO Note
 Tata Steel Ltd. - FPO Note Issue Details Particulars Issue Date January 19, 2011 January 21, 2011 Issue Size Rs.33.8-34.7bn Price Band Rs. 594-610 FV Fresh Issue Rs.10 57 mn equity shares QIB 49% Non Institutional/HNIs