CIF Stock Recommendation Report (Fall 2012)
|
|
|
- Bennett Bennett
- 6 years ago
- Views:
Transcription
1 Date:_10/26/2012 AnalystName:_KristenHecht_ CIFStockRecommendationReport(Fall2012) CompanyNameandTicker:_CapitalOneFinancialCorporation(COF) Section(A)Summary RecommendationBuy:YesNo TargetPrice:$75 Stop LossPrice:$51 Sector:Financials Industry:CreditServices MarketCap(inBillions): $ CurrentPrice:$60.00 Morningstar(MS)Fair ValueEst.:$ WKHi: $61.33 MSFVUncertainty: High 52WKLow: $39.30 MSConsiderBuying: $42.00 #ofshrs.o/s(inmillions): 581 EBOValuation:$47.13 MSConsiderSelling: $ EPS(TTM):6.11 EPS(FY1):6.36 EPS(FY2):7.05 MSStarRating: 3Stars NextFiscalYr.End Year : Month : 2012Dec LastFiscalQtr.End: LessThan8WK: YN IfLessThan8WK,next EarningsAnn.Date: AnalystConsensus Recommendation: Outperform ForwardP/E:8.51 MeanLTGrowth:9.07% PEG:.88 Beta:1.75 %Inst.Ownership:88.63 Inst.Ownership Net Buy:YN ShortInterestRatio:1.17 RatioAnalysis Company Industry Sector P/E(TTM) P/S(TTM) P/B(MRQ) P/CF(TTM) DividendYield TotalDebt/Equity(MRQ) NetProfitMargin(TTM) ROA(TTM) ROE(TTM) Shortas%ofFloat:2.00% 1
2 2 Summary Providebriefsummaryofyouranalysisineachsection thatfollows CompanyProfile:CapitalOneisafinancialservices companywiththreebranches,creditcardservice, consumerbanking,andcommercialbanking.they operateintheu.s,ukandcanada. FundamentalValuation:Thefundamentalvaluefora 20 yearsupergrowthperiodis$47.13,whichisbelow thecurrentprice.thisisconcerningbutmaybeskewed bythehighbetatypicalofthecreditserviceindustry. RelativeValuation:Usingthevaluemetricsofit s competitors,theimpliedpriceofcapitaloneshows thatitisconsiderablyundervalued. RevenueandEarningsEstimates:Exceptforthe secondquarterof2012,capitalonehascontinuedto beatrevenueandearningsestimates. AnalystRecommendations:Withameanratingof1.89 fromreutersthereisabuyrecommendationfromthe analysts. InstitutionalOwnership:Therehasnotbeena significantamountofchangeininstitutionalownership recently.alargeamountofcapitalone sstocksare heldbyinstitutions. ShortInterest:Shortinteresthasdecreased significantlyoverthelastyear,andcapitalonehas smallshortpercentoffloatandshortinterestratios, whicharebullishsignals. InvestmentThesis CapitalOneFinancialCorporation wouldbeagoodbuyforthecif. Therelativevaluationshowstheyare undervaluedusingallthemetrics. TheyhaverecentlyacquiredING DirectandHSBCdomestic credit portfolio,andthesebothshowedto increaseprofitforcapitaloneinthe thirdquarter Thirdquarterearningswerejust released,andtheybeatanalysts estimatesandincreasednetincome andearningspershare. Theyhavestrategicleadershipunder RichardFairbank,whowasacofounderandisstillpresident,CEOand ChairmanoftheBoard.Heiswilling leadwithanaggressivegrowth strategy. ReutersandMorningstarandother onlinefinancialsitesagreethat CapitalOneisabuy. Theyhavesignificantownershipby institutions,whichtendtoknowmore thanthepublic. Theshortinteresthasdramatically decreasedwithinthelastyear,and theyhaveasmallshort%offloatas wellasshortinterestratio. StockPriceChart:ThestockpricechartsshowCapital OnegenerallyfollowingtheS&P500,outperforming AmericanExpress,andbeingoutperformedbyVisa.
3 Section(B) CompanyProfile(twopagesmaximum) CompanySummary CapitalOneFinancialCompanyisadiversifiedfinancialservicesholdingcompany.Originally foundedin1988byrichardfairbankandnigelmorrisasconsumerlendingcompany,capital OnehassincegrowntobeaFortune500company.Theyareoneofthenationstop tenlargest banksbasedoffofdeposits.it s1,000branchlocationsarelocatedmainlyinnewyork,new Jersey,Texas,Louisiana,Maryland,VirginiaandtheDistrictofColumbia(CapitalOne.com).They offeranarrayoffinancialservicestoconsumers,smallbusinessesandcommercialclients.they operatebothdomesticallyandinternationallyandhavethreemainsegments.thefirstsegment isthecreditcarddivision,whichconsistsofconsumerandsmallbusinesscardlendinginthe UnitedStates,CanadaandtheU.K.Thissegmentgenerated$2.3billionofnetincomein2011 (CapitalOne10KReport2011).Thesecondsegmentisconsumerbanking,whichconsistsof branchbasedlendinganddepositoryservicesforconsumersandsmallbusinessesaswellas autolendingandconsumerhomeloanlending.thissegmentgenerated$890millioninnet incomein2011(capitalone10kreport2011).thefinalsegmentiscommercialbanking,where theyofferlendinganddepositgatheringtomiddlemarketcustomers,aswellastreasury managementservices.thissegmentgenerated$532millioninnetincomein2011(capitalone 10kReport2011). BusinessModel,Competition,EnvironmentandStrategy CapitalOnewasoriginallyamonolinebusinessthatofferedcreditcardstodomestic consumers,buthasgrownandexpandeddrasticallysinceitwasoriginallyfounded.nowthey offeradiverserangeoffinancialservices.theco founderofcapitalone,richardfairbankis currentlystillthechairmanoftheboard,ceo,andpresidentofthecompany.hepursuesan aggressivestrategythatincludesmajoracquisitions.injanuaryof2011capitaloneacquitted thecreditcardloanportfolioofhudsonbaycompany,infebruaryof2012capitalone acquiredingdirectandit ssubsidiaries,andinapril2012capitaloneacquiredhsbc sbillion dollarcreditportfolio(capitalone.com).theseacquisitionshaveprovedtobebeneficialtothe company,providingsolidcontributionstothethirdquarterearnings.richardfairbank commentedthat CapitalOnepostedsolidresultsacrossallofourbusinessesinthethird quarter,includingstrongcontributionsfromingdirectandthehsbcu.s.creditcardbusiness (CapitalOnePressReleaseOctober182012). ItissomewhatdifficulttoplaceCapitalOneFinancialCorporationinaspecificindustry. AlthoughReutersandMorningstarbothclassifyCapitalOneFinancialCorporationasbeingin thecreditservicesindustry,ithasamorediversifiedbusinessmodelthanvisa,mastercard,and 3
4 AmericanExpress.CreditcardservicesisonlyonepartofCapitalOne srevenuemodel,they alsohaveconsumerandcommercialbanking,treasurymanagement,andhomeandautomobile financing.however,sincethecreditcardsegmentremainsthelargestsegmentofcapitalone, thatistheindustrythatareclassifiedin.clearlyvisaandmastercardholdthelargestshareof thecreditcardmarketandhaveconsiderablemarketcapitalizationandarealwaysasignificant threattocapitalone.however,ascapitaloneisoneofthelargestissuersofvisaand MasterCardintheUnitedStates,theirbusinessesaresomewhatintertwined.CapitalOnehasa significantamountofcompetitioninallareasoftheirbusiness,butastheycontinuetopursuea growthstrategythroughacquisitionsandinnovationstheywillbeabletosetthemselvesapart. RevenueandEarningsHistory REVENUE - QUARTERLY RESULTS (IN MILLIONS) FY (12/12) FY (12/11) FY (12/10) 1st 4,935 4,082 4,289 Qtr 2nd 5,055 3,993 3,904 Qtr 3rd 5,782 4,154 4,016 Qtr 4th NA 4,050 3,962 Qtr Total $15,772 $16,279 $16,171 Financial Data in US Dollar EARNINGS PER SHARE - QUARTERLY RESULTS FY FY FY (12/12) (12/11) (12/10) 1st $2.74 $2.24 $1.41 Qtr 2nd $0.16 $2.00 $1.34 Qtr 3rd $2.03 $1.78 $1.77 Qtr 4
5 4th Qtr NA $0.84 $1.54 Total $4.93 $6.86 $6.06 Discussanypatterninrevenueandearnings(e.g.,increasingyearoveryear;seasonal;etc.) CapitalOnehasseenrevenuesincreaseoverthelastfourquarters,andannualrevenuegrow overthelastthreeyears(assumingthatthefourthquarterof2012meetsreasonable expectations).eachquarterhasincreasedfromayear to yearbasiswiththeexceptionofthe secondquarterin2011.iseethisasapositivesignthatthelastfourquartershaveshown growth,andcomparingquartersyear to yeartheyhavebeengrowingaswell.ifthefourth quarterhasanysortofreasonablerevenuewewillsee2012ashavingaverylargerevenue growthfrom2011. Theearningspersharehashadrelativelysteadygrowthyear to yearwiththeobvious exceptionofthesecondquarterof2012.duringthesecondquartercapitalonefinishedit s somewhatmessyacquisitionofhsbc s27.6billiondollarcreditportfolioaswellassettling $210milliondollarsincivilpenaltiesandconsumerrefunds.Howeverinthefollowingquarter thecompany sepswasupto$2.03andifthefinalquarterproducesareasonableeps,capital OnecouldstillshowannualEPSgrowthin
6 Section(C) FundamentalValuation(EBO) Includethefollowinghere: Copy/pastecompletedFundamentalValuation(EBO)Spreadsheet COF PARAMETERS FY1 FY2 Ltg EPS Forecasts % Model 1: 12-year forecasting horizon (T=12). Book value/share (last fye) and a 7-year growth period. Discount Rate 14.70% Dividend Payout Ratio (POR) 3.08%!"#$%#&'()*"($'&$*'&%$+#&,-.%&,#/0"$,#&,(&1(23&()*&%,(3$4#&'#+.5# Next Fsc Year end 2012 You only need to input values to cells highlighted in "yellow" Current Fsc Mth (1 to 12) 10 The rest of the spreadsheet is calculated automatically Target ROE (industry avg.) 11.86% Please read "Guidelines_for_FundamentalValuation_ProfLee_Spreadsheet" file carefully Year Long-term EPS Growth Rate (Ltg) Forecasted EPS Beg. of year BV/Shr Implied ROE ROE (Beg. ROE, from EPS forecasts) Abnormal ROE (ROE-k) growth rate for B (1-POR)*(ROEt-1) Compounded growth growth*aroe required rate (k) Compound discount rate div. payout rate (k) Add to P/B PV(growth*AROE) Cum P/B Add: Perpetuity beyond current yr (Assume this yr's AROE forever) Total P/B (P/B if we stop est. this period) Implied price Check: Beg. BV/Shr Implied EPS Implied EPS growth Inputs(providebelowinputvaluesusedinyouranalysis) EPSforecasts(FY1&FY2): 6.36%(FY1)and7.05%(FY2) Long termgrowthrate: 9.7% Bookvalue/share(alongwithbookvalueandnumberofsharesoutstanding): Bookvalue: $29,666Million #ofsharesoutstanding: Bookvalue/share: $ Dividendpayoutratio: 3.08% Nextfiscalyearend: December2012 Currentfiscalmonth: 10 TargetROE: 11.86% Output 6
7 Abovenormalgrowthperiodchosen:2years EBOvaluation(Impliedpricefromthespreadsheet):$47.13 SensitivityAnalysis EBOvaluationwouldbe(youcanincludemorethanonescenarioineachofthefollowing): $43.5 ifchangingabovenormalgrowthperiodto4years $47.13 ifchanginggrowthratefrommean(consensus)tothehighestestimate12% $47.13 ifchanginggrowthratefrommean(consensus)tothelowestestimate8% $69.62 ifchangingdiscountrateto10% $47.13 changingtargetroeto7.14%(roettm) WhileIwasinitiallyveryconcerneduponexaminationofthefundamentalvaluationworksheet thatcapitaloneisactuallyanovervaluedstockwithlittleroomforgrowth,someinputs seemedtobeskewingthenumbersdownward.capitalone sbetais1.75whichwhile seeminglyveryhighisconsistentwiththeindustryandsectoritisin.thisbetadrivesthe discountrateupandthatbroughtthevaluedownsubstantially.howeverthebetausedis reportedfromreuters.com,andwhenilookedintootherfinancialsitessuchasyahoofinance, theyreportedthebetaaslowas1.2,whichwouldleadadiscountrateofabout10%.inthe sensitivityanalysisiusedthisdiscountrate,andfoundthatfora2 yearsupernormalgrowth period,thefundamentalvaluewouldbe$69.62,whichabovethecurrentpriceofthestock. Howeveroverall,theEBOvaluationisstillabearishsignal. 7
8 Section(D) RelativeValuation!"# $%&'(#)*( +&,'-'./(+/0-1&0% #2,3&,4 $%&'(56( : ;"+( <&=>% 79? 79!# B&1% ,230I(;&0% D$;JH K(G,(&L% ;&0-2 66$ 66$ <MB ()))))!!!"#$#%&' ())))))))))))))))))!*&%+, ())))))))))))))))))))))))))))))))) $%!+!,%*$!,%+-. '%,, -%/*!'%-/. '%-!!!%'' ++%'! $OMB ()))))))#+"'$,%*- ()))))))))))))))))) -#-%$' ()))))))))))))))))))))))))))))))/#%++!$%$/!&%&-. '%,-,%!$ **%&,. '%/$ &%'+ /-%+# OP7MB ())))))) +/"/'*%+& ()))))))))))))))))))) ##%,, ()))))))))))))))))))))))))))))))))-%$*!!%&-!'%*/.!%!# *%/$ /#%&-. '%!*!%&+!'%$ Q#?MB ()))))))/'"!!#%*/ ()))))))))))))))))))) -'%/# ()))))))))))))))))))))))))))))))))-%/,,%*&!'%+$. '%&& /%/'!&%&$. '%!/ /%+& ()))))))*-"&-/%#- ()))))))))))))))))))) +'%'' ())))))))))))))))))))))))))))))))) $%'# &%#!,%$'. '%&& '%,' $%/&. '%!/!%$+,%* : <&=>% 79? 79!# <MB (!*+%#+ (+$%-# (/&/%'' (!,$%'/ (*$#%'' (-/#%&$ $OMB (!/-%,* (+-%*/ (+!!%** (!*!%*/ (/$-%$$ (!#,%'* OP7MB (&*%-# ($&%-- (/!&%'' (+!%-/ (+*%-! (+,%'* Q#?MB (++%!# (+'%!* (!-+%+$ (#+%#& (,!%*+ (#*%$- T-.I (!*+%#+ ($&%-- (+!!%** (!,$%'/ (*$#%'' (-/#%&$ 523 (++%!# (+'%!* (!-+%+$ (#+%#& (+*%-! (#*%$- $%4-&' (!'-%!, (+#%&& (/#'%'' (,+%*$ (!&*%'$ (!!-%'* Fromthetoppanel WhenlookingattheforwardP/Eofallfivestocks,itisclearthatVisaandMasterCardhave muchhigherp/ethanamericanexpress,discover,andcapitalone.thisisbecausetheyare largercompaniesthataretrustedinthemarketplace,whiletheotherthreearesmallerandstill pursuinggrowth.capitalonehasthesmallestp/e,whichibelieveisbecausetheyarestill activelypursuinggrowth,andtheyareamuchnewercompanythantheothers.thepegratios forallfivecompaniesarerelativelysimilar,thelargestbeing1.15(americanexpress)andthe smallestis.88(discoverandcapitalone).thep/b(mrq)ratiosvarygreatlyfrom.9to9.17. CapitalOnehasthesmallestP/Bratiobyquiteabit,itisevenunder1.Traditionallythismeans thecompanyisundervaluedorthereareseriousissueswiththecompany.ithinkthatinthis caseitcouldmeanthecapitaloneisundervalued.whenlookingatbothp/sandp/cfvisaand MasterCardhavemuchlargerratiosthantheotherthreestocks.(PleasenotethatReuterswas 8
9 unabletoprovidep/cfforall5fivestocks,soallfivestock sp/cfvaluecamefrom msnmoney.com).onceagainithinktheyhavelargerratiosbecausetheyarelarger,older, companiesthatareexperiencinglessgrowththanthesmallercompanies.capitalonetendsto havethelowestmetricsofallit scompetitors,exceptforp/cf.thiscouldbeeitherconcerning, thatcapitaloneisexperiencingseriousissues,orbeabullishsignalthattheyareavery undervaluedcompany. Comparetheimpliedpricesderivedfromvariousvaluationmetrics.Alsocomparethoseimplied pricetothestock scurrentprice,and52 weekhighandlow. Theimpliedpricesderivedfromthevariousvaluationmetricsrangefrom$53.74to$ ThelargestimpliedpricederivesfromcomparingMasterCard sp/bvaluetothatofcapitalone, andthelowestimpliedpricecomesfromcomparingdiscover sp/cfratio.ifwethrewoutthe fewtopandbottomoutliers,themajorityoftheimpliedpricessuggestcapitaloneiscurrently undervalued.thecurrentpriceofcapitaloneis$60.00(october25 th ),it s52weekhighis $61.33andthe52weeklowis$39.30.The52 weeklowislowerthaneventhelowestimplied value.allbutthreeofthe24impliedprices(high,low,andmedianforallvaluemetrics)are greaterthanthecurrentprice.whendecidingwhethertheseimpliedpricesmightbeaccurate, weneedtolookatthehistoryofcapitalone.itisacompanythathasexperiencedconsiderable growthinthelastdecade,andshowssignsthatthisgrowthwillcontinue.theyhavemade somelargeacquisitions,andibelievethatthemarkethasnotquitecaughtupwithwhattheir currentvaluemightbe.thelowestmedianimpliedpriceis$65.88,whichishigherthanthe52 weekhigh.therecouldbeanopportunityforprofit. Fromthebottompanel Discussthevariousimpliedpricesofyourstockderivedfromcompetitors ( comparables ) multiples.howdifferentarethepricesderivedfromthevariousvaluationmetrics?noteany valuationmetricsthatseemtoyieldoutlierpricesandexplainwhy(hint:isthatbecausethat particularvaluationmetricsisnotveryrelevantfortheindustry?doyoubesttoprovide convincingarguments). ThelowestimpliedpricesfromCapitalOnecomefromthePEG,andthehighestcomefrom P/B.ThereasonwhytheimpliedpricefromP/Bissohighcanbeeasilyexplainedbythehuge differenceincapitaloneandit scompetitor sratios.pricetobookisthecurrentpricedivided bybookvalue.sohavingap/bunderonemeansthatinvestorsarecurrentlypayinglessthan thebookvalueofthecompany.thiscouldbeanopportunityforcapitalone.thelowest impliedpricescomefromthepegratios.thepegratioisthep/eratiodividedbyannualeps 9
10 growth,soessentiallyitiswhatinvestorsarewillingtopayforeachdollarearnedtakinginto accountthefuturegrowthofearnings.onereasonwhythepegratioandforwardp/eimplied pricesmaybelowerthantheothermetricsisthatinthefinancialsector,thep/eratioisnot usedasmuchasaaccurateindicatorofvalueasitisinotherindustries. Foreachvaluationmetrics,Comparethecurrentpriceand52 weekhigh/lowofyourstockto thehigh lowrangederivedfrommultiplesofitscompetitors. WiththeexceptionofthelowvaluederivedfromthevalueratioandtheP/CFmultiplesofit s competitors,allthelow sarehigherthanthe52 weeklowandthecurrentpriceofcapitalone. Allofthemedianprices,andthehighvaluesforeachvaluationmetricarehigherthatthe currentprice,the52 weeklowandthe52 weekhigh,somebyhugeamounts.thissuggests thatcapitalonemaybesignificantlyundervaluedatthistime. Amongthevaluationmetricsanalyzed,whichonesdoyouthinkaremostrelevantasa valuationtoolforyourstock? TraditionallythefinancialsectorusesPricetoBookasthemostusefulvaluationmetric,which inthiscasewouldbeaverygoodsignforcapitalone.themedianimpliedpricederivedfrom P/BforCapitalOneis$250.00,whichisfarabovewhattheyarecurrentlytradedatandthe52 weekhigh. 10
11 Section(E) RevenueandEarningsEstimates HISTORICAL SURPRISES Sales and Profit Figures in US Dollar (USD) Earnings and Dividend Figures in US Dollar (USD) Estimates vs Actual Estimate Actual Difference Surprise % SALES (in millions) Quarter Ending Sep-12 5, , Quarter Ending Jun-12 5, , Quarter Ending Mar-12 4, , Quarter Ending Dec-11 4, , Quarter Ending Sep-11 3, , Earnings (per share) Quarter Ending Sep Quarter Ending Jun Quarter Ending Mar Quarter Ending Dec Quarter Ending Sep Thecompanydoeshaveahistoryofsurprisingthemarket,moresowiththeearningspershare thantherevenues.inthelastfivequarters,thesmallestsurprisetothemarketconcerningeps was55.26,whileontherevenuesidethelargestsurprisetothemarketinthelastfivequarters was13.93,with3beingbelow3%.allofthesurprisestothemarkethavebeenpositivewith theexceptionofrevenueinthesecondquarterof2012andtheepsinthesecondquarterof 2012andlastquarterof2011.OnereasonthatbothrevenueandEPShadanegativesurprisein thesecondquarterof2012wasthecomplicatedandmessyacquisitionofhsbc.thesurprises weremorenotableforeps,withthelargestsurprisebeing 42.67%.Howevertherewereno 11
12 notabledropsinthestockpriceinjuneorjulyof2012,infactthestockcontinuedasteady climb.thesameholdstruefordecember2011andjanuary2012,therewereonlysmalldrops inwhatwasinlargeaclimbinthestockprices. CONSENSUS ESTIMATES ANALYSIS Sales and Profit Figures in US Dollar (USD) Earnings and Dividend Figures in US Dollar (USD) # of Estimates Mean High Low 1 Year Ago SALES (in millions) Quarter Ending Dec , , , , Quarter Ending Mar , , , , Year Ending Dec , , , , Year Ending Dec , , , , Earnings (per share) Quarter Ending Dec Quarter Ending Mar Year Ending Dec Year Ending Dec LT Growth Rate (%) Reviewtherangeandtheconsensusofanalysts estimates.(1)calculatethe%differenceofthe high estimatefromtheconsensus(mean);(2)calculatethe%(negative)differenceofthe low estimatefromtheconsensus;(3)arethedivergentmorenotableforthecurrentorout 12
13 quarter,fy1orfy2,revenueorearnings?(4)notethenumberofanalystsprovidingltgrowth rateestimate.itthatroughlythesameasthenumberofanalystsprovidingrevenueand earningsestimates? %differencehighandmean %differencelowandmean Sales QDec 12 19% 10.94% QMarch % YearDec % 4.9% YearDec % 9.36% EPS QDec % 16.46% QMarch % 21.67% YearDec % 22.48% YearDec % 15.89% LTGrowthRate 19.17% 17.53% Thedivergentismorenotableforearningsthanrevenue,whichseemstobeatrendforCapital OnethatEPShashadlargersurprisesthanrevenue.Thedivergentisalsomorenotableforthe out quarterthancurrent,andforfy2thanfy1.thismakessenseastheestimatesarefarther out.therearesignificantlylessanalystsprovidingestimateforltgrowthrate CONSENSUS ESTIMATES TREND Sales and Profit Figures in US Dollar (USD) Earnings and Dividend Figures in US Dollar (USD) Current 1 Week Ago 1 Month Ago 2 Month Ago 1 Year Ago SALES (in millions) Quarter Ending Dec-12 5, , , , ,
14 Quarter Ending Mar-13 5, , , , , Year Ending Dec-12 21, , , , , Year Ending Dec-13 22, , , , , Earnings (per share) Quarter Ending Dec Quarter Ending Mar Quarter Ending Dec Quarter Ending Dec Reviewrecenttrendofanalysts consensus(mean)estimatesonrevenueandearnings.(1)are theconsensusestimatestrendingup,down,orstaythesame?(2)isthetrendmorenotablefor thenear orout quarter,fy1orfy2,revenueorearnings? TheconsensusestimatesaretrendingupinbothrevenuesandEPS,withtheexceptionofone weekagowheningeneraltheestimateswentdownforepsandrevenue.howevertheywent backupconsiderablyinthecurrentcolumn.iassumethisisbecauseqe3wasreleasedduring thattimefram.thereisnosignificantdifferenceinnearoroutquarter,butthereisaslightly highertrendupinfy1thanfy2foreps. ESTIMATES REVISIONS SUMMARY Last Week Last 4 Weeks Number Of Revisions: Up Down Up Down 14
15 Revenue Quarter Ending Dec Quarter Ending Mar Year Ending Dec Year Ending Dec Earnings Quarter Ending Dec Quarter Ending Mar Year Ending Dec Year Ending Dec Reviewthenumberofanalystsrevisingupordowntheirestimates(bothrevenueandearnings) inthelastandlastfourweeks.(1)notewhethertherearemoreupordownrevisions;(2)are therevisionspredominantlyonedirectional?(3)anynotabledifferencelastweekversuslast fourweeks,revenueversusearnings? Overalltherearemoreuprevisionsthandownrevisions.Especiallyforthequarterending December2012andtheyearendingDecember2012.Therevisionstendtobemoreupward trendingthandownwardtrending.althoughtheanalystsdidtrendmoredownwardthan upwardforthequarterendinginmarch13forbothrevenueandearningsinthelastweekas wellasinthelastfourweeks.therearemoreupwardrevisionsinthelastweekthaninthelast fourweeks,mostlikelyduetocapitalonereleasingtheirthirdquarterearningswhichwere higherthanexpected.alsotherevisionsforearningsaremorenotablethanforrevenues. 15
16 YouwillneedtoincorporatewhatyouseeherewithMorningstar sanalystresearchreport(you canaccessmorningstardirectatthefinancialmarketslab.)andotherreadings/analysisyou foundfromvariouson linefinancialsites.discusswhetheryouthinkthecompanyhasagood chanceofmakingorbeatinganalystconsensusestimate,andwhy.basedonhowthestockhas beentradinglately,doyouthinkmarkethasalreadyanticipatedstrongorlacklusterfinancial outlookfromthecompany? IthinkthatCapitalOneFinancialCorporationdoeshaveagoodchanceofbeatinganalyst s estimates.theyhavequicklybecomeoneofthenationslargestlendersandthisyearhave acquiredbothingdirectandhsbc sdomesticcardbusiness.ithinkthattheyareinagood financialposition,theirtotaldebttoequityratioismuchlessthantheindustryandthesector. Theacquisitionsbothstartedshowingtheywereworthitinthethirdquarterandshould continueinthisupwardtrajectory.theyhavestrongleadershipunderrichardfairbank,whois willingtopursueanaggressivegrowthstrategy.theybeatanalyst sestimatesinthethird quarterandshowedincreasednumbersinnetincomeandearningspershareandareprepared todothisagaininthefourthquarter.thelargestconcernisthatthelendingindustryis sufferingasawholeundertheprolongedinterestrateenvironmentintheunitedstates.the stockhasbeenincreasingfairlysteadilyforthelast3months,andithinkthemarketis anticipatinggrowthbutthatithasnottoppedoutyet.thecurrentpriceisapproachingthe52 weekhigh,whichisalwaysworrisometoseeifitcanclimbthroughthatceiling. 16
17 Section(F) Analysts Recommendations ANALYST RECOMMENDATIONS AND REVISIONS 1-5 Linear Scale Current 1 Month Ago 2 Month Ago 3 Month Ago (1) BUY (2) OUTPERFORM (3) HOLD (4) UNDERPERFORM (5) SELL No Opinion Mean Rating Reviewthetrendofanalystrecommendationsoverthelastthreemonths.Isthereanotable changeofanalystopinions,turningmorebullishorbearish?howmanydifferentratingsout ofthefivepossibleonesdidthecompanyreceivecurrently,one,two,andthreemonthsago? Isthereanotabletrendofopinionconvergenceordivergence?Iswhatyouseehere consistenttocommentsinmorningstaranalyst sresearchreportaswellasvariousonline financialsitesyouhadresearchedon? Overthepastthreemonthsanalystshavebeenconsistentintheiropinions,withtheonly changebeingonemoreanalystsrecommendsbuy,andoutperforminthecurrentsection. CapitalOnehasonlyreceivedbuy,outperform,orholdratingsfromtheanalysts.CapitalOne hasameanratingof1.86whichisabullishrating.thisisconsistentwithwhatihaveseenon othersites,includingmorningstarwhichgivesaratingof4.1outof5(inthiscasethatisa bullishrating).almostallthefinancialsiteshavecapitalonereceivingthelargestnumberof buyandoutperform,withsomesuggestinghold. 17
18 NOTE:OnaFive pointscale,reutersassigns 1 to Buy,themostbullishrecommendation, and 5 to Sell,themostbearishrecommendation.Someotheronlinesiteshaveopposite scale,withtheir 1 beingthemostbearishand 5 beingthemostbullishrecommendations. 18
19 Section(G) B6&=(&,73$%63=7,=%7,(=0&,/)*(,/&G+6=/&,/3,13>',3$%,(/3'=:&,7&0*.& You only need to input values to cells highlighted in "yellow" The rest of the spreadsheet is calculated automatically Please read "Stock Recommendation Guidelines" document carefully!"# "$%&'()*+,-./*0*/1 2,34,5367&'( 8,9&:;,5367&'( <)='&( 8,<)='&( <)='&(,">/(/=%7*%:!"#$%%%$&'( #%%)%%* &'# #%%)(+*!#"$&&!$(## "'),'* 2,A&$,B3(*/*3%( #% #),&* 2,!63(&7,B3(*/*3%(! %)(+* 2,C%.'&=(&7,B3(*/*3%(!" &)-"* 2,D&.'&=(&7,B3(*/*3%( (% &)(-* &"( #%%)%%*!#'$+'#$+!- "')+#* 2,A&/,9>1&'(?E,F3;,A&/,!):., +')#!*.&#!$"+,.%)#,* "$%&'()*+,C%43'G=/*3% +,)+%* F>/>=6,#>%7,8,"$%&'()*+ #),+* #63=/,8 '")"(* J,K8,"$%&'()*+ 5367&',A=G& 8,">/(/=%7*%: L&+3'/,D=/& ING Investment Managment (Natherlands) 9.3 6/30/12 Dodge and Cox 9 6/30/12 / :0;<4=>61!),%* %(?-%?#, 19
20 Combineinformationprovidedinallthreesectionstodiscusswhether(1)institutions,onnet basis,havebeenincreasingordecreasingownershipandhowsignificant,(2)thestockhas sizableinstitutioninterestsandsupport,(3)theextentofthe(>5%)owners,and(4)this couldbeabullishorbearishindicationoffuturestockpricemovement. Onanetbasisinstitutionshavedecreasedownershipataveryinsignificantamountof.12%. Thestockdoeshaveinstitutionalsupportonafairlysignificantbasiswith89.12%ofshares beingownedbyinstitutionalinvestors.thereare3institutionsthathaveagreaterthan5% interestinthecompany.itisabullishsignalthatsomanyinstitutionsownthestock,butslightly bearishthattherehasbeenaslightdecrease(by.12%)intheamountofinstitutional ownership. 20
21 Section(H) ShortInterest(twopages) NOTE:Youareencouragedtolookattheshortinterestinformationfortwoofthecompanies closestcompetitors.thiswillhelpgaugewhetherthesentimentindicatedintheshortinterest statisticsiscompanyspecificorindustry wide. Settlement Date Short Interest Average Daily Shares Volume # of Days to cover 10/15/2012 7,010,635 3,595, /28/2012 6,377,445 4,603, /14/2012 6,064,622 9,341, /31/2012 8,626,341 2,920, /15/2012 9,711,745 3,233, /31/ ,606,837 4,133, /13/ ,231,910 2,136, /29/ ,249,104 4,050, /15/ ,002,795 5,543, /31/2012 9,041,201 4,453, /15/2012 7,574,442 4,495, /30/2012 7,659,062 4,557, /13/2012 7,883,955 4,588, /30/ ,239,684 6,364, /15/2012 9,894,481 6,228, /29/2012 7,617,515 7,841, /15/ ,095,825 5,845, /31/ ,421,420 7,161, /13/ ,239,543 5,685, /30/ ,094,592 4,743, /15/ ,440,590 5,197, /30/ ,391,242 5,310, /15/ ,719,700 5,031, /31/ ,469,152 7,145, /14/ ,692,251 5,609,
 (Most recent date) (Most recent date) (2 weeks prior) 7.01Million 1.7 2.00% 6.")
22 Fromhttp://finance.yahoo.com/ Completethefollowingtablewithinformationfromthe sharestatistics table. Avg Vol Avg Vol Shares (3 month) (10 day) Outstanding Float 4.537,680 5,435, Million Million Shares Short Short Ratio Short % of Float Shares Short (Most recent date) (Most recent date) (Most recent date) (2 weeks prior) 7.01Million % 6.38Million 22
23 Basedontheshortintereststatisticsanditsrecenttrend,howisthemarketsentimentonthe stock?hasthesentimentturnedmorebullishorbearishoverthelastyear?howaboutin morerecentmonthandwhy? Themostnotablethingconcerningshortinterestoverthelastyear,ishowlargethedeclinein shortinteresthasbeenoverall,from30,692,251to7,010,350.thisshowsthatsentimenthas turnedbullishoverthelastyear.howeveritdidincreasefrom9/28/2012to10/15/2012.i wouldbeinterestedtoseewhatitisnextweekwhenitisreported,sinceqe3wasreleasedon October18 th.withashortinterestratioof1.7,thisindicatesbullishtendenciesinthemarket forcapitalone.alsotheshort%offloatisonly2%.thisindicatesthatonly2%ofallshares beingtradedarebeingshorted,whichindicatesthemarketdoesnotlargelypredictthisstock todecreaseinpriceandisabullishsignal. 23

24 Section(I) StockCharts Key COF=Darkblueandshaded S&P500=Purple Financials=Red AXP=Green V=Lightblue Athreemonthspricechart 24
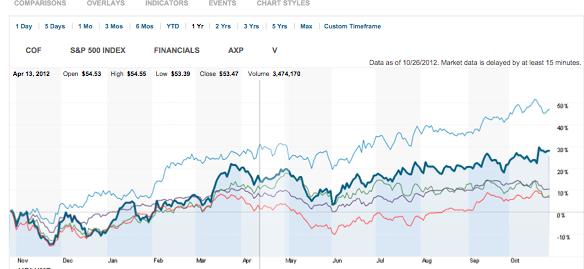

25 Aoneyearpricechart Afiveyearpricechart 25
26 Discusswhatyouobservefromthestockcharts.Thisshouldincludecomparingyourstockto competitors,sector,andsp500overthethreedifferenttimehorizons. Thestockchartsaresomewhatdisconcerting.Onthefive yearpricechartweseethatcapital OnegenerallystayswithAmericanExpressandtheMarketbutislargelyoutperformedbythe financialsectoraswellasvisa.thethree yearpricechartismorepromisingwithcapitalone outperformingthes&p500,thexlf,andamericanexpress.thethree monthpricechartshows thatcapitaloneiscloselyfollowingvisaandamericanexpress,butbeingoutperformedbythe S&P500andtheXLF.HoweverweseethatinthelastfewdaysCapitalOnehasbeen outperformingallthebutthexlf. 26
27 References CapitalOneCompanyProfile.AccessedOctober ename=about+capital+one&portletlocation=4%3b4 8 4 col%3b1 1 1&ComponentName=secondary_nav&ContentElement=3%3BCorporate+Information&TargetLo b=mts%3a%3alctmjbe8z&targetpagename=corporate+information&referer= e.com CapitalOneAnnual10kReport2011.AccessedOctober242012http://phx.corporateir.net/phoenix.zhtml?c=70667&p=irol irhome CapitalOnePressReleaseOctober AccessedOctober242012http://phx.corporateir.net/phoenix.zhtml?c=70667&p=irol news Yahoo!Finance.CapitalOneStocks.AccessedOctober MSNMoney.Investments.AccessedOctober percent ownership?symbol=cof MorningstarDirect.CapitalOneFinancialCorporation.AccessedOctober Nasdaq.ShortInterest.AccessedOctober Reuters.com.CapitalOneFinancialCorporation.AccessedOctober Reuters.com.Visa.AccessedOctober Reuters.com.MasterCard.AccessedOctober Reuters.com.AmericanExpress.AccessedOctober
28 Reuters.com.DiscoverFinancialServices.AccessedOctober
CIF Stock Recommendation Report (Fall 2012)
") Section(A)Summary Date: 10/31/2012 AnalystName: KristenHecht CIFStockRecommendationReport(Fall2012) CompanyNameandTicker: Metlife(MET) RecommendationBuy:YesNo TargetPrice: $42.00 Sector:Financial Industry:LifeInsurance
Section(A)Summary Date: 10/31/2012 AnalystName: KristenHecht CIFStockRecommendationReport(Fall2012) CompanyNameandTicker: Metlife(MET) RecommendationBuy:YesNo TargetPrice: $42.00 Sector:Financial Industry:LifeInsurance
CIF Stock Recommendation Report (Fall 2012)
") Section (A) Summary CIF Stock Recommendation Report (Fall 2012) Recommendation: Do Not Buy Recommended Buy Price: $69 Sector: Industrials Company Name and Ticker: Caterpillar Inc. (CAT) Industry: Farm
Section (A) Summary CIF Stock Recommendation Report (Fall 2012) Recommendation: Do Not Buy Recommended Buy Price: $69 Sector: Industrials Company Name and Ticker: Caterpillar Inc. (CAT) Industry: Farm
CIF Stock Recommendation Report (Fall 2012)
") Date: 10/13/2012 Analyst Name: Ryan Ellingsen CIF Stock Recommendation Report (Fall 2012) Company Name and Ticker: Colgate-Palmolive Company (CL) Section (A) Summary Recommendation Buy: Hold Target Price:
Date: 10/13/2012 Analyst Name: Ryan Ellingsen CIF Stock Recommendation Report (Fall 2012) Company Name and Ticker: Colgate-Palmolive Company (CL) Section (A) Summary Recommendation Buy: Hold Target Price:
CIF Stock Recommendation Report (Fall 2012)
") Section (A) Summary CIF Stock Recommendation Report (Fall 2012) Company Name and Ticker: Boeing BA Recommendation Buy: Yes Target Price: $83.00 Sector: Industrials Industry: Aerospace & Defense Market
Section (A) Summary CIF Stock Recommendation Report (Fall 2012) Company Name and Ticker: Boeing BA Recommendation Buy: Yes Target Price: $83.00 Sector: Industrials Industry: Aerospace & Defense Market
CIF Stock Recommendation Report (Fall 2012)
") Date: Saturday, November 10, 2012 Analyst Name: Fausto Guillén Aguilar Jr. CIF Stock Recommendation Report (Fall 2012) Company Name and Ticker: International Business Machines Corp IBM Section (A) Summary
Date: Saturday, November 10, 2012 Analyst Name: Fausto Guillén Aguilar Jr. CIF Stock Recommendation Report (Fall 2012) Company Name and Ticker: International Business Machines Corp IBM Section (A) Summary
CIF Stock Recommendation Report (Fall 2012)
") CIF Stock Recommendation Report (Fall 2012) Date: Nov 27 th 2012 Analyst Name: Tung Linh Company Name and Ticker: W.W. Grainger, Inc. (GWW) Section (A) Summary Recommendation Buy: No Target Price: Stop-Loss
CIF Stock Recommendation Report (Fall 2012) Date: Nov 27 th 2012 Analyst Name: Tung Linh Company Name and Ticker: W.W. Grainger, Inc. (GWW) Section (A) Summary Recommendation Buy: No Target Price: Stop-Loss
CIF Stock Recommendation Report (Spring 2013)
") Date: 2/11/2013 Analyst Name: Bradley Barham CIF Stock Recommendation Report (Spring 2013) Section (A) Summary Company Name and Ticker: CNH Global N.V. (CNH)_ Recommendation Buy: Yes No Target Price: 55.00
Date: 2/11/2013 Analyst Name: Bradley Barham CIF Stock Recommendation Report (Spring 2013) Section (A) Summary Company Name and Ticker: CNH Global N.V. (CNH)_ Recommendation Buy: Yes No Target Price: 55.00
CIF Stock Recommendation Report (Fall 2012)
") Section (A) Summary Date: 12/6/2012 Analyst Name: Jacob Allen CIF Stock Recommendation Report (Fall 2012) Company Name and Ticker: Qualcomm Inc. (QCOM) Recommendation Buy: Yes No Target Price: $67.00 Sector:
Section (A) Summary Date: 12/6/2012 Analyst Name: Jacob Allen CIF Stock Recommendation Report (Fall 2012) Company Name and Ticker: Qualcomm Inc. (QCOM) Recommendation Buy: Yes No Target Price: $67.00 Sector:
CIF Stock Recommendation Report (Spring 2013)
") Date: 3/22/13 Analyst Name: Jacob Allen CIF Stock Recommendation Report (Spring 2013) Company Name and Ticker: CareFusion Corp. (CFN) Section (A) Summary Recommendation Buy: Yes No Target Price: Stop-Loss
Date: 3/22/13 Analyst Name: Jacob Allen CIF Stock Recommendation Report (Spring 2013) Company Name and Ticker: CareFusion Corp. (CFN) Section (A) Summary Recommendation Buy: Yes No Target Price: Stop-Loss
CIF Stock Recommendation Report (Fall 2012)
") Date: November 15, 2012 Analyst Name: Jun Mei CIF Stock Recommendation Report (Fall 2012) Company Name and Ticker: Simon Property Group (SPG) Section (A) Summary Recommendation Buy: Yes No Target Price:
Date: November 15, 2012 Analyst Name: Jun Mei CIF Stock Recommendation Report (Fall 2012) Company Name and Ticker: Simon Property Group (SPG) Section (A) Summary Recommendation Buy: Yes No Target Price:
CIF Stock Recommendation Report (Spring 2015)
") Date: 3/3/2015 Analyst Name: Connor Black and Ali Al-Lawati CIF Stock Recommendation Report (Spring 2015) Company Name and Ticker: Danaher (DHR) Section (A) Investment Summary Recommendation Buy: Yes Target
Date: 3/3/2015 Analyst Name: Connor Black and Ali Al-Lawati CIF Stock Recommendation Report (Spring 2015) Company Name and Ticker: Danaher (DHR) Section (A) Investment Summary Recommendation Buy: Yes Target
CIF Stock Recommendation Report (Spring 2013)
") Date: March 4 th, 2013 Analyst Name: Tung Linh CIF Stock Recommendation Report (Spring 2013) Company Name and Ticker: Berkshire Hathaway Inc. (BRK.B) Section (A) Summary Recommendation Buy: Yes Target
Date: March 4 th, 2013 Analyst Name: Tung Linh CIF Stock Recommendation Report (Spring 2013) Company Name and Ticker: Berkshire Hathaway Inc. (BRK.B) Section (A) Summary Recommendation Buy: Yes Target
CIF Stock Recommendation Report (spring 2013)
") Date: 4/3/2013 Analyst Name: Matt Vague CIF Stock Recommendation Report (spring 2013) Section (A) Summary Company Name and Ticker: O Reilly Automotive Inc (ORLY) Recommendation Buy: Yes No Target Price:
Date: 4/3/2013 Analyst Name: Matt Vague CIF Stock Recommendation Report (spring 2013) Section (A) Summary Company Name and Ticker: O Reilly Automotive Inc (ORLY) Recommendation Buy: Yes No Target Price:
CIF Stock Recommendation Report (Fall 2012)
") Date: 2/8/13 Analyst Name:_Walter Nabarrete CIF Stock Recommendation Report (Fall 2012) Company Name and Ticker: Praxair (PX) Section (A) Summary Recommendation Buy: Yes No Target Price: N/A Stop-Loss
Date: 2/8/13 Analyst Name:_Walter Nabarrete CIF Stock Recommendation Report (Fall 2012) Company Name and Ticker: Praxair (PX) Section (A) Summary Recommendation Buy: Yes No Target Price: N/A Stop-Loss
CIF Stock Recommendation Report (Fall 2012)
") Date: 10/16/2012 Analyst Name: Matthew Vague CIF Stock Recommendation Report (Fall 2012) Company Name and Ticker: Chevron (CVX) Section (A) Summary Recommendation Buy: Yes Target Price: Stop-Loss Price:
Date: 10/16/2012 Analyst Name: Matthew Vague CIF Stock Recommendation Report (Fall 2012) Company Name and Ticker: Chevron (CVX) Section (A) Summary Recommendation Buy: Yes Target Price: Stop-Loss Price:
CIF Stock Recommendation Report (Fall 2012) Summary
 Summary") Date: 11/6/2012 Analyst Name: Kyle Temple CIF Stock Recommendation Report (Fall 2012) Company Name and Ticker: Dover Corp Summary DOV Recommendation Buy: Yes No Target Price: $65.00 Sector: Industrials
Date: 11/6/2012 Analyst Name: Kyle Temple CIF Stock Recommendation Report (Fall 2012) Company Name and Ticker: Dover Corp Summary DOV Recommendation Buy: Yes No Target Price: $65.00 Sector: Industrials
CIF Stock Recommendation Report (Fall 2012)
") Date: October 9, 2012 Analyst Name: Alyssa Wood CIF Stock Recommendation Report (Fall 2012) Company Name and Ticker: Molson-Coors Brewing Company (TAP) Section (A) Summary Recommendation Buy: Hold Target
Date: October 9, 2012 Analyst Name: Alyssa Wood CIF Stock Recommendation Report (Fall 2012) Company Name and Ticker: Molson-Coors Brewing Company (TAP) Section (A) Summary Recommendation Buy: Hold Target
CIF Stock Recommendation Report (Fall 2012)
") Section (A) Summary Date: 10/31/2012 Analyst Name: Hassam Al-Shamlan CIF Stock Recommendation Report (Fall 2012) Company Name and Ticker: (KO) Recommendation Buy: Yes No Target Price: $45.00 Sector: Consumer
Section (A) Summary Date: 10/31/2012 Analyst Name: Hassam Al-Shamlan CIF Stock Recommendation Report (Fall 2012) Company Name and Ticker: (KO) Recommendation Buy: Yes No Target Price: $45.00 Sector: Consumer
CIF Stock Recommendation Report (Fall 2012)
") Section (A) Summary Date: 11/06/12 Analyst Name: Austin Frazier CIF Stock Recommendation Report (Fall 2012) Company Name and Ticker: GameStop (GME) Recommendation Buy: Yes No Target Price: 26.00 Sector:
Section (A) Summary Date: 11/06/12 Analyst Name: Austin Frazier CIF Stock Recommendation Report (Fall 2012) Company Name and Ticker: GameStop (GME) Recommendation Buy: Yes No Target Price: 26.00 Sector:
CIF Stock Recommendation Report (Spring 2013)
") Date: February 13, 2013 Analyst Name: Alyssa Wood CIF Stock Recommendation Report (Spring 2013) Company Name and Ticker: Urban Outfitters (URBN) Section (A) Summary Recommendation Buy: Yes Target Price:
Date: February 13, 2013 Analyst Name: Alyssa Wood CIF Stock Recommendation Report (Spring 2013) Company Name and Ticker: Urban Outfitters (URBN) Section (A) Summary Recommendation Buy: Yes Target Price:
CIF Stock Recommendation Report (Spring 2015)
") Date:4/11/15 Analyst Name: Christine Nordlie and Connor Phelps CIF Stock Recommendation Report (Spring 2015) Section (A) Investment Summary Recommendation Buy: Yes No Limit Buy at $111 Sector: Health Care
Date:4/11/15 Analyst Name: Christine Nordlie and Connor Phelps CIF Stock Recommendation Report (Spring 2015) Section (A) Investment Summary Recommendation Buy: Yes No Limit Buy at $111 Sector: Health Care
CIF Stock Recommendation Report (Fall 2012)
") Section (A) Summary Date:2/28/2013 Analyst Name: Kristen Hecht CIF Stock Recommendation Report (Fall 2012) Company Name and Ticker: Walt Disney Co (DIS) Recommendation Buy: Yes No Target Price: $62.00
Section (A) Summary Date:2/28/2013 Analyst Name: Kristen Hecht CIF Stock Recommendation Report (Fall 2012) Company Name and Ticker: Walt Disney Co (DIS) Recommendation Buy: Yes No Target Price: $62.00
CIF Stock Recommendation Report (Fall 2012)
") Date: 2/29/2013 Analyst Name: Matt Vague CIF Stock Recommendation Report (Fall 2012) Company Name and Ticker: Wynn Resorts Ltd. (WYNN) Section (A) Summary Recommendation Buy: Yes No Target Price: Stop-Loss
Date: 2/29/2013 Analyst Name: Matt Vague CIF Stock Recommendation Report (Fall 2012) Company Name and Ticker: Wynn Resorts Ltd. (WYNN) Section (A) Summary Recommendation Buy: Yes No Target Price: Stop-Loss
CIF Stock Recommendation Report (Fall 2012)
") Date: 10/11/12 Analyst Name: Joseph Brendel CIF Stock Recommendation Report (Fall 2012) Section (A) Summary Company Name and Ticker: Prudential (PRU) Recommendation Buy: No Target Price: 35 Sector: Financials
Date: 10/11/12 Analyst Name: Joseph Brendel CIF Stock Recommendation Report (Fall 2012) Section (A) Summary Company Name and Ticker: Prudential (PRU) Recommendation Buy: No Target Price: 35 Sector: Financials
CIF Stock Recommendation Report (Fall 2012)
") Date:_10/9/2012 Analyst Name: Scott R. Mertens CIF Stock Recommendation Report (Fall 2012) Company Name and Ticker:_JPMorgan Chase_(JPM) Section (A) Summary Recommendation Buy: Yes Target Price: $49.24
Date:_10/9/2012 Analyst Name: Scott R. Mertens CIF Stock Recommendation Report (Fall 2012) Company Name and Ticker:_JPMorgan Chase_(JPM) Section (A) Summary Recommendation Buy: Yes Target Price: $49.24
CIF Stock Recommendation Report (Fall 2012)
") CIF Stock Recommendation Report (Fall 2012) Date: 10/16/2012 Analyst Name: Matt Leid Company Name and Ticker: Salesforce.com (CRM) Section (A) Summary Recommendation Buy: Yes No Target Price: NA Stop-Loss
CIF Stock Recommendation Report (Fall 2012) Date: 10/16/2012 Analyst Name: Matt Leid Company Name and Ticker: Salesforce.com (CRM) Section (A) Summary Recommendation Buy: Yes No Target Price: NA Stop-Loss
CIF Stock Recommendation Report (Spring 2014)
") Date: 4/14/2014 Analyst Name: Kevin Bertelsen CIF Stock Recommendation Report (Spring 2014) Company Name and Ticker: EOG Resources (EOG) Section (A) Investment Summary Recommendation Buy: Yes No Target
Date: 4/14/2014 Analyst Name: Kevin Bertelsen CIF Stock Recommendation Report (Spring 2014) Company Name and Ticker: EOG Resources (EOG) Section (A) Investment Summary Recommendation Buy: Yes No Target
CIF Stock Recommendation Report (Spring 2014)
") Date: 2/28/14 Analyst Name: Anthony Ledesma & Mason Yang CIF Stock Recommendation Report (Spring 2014) Company Name and Ticker: UnitedHealth Group (UNH) Section (A) Investment Summary Recommendation Buy:
Date: 2/28/14 Analyst Name: Anthony Ledesma & Mason Yang CIF Stock Recommendation Report (Spring 2014) Company Name and Ticker: UnitedHealth Group (UNH) Section (A) Investment Summary Recommendation Buy:
CIF Stock Recommendation Report (Spring 2013)
") Date: 2/26/13 Analyst Name: Frank McLaughlin CIF Stock Recommendation Report (Spring 2013) Company Name and Ticker: PPG Industries Inc. (PPG) Section (A) Summary Recommendation Buy: Yes No Target Price:
Date: 2/26/13 Analyst Name: Frank McLaughlin CIF Stock Recommendation Report (Spring 2013) Company Name and Ticker: PPG Industries Inc. (PPG) Section (A) Summary Recommendation Buy: Yes No Target Price:
CIF Stock Recommendation Report (Spring 2015)
") Date: March 4, 2015 Analyst Name: Brady Arnone, CJ Lee CIF Stock Recommendation Report (Spring 2015) Section (A) Investment Summary Recommendation Buy: Yes Sector: Technology Company Name and Ticker: Visa
Date: March 4, 2015 Analyst Name: Brady Arnone, CJ Lee CIF Stock Recommendation Report (Spring 2015) Section (A) Investment Summary Recommendation Buy: Yes Sector: Technology Company Name and Ticker: Visa
CIF Stock Recommendation Report (Fall 2012)
") Date: 10/11/12 Analyst Name: Matthew Landen CIF Stock Recommendation Report (Fall 2012) Company Name and Ticker: UnitedHealth Group Inc (UNH) Section (A) Summary Recommendation Buy: No Target Price: Stop-
Date: 10/11/12 Analyst Name: Matthew Landen CIF Stock Recommendation Report (Fall 2012) Company Name and Ticker: UnitedHealth Group Inc (UNH) Section (A) Summary Recommendation Buy: No Target Price: Stop-
CIF Stock Recommendation Report (Fall 2012)
") Date: December 3, 2012 Analyst Name: Chris Letcher CIF Stock Recommendation Report (Fall 2012) Company Name and Ticker: Northern Trust Corporation (NTRS) Section (A) Summary Recommendation Buy: No Target
Date: December 3, 2012 Analyst Name: Chris Letcher CIF Stock Recommendation Report (Fall 2012) Company Name and Ticker: Northern Trust Corporation (NTRS) Section (A) Summary Recommendation Buy: No Target
CIF Stock Recommendation Report (Spring 2013)
") Date: 4/08/2013 Analyst Name: Frank McLaughlin CIF Stock Recommendation Report (Spring 2013) Section (A) Summary Company Name and Ticker: Monsanto Co. (MON) Recommendation Buy: Yes Target Price: $115 Sector:
Date: 4/08/2013 Analyst Name: Frank McLaughlin CIF Stock Recommendation Report (Spring 2013) Section (A) Summary Company Name and Ticker: Monsanto Co. (MON) Recommendation Buy: Yes Target Price: $115 Sector:
CIF Stock Recommendation Report (Spring 2013)
") Date: February 6, 2013 Analyst Name: Matt Leid CIF Stock Recommendation Report (Spring 2013) Section (A) Summary Company Name and Ticker: Noble Corporation (NE) Recommendation Buy: Yes No Target Price:
Date: February 6, 2013 Analyst Name: Matt Leid CIF Stock Recommendation Report (Spring 2013) Section (A) Summary Company Name and Ticker: Noble Corporation (NE) Recommendation Buy: Yes No Target Price:
CIF Stock Recommendation Report (Fall 2012)
") Section (A) Summary Date: 11/29/12 Analyst Name: Eric Russell CIF Stock Recommendation Report (Fall 2012) Company Name and Ticker:_Tiffany & Co (TIF) Recommendation Buy: Yes No Target Price: $71.00 Stop-Loss
Section (A) Summary Date: 11/29/12 Analyst Name: Eric Russell CIF Stock Recommendation Report (Fall 2012) Company Name and Ticker:_Tiffany & Co (TIF) Recommendation Buy: Yes No Target Price: $71.00 Stop-Loss
Investing.xls debt charts 1 10/4/2010
 Company Explorer - Debt Summary Service Corp. International SCI 817565104 2797560 NYSE Common stock Other Consumer Services 04-Oct-2010 ICMA / Mergent / Reuters Global Fundamentals U.S. Dollar 600 500
CIF Stock Recommendation Report (Fall 2012)
") Date: 11/4/12 Analyst Name: Trevor Boren CIF Stock Recommendation Report (Fall 2012) Company Name: CVS Caremark Corp. Ticker: CVS Section (A) Summary Recommendation Buy: Yes No Target Price: N/A Stop-Loss
Date: 11/4/12 Analyst Name: Trevor Boren CIF Stock Recommendation Report (Fall 2012) Company Name: CVS Caremark Corp. Ticker: CVS Section (A) Summary Recommendation Buy: Yes No Target Price: N/A Stop-Loss
Information Booklet for questions 8 & 9
 Diploma in Corporate Finance C orporate Finance Techniques & Theory Tuesday 1 December 2015 Information Booklet for questions 8 & 9 Chartered Institute for Securities & Investment 2015 ICAEW 2015 All rights
American Axle & Manufacturing Holdings Inc.
 January 22, 2015 American Axle & Manufacturing Holdings Inc. (AXL-NYSE) NEUTRAL Current Recommendation Prior Recommendation Underperform Date of Last Change 05/07/2013 Current Price (01/21/15) $24.14 Target
CIF Stock Recommendation Report (Spring 2015)
") Date:_4/4/14 Analyst Name:_Courtney Hastings, Dom Niolu CIF Stock Recommendation Report (Spring 2015) Company Name and Ticker: Praxair_PX Section (A) Investment Summary Recommendation Buy: Yes No Target
Date:_4/4/14 Analyst Name:_Courtney Hastings, Dom Niolu CIF Stock Recommendation Report (Spring 2015) Company Name and Ticker: Praxair_PX Section (A) Investment Summary Recommendation Buy: Yes No Target
CIF Stock Recommendation Report (Spring 2014)
") Date: 2/23/2014 Analyst Name: Bertelsen and Sedlacek CIF Stock Recommendation Report (Spring 2014) Company Name and Ticker: Chevron Corp. (CVX.N) Section (A) Investment Summary Recommendation Buy: Yes
Date: 2/23/2014 Analyst Name: Bertelsen and Sedlacek CIF Stock Recommendation Report (Spring 2014) Company Name and Ticker: Chevron Corp. (CVX.N) Section (A) Investment Summary Recommendation Buy: Yes
CIF Sector Recommendation Report (Fall 2012)
") CIF Sector Recommendation Report (Fall 2012) Date: 10/27/12 Analyst: Ryan Ellingsen Sector: Consumer Staples Review Period: October 11 th -October 24th Section (A) Sector Performance Review Consumer Staples
CIF Sector Recommendation Report (Fall 2012) Date: 10/27/12 Analyst: Ryan Ellingsen Sector: Consumer Staples Review Period: October 11 th -October 24th Section (A) Sector Performance Review Consumer Staples
Cabot Oil & Gas Corporation
 January 16, 2015 Cabot Oil & Gas Corporation Current Recommendation Prior Recommendation Neutral Date of Last Change 01/16/2015 Current Price (01/15/15) $28.78 Target Price $26.00 UNDERPERFORM SUMMARY
CIF Stock Recommendation Report (Fall 2012) MS Consider Buying: 49. If Less Than 8 WK, next Earnings Ann. Date: Short Interest Ratio: 1.
 MS Consider Buying: 49. If Less Than 8 WK, next Earnings Ann. Date: Short Interest Ratio: 1.") Date: October 14 2012 Analyst Name: Justin L. Jaena CIF Stock Recommendation Report (Fall 2012) Company Name and Ticker:_BBBY Section (A) Summary Recommendation Buy: Yes Target Price: 70 Stop-Loss Price:
Date: October 14 2012 Analyst Name: Justin L. Jaena CIF Stock Recommendation Report (Fall 2012) Company Name and Ticker:_BBBY Section (A) Summary Recommendation Buy: Yes Target Price: 70 Stop-Loss Price:
CIF Stock Recommendation Report (Fall 2012)
") Date: 2/27/13 Analyst Name: Eric Klaasen CIF Stock Recommendation Report (Fall 2012) Company Name and Ticker: Costco Wholesale Corporation (COST) Section (A) Summary Recommendation Buy: No Target Price:
Date: 2/27/13 Analyst Name: Eric Klaasen CIF Stock Recommendation Report (Fall 2012) Company Name and Ticker: Costco Wholesale Corporation (COST) Section (A) Summary Recommendation Buy: No Target Price:
Current Price: $ WK Hi: $ WK Low: $55.21 EBO Valuation: $73.07
 Date: April 12 th, 2014 Analyst Name: Trevor Russell CIF Stock Recommendation Report (Spring 2014) Company Name and Ticker: CVS Caremark Corporation (CVS) Section (A) Investment Summary Recommendation
(PGR-NYSE) Risk Level *
 Risk Level *") March 18, 2015 Progressive Corp. Current Recommendation NEUTRAL Prior Recommendation Outperform Date of Last Change 05/19/2013 Current Price (03/17/15) $27.03 Target Price $28.00 SUMMARY DATA (PGR-NYSE)
March 18, 2015 Progressive Corp. Current Recommendation NEUTRAL Prior Recommendation Outperform Date of Last Change 05/19/2013 Current Price (03/17/15) $27.03 Target Price $28.00 SUMMARY DATA (PGR-NYSE)
KINDLY REFER TO THE LAST PAGE OF THIS PUBLICATION FOR IMPORTANT DISCLOSURES
 16 August 2018 2QFY18 Results Review Public Bank Berhad Higher than expected interim dividend Maintain BUY Unchanged Target Price (TP): RM27.30 INVESTMENT HIGHLIGHTS Earnings within expectations Net profit
Equity Research. Rockwell Collins, Inc. COL: Reduce FQ1 For Higher Restructuring; Savings To Offset. Outperform. November 16, 2015
 November 16, 2015 Equity Research Rockwell Collins, Inc. COL: Reduce FQ1 For Higher Restructuring; Savings To Offset Summary. Rockwell Collins announced after the close on November 13 that its expected
Navigant Consulting Inc.
 February 17, 2015 Navigant Consulting Inc. Current Recommendation SUMMARY DATA NEUTRAL Prior Recommendation Outperform Date of Last Change 08/15/2013 Current Price (02/16/15) $14.99 Target Price $16.00
CIF Stock Recommendation Report (Fall 2012)
") Section (A) Summary Date: 3/8/13 Analyst Name: Matthew Landen CIF Stock Recommendation Report (Fall 2012) Company Name and Ticker: Aflac Inc. (AFL) Recommendation Buy: Yes Target Price: $58.77 (+15%) Sector:
Section (A) Summary Date: 3/8/13 Analyst Name: Matthew Landen CIF Stock Recommendation Report (Fall 2012) Company Name and Ticker: Aflac Inc. (AFL) Recommendation Buy: Yes Target Price: $58.77 (+15%) Sector:
Equity Research. Apple Inc. AAPL: T-Mobile And Sprint Sees Strong iphone 7 Preorders. Market Perform. September 13, 2016
 September 13, 2016 Equity Research Apple Inc. AAPL: T-Mobile And Sprint Sees Strong iphone 7 Preorders T-Mobile and Sprint announces strong iphone 7 Pre-orders. T-Mobile announced iphone 7 and 7 Plus pre-orders
Ultra Petroleum Corp.
 January 21, 2015 Ultra Petroleum Corp. Current Recommendation Prior Recommendation Neutral Date of Last Change 11/16/2014 Current Price (01/20/15) $13.57 Target Price $12.00 SUMMARY DATA UNDERPERFORM 52-Week
Information Booklet for questions 8 & 9
 Diploma in Corporate Finance C orporate Finance Techniques & Theory Tuesday 2 December 2014 Information Booklet for questions 8 & 9 Chartered Institute for Securities & Investment 2014 ICAEW 2014 All rights
CIF Stock Recommendation Report (Spring 2014)
") Date: March 3, 2014 Analyst Name: Michael Sanders & Xiao Liu CIF Stock Recommendation Report (Spring 2014) Company Name and Ticker: Lockheed Martin Corp. (LMT) Section (A) Investment Summary Recommendation
Date: March 3, 2014 Analyst Name: Michael Sanders & Xiao Liu CIF Stock Recommendation Report (Spring 2014) Company Name and Ticker: Lockheed Martin Corp. (LMT) Section (A) Investment Summary Recommendation
Equity Research. Bank of the Ozarks, Inc. (OZRK-NSDQ) OUTLOOK SUMMARY DATA ZACKS ESTIMATES. Hold Prior Recommendation. Current Recommendation
 OUTLOOK SUMMARY DATA ZACKS ESTIMATES. Hold Prior Recommendation. Current Recommendation") Equity Research July 14, 2006 Scott A. Jaggers, CFA www.zacks.com 155 North Wacker Drive Chicago, IL 60606 Bank of the Ozarks, Inc. (OZRK-NSDQ) Current Recommendation Hold Prior Recommendation Sell Date
Equity Research July 14, 2006 Scott A. Jaggers, CFA www.zacks.com 155 North Wacker Drive Chicago, IL 60606 Bank of the Ozarks, Inc. (OZRK-NSDQ) Current Recommendation Hold Prior Recommendation Sell Date
Equity Research. American Tower REIT, Inc. AMT: Solid Q Results--Shows Strength Of Geo-Diverse Model. Outperform.
 October 28, 2016 Equity Research American Tower REIT, Inc. AMT: Solid Q3 2016 Results--Shows Strength Of Geo-Diverse Model AMT reported solid Q3 2016 results that beat our estimates across the board. The
Trailing PE Forward PE 8.5. Buy 5 Analysts. 1-Year Return: -39.3% 5-Year Return: -91.2%
 Last Close 11.46 (CAD) Avg Daily Vol 53,811 52-Week High 20.55 Trailing PE 11.4 Annual Div 0.79 ROE 6.2% LTG Forecast 77.9% 1-Mo 4.3% 2019 April 04 TORONTO Exchange Market Cap 178M 52-Week Low 8.32 Forward
Lincoln Electric Holdings Inc.
 January 22, 2015 Lincoln Electric Holdings Inc. Current Recommendation Prior Recommendation Neutral Date of Last Change 01/22/2015 Current Price (01/21/15) $67.15 Target Price $81.00 OUTPERFORM SUMMARY
Hong Leong Bank Berhad Surprised provisions but better to be prudent
 25 August 2017 4QFY17 Results Review Hong Leong Bank Berhad Surprised provisions but better to be prudent Revert to NEUTRAL Unchanged Target Price (TP): RM15.70 INVESTMENT HIGHLIGHTS FY17 was slightly
Pitney Bowes Inc. (PBI-NYSE) Analyst Note
 Analyst Note") February 03, 2015 Pitney Bowes Inc. (PBI-NYSE) Analyst Note Current Recommendation Prior Recommendation Outperform Date of Last Change 05/01/2014 Current Price (02/02/15) $22.26 Target Price $23.00 NEUTRAL
February 03, 2015 Pitney Bowes Inc. (PBI-NYSE) Analyst Note Current Recommendation Prior Recommendation Outperform Date of Last Change 05/01/2014 Current Price (02/02/15) $22.26 Target Price $23.00 NEUTRAL
CIF Stock Recommendation Report (Spring 2013)
") Date: 3/27/2013 Analyst Name: Braden Parsons CIF Stock Recommendation Report (Spring 2013) Section (A) Summary Company Name and Ticker: Xilinx (XLNX) Recommendation Buy: Yes No Target Price: $43.67 Sector:
Date: 3/27/2013 Analyst Name: Braden Parsons CIF Stock Recommendation Report (Spring 2013) Section (A) Summary Company Name and Ticker: Xilinx (XLNX) Recommendation Buy: Yes No Target Price: $43.67 Sector:
CIF Stock Recommendation Report (Spring 2014)
") Date: March 7 Analyst Name: Mason Yang_ CIF Stock Recommendation Report (Spring 2014) Company Name and Ticker: St. Jude Medical Inc. (STJ) Section (A) Investment Summary Recommendation Buy: Yes No Target
Date: March 7 Analyst Name: Mason Yang_ CIF Stock Recommendation Report (Spring 2014) Company Name and Ticker: St. Jude Medical Inc. (STJ) Section (A) Investment Summary Recommendation Buy: Yes No Target
First Republic Bank NEUTRAL ZACKS CONSENSUS ESTIMATES (FRC-NYSE) SUMMARY
 SUMMARY") March 06, 2015 First Republic Bank Current Recommendation SUMMARY DATA NEUTRAL Prior Recommendation Neutral Date of Last Change 04/14/2011 Current Price (03/05/15) $57.70 Target Price $61.00 52-Week High
March 06, 2015 First Republic Bank Current Recommendation SUMMARY DATA NEUTRAL Prior Recommendation Neutral Date of Last Change 04/14/2011 Current Price (03/05/15) $57.70 Target Price $61.00 52-Week High
Invesco Ltd. NEUTRAL ZACKS CONSENSUS ESTIMATES (IVZ-NYSE)
") March 10, 2015 Invesco Ltd. (IVZ-NYSE) Current Recommendation SUMMARY DATA NEUTRAL Prior Recommendation Underperform Date of Last Change 10/03/2012 Current Price (03/09/15) $40.40 Target Price $42.00 52-Week
March 10, 2015 Invesco Ltd. (IVZ-NYSE) Current Recommendation SUMMARY DATA NEUTRAL Prior Recommendation Underperform Date of Last Change 10/03/2012 Current Price (03/09/15) $40.40 Target Price $42.00 52-Week
Prudential Financial Inc.
 February 06, 2015 Prudential Financial Inc. Current Recommendation NEUTRAL Prior Recommendation Outperform Date of Last Change 04/03/2014 Current Price (02/05/15) $75.32 Target Price $79.00 SUMMARY DATA
Genworth Financial Inc.
 February 12, 2015 Genworth Financial Inc. Current Recommendation Prior Recommendation Neutral Date of Last Change 08/22/2014 Current Price (02/11/15) $8.33 Target Price $7.50 SUMMARY DATA UNDERPERFORM
Trailing PE 8.9. Forward PE 8.0. Buy 1 Analyst. 1-Year Return: -- 5-Year Return: --
 Last Close 0.25 (MYR) Avg Daily Vol 280,263 52-Week High 0.33 Trailing PE 8.9 Annual Div -- ROE 23.0% LTG Forecast -- 1-Mo 4.3% 17 May MALAYSIA Exchange Market Cap 74M 52-Week Low 0.20 Forward PE 8.0 Dividend
Canadian Natural Resources Ltd.
 September 11, 2009 Canadian Natural Resources Ltd. SUMMARY DATA NEUTRAL Current Recommendation Prior Recommendation OUTPERFORM Date of Last Change 08/18/2009 Current Price (09/10/09) $62.91 Target Price
Trailing PE Forward PE Hold 6 Analysts. 1-Year Return: 3.5% 5-Year Return: 21.4%
 Last Close 11.73 (CAD) Avg Daily Vol 961,084 52-Week High 11.84 Trailing PE 25.3 Annual Div 0.80 ROE 6.9% LTG Forecast -- 1-Mo 8.4% 2019 March 26 TORONTO Exchange Market Cap 1.4B 52-Week Low 9.27 Forward
CIF Sector Recommendation Report (Fall 2012)
") CIF Sector Recommendation Report (Fall 2012) Date: November 6, 2012 Analyst: Alyssa Wood Sector: Consumer Staples (XLP) Review Period: October 17-31, 2012 Section (A) Sector Performance Review Cougar Investment
CIF Sector Recommendation Report (Fall 2012) Date: November 6, 2012 Analyst: Alyssa Wood Sector: Consumer Staples (XLP) Review Period: October 17-31, 2012 Section (A) Sector Performance Review Cougar Investment
Trailing PE -- Forward PE Buy 6 Analysts. 1-Year Return: -5.7% 5-Year Return: 710.7%
 ING GROUP (-AE) Last Close 0.95 (EUR) Avg Daily Vol 11.9M 52-Week High 1.62 Trailing PE -- Annual Div -- ROE -112.3% LTG Forecast -- 1-Mo 1.9% November 01 AMSTERDAM Exchange Market Cap 551M 52-Week Low
NextEra Energy Inc. NEUTRAL ZACKS CONSENSUS ESTIMATES (NEE-NYSE)
") March 10, 2015 NextEra Energy Inc. Current Recommendation Prior Recommendation NEUTRAL Outperform Date of Last Change 01/14/2010 Current Price (03/09/15) $98.93 Target Price $104.00 (NEE-NYSE) SUMMARY
March 10, 2015 NextEra Energy Inc. Current Recommendation Prior Recommendation NEUTRAL Outperform Date of Last Change 01/14/2010 Current Price (03/09/15) $98.93 Target Price $104.00 (NEE-NYSE) SUMMARY
Dover Corporation NEUTRAL ZACKS CONSENSUS ESTIMATES (DOV-NYSE) SUMMARY
 SUMMARY") March 09, 2015 Dover Corporation Current Recommendation Prior Recommendation Outperform Date of Last Change 01/11/2011 Current Price (03/06/15) $70.71 Target Price $74.00 NEUTRAL SUMMARY (DOV-NYSE) In
March 09, 2015 Dover Corporation Current Recommendation Prior Recommendation Outperform Date of Last Change 01/11/2011 Current Price (03/06/15) $70.71 Target Price $74.00 NEUTRAL SUMMARY (DOV-NYSE) In
Investment Highlights
 Vtech Holdings 15 November 2017 Maintaining TP of HK$130 Slower growth in top line Vtech Holdings (0303.HK) Export Sector Rating Buy Target Price HK$130.0 (12/18) Close Price 52 weeks high/low Market cap
Calgon Carbon Corporation Rating: Hold
 WATER COMPANIES Christopher Bamman 212-218-3989 cbamman@morganjoseph.com Richard S. Paget, CFA 212-218-3894 rpaget@morganjoseph.com Company Update / Estimates Change February 25, 2008 Key Metrics CCC -
Trailing PE -- Forward PE -- NA 0 Analysts. 1-Year Return: 424.7% 5-Year Return: 415.2%
 DIVIDEND 15 SPLIT CORP (-T) Last Close 10.23 (CAD) Avg Daily Vol 41,738 52-Week High 10.32 Trailing PE Annual Div 1.20 ROE LTG Forecast 1-Mo 0.1% 2018 August 17 TORONTO Exchange Market Cap 460M 52-Week
CIF Sector Recommendation Report (Fall 2012)
") Date: 11/27/2012 Analyst: Joseph Brendel CIF Sector Recommendation Report (Fall 2012) Sector: Finance Review Period: Monday, November 12 - Friday, November 23 Section (A) Sector Performance Review Copy/paste
Date: 11/27/2012 Analyst: Joseph Brendel CIF Sector Recommendation Report (Fall 2012) Sector: Finance Review Period: Monday, November 12 - Friday, November 23 Section (A) Sector Performance Review Copy/paste
SUMMARY. Risk Level *
 February 02, 2015 Xerox Corporation Current Recommendation SUMMARY DATA NEUTRAL Prior Recommendation Underperform Date of Last Change 10/18/2012 Current Price (01/30/15) $13.17 Target Price $14.00 52-Week
Luk Fook (590 HK) Hold (maintained) Target price: HK$ In line results, 1QFY17 remains weak. Equity Research Consumer Discretionary.
 Hold (maintained) Target price: HK$ In line results, 1QFY17 remains weak. Equity Research Consumer Discretionary.") Equity Research Consumer Discretionary Luk Fook (590 HK) Hold (maintained) Target price: HK$16.50 In line results, 1QFY17 remains weak In line results Net profit slumped 41% YoY to HK$959m in 1QFY17, in
Equity Research Consumer Discretionary Luk Fook (590 HK) Hold (maintained) Target price: HK$16.50 In line results, 1QFY17 remains weak In line results Net profit slumped 41% YoY to HK$959m in 1QFY17, in
Luk Fook (590 HK) Hold Target price: HK$ Downgrade to Hold on more challenging HK & Macau market outlook. Equity Research Consumer Discretionary
 Hold Target price: HK$ Downgrade to Hold on more challenging HK & Macau market outlook. Equity Research Consumer Discretionary") Equity Research Consumer Discretionary Luk Fook (590 HK) Hold Target price: HK$24.60 Albert Yip, CFA SFC CE No. ADT599 albertyip@gfgroup.com.hk +852 3719 1010 GF Securities (Hong Kong) Brokerage Limited
Equity Research Consumer Discretionary Luk Fook (590 HK) Hold Target price: HK$24.60 Albert Yip, CFA SFC CE No. ADT599 albertyip@gfgroup.com.hk +852 3719 1010 GF Securities (Hong Kong) Brokerage Limited
Cincinnati Financial Corp.
 February 06, 2015 Cincinnati Financial Corp. NEUTRAL Current Recommendation Prior Recommendation Outperform Date of Last Change 02/10/2014 Current Price (02/05/15) $51.89 Target Price $54.00 (CINF-NASDAQ)
Interpublic Group of Companies Inc.
 February 16, 2015 Interpublic Group of Companies Inc. (IPG-NYSE) Current Recommendation SUMMARY DATA NEUTRAL Prior Recommendation Outperform Date of Last Change 05/28/2012 Current Price (02/13/15) $22.10
Allscripts Healthcare Solutions, Inc.
 December 01, 2014 Allscripts Healthcare Solutions, Inc. Current Recommendation Prior Recommendation SUMMARY DATA NEUTRAL Outperform Date of Last Change 05/17/2012 Current Price (11/28/14) $12.02 Target
Symmetry Medical, Inc.
 November 28, 2014 Symmetry Medical, Inc. Current Recommendation SUMMARY DATA NEUTRAL Prior Recommendation Outperform Date of Last Change 11/28/2014 Current Price (11/27/14) $9.11 Target Price $9.50 52-Week
Avon Products Inc. UNDERPERFORM ZACKS CONSENSUS ESTIMATES (AVP-NYSE)
") February 19, 2015 Avon Products Inc. Current Recommendation Prior Recommendation Neutral Date of Last Change 02/19/2015 Current Price (02/18/15) $9.10 Target Price $8.25 SUMMARY DATA UNDERPERFORM 52-Week
February 19, 2015 Avon Products Inc. Current Recommendation Prior Recommendation Neutral Date of Last Change 02/19/2015 Current Price (02/18/15) $9.10 Target Price $8.25 SUMMARY DATA UNDERPERFORM 52-Week
MITEL NETWORKS CORP (MNW-T) Software & IT Services / Software & IT Services / Software
 Software & IT Services / Software & IT Services / Software") MITEL NETWORKS CORP (-T) Last Close 14.32 (CAD) Avg Daily Vol 261,724 52-Week High 14.67 Trailing PE -- Annual Div -- ROE -9.0% LTG Forecast 25.2% 1-Mo -1.2% August 17 TORONTO Exchange Market Cap 1.8B
MITEL NETWORKS CORP (-T) Last Close 14.32 (CAD) Avg Daily Vol 261,724 52-Week High 14.67 Trailing PE -- Annual Div -- ROE -9.0% LTG Forecast 25.2% 1-Mo -1.2% August 17 TORONTO Exchange Market Cap 1.8B
FILED: NEW YORK COUNTY CLERK 11/30/ :20 PM INDEX NO /2017 NYSCEF DOC. NO. 55 RECEIVED NYSCEF: 11/30/2017. Exhibit 6
 Exhibit 6 October 26, 2015 Equity Research Eros International Plc EROS: Reducing Estimates Related To Last Week's Downgrade Reducing estimates related to last week s downgrade. Given the chaos around EROS
Trailing PE Forward PE -- NA 0 Analysts. 1-Year Return: -9.9% 5-Year Return: --
 PURPLE INNOVATION INC (-O) Last Close 9.09 (USD) Avg Daily Vol 57,316 52-Week High 13.90 Trailing PE 181.1 Annual Div -- ROE 16.1% LTG Forecast -- 1-Mo -15.4% 2018 March 19 NASDAQ Exchange Market Cap 150M
Transocean Ltd. NEUTRAL ZACKS CONSENSUS ESTIMATES (RIG-NYSE)
") January 14, 2015 Transocean Ltd. (RIG-NYSE) Current Recommendation Prior Recommendation Underperform Date of Last Change 02/14/2012 Current Price (01/13/15) $15.52 Target Price $16.00 NEUTRAL SUMMARY We
January 14, 2015 Transocean Ltd. (RIG-NYSE) Current Recommendation Prior Recommendation Underperform Date of Last Change 02/14/2012 Current Price (01/13/15) $15.52 Target Price $16.00 NEUTRAL SUMMARY We
Legg Mason Inc. NEUTRAL ZACKS CONSENSUS ESTIMATES (LM-NYSE)
") March 12, 2015 Legg Mason Inc. Current Recommendation SUMMARY DATA NEUTRAL Prior Recommendation Underperform Date of Last Change 09/22/2013 Current Price (03/11/15) $55.03 Target Price $58.00 52-Week High
March 12, 2015 Legg Mason Inc. Current Recommendation SUMMARY DATA NEUTRAL Prior Recommendation Underperform Date of Last Change 09/22/2013 Current Price (03/11/15) $55.03 Target Price $58.00 52-Week High
CIT Group Inc. NEUTRAL ZACKS CONSENSUS ESTIMATES (CIT-NYSE)
") February 24, 2015 CIT Group Inc. (CIT-NYSE) Current Recommendation SUMMARY DATA NEUTRAL Prior Recommendation Outperform Date of Last Change 02/18/2015 Current Price (02/23/15) $46.13 Target Price $48.50
February 24, 2015 CIT Group Inc. (CIT-NYSE) Current Recommendation SUMMARY DATA NEUTRAL Prior Recommendation Outperform Date of Last Change 02/18/2015 Current Price (02/23/15) $46.13 Target Price $48.50
Federated Investors, Inc.
 March 04, 2015 Federated Investors, Inc. Current Recommendation Prior Recommendation Underperform Date of Last Change 11/30/2014 Current Price (03/03/15) $33.52 Target Price $35.00 NEUTRAL SUMMARY (FII-NYSE)
Vistaprint N.V. NEUTRAL ZACKS CONSENSUS ESTIMATES (VPRT-NASDAQ) SUMMARY
 SUMMARY") October 30, 2014 Vistaprint N.V. Current Recommendation SUMMARY DATA NEUTRAL Prior Recommendation Outperform Date of Last Change 08/07/2013 Current Price (10/29/14) $55.06 Target Price $58.00 52-Week High
October 30, 2014 Vistaprint N.V. Current Recommendation SUMMARY DATA NEUTRAL Prior Recommendation Outperform Date of Last Change 08/07/2013 Current Price (10/29/14) $55.06 Target Price $58.00 52-Week High
SVB Financial Group NEUTRAL ZACKS CONSENSUS ESTIMATES (SIVB-NASDAQ) SUMMARY
 SUMMARY") January 02, 2015 SVB Financial Group Current Recommendation NEUTRAL Prior Recommendation Outperform Date of Last Change 01/02/2015 Current Price (01/01/15) $116.07 Target Price $122.00 SUMMARY DATA (SIVB-NASDAQ)
January 02, 2015 SVB Financial Group Current Recommendation NEUTRAL Prior Recommendation Outperform Date of Last Change 01/02/2015 Current Price (01/01/15) $116.07 Target Price $122.00 SUMMARY DATA (SIVB-NASDAQ)
CH Robinson Worldwide Inc.
 March 20, 2015 CH Robinson Worldwide Inc. Current Recommendation NEUTRAL Prior Recommendation Underperform Date of Last Change 08/22/2013 Current Price (03/19/15) $75.16 Target Price $79.00 SUMMARY DATA
Mindray Medical International Limited
 January 22, 2015 Mindray Medical International Limited Current Recommendation NEUTRAL Prior Recommendation Outperform Date of Last Change 06/26/2014 Current Price (01/21/15) $26.73 Target Price $28.00
Itron, Inc. UNDERPERFORM ZACKS CONSENSUS ESTIMATES (ITRI-NASDAQ) SUMMARY
 SUMMARY") February 13, 2015 Itron, Inc. Current Recommendation Prior Recommendation Neutral Date of Last Change 02/08/2015 Current Price (02/12/15) $35.87 Target Price $33.00 SUMMARY DATA UNDERPERFORM 52-Week High
February 13, 2015 Itron, Inc. Current Recommendation Prior Recommendation Neutral Date of Last Change 02/08/2015 Current Price (02/12/15) $35.87 Target Price $33.00 SUMMARY DATA UNDERPERFORM 52-Week High
CONSOL Energy Inc. (CNX-NYSE)
") March 17, 2015 CONSOL Energy Inc. (CNX-NYSE) Current Recommendation NEUTRAL Prior Recommendation Underperform Date of Last Change 08/20/2013 Current Price (03/16/15) $27.02 Target Price $28.00 SUMMARY
March 17, 2015 CONSOL Energy Inc. (CNX-NYSE) Current Recommendation NEUTRAL Prior Recommendation Underperform Date of Last Change 08/20/2013 Current Price (03/16/15) $27.02 Target Price $28.00 SUMMARY
CIMB Group Holdings Bhd
 01 March 2018 4QFY17 Results Review CIMB Group Holdings Bhd Stellar ending INVESTMENT HIGHLIGHTS Exceeded our expectations, with strong NII and NOII growth, while cost contained NIM dipped in 3QFY17 due