2018. Q2 Quarterly report. August 27, 2018
|
|
|
- David Sherman
- 5 years ago
- Views:
Transcription

1 2018. Q2 Quarterly report August 27, 2018
2 Table of contents Executive summary Consolidated financial statements Revenue, operating income and profit after tax by countries Consolidated operating income and profit after tax without MyCity 12. Franchise segment Own office segment. 22. Financial product intermediary services segment 25. Complementary services segment. 30. Property investments segment and MyCity projects 35. Other- and consolidation segment Annex 1.: time-series report of operational segments 43. Declaration. 44.
3 EXECUTIVE SUMMARY SECOND QUARTER In Q2 of 2018, Duna House Group (the Group ) has continued to produce significant growth compared to last year and performs according to the management`s expectations. The handover of its 86-unit residential development project Reviczky Liget has continued and the real estate and loan activities in Hungary and Poland showed strong growth, as well. Quarterly revenues reached HUF 1.9 billion in the second quarter of 2018 (+57% YoY). EBITDA reached HUF 647 million (+128% YoY) while net profits closed at HUF 533 million (+85% YoY). Based on first and second quarter results, the management of the Group maintains the net profit guidance of HUF 950 1,150 for the core activities, without MyCity development results. The net profit guidance of HUF 680 million for project Reviczky Liget has already been achieved in Q2 by selling 92% of the flats, therefore management expects overperformance from this project. The Group informs the Investors however, that project Forest Hill might be delayed by three months due to overall scarce construction capacities on the market. Construction works are expected to be completed by the end of the year, while realization of profits might be delayed to the financial year The Group forecasted net profits of HUF 1,060 million from project Forest Hill in 2018 by selling 78% of total sellable sqm. The delay will not effect the total profitability of the project, only the timing of its recognition. EBIT has exceeded Q2 of last year by HUF 370 Million: The real estate investment segment has increased its EBIT contribution by HUF 336 million, driven by the handover of 22% of Reviczky Liget`s units in total, 92% of the units have been sold by June 30, The segment`s profitability has been further improved by appreciation of investment properties by HUF 91 million and the realized profit of HUF 52 million on the sale of the project in Zsinor Street. Revenues of the complementary services segment increased by HUF 45 million (+64% YoY), while its EBIT contribution tripled by increasing with HUF 30 million. Growth was driven by the increase in the managed real estate portfolio, improved evaluation services, and the profitable fund management activities. Financial intermediary services segment decreased its contribution to EBIT by HUF 16 million in total (-10%), compared to Q While intermediated loan volumes increased by 44% and home savings decreased by 19%, gross profit margin declined from 38% to 33% due to longer sales bonus periods and one-off positive items booked in Q
4 EXECUTIVE SUMMARY SECOND QUARTER (continued) The franchise segment s revenue has grown by 17%, its gross profit by 18% compared to Q2 2017, its EBIT contribution increased by HUF 26 million. The EBIT contribution of own offices decreased by HUF 7 million as the level of operational expenses increased by 10 million from Q On the date of present quarterly report, the 1-year net return of Duna House Hungarian Residential Real Estate Fund (Duna House Fund) was 10.0% and its net asset value reached HUF 2.9 billion. The Group has expanded the distribution of the Duna House Fund, MKB Bank Zrt. joined sales with nationwide network from January,
5 Consolidated financial statements
6 CONSOLIDATED BALANCE SHEET Consolidated balance sheet data in thhuf June 30. (not audited) December 31. (audited) Variance Consolidated balance sheet data in thhuf June 30. (not audited) December 31. (audited) Variance thhuf % thhuf % Other intangible assets % Share capital % Goodwill % Share premium % Investment property % Other reserves % Property, plant % Retained earnings % Equity attributable to the owners of the Equipment % Company % Investment in a joint venture % Non-controlling interests % Deferred tax assets % Total equity % Other financial assets % Non-current assets % Borrowings % Deferred tax liabilities % Inventories % Non-current liabilities % Trade receivables % Receivables from affiliates % Borrowings % Other receivables % Trade payables % Current tax asset % Payables to affiliates % Other assets % Cash and cash equivalents % Other liabilities % Assets held for sale % Current tax liabilities % Current assets % Accrued expenses % Liabilities held for sale % Current liabilities % Total assets % Total equity and liabilites % 6
7 CONSOLIDATED BALANCE SHEET Comments The book value of investment purpose property increased to HUF 1.1 billion due to portfolio value appreciation of HUF 91 million and the sale of one flat held for investment. The Group reports its ongoing IT developments underequipment asset line, the amount of which totaled HUF 92 million on June 30, The value of inventories increased by HUF 113 million in Q2 2018, as the capitalized construction costs of ongoing developments exceeded the decrease related to Reviczky`s sold units. The balance of receivables from affiliates is predominantly against MyCity Residence, the development project 50% owned by the Group. Other receivables are mainly attributable to Forest Hill project, where the Group provides HUF 82 million financing to the construction company. Cash and cash equivalents of the Group amounted HUF 1,549 million, out of which HUF 686 million were guarantees related to project loans of Reviczky and Forest Hill developments, Metrohouse acquisition loan, and equity deposits re. fund management activity. 7
8 CONSOLIDATED BALANCE SHEET Comments The consolidated equity of the Group increased to HUF 4.9 billion as the result of quarterly profits and paid dividends. Loans increased to HUF 2.5 billion, out of which HUF 2.0 billion related to development projects. Trade payables increased by HUF 150 million predominantly related to third-party construction costs of project Forest Hill. Other liabilities consist mainly of prepayments and advance payments related to development projects, totaling HUF 559 as of June 30, Accrued expenses increased mainly due to accrued construction costs related to Reviczky Liget Project. 8
9 CONSOLIDATED INCOME STATEMENT Consolidated income statement Variance Variance (data in thhuf, except earnings per share) (not audited) (not audited) thhuf % (not audited) (audited) thhuf % Net sales revenue % % Other operating income % % Disposal Group held for sale income Change in stocks of finished products and work in progress % % Consumables used % % Cost of goods and services sold % % Services purchased % % Personnel expenses % % Depreciation and amortization % % Other operating expenses % % Operating income (EBIT) % % Finance income % % Finance costs % % Share of the losses of a joint venture % % Profit before tax % % Income tax expense % % Profit after tax % % Currency translation difference % % Other comprehensive income % % Total comprehensive income % % attributable to Shareholders of the Company % % Non-controlling interest % % Earnings per share (basic and diluted) % % 9
10 CONSOLIDATED INCOME STATEMENT Comments The increase of the quarterly net sales revenue of the Group, besides the growing volumes on the residential real estate and loan markets and the sale of an investment property, was dominated by the partial handover of the units of Reviczky Liget project. The revenues and profits generated by the development projects will cause significant volatility in the consolidated quarterly revenues and profits of the Group in the coming quarters. The Group achieved significant other operating incomes of HUF 91 million due to the appreciation of investment purpose properties. The Group has sold its smallest development project in Zsinor Street and closed the transaction in the current period. The transaction resulted in income of HUF 52 million and was recognized on Disposal group held for sale income. Change in stocks of finished products and in progress represents the net difference between activated construction service costs related to MyCity development projects and the book value of units sold and handed over. The increase in cost of goods and services sold is related to the sale of Reviczky`s units. Development plots and capitalized construction costs are classified as inventory and booked as cost proportionally at the handover of the units. The significant increase in services purchased in Q is attributable to the construction costs of MyCity developments. Further cost increase was caused by the increased loan volumes and proportional commission costs. Other operating expenses increased due to HUF 15 million receivable write-off in Poland. Currency translation difference represents the FX gains and losses on assets and liabilities of the foreign subsidiaries. 10
11 REVENUE, OPERATING AND AFTER TAX INCOME BY COUNTRY In thousand HUF Hungary Poland Czech Republic Duna House Group 2018Q2 2017Q2 2018Q2 2017Q2 2018Q2 2017Q2 2018Q2 2017Q2 Net sales revenue Operating income Profit after tax In Poland, write-offs related to receivables totaling HUF 15 million have lowered the operating income and profit after tax in Q The Group suffered losses due to write-offs above normal business levels multiple times in the previous quarters and the management has developed action points to minimize future losses. 11
12 MANAGEMENT`S GUIDANCE in thousand HUF Duna House Group w/o MyCity* Duna House Group Reviczky Liget 2018Q2 2018H1 2018Q2 2018H1 Forest Hill Operating income Under construction Profit after tax Under construction Management forecast 2018 FY Based on first and second quarter results, the management of the Group maintains the net profit guidance of HUF 950 1,150 for the core activities, without MyCity development results. The net profit guidance of HUF 680 million for project Reviczky Liget has already been achieved in Q2 by selling 92% of the flats, therefore management expects overperformance from this project. The Group informs the Investors however, that project Forest Hill might be delayed by approx. three months due to overall scarce construction capacities on the market. Construction works are expected to be completed by the end of the year, while realization of profits might be delayed to the financial year The Group forecasted net profits of HUF 1,060 million from project Forest Hill in 2018 by selling 78% of total sellable sqm. The delay will not effect the total profitability of the project, only the timing of its recognition. *=Excluding the real estate development activity of MyCity group, but including the income from the sale of project Zsinor Street. Sales revenue related to the real estate development projects within MyCity group -in accordance with current accounting standards with relevance to the sector- is realized following project closure. Indirect (operational) costs arising before sales revenue realization have a negative impact on profitability. 12
13 CONSOLIDATED CASH FLOW STATEMENT Consolidated cash flow statement Consolidated cash flow statement (not audited) (not audited) (not audited) (not audited) Data in thhuf Cash flows from investing activities Cash flows from operating activities Payments for property, plant and equipment Profit after tax Proceeds from the sale of properties Adjustments: Net cash inflow on sale of subsidiaries Received / paid interests Net cash used in investing activities Depreciation Deferred tax expense Cash flows from financing activities Fair value adjustments of investment properties Proceeds from borrowings Badwill Proceeds from shareholders for capital increase Share of profit of a joint venture Dividends paid Asset held for sale Securities sold 0 0 Received / paid interests Movements of working capital Net cash generated from financing activities Increase in inventories Increase in trade- and other receivables Net increase in cash and cash equivalents Decrease of other assets Cash and cash equivalents at the beginning of the year Increase of trade payables Increase of other short term liabilities Cash and cash equivalents at the end of the year Increase in accruals Net cash generated by operating activities
14 STATEMENT OF CHANGES IN EQUITY Share capital Share premium Foreign currency translation reserve Retained earnings Attributable to the shareholders of the Company Attributable to noncontrolling interests Total equity data in thhuf 31 December Dividend paid Aquisition of Subsidiary Total comprehensive income December Dividend paid Capital increase Total comprehensive income December Dividend paid Total comprehensive income Purchase of treasury shares June
15 Franchise segment


16 DUNA HOUSE HOLDING FRANCHISE BRANDS FRANCHISE SEGMENT HUNGARY, CZECH REPUBLIC HUNGARY POLAND 16
17 FRANCHISE SEGMENT REGIONAL PRESENCE Poland In 2016 the Group acquired Poland s largest real estate and loan intermediary services networks, Metrohouse, and became the top regional player based on the number of agencies. Czech Republic The development of Duna House franchise network has been started in Hungary Duna House Group in Hungary carries out its activities via Duna House and Smart Ingatlan brands. 17
18 Changes in network commission revenues and office numbers FRANCHISE SEGMENT Commission revenues for the entire network* Q2 2017Q3 2017Q4 2018Q1 2018Q2 Hungary Poland Czech Republic *total revenue, realized in connection with property transactions intermediated by Duna House Group s franchise network in total Duna House Group maintained its 20% y-o-y growth in real estate commissions, reaching quarterly record of HUF 2.7 billion in Q Growth was strongest in Hungary, where total commissions reached HUF 2.2 billion (+24.2% y-o-y) and was supported by an estimated market growth of 2.8% in terms of residential real estate transaction volumes, 19.8% increase in average commission per office and 165 offices in Q vs. 159 in Q (+3.8% y-o-y). In Poland, commission revenues were maintained at HUF 0.4 billion (+16.1% y-o-y). The Group has closed 9 underperforming offices and opened 5 new ones in Q2 2018, as a result of which commission per office increased by 21.1% y-o-y Development in network office numbers Hungary Poland Czech Republic 18
19 FRANCHISE SEGMENT SEGMENT LEVEL RESULTS FRANCHISE SEGMENT (data in thhuf) Variance Variance Variance Variance (thhuf) (%) (thhuf) (%) Net sales revenue % % Direct expenses % % Gross profit % % Gross profit margin (%) 90% 89% 0%p 89% 86% 3%p Depreciation and amortization % % Indirect expenses % % Operating income (EBIT) % % EBIT margin (%) 18% 13% 5%p 15% 14% 0%p Revenue of the franchise segment grew by 17% compared to Q The majority of the more, than HUF 50 million growth came from Hungary, due to continued positive market dynamics and 6 additional offices compared to last year. Furthermore, additional revenues derived from the improved services offered to the network (e.g. training programs). As a result of the Czech expansion that was started at the end of 2017, number of offices increased by 2 in the country although their impact is marginal still. The indirect expenses increased to a smaller extent due to management expenses, while to a larger extent due to planned television and radio campaigns, general marketing spending in Hungary and write-offs in Poland totaling HUF 11 million. The costs of improved services (e.g. training programs) are also shown on these cost lines. Overall, the EBIT increased by HUF 26 million compared to Q
20 FRANCHISE SEGMENT HUNGARIAN* PROPERTY MARKET TRENDS BASED ON DH-BAROMETER** Duna House estimation (DH-TB) KSH éves adat The Hungarian residential real estate market shows continuous growth, the number of sale and purchase transactions exceeded 87 thousand during the first 7 months of the year, approx. 5% increase compared to last year. * No similar data available in relation of Poland at present **Due to the lack of up-to-.date official data, the above presented data is based on Duna House own estimates. 20
21 2008 I II III IV I II III IV I II III IV I II III IV I II III IV 2013 I II III IV I II III IV I II III IV I II III IV I II III IV I II I II III IV I II III IV I II III IV I II III IV I II III IV 2013 I II III IV I II III IV I II III IV I II III IV I II III IV I II. FRANCHISE SEGMENT HUNGARIAN* PROPERTY MARKET TRENDS BASED ON DH-BAROMETER DH - COUNTRYWIDE PANEL INDEX DH - COUNTRYWIDE BRICK INDEX The increase of property prices has continued in Q2 2018, resulting in a 147 point nominal value, and a 14 point higher real value than the base data from The nominal value of the Panel price index is 161, while the Brick price index is on 136 points currently the latter already 2 points ahead the base value on real terms. * No similar data available in relation of Poland at present 21
22 Own office operation segment
23 OWN OFFICE OPERATION SEGMENT CHANGES IN NETWORK COMMISSION REVENUES AND OFFICE NUMBERS FOR OWN OFFICES Commission revenues for own offices* Q2 2017Q3 2017Q4 2018Q1 2018Q2 Hungary Poland Czech Republic The commission revenues generated by the own office segment increased to record quarterly levels of HUF 471 million in Q (+2.4% y-o-y). In Hungary, revenues increased by 4.9% y-o-y. The commission revenues of Polish own offices increased by 27.0% y-o-y. The Czech own office revenues decreased significantly compared to the record high revenues in Q2 2017, although the performance is not materially below the levels of the past quarters. * total revenue, realized in connection with property transactions intermediated by Duna House Group s franchise network in total. 35pc Development in own office numbers Hungary Poland Czech Republic 23
24 SEGMENT LEVEL RESULTS OWN OFFICE OPERATION SEGMENT OWN OFFICE SEGMENT (data in thhuf) Variance Variance Variance Variance (thhuf) (%) (thhuf) (%) Net sales revenue % % Direct expenses % % Gross profit % % The own office segment achieved a 2% revenue growth compared to Q with constant gross profit margins. The Hungarian operations managed their third consecutive growth following weak performance in previous quarters. Indirect costs have increased by HUF 9.6 million, mainly due to the write-off of receivables in Poland. The management regards such level of bad debt provisioning as extraordinary. Gross profit margin (%) 42% 42% 0%p 43% 43% -1%p Depreciation and amortization % % Indirect expenses % % Operating income (EBIT) % % EBIT margin (%) 6% 8% -2%p 6% 7% -1%p 24
25 Financial product intermediary services segment
26 FINANCIAL PRODUCT INTERMEDIARY SERVICES SEGMENT CHANGES IN INTERMEDIATED LOAN VOLUMES Development in intermediated loan volumes by quarters The outstanding performance of the loan activities of Duna House Group continued in Q2 2018, reaching intermediated loan volumes of HUF 23.8 billion (+43.5% y-o-y). The Group has doubled the intermediated loan volumes since its IPO in Q Both markets performed strongly and increased by 54.4% in Hungary and 28.8% in Poland from Q Q2 2017Q3 2017Q4 2018Q1 2018Q2 Hungary Poland 26
27 FINANCIAL PRODUCT INTERMEDIARY SERVICES SEGMENT CHANGES IN INTERMEDIATED HOME SAVINGS VOLUME Development in intermediated home savings mhuf volume by quarters The home savings volumes stabilized at HUF 5.9 billion this quarter. Volume levels are significantly dependent on sales promotions provided by the financial institutions and while they were active in Q2 2017, there were no such incentives this year Q2 2017Q3 2017Q4 2018Q1 2018Q2 Hungary 27
28 FINANCIAL PRODUCT INTERMEDIARY SERVICES SEGMENT SEGMENT LEVEL RESULTS (data in thhuf) FINANCIAL PRODUCT INTERMEDIARY SERVICES SEGMENT Variance Variance Variance Variance (thhuf) (%) (thhuf) (%) Net sales revenue % % Direct expenses % % Gross profit % % Gross profit margin (%) 33% 38% -5%p 33% 39% -6%p Depreciation and amortization % % Indirect expenses % % Operating income (EBIT) % % EBIT margin (%) 24% 31% -7%p 23% 29% -7%p The revenues of the financial intermediation segment grew by almost 17%, driven by strong volume growth. Gross profit margin decreased by 5 p.p. due to intrayear impacts. The short term dynamics of the gross profit margin depend on three factors: i) The periodic review of the trailing commission model, that can shift the quarterly gross profit up or downwards, as well having had a positive impact in Q ii) The structure of home saving products bonus schemes that can cause significant volatility among quarters even with same volumes 2018 bonuses are delayed compared to last year. iii) The share of Hungarian/Polish loan volumes, as the Polish operation has narrower gross profit margins, than the Hungarian. According to the management`s opinion, apart from the above independent factors, the segment maintains solid processes and has a stable gross profit margin on annual level. The indirect costs increased somewhat due to increase fees from Q related to the infrastructure used by the segment. 28
29 FINANCIAL PRODUCT INTERMEDIARY SERVICES SEGMENT HUNGARIAN HOUSING LOAN TRENDS The Housing loan portfolio intermediated countrywide and by Duna House in the past periods (mrdhuf) ,4 85, ,5 76, ,2 649,9 67, ,4 52,7 59, , ,1 358, ,1 240, ,7 124,3 150, ,8 13,5 17,6 12,7 14,3 10,6 7,4 10,2 17,4 20,3 27,7 38,8 3,0 3,7 3,6 4,2 4,9 5, Portfolio of the intermediated housing loan out of it by Duna House 29
30 Complementary services segment


31 COMPLEMENTARY SERVICES SEGMENT COMPLEMENTARY SERVICES SEGMENT Complementary services segment at present includes 4 activities: Comprehensive property management services Operation of empty and inhabited premises Property rent out and sales Cleaning, renovation, furnishing Deep knowledge of property market transactions significant additional, upto-date and detailed information and data. Property valuation is carried out by independent professionals throughout the country. Serving both individuals and business entities: Quality services provisioned by Pannónia Általános Biztosító Independent energy certificate preparing professionals Countrywide presence Fund Manager belonging to the Group MNB cert.no: H-EN-III-130/2016 Date of registry: April Currently managed fund: Duna House Fund, openend, public 31
32 COMPLEMENTARY SERVICES SEGMENT DUNA HOUSE HUNGARIAN RESIDENTIAL REAL ESTATE FUND 25% 20% Generated yield from the beginning by Impact Residential Property Investment Fund Net asset value development from the beginning by Impact Residential Property Investment Fund 15% 10% 5% 0% mhuf The 1-year net return of Duna House Fund was 10,0% as of August 24, The net asset value of the fund averaged HUF 2.5 billion in Q and amounted to HUF 2.9 billion as ofaugust 24, The Group has signed distribution agreement with MKB Bank Zrt. (effective from January 2018) with the aim to increase the net asset value of the fund. 32
33 COMPLEMENTARY SERVICES SEGMENT CHANGES IN SEGMENT SALES REVENUE BY QUARTERS th HUF Q2 2017Q3 2017Q4 2018Q1 2018Q2 33
34 SEGMENT LEVEL RESULTS COMPLEMENTARY SERVICES SEGMENT (data in thhuf) COMPLEMENTARY SERVICES SEGMENT Variance Variance Variance Variance (thhuf) (%) (thhuf) (%) The complementary services segment has increased its revenues by HUF 44.8 million (+64% y-o-y). All the activities expanded their operations, while new services (advertisements, data services, private webportal) contributed by an additional HUF 7 million to revenues. Net sales revenue % % Direct expenses % % Gross profit % % Gross profit was also improved by all activities, the new services adding their extra share. Overall, the segment increase EBIT-level profitability significantly, making EBIT of HUF 41 million at 35% margin. Gross profit margin (%) 69% 67% 2%p 69% 65% 4%p Depreciation and amortization % % Indirect expenses % % Operating income (EBIT) % % EBIT margin (%) 35% 14% 21%p 25% 4% 20%p 34
35 Property investments segment
36 SEGMENT LEVEL RESULTS PROPERTY INVESTMENTS SEGMENT PROPERTY INVESTMENT SEGMENT (data in thhuf) Variance Variance Variance Variance (thhuf) (%) (thhuf) (%) Net sales revenue % % Direct expenses % % Gross profit % % Gross profit margin (%) 46% 95% -49%p 45% 91% -46%p The most significant change in the segments financials was caused by the completion of Reviczky Liget development (running under MyCity** brand) and the handover and invoicing of 92% of its residential units. The significant jump both in revenues, gross profit and EBIT are related to this development. The sale of approx. 8% of Reviczky`s flats will be booked in the following quarters. One of our investment purpose properties has been sold. The share of rented properties has increased compared to Q The portfolio is appraised every 6 months, appreciation of HUF 91 million was booked this quarter. The sale of assets and liabilities related to the project in Zsinor Street generated EBIT of HUF 51.9 million in Q Depreciation and amortization % % Indirect expenses % % Operating income (EBIT) % % EBIT margin (%) 67% 81% -14%p 51% 63% -12%p *Profit/loss difference related to revaluation of investment purpose properties and the income from the sale of project Zsinor are indicated among indirect operating costs **Before April 1, 2017, the result of MyCity companies activity was indicated under Share of profit of a joint venture in the consolidated income statement. MyCity group was fully acquired at the end of March
37 PROPERTY INVESTMENTS SEGMENT VOLUME* AND VALUE OF INVESTMENT AND OPERATIVE PROPERTIES 31 December June 2018 (data in thhuf) Number (pcs)** Carrying amount Number (pcs)** Carrying amount Investment purpose property Operational property Total * properties owned by MyCity group not included **number of properties doesn t include the number of parking spaces, storage rooms We appraise investment purpose properties on market value. Market appraisal is carried out every six months, next time on December 31,

38 PROPERTY DEVELOPMENT ACTIVITY PROPERTY INVESTMENTS SEGMENT Duna House Group manages the development of 385 flats in 3 projects under MyCity brand, as follows: Forest Hill Budapest III. district Reviczky Liget Budapest XVIII. district MyCity Residence Budapest III. district Duna House Group s share in Project 100% 100% 50% TOTAL Landsize (m2) Sellable area (m2) Number of Apartements (pcs.) 196* Average Apartements size (m2) 80 54,3 68,8 71,3 Actual status of Projects Construction permit Construction is ongoing Active presale started Handover in progress * 148 flats with building permits at present ** based on average MyCity sales prices 38
39 PROPERTY DEVELOPMENT ACTIVITY PROPERTY INVESTMENTS SEGMENT District 18. Reviczky Liget Project: The occupation permit was obtained in December, 2017, technical take-overs and final settlements are in progress. By June 30, 2018, 92% of the units were sold, the sale of the remaining units is in progress. District 3. Forest Hill: The sale of the 148-unit project are proceeding according to plans. 59% of the units are sold. The construction is delayed by three months due to general scarce capacities in the construction sector, the updated construction deadline is December 31, District 3. MyCity Residence: Construction started end of January, % of the units are sold. Construction deadline is October 30,


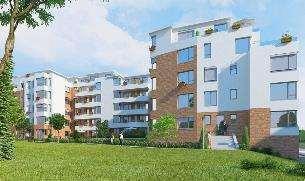
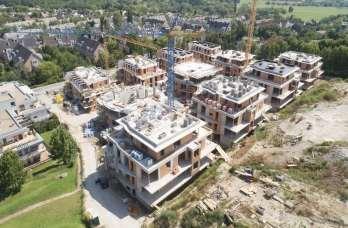

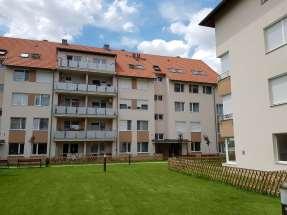
40 ONGOING PROJECTS PROPERTY INVESTMENTS SEGMENT Forest Hill Reviczky Liget MyCity Residence 40
41 Other- and consolidation segment
42 SEGMENT LEVEL RESULTS OTHER- AND CONSOLIDATION SEGMENT OTHERS- AND CONSOLIDATION SEGMENT (data in thhuf) Variance Variance Variance Variance (thhuf) (%) (thhuf) (%) Net sales revenue % % Direct expenses % % Gross profit % % Gross profit margin (%) 92% 36% 56%p 90% 50% 41%p Under the Other and consolidation segment we present the Company`s supporting holding activity performance, as well as yields and expenditures detected in the consolidation process, and the result of consolidation amendments. The Q2 expenses of the holding include primarily BÉT, KELER fees, as well as the proportional part of the accounting and auditing fees in relation of the Group s annual and consolidated reports. The EBIT improvement was driven by the reallocation of management costs of MyCity projects to the property investments segment. Depreciation and amortization % % Indirect expenses % % Operating income (EBIT) % % EBIT margin (%) 10% 11% -2%p 9% 11% -2%p 42
43 Annex 1. Time-series report of the different operational segments for the previous four quarters is attached to the interim report as a separate file, as well as the consolidated balance sheet and interim income statement for the current record date. Duna House Holding Nyrt 2018Q2 negyedeves ENG_Annex1.xlsx 43
44 Disclaimer Undersigned, members of the Board of Directors of DUNA HOUSE HOLDING Plc. (seated H-1016 Budapest, Gellérthegy str 17. Hungary; Company Reg. No ) ; hereinafter Company ) declare that the present quarterly report has been prepared with our best knowledge and conviction, and with the aim to present an extensive look at the financial state of the Company, including statements and estimates referred to for the present. All statements and estimates are based on estimates and forecasts up-dated with our best knowledge and conviction, and in relation to which we shall not be held responsible for publicly up-dating any of the statements or estimates based on any future information, or events. Statements referring to the present bear a certain level of risk and uncertainty in themselves, thus factual results in some cases may significantly differ from forecast-type statements. We believe that the present quarterly interim report presents a trustworthy and real picture regarding the assets, liabilities, financial state, as well as the profit and loss of the Company and joint ventures included in the consolidation. The report also presents a trustworthy picture of the state, development and performance of the Company and joint ventures included in the consolidation. Simultaneously, we shall call attention to the financial statements presented in the interim report not being subject of an accounting audit, and in its present form not being in full compliance with all requirements of the International Financial Reporting Standards implemented by the European Union. The audited annual report of the Company, prepared in compliance with the regulations of International Financial Reporting Standards shall be published following the approval of the ordinary General Meeting of the Company planned to take place in April Budapest, 27 August, Duna House Holding Plc. Board of Directors Represented by: Doron Dymschiz, Board of Directors, President 44


45
2017. Q2 Quarterly report. August 25, 2017
 2017. Q2 Quarterly report August 25, 2017 Table of Contents Executive summary.... 3. Franchise segment..... 5. Own office segment. 12. Financial product intermediary services segment 15. Complementary
DUNA HOUSE GROUP Highlights. March 2018
 DUNA HOUSE GROUP 2017 Highlights March 2018 DISCLAIMER This presentation shall not be considered as an offer or an invitation to tender concerning the purchase, subscription or any other transaction of
DUNA HOUSE HOLDING NYRT.
 CONSOLIDATED BUSINESS REPORT ON THE 2018 H1 ACTIVITIES OF THE GROUP 1. Group profile A Duna House Holding Nyrt. hereinafter referred to as "Company" or "Group" was founded in 2003; its main activity are
DUNA HOUSE GROUP. Investor presentation. 20 March 2018
 DUNA HOUSE GROUP Investor presentation 20 March 2018 WE ARE THE LEADING RESIDENTIAL REAL ESTATE BROKER IN CEE WE SERVE PEOPLE. REAL ESTATE IS OUR PASSION. Real estate brokerage Financial intermediation
DUNA HOUSE HOLDING NYRT. s
 DUNA HOUSE HOLDING NYRT. s CONSOLIDATED BUSINESS REPORT ON THE GROUP S BUSINESS ACTIVITY IN THE FIRST HALF OF 2017 1. Group description Duna House Holding Nyrt. hereinafter: the Company or the Group was
DUNA HOUSE HOLDING NYRT. ACCORDING TO INTERNATIONAL FINANCIAL REPORTING STANDARDS 30 JUNE 2017
 DUNA HOUSE HOLDING NYRT. ACCORDING TO INTERNATIONAL FINANCIAL REPORTING STANDARDS 1 Table of Contents 1.... 4 1. General Information... 9 1.1 Introduction of the Company... 9 1.2 Basis of financial statements...
Profit soars on project completion
 1 CEE Equity Research Hungary Real Estate 28 May 2018 Duna House Recommendation: Buy Target price (12M): HUF 4,751 Hun. Core HUF million 2018 Q1 2017 Q1 Ch (%) Revenues 2,618 1,081 242% EBITDA 790 188
Duna House. Recommendation: Buy Target price (12M): HUF 4,751 (prev: HUF 4,605) Decent Q4 result, profit is expected triple in 2018
: HUF 4,751 (prev: HUF 4,605) Decent Q4 result, profit is expected triple in 2018") 1 CEE Equity Research Hungary Real Estate 01 March 2018 Duna House Recommendation: Buy Target price (12M): HUF 4,751 (prev: HUF 4,605) HUF million 2017 Q4 2016 Q4 Ch (%) Revenues 1,229 1,160 6% EBITDA
1 CEE Equity Research Hungary Real Estate 01 March 2018 Duna House Recommendation: Buy Target price (12M): HUF 4,751 (prev: HUF 4,605) HUF million 2017 Q4 2016 Q4 Ch (%) Revenues 1,229 1,160 6% EBITDA
Remuneration Policy of the Employee Stock Ownership Plan defined by Duna House Holding Public Limited Company
 This document is the English translation of the draft Remuneration Policy of the Employee Stock Ownership Plan of Duna House Holding Plc. This translation has been prepared for courtesy reasons. Only the
CIG Pannónia Life Insurance Plc.
 CIG Pannónia Life Insurance Plc. Quarterly report On the basis of the consolidated financial statements prepared according to the International Financial Reporting Standards adopted by the EU Q4 2018 19
TOTAL ASSETS 417,594, ,719,902
 WABERER'S International NyRt. CONSOLIDATED STATEMENT OF FINANCIAL POSITION data in EUR Description Note FY 2014 FY 2015 restated NON-CURRENT ASSETS Property 8 15,972,261 17,995,891 Construction in progress
CIG Pannónia Life Insurance Plc.
 CIG Pannónia Life Insurance Plc. Quarterly report On the basis of the consolidated financial statements prepared according to the International Financial Reporting Standards adopted by the EU Q2 2018 22
CIG PANNÓNIA GROUP INSURERS
 CIG PANNÓNIA GROUP INSURERS QUARTERLY INFORMATION Q3 2017 21 November 2017 1. Summary The purpose of this information is to publish the data of CIG Pannónia Life Insurance Plc. and CIG Pannónia First Hungarian
CIG PANNÓNIA LIFE INSURANCE PLC.
 CIG PANNÓNIA LIFE INSURANCE PLC. QUARTERLY REPORT ON THE BASIS OF THE CONSOLIDATED FINANCIAL STATEMENTS PREPARED ACCORDING TO THE INTERNATIONAL FINANCIAL REPORTING STANDARDS ADOPTED BY THE EU Q2 2017 22
DUNA HOUSE BAROMETER issue. April The latest property market info from Duna House network
 DUNA HOUSE BAROMETER The latest property market info from Duna House network 82. issue 2018. www.dh.hu PRIVACY POLICY Statistical information and estimates published in the Duna House Barometer are the
State Printing House Plc AGM Proposals. Annual General Meeting of State Printing House Public Company Limited by Shares
 State Printing House Plc AGM Proposals Annual General Meeting of State Printing House Public Company Limited by Shares Budapest, 30 April 2010 1 State Printing House Plc AGM Proposals Agenda 1. Report
duna house Barometer issue July The latest property market info from Duna House network
 duna house Barometer The latest property market info from Duna House network 85. issue 2018. www.dh.hu PRIVACY POLICY Statistical information and estimates published in the Duna House Barometer are the
Unappropriated retained earnings (accumulated deficit) Total unappropriated retained earnings (accumulated deficit) 676, ,797 Total retained ear
 Total unappropriated retained earnings (accumulated deficit) 676, ,797 Total retained ear") Financial Statement Balance Sheet Accounting Title 2014/12/31 2013/12/31 Balance Sheet Assets Current assets Cash and cash equivalents Total cash and cash equivalents 1,183,185 1,177,682 Current bond investment
Financial Statement Balance Sheet Accounting Title 2014/12/31 2013/12/31 Balance Sheet Assets Current assets Cash and cash equivalents Total cash and cash equivalents 1,183,185 1,177,682 Current bond investment
DUNA HOUSE BAROMETER April month. 70. issue THE LATEST PROPERTY MARKET INFO FROM DUNA HOUSE NETWORK
 DUNA HOUSE BAROMETER 70. issue 2017. April month THE LATEST PROPERTY MARKET INFO FROM DUNA HOUSE NETWORK www.dh.hu PRIVACY POLICY Statistical information and estimates published in the Duna House Barometer
INTRODUCTION TO CORPORATE FINANCE
 INTRODUCTION TO CORPORATE FINANCE Lesson 1&2 Castellanza, 20 th &27 th September 2017 SUMMARY Introduction to Introduction to Financial Statement Balance Sheet and Income Statement reclassification 2 CORPORATE
Independent Auditor's Report
 Independent Auditor's Report to the Shareholders of Duna House Holding Nyrt. Opinion We have audited the consolidated financial statements of Duna House Holding Nyrt. and its subsidiaries (the Group )
Accounting Title 2014/3/ /12/ /3/31 Balance Sheet
 Financial Statement Balance Sheet Accounting Title 2014/3/31 2013/12/31 2013/3/31 Balance Sheet Assets Current assets Cash and cash equivalents Total cash and cash equivalents 7,974,989 6,997,862 6,433,466
PANNERGY NYRT. CONSOLIDATED FINANCIAL STATEMENTS 31 DECEMBER 2009
 CONSOLIDATED FINANCIAL STATEMENTS PANNERGY NYRT. CONSOLIDATED FINANCIAL STATEMENTS 31 DECEMBER Dénes Gyimóthy Acting General and Finance Director Budapest, 31 March 2010 TABLE OF CONTENTS CONSOLIDATED
CIG PANNÓNIA GROUP INSURERS
 CIG PANNÓNIA GROUP INSURERS QUARTERLY INFORMATION Q4 2017 20 February 2018 1. Summary The purpose of this information is to publish the data of CIG Pannónia Life Insurance Plc. and CIG Pannónia First Hungarian
Submissions. to RÁBA Automotive Holding Plc. s (RÁBA Plc) Annual General Meeting. to be held on April 6, 2012
 Annual General Meeting. to be held on April 6, 2012") Submissions to RÁBA Automotive Holding Plc. s (RÁBA Plc) Annual General Meeting to be held on April 6, 2012 Győr, March 14, 2012 H-9027 Győr, Martin u. 1. Postal address: H- 9002 Győr, POB 50 Telephone:
Submissions to RÁBA Automotive Holding Plc. s (RÁBA Plc) Annual General Meeting to be held on April 6, 2012 Győr, March 14, 2012 H-9027 Győr, Martin u. 1. Postal address: H- 9002 Győr, POB 50 Telephone:
Quarterly report containing interim financial statements of the Capital Group for Q3 of the financial year of
 Quarterly report containing interim financial statements of the Capital Group for Q3 of the financial year of 2013-2014 covering the period from 01-01-2014 to 31-03-2014 Publication date: 15 May 2014 TABLE
Accounting Title 2016/06/ /12/ /06/30 Balance Sheet
 Back>> Financial Statement Balance Sheet Provided by: FSP Technology Inc. Finacial year: Yearly Unit: NT$ thousand Accounting Title 2016/06/30 2015/12/31 2015/06/30 Balance Sheet Assets Current assets
duna house Barometer issue NOVEMBER The latest property market info from Duna House network
 duna house Barometer The latest property market info from Duna House network 89. issue 2018. NOVEMBER www.dh.hu PRIVACY POLICY Statistical information and estimates published in the Duna House Barometer
duna house Barometer issue May The latest property market info from Duna House network
 duna house Barometer The latest property market info from Duna House network 83. issue 2018. www.dh.hu PRIVACY POLICY Statistical information and estimates published in the Duna House Barometer are the
AAA Auto Group N.V. Interim Statement November 2011
 AAA Auto Group N.V. Interim Statement November 2011 Material events in the second half of 2011 so far and their impact on AAA AUTO Group Among the main factors that had an influence on the financial results
st IFRS Consolidated Financial Statements
 2461 2018 1st IFRS Consolidated Financial Statements Balance Sheet Balance Sheet Unit: NT$ thousand Accounting Title 2018/03/31 2017/12/31 2017/03/31 Assets Current assets Cash and cash equivalents 1,552,283
RESOLUTION FUND ANNUAL REPORT 2014
 A N N UA L RE P ORT RESOLUTION FUND ANNUAL REPORT F U N D F U N D R E S O L U T I O N R E S O L U T I O N A N N U A L A N N U A L R E P O R T R E P O R T 2 0 1 4 2 0 1 4 I NDEPENDEN T AUDI TOR S REP ORT
DUNA HOUSE BAROMETER QI-2. and JUNE. 72. issue THE LATEST PROPERTY MARKET INFO FROM DUNA HOUSE NETWORK
 DUNA HOUSE BAROMETER 72. issue 2017. QI-2. and 2017. JUNE THE LATEST PROPERTY MARKET INFO FROM DUNA HOUSE NETWORK www.dh.hu PRIVACY POLICY Statistical information and estimates published in the Duna House
CIG PANNÓNIA LIFE INSURANCE PLC.
 CIG PANNÓNIA LIFE INSURANCE PLC. QUARTERLY REPORT ON THE BASIS OF THE CONSOLIDATED FINANCIAL STATEMENTS PREPARED ACCORDING TO THE INTERNATIONAL FINANCIAL REPORTING STANDARDS ADOPTED BY THE EU Q1 2016 24
Financial Statement Balance Sheet
 Financial Statement Balance Sheet Provided by: RUENTEX INDUSTRIES LIMITED Finacial year: Yearly Unit: NT$ thousand Accounting Title 2016/12/31 2015/12/31 Balance Sheet Assets Current assets Cash and cash
CIG PANNÓNIA LIFE INSURANCE PLC.
 CIG PANNÓNIA LIFE INSURANCE PLC. QUARTERLY REPORT ON THE BASIS OF THE CONSOLIDATED FINANCIAL STATEMENTS PREPARED ACCORDING TO THE INTERNATIONAL FINANCIAL REPORTING STANDARDS ADOPTED BY THE EU Q2 2015 18
Total cash and cash equivalents 4,256,691 4,114,055
 Historical Financial Statement Balance Sheet Provided by: FSP Technology Inc. Finacial year: Yearly Accounting Title 2014/12/31 2013/12/31 Balance Sheet Assets Current assets Cash and cash equivalents
ARCUS Spółka Akcyjna
 ARCUS Spółka Akcyjna www.arcus.pl Consolidated interim report of Arcus S.A. 1 January 2016-31 March 2016 prepared in accordance with the International Financial Reporting Standards Table of contents 1
Accounting Title 2017/06/ /12/ /06/30 Balance Sheet
 Financial Statement Balance Sheet Provided by: FSP Technology Inc. Finacial year: Yearly Accounting Title 2017/06/30 2016/12/31 2016/06/30 Balance Sheet Assets Current assets Cash and cash equivalents
[1.1] [Takko Unaudited Interim Report FY Q2.pdf] [Page 1 of 42] UNAUDITED INTERIM REPORT
![[1.1] [Takko Unaudited Interim Report FY Q2.pdf] [Page 1 of 42] UNAUDITED INTERIM REPORT](/thumbs/75/72014162.jpg "[1.1] [Takko Unaudited Interim Report FY Q2.pdf] [Page 1 of 42] UNAUDITED INTERIM REPORT") [1.1] [Takko Unaudited Interim Report FY2017-18 Q2.pdf] [Page 1 of 42] UNAUDITED INTERIM REPORT Q2 2017 / 2018 Overview & figures in EUR k 1 May 2017 1 May 2016 1 Feb 2017 1 Feb 2016 304,424 296,923 545,405
[1.1] [Takko Unaudited Interim Report FY2017-18 Q2.pdf] [Page 1 of 42] UNAUDITED INTERIM REPORT Q2 2017 / 2018 Overview & figures in EUR k 1 May 2017 1 May 2016 1 Feb 2017 1 Feb 2016 304,424 296,923 545,405
GRAPHISOFT PARK SE. Half-year Report First Half August 8, 2011
 GRAPHISOFT PARK SE Half-year Report First Half 2011 August 8, 2011 BUSINESS REPORT FIRST HALF 2011 Financial highlights IFRS, consolidated, thousand EUR 3 months ended 6 months ended June 30, June 30,
NOI MARGIN FFO EPRA NAV NET DEBT NET LTV 779M +27%
 2015 RESULTS GTC EXECUTES ITS GROWTH STRATEGY NOI MARGIN FFO EPRA NAV NET DEBT NET LTV 75% 38M 779M 522M 39% +100bps +38% +27% -25% -146bps EXECUTION OF THE GROWTH STRATEGY Restructuring and repositioning
Quarterly report containing the interim financial statements of the Group for Q3 of the financial year of
 Quarterly report containing the interim financial statements of the Group for Q3 of the financial year of 2016-2017 covering the period from 01-07-2016 to 31-03-2017 Publication date: 16 May 2017 TABLE
PANNÓNIA GROUP INSURERS
 PANNÓNIA GROUP INSURERS QUARTERLY INFORMATION Q2 2017 22 August 2017 1. Summary The purpose of this information is to publish the data of CIG Pannónia Life Insurance Plc., CIG Pannónia First Hungarian
Self Storage Group ASA Third quarter November 2017
 Self Storage Group ASA Third quarter 2017 16 November 2017 1 GROUP HIGHLIGHTS THIRD QUARTER 2017 Revenues in Q3 2017 NOK 55.6 million, up from NOK 51.4 million in Q2 2017 Adjusted EBITDA in Q3 2017 of
Accounting Title 2016/3/ /12/ /3/31 Balance Sheet
 Financial Statement Balance Sheet Accounting Title 2016/3/31 2015/12/31 2015/3/31 Balance Sheet Assets Current assets Cash and cash equivalents Total cash and cash equivalents 626,334 624,357 540,732 Current
5. Consolidated Financial Statements (1) Consolidated Balance Sheets
 Consolidated Balance Sheets") 5. Consolidated Financial Statements (1) Consolidated Balance Sheets March 31, 2008 Assets Current assets Cash and deposits 84,224 89,218 Notes and accounts receivable-trade 230,156 234,862 Lease receivables
5. Consolidated Financial Statements (1) Consolidated Balance Sheets March 31, 2008 Assets Current assets Cash and deposits 84,224 89,218 Notes and accounts receivable-trade 230,156 234,862 Lease receivables
Continuing difficult trading conditions in Hungary offset by resilient profit contribution by subsidiaries.
 Danubius Hotels Plc, today announced its full year and fourth quarter preliminary, unaudited results. This report contains consolidated financial statements for the period ended 31 December as prepared
th IFRS Consolidated Financial Statements
 2461 2017 4th IFRS Consolidated Financial Statements Balance Sheet Balance Sheet Unit: NT$ thousand Accounting Title 2017/12/31 2016/12/31 Assets Current assets Cash and cash equivalents Total cash and
Fraport AG Frankfurt Airport Services Worldwide Consolidated Income Statement * million
 Consolidated Income Statement * 2007 2008 Change in % Revenue 2.329,0 2.101,6-9,8 Change in work-in-process 0,5 0,4-20,0 Other internal work capitalized 24,6 33,8 37,4 Other operating income 71,7 66,1-7,8
M K B B a n k Z r t. TERVEZET Unconsolidated Interim Report
 M K B B a n k Z r t. 10 011 922 641 911 400 Statistic code TERVEZET Unconsolidated Interim Report Prepared under HUNGARIAN ACCOUNTING RULES Budapest 29th August, 2011 June 30, 2011 1/12 The Board of Directors
Gulliver International Co., Ltd.
 Gulliver International Co., Ltd. Consolidated Results Second Quarter of the Fiscal Year Ending February 28, 2011 (Six-month period ended August 31, 2010) This document has been translated from the original
 Financial Statement Balance Sheet Page 1 of 5 Financial Statement Balance Sheet Accounting Title 2013/09/30 2012/12/31 2012/09/30 2011/12/31 Balance Sheet Assets Current assets Cash and cash equivalents
An income statement (for the group), together with a comparative statement for the corresponding period of the immediately preceding financial year
, together with a comparative statement for the corresponding period of the immediately preceding financial year") VENTURE CORPORATION LIMITED Full Year Financial Statements And Dividend Announcement The Board of Directors of Venture Corporation Limited wishes to make the following announcement: Fourth Quarter and
VENTURE CORPORATION LIMITED Full Year Financial Statements And Dividend Announcement The Board of Directors of Venture Corporation Limited wishes to make the following announcement: Fourth Quarter and
CIG PANNÓNIA LIFE INSURANCE PLC. QUARTERLY INFORMATION Q3 2011
 CIG PANNÓNIA LIFE INSURANCE PLC. QUARTERLY INFORMATION Q3 2011 16 th November 2011 1. Summary CIG Pannónia Life Insurance Plc. (hereinafter: Issuer) publishes its quarterly information on this day. The
CONSOLIDATED BALANCE SHEET
 CONSOLIDATED BALANCE SHEET December 31, 2017 A S S E T S CURRENT ASSETS: Cash and time deposits 31,380 Accounts receivable trade 98,188 Inventories 1,096 Short-term loans receivable 46,282 Deferred tax
ZAKŁADY AUTOMATYKI POLNA Spółka Akcyjna
 ZAKŁADY AUTOMATYKI POLNA Spółka Akcyjna Condensed unitary statement for the periods of the 3 rd quarter finished on 30 th September 2011 and 30 th September 2010 prepared in compliance with International
PEGAS NONWOVENS SA. First nine months of 2010 unaudited consolidated financial results
 PEGAS NONWOVENS SA First nine months of 2010 unaudited consolidated financial results November 25, 2010 PEGAS NONWOVENS SA announces its unaudited consolidated financial results for the first nine months
ILLUSTRATION 12-1 TYPES OF INTANGIBLE ASSETS
 ILLUSTRATION 12-1 TYPES OF INTANGIBLE ASSETS INTANGIBLE ASSETS Identifiable Intangible Assets (Rights Type) Externally Acquired Internally Developed Financial Statement Treatment Unidentifiable Intangible
Hasbro First Quarter 2013 Earnings April 22, 2013
 Hasbro First Quarter 2013 Earnings April 22, 2013 Safe Harbor FORWARD-LOOKING STATEMENTS: This presentation contains forward-looking statements concerning management's expectations, goals, objectives and
Gulliver International Co., Ltd.
 Gulliver International Co., Ltd. Consolidated Results Fiscal 2005 (March 1, 2005 to February 28, 2006) This document is a translation of sections of the original Japanese as a guide for non-japanese investors.
Financial review Refresco Financial review 2017
 Financial review 2017 Financial review 2017 Financial review 2017 1 69 Consolidated income statement For the year ended December 31, 2017 (x 1 million euro) Note December 31, 2017 December 31, 2016 Revenue
Consolidated Financial Statements (1) Consolidated Balance Sheet (Unit: Million yen) Previous Consolidated Fiscal Year (Ended March 31, 2011)
 Consolidated Balance Sheet (Unit: Million yen) Previous Consolidated Fiscal Year (Ended March 31, 2011)") Consolidated Financial Statements (1) Consolidated Balance Sheet (Ended (Ended Assets Current assets Cash and deposits 27,057 34,440 Notes and accounts receivable-trade 4,538 3,595 Securities 3,654 11,967
Consolidated Financial Statements (1) Consolidated Balance Sheet (Ended (Ended Assets Current assets Cash and deposits 27,057 34,440 Notes and accounts receivable-trade 4,538 3,595 Securities 3,654 11,967
ANNUAL REPORT IMPEXMETAL S.A.
 ANNUAL REPORT IMPEXMETAL S.A. FOR 2016 IMPEXMET POLISH FINANCIAL SUPERVISION AUTHORITY Annual report R 2016 (according to 82 para. 1 of the Minister of Finance Regulation of 19 February 2009 - Journal
Balance Sheet (Thousands of yen)
") Balance Sheet As of As of Assets Current assets Cash and deposits 1,948,490 2,364,338 Notes and accounts receivable - trade 877,408 854,811 Electronically recorded monetary claims - operating 3,328 11,512
Balance Sheet As of As of Assets Current assets Cash and deposits 1,948,490 2,364,338 Notes and accounts receivable - trade 877,408 854,811 Electronically recorded monetary claims - operating 3,328 11,512
ARCUS Spółka Akcyjna
 ARCUS Spółka Akcyjna www.arcus.pl Consolidated financial statement of Arcus S.A. Capital Group for the financial 31 December 2015 Warsaw, 21 March 2016 1 1 Data regarding the annual financial statement
CIG PANNONIA LIFE INSURANCE PLC.
 CIG PANNONIA LIFE INSURANCE PLC. CONSOLIDATED FINANCIAL STATEMENTS AND CONSOLIDATED BUSINESS REPORT FOR THE YEAR 2013, PREPARED ACCORDING TO THE INTERNATIONAL FINANCIAL REPORTING STANDARDS ACCEPTED BY
Thai Beverage Public Company Limited
 Thai Beverage Public Company Limited Financial Statements For The Three-Month Period Ended 31 December 2018. PART I INFORMATION REQUIRED FOR THE THREE-MONTH PERIOD ENDED 31 DECEMBER (Q1) ANNOUNCEMENTS.
FINAL RESULTS ANNOUNCEMENT FOR THE YEAR ENDED 31 MARCH 2010 FINANCIAL HIGHLIGHTS. Own stores number reached 764, increased by 11.
 Hong Kong Exchanges and Clearing Limited and The Stock Exchange of Hong Kong Limited take no responsibility for the contents of this announcement, make no representation as to its accuracy or completeness
FLASH REPORT. Q3 GDP was revised upward to 3.9% YoY, thanks to unexpectedly strong market services growth. 6 December 2017
 FLASH REPORT 6 December 2017 Q3 GDP was revised upward to 3.9% YoY, thanks to unexpectedly strong market services growth Quite unusually, Hungary's KSH revised upward the GDP data for the third quarter
Quarterly report containing the interim financial statements of the Capital Group for Q3 of the financial year of
 Quarterly report containing the interim financial statements of the Capital Group for Q3 of the financial year of 2015-2016 covering a period from 01 July 2015 to 31 March 2016 Publication date: 16 May
ANY Security Printing Company PLC Audited Consolidated Financial Statements December 31, 2012
 ANY Security Printing Company Public Limited Company by Shares Independent Auditors Report and Consolidated Financial Statements for the year ended ANY Security Printing Company Public Limited Company
PEGAS NONWOVENS a.s. FIRST QUARTER RESULTS 2018
 PEGAS NONWOVENS a.s. FIRST QUARTER RESULTS 2018 17 May 2018 First Quarter of 2018 Unaudited Consolidated Financial Results PEGAS NONWOVENS a.s. announces its unaudited consolidated financial results for
CONSOLIDATED BALANCE SHEET
 CONSOLIDATED BALANCE SHEET December 31, 2018 A S S E T S CURRENT ASSETS: Cash and time deposits 51,215 Accounts receivable-trade 95,065 Inventories 5,405 Short-term loans receivable 43,021 Deferred tax
Total cash and cash equivalents 4,022,336 3,849,352 3,742,419
 Historical Financial Statement Balance Sheet rovided by: FSP Technology Inc. inacial year: Yearly nit: NT$ thousand Accounting Title 2016/03/31 2015/12/31 2015/03/31 Balance Sheet Assets Current assets
LUNDIN MINING CORPORATION CONSOLIDATED BALANCE SHEETS December 31, December 31, (Unaudited - in thousands of US dollars)
") CONSOLIDATED BALANCE SHEETS December 31, December 31, 2012 2011 ASSETS Current Cash and cash equivalents $ 275,104 $ 265,400 Trade and other receivables 110,808 120,066 Income taxes receivable 6,494 6,869
CONSOLIDATED BALANCE SHEETS December 31, December 31, 2012 2011 ASSETS Current Cash and cash equivalents $ 275,104 $ 265,400 Trade and other receivables 110,808 120,066 Income taxes receivable 6,494 6,869
CI GAMES GROUP CONSOLIDATED QUARTERLY REPORT Q3 2013
 CI GAMES GROUP Q3 2013 Warsaw, November 14, 2013 2 CONTENTS I. CONSOLIDATED FINANCIAL DATA - CI GAMES GROUP 4 II. SEPARATE FINANCIAL DATA - CI GAMES S.A. 13 III. FINANCIAL HIGHLIGHTS 22 IV. NOTES TO THE
Consolidated Financial Statements and Primary Notes
 Consolidated Financial Statements and Primary Notes (1) Consolidated Balance Sheet (As of March 31, 2017) (As of March 31, 2018) Assets Current assets Cash and deposits 344,093 357,027 Notes and accounts
POU CHEN CORPORATION AND SUBSIDIARIES
 CONSOLIDATED BALANCE SHEETS March 31, 2013 December 31, 2012 March 31, 2012 January 1, 2012 ASSETS Amount % Amount % Amount % Amount % CURRENT ASSETS Cash and cash equivalents (Notes 4 and 6) $ 29,346,249
Accounting Title 2013/12/ /12/ /1/1 Balance Sheet
 Financial Statement Balance Sheet Accounting Title 2013/12/31 2012/12/31 2012/1/1 Balance Sheet Assets Current assets Cash and cash equivalents Total cash and cash equivalents 471,574 507,692 394,913 Notes
For personal use only
 PRELIMINARY FINAL REPORT RULE 4.3A APPENDIX 4E APN News & Media Limited ABN 95 008 637 643 Preliminary final report Full year ended 31 December Results for Announcement to the Market As reported Revenue
Interim Report Q Self Storage Group ASA
 Interim Report Q2 2018 Self Storage Group ASA Contents Highlights 2 Key Figures 2 Subsequent events 2 Financial development 3 Strategy 6 Corporate developments 8 Risks and uncertainty factors 8 Outlook
FINANCING THE BUDGET AND THE CENTRAL GOVERNMENT DEBT IN
 FINANCING THE BUDGET AND THE CENTRAL GOVERNMENT DEBT IN 2018 19.12.2017 MAIN TOPICS 1. FINANCING OF THE CENTRAL GOVERNMENT IN 2017 2. MAIN CHARACTERISTICS OF THE FINANCING PLAN FOR 2018 FINANCING IN 2017
Financial Statement Balance Sheet
 Financial Statement Balance Sheet Page 1 of 1 Financial Statement Balance Sheet Accounting Title 2014/09/30 2013/12/31 2013/09/30 Balance Sheet Assets Current assets Cash and cash equivalents Total cash
Consolidated Financial Statements (Japanese Accounting Standard) November 10, 2017 (For the six months ended September 30, 2017)
 November 10, 2017 (For the six months ended September 30, 2017)") Consolidated Financial Statements (Japanese Accounting Standard) November 10, 2017 (For the six months ended September 30, 2017) Name of Company Listed: Leopalace21 Corporation Stock Listing: Tokyo Stock
Consolidated Financial Statements (Japanese Accounting Standard) November 10, 2017 (For the six months ended September 30, 2017) Name of Company Listed: Leopalace21 Corporation Stock Listing: Tokyo Stock
Swiss GAAP FER 2017 Checklist for application and disclosure. Audit & Assurance
 Swiss GAAP FER 2017 Checklist for application and disclosure Audit & Assurance Foreword This checklist shall support in applying the Swiss GAAP FER standards as well as in reviewing the completeness of
REPORT ON THE ACTIVITIES OF KOMPUTRONIK S.A. CAPITAL GROUP
 Komputronik REPORT ON THE ACTIVITIES OF KOMPUTRONIK S.A. CAPITAL GROUP for the period from 1st April 2014 to 31st March 2015 Poznan, 19th June 2015. Komputronik www.komputronik.com Poznan, 19th June 2015.
Swiss GAAP FER 2017 Checklist for application and disclosure. Audit & Assurance
 Swiss GAAP FER 2017 Checklist for application and disclosure Audit & Assurance Foreword This checklist shall support in applying the Swiss GAAP FER standards as well as in reviewing the completeness of
HOTEL ROYAL LIMITED (Incorporated in the Republic of Singapore) (Co. Reg. No G)
 (Co. Reg. No G)") HOTEL ROYAL LIMITED (Incorporated in the Republic of Singapore) (Co. Reg. No. 196800298G) 1 UNAUDITED RESULTS FOR THE FIRST QUARTER ENDED 31 MARCH 2014 The Directors of Hotel Royal Limited (the Company
HOTEL ROYAL LIMITED (Incorporated in the Republic of Singapore) (Co. Reg. No. 196800298G) 1 UNAUDITED RESULTS FOR THE FIRST QUARTER ENDED 31 MARCH 2014 The Directors of Hotel Royal Limited (the Company
D R A F T T E R M S O F T R A N S F O R M A T I O N
 D R A F T T E R M S O F T R A N S F O R M A T I O N The draft terms of transformation contains the draft of the merger by acquisition on the one hand of CIG Pannonia Life Insurance Plc. (registered seat:
Condensed Consolidated interim financial statements
 First Quarter Panalpina First Quarter panalpina.com 2 Condensed Consolidated interim financial statements CONTENTS Consolidated Income Statement 3 Consolidated Statement of Comprehensive Income 4 Consolidated
Quarterly Report of the Dino Polska S.A. Group for Q3 2017
 Quarterly Report of the Dino Polska S.A. Group for Q3 2017 Dino Polska Spółka Akcyjna ( Dino, Company, Parent Entity ) Joint stock company with its registered office in Krotoszyn at ul. Ostrowska 122,
Consolidated Financial Results (Japanese GAAP) FY2017 ending March 2018 TOPCON CORPORATION Release Date: October 27, 2017
 FY2017 ending March 2018 TOPCON CORPORATION Release Date: October 27, 2017") Consolidated Financial Results (Japanese GAAP) ending March 2018 TOPCON CORPORATION Release Date: October 27, 2017 1. Summary of Second Quarter Results for ending March 2018 (April 1, 2017 - September
Consolidated Financial Results (Japanese GAAP) ending March 2018 TOPCON CORPORATION Release Date: October 27, 2017 1. Summary of Second Quarter Results for ending March 2018 (April 1, 2017 - September
DUNA HOUSE BAROMETER. 1st half of the year 2015 The month of June Latest data of the Hungarian real estate market every month.
 BAROMETER 49th issue 1st half of the year 2015 The month of June 2015 Latest data of the Hungarian real estate market every month. www.dh.hu Contents: Executive Summary page 3 Transaction number and Demand
Orco Property Group - Q financial information
 Press Release 24 November 2011 Orco Property Group - Q3 2011 financial information Third Quarter financial highlights (in EUR Million): Quarter on quarter revenues at 43.8 compared to 40.4 Year on year
Herford Interim Report Q1 2014/15
 AHLERS AG Herford Interim Report Q1 2014/15 AHLERS AG INTERIM REPORT Q1 2014/15 (December 1, 2014 to February 28, 2015) BUSINESS PERFORMANCE IN THE FIRST THREE MONTHS OF FISCAL 2014/15 -- 7 percent decline
TVL FINANCE PLC PERIOD ENDED 28 MARCH 2018 REPORT TO NOTEHOLDERS 232,000, % SENIOR SECURED NOTES DUE 2023
 TVL FINANCE PLC PERIOD ENDED 28 MARCH 2018 REPORT TO NOTEHOLDERS 232,000,000 8.5% SENIOR SECURED NOTES DUE 2023 195,000,000 SENIOR SECURED FLOATING RATE NOTES DUE 2023 (the Notes ) CONTENTS Highlights
en-japan inc. 4th Quarter FY March 2012 Earnings Announcement [Japan GAAP] (Consolidated) February 9, 2012
![en-japan inc. 4th Quarter FY March 2012 Earnings Announcement [Japan GAAP] (Consolidated) February 9, 2012](/thumbs/89/98220506.jpg "en-japan inc. 4th Quarter FY March 2012 Earnings Announcement [Japan GAAP] (Consolidated) February 9, 2012") en-japan inc. 4th Quarter FY March 2012 Earnings Announcement [Japan GAAP] (Consolidated) February 9, 2012 Company Name en-japan inc. Listing Exchanges Osaka Securities Exchange (Jasdaq Market) Stock Code
en-japan inc. 4th Quarter FY March 2012 Earnings Announcement [Japan GAAP] (Consolidated) February 9, 2012 Company Name en-japan inc. Listing Exchanges Osaka Securities Exchange (Jasdaq Market) Stock Code
GTC AUGMENTS ACCOMPLISHMENTS THROUGH ACQUISITIONS, DEVELOPMENTS AND ACTIVE ASSET MANAGEMENT 797M
 Q1 2016 RESULTS GTC AUGMENTS ACCOMPLISHMENTS THROUGH ACQUISITIONS, DEVELOPMENTS AND ACTIVE ASSET MANAGEMENT NOI MARGIN FFO EPRA NAV NET DEBT NET LTV 76% 11M 797M 600M 43% +200bps +27% +2% +15% +380bps
Interim consolidated statement of financial position as of 30 September 2018 (Amounts expressed in Turkish Lira ( TL ) unless otherwise indicated.
 unless otherwise indicated.") Interim consolidated statement of financial position as of 30 September ASSETS Unaudited Audited Notes 30 September 31 December Current assets: Cash and cash equivalents 4 531.105.722 227.960.860 Financial
Interim consolidated statement of financial position as of 30 September ASSETS Unaudited Audited Notes 30 September 31 December Current assets: Cash and cash equivalents 4 531.105.722 227.960.860 Financial