2017. Q2 Quarterly report. August 25, 2017
|
|
|
- Prosper Bryant
- 5 years ago
- Views:
Transcription


1 2017. Q2 Quarterly report August 25, 2017
2 Table of Contents Executive summary Franchise segment Own office segment. 12. Financial product intermediary services segment 15. Complementary services segment. 20. Property investments segment and MyCity projects 25. Other- and consolidation segment Consolidated financial statements Revenue, operating income and profit after tax by countries Consolidated operating income and profit after tax without MyCity 39. Annex 1.: time-series report of operational segments 40. Declaration. 41.
3 EXECUTIVE SUMMARY months The Group has closed Q2 presenting impressive results, with the three-months operating income (EBIT) adding up to HUF 253 Million, and a profit after tax (PAT) reaching HUF 288 Million. The Management increases its profit forecast of HUF Million with relevance for the full year (calculated without MyCity) published on March 5, 2017 to HUF Million. The named profit has reached HUF 535 Million by the end of the first six months. Operating income is nearly HUF 7 Million higher than the Q2 result of the previous year. Related to the core activity income, the following non-recurring items explain further HUF 50 Million when compared to Q2 of the previous year: Decrease of the investment purpose property portfolio which had begun in Q2 2016, as well as the focus shift to property development activity within MyCity, resulted in a nearly HUF 115 Million lower profit in the current Q as one year earlier. Profit of property development projects can be realized only following the closure of the different projects. Beginning with Q2 2017, MyCity group has fully been consolidated, decreasing the operating income by HUF 16 Million in total. Activity in the Czech Republic which, during the comparative period, has not yet been part of the Holding- presented a HUF 9 Million loss. The impacts of the above were decreased as a result of a HUF 90 Million non-recurring expense volume, which appeared in Q related to the IPO of the Holding s shares, the acquisition of the Polish Metrohouse group and SMART network. Overall, it can be stated that the Group s core activity in Hungary and Poland on EBIT level has improved by nearly HUF 57 Million when compared to Q2 of the previous year. 3
4 EXECUTIVE SUMMARY months Improvement of the operating income is most outstanding in the financial intermediary services segment, where the HUF 82 Million of Q2 last year increased by nearly 90%, reaching a HUF 155 Million result. The main reason behind the growth is the volume growth in the intermediated loans (and home savings accounts in Hungary), as well as the operation efficiency improvement in the Polish Metrofinance. Financial results of Metrohouse group continued to improve. In Q2 2017, the activity in Poland has reached the turn-around point, and became profitable for the first time. The consolidated operating income and profit after tax added up to HUF 22 Million. The current state of MyCity is regarded as positive by the Management. By increasing the sales prices, growing costs in the construction field of the property development market were managed to a large extent in every project. The project with the shortest deadline, the Revitzky Liget is advancing according to schedule and the planned delivery looks promising for Q4. At the time of publishing the present report, the 1-year return of the Impact Residential Property Investment Fund is net 9.2%, which is the highest yearly result among all property funds in Hungary. The net asset value of Impact Residential Property Investment Fund has risen to HUF 1.6 Billion by June 30, 2017, and by the time of publishing the present Report it reaches HUF 1.83 Billion. Due to the outstanding performance, the Management is positive that the Fund s net asset value has the potential to produce further growth. Despite the significant improvement in the core activity performance, profit after tax fell back from the HUF 648 Million of Q to HUF 288 Million. The reason behind is the fact that during the comparative period a one-time HUF 481 Million profit was accounted for in the MyCity joint venture, in connection with the increase in value of the plots of lands classified as investment properties prior to beginning the development activity. 4
5 Franchise segment


6 DUNA HOUSE HOLDING FRANCHISE BRANDS FRANCHISE SEGMENT HUNGARY, CZECH REPUBLIC HUNGARY POLAND 6
7 FRANCHISE SEGMENT REGIONAL PRESENCE Poland In 2016 the Holding acquired Poland s largest real estate and loan intermediary services networks, Metrohouse, and became the top regional player based on the number of agencies. Czech Republic One significant self-owned agency in Prague, the Czech Republic, operating under Duna House brand. Hungary Duna House Holding in Hungary carries out its activities via Duna House and Smart Ingatlan brands. 7
8 Changes in network commission revenues and office numbers FRANCHISE SEGMENT m HUF Commission revenues in the entire network* Q2 2016Q3 2016Q4 2017Q1 2017Q2 Hungary Poland Czech Republic *the total amount of commission revenue that was realized on all intermediated real estate transactions in the franchise networks of Duna House pcs Development in network office numbers Magyarország Lengyelország Csehország The Holding s Hungary-based, DUNA HOUSE and SMART network related performance in Q exceeded Q1 by 9.7%, and presented higher commission revenues than the comparative period of the year before by 0.6%. The growth of commission revenues was accompanied by the significant expansion of the number of agencies, reaching 159 in total with the opening of 5 new branches by the end of the quarter. Commission related income in the Polish METROHOUSE network decreased by 7.3% when compared to the previous quarter, and by 23% in comparison with the same period last year. Decrease in commission revenues is mainly the result of a transparency trend following the introduction of tighter operation rules and higher franchisee fees following the acquisition of the METROHOUSE network. As a result of higher franchise fees, the negative effect on revenue is much less significant than suggested by the graph. According to the Management, volume of the commission revenues for the METROHOUSE network is likely to begin to grow in the forthcoming quarters. Although the impact of the above-mentioned transparency trend was still detected in the second quarter, due to the new branch openings, the total number of agencies in the METROHOUSE network reached 73 by the end of the first six months. The difference between the commission income of Q2 and numbers presented on May 26, 2017 as estimates, is negligible 8
9 FRANCHISE SEGMENT SEGMENT LEVEL RESULTS FRANCHISE SEGMENT (data in thhuf) Variance Variance Variance Variance (thhuf) (%) (thhuf) (%) Net sales revenue % % Direct expenses % % Gross profit % % Gross profit margin (%) 89% 86% 86% 86% Depreciation and impairment % % Indirect expenses % % Operating income (EBIT) % % Although the total commission revenue of the networks was similar to the comparative period (see page 8), the revenue realized in the segment was somewhat lower. One of the reasons is that there is no franchise fee connected to the commission turnover in the Czech network. (At present, there is 1 own office in operation in the Czech Republic.) The 3% improvement of the contribution margin accounted for a nearly HUF 3.7 Million extra margin. The growth presented on the depreciation line was accounted primarily for default interest claim on the Polish market, in relation to which there is significant uncertainty still, its effect on the operation profit in total is neutral. Decrease of indirect costs is primarily due to the lack of non-recurring expenses from the previous year (Metrohouse acquisition, IPO). By the improvement of the contribution margin, and the decrease of indirect operational costs, a HUF 35 Million higher operation profit has been realized in 2017 than in the year before. EBIT margin (%) 13% 2% -356% 14% 10% 43% 9
10 FRANCHISE SEGMENT HUNGARIAN* PROPERTY MARKET TRENDS BASED ON DH-BAROMETER** pcs Transactions between private individuals (Central Bureau of Statistics) Duna House estimation (DH-TB) pcs January February March April May June According to Management estimates, in Q1 of 2017 the decrease in residential market transaction numbers in Hungary has come to a stop and begun to grow. At this point, no factful estimates can be presented in relation of the persistency of the trend, but according to the Management, the transaction volume for the full year will not fall behind last year s level. 0 * No similar data available in relation of Poland at present ** Due to the lack of up-to-.date official data, the above presented data is based on Duna House own estimates... 10
11 FRANCHISE SEGMENT HUNGARIAN* PROPERTY MARKET TRENDS BASED ON DH-BAROMETER DH - COUNTRYWIDE PANEL INDEX DH COUNTRYWIDE BRICK INDEX I III I III I III I III I III I III I III I III I III I I III I III I III I III I III I III I III I III I III I. Profitability of Duna House activity in Hungary, beyond transaction volumes, is also highly affected by price level changes. * No similar data available in relation of Poland at present 11

12 Own office operation segment
13 OWN OFFICE OPERATION SEGMENT Changes in network commission revenues and office numbers for own offices mhuf Commission revenues for own offices* Q2 2016Q3 2016Q4 2017Q1 2017Q2 Hungary Poland Czech Republic *represent the total amount of commission revenue that was realized on all intermediated real estate transactions in the own offices of Duna House pcs 40 Development in own office numbers Hungary Poland Czech Republic Q2 performance of the own office segment has broken a new record. The commission revenue of own offices exceeded the previous quarter by 12%, and was 18% higher than a year before. (The latter is taken excluding the Czech office, the acquisition of which took place in September 2016 only). Performance of the Hungarian own office segment has slightly been poorer in the given quarter. Commission revenues ended up being 4% lower than in the previous quarter, and 14% less than in Q2 of Volume of the realized commission in the Polish own offices was 8% behind last quarter s, but still 9% above the volume in the same period of Profitability of the METROHOUSE own office segment may significantly be influenced by the tendencies in the turnover data, as well as the growth of contribution margins. The Czech own office segment has closed Q2 with outstanding result, presenting 370% more realized commission revenue than in the first Q of Although the Czech office has not yet been part of the Holding in Q2 2016, according to the Management, this year s turnover may significantly exceed last year s keeping in mind that due to the smaller size of the activity, the distribution of commission revenues among the quarters is responsible for major influence on commission revenues. The difference between the commission income of own offices in Q2 and numbers presented on May 26, 2017 as estimates, is negligible 13
14 SEGMENT LEVEL RESULTS OWN OFFICE OPERATION SEGMENT (data in thhuf) OWN OFFICE SEGMENT Variance Variance Variance Variance (thhuf) (%) (thhuf) (%) In the own office segment, a nearly HUF 100 Million higher revenue was realized than in Q The growth is mainly the result of acquisition (+ HUF 95 Million), as the Czech own office activity has become part of the Group in September Net sales revenue % % Direct expenses % % Gross profit % % Gross profit margin (%) 42% 46% 43% 53% Depreciation and impairment % % Indirect expenses % % Moreover, the commission revenue growth arising from the intermediation of newly-built properties in the own office segment was able to compensate for the lower sales results of the intermediation of used properties, which were lower than in the previous period. The 4% fallback of the contribution margin, as well as the increase of indirect operation costs is mainly connected to the Czech own office segment. Overall, the operating income has grown by HUF thousand to HUF thousand Operating income (EBIT) % % EBIT margin (%) 8% 6% 16% 7% 14% -5% 14
15 Financial product intermediary services segment
16 FINANCIAL PRODUCT INTERMEDIARY SERVICES SEGMENT Changes in intermediated loan volumes mhuf Development in intermediated loan volumes Q2 2016Q3 2016Q4 2017Q1 2017Q2 Hungary Poland In Q the total intermediated loan volume on Group level has reached a record. The HUF Million loan volume from the Hungarian and Polish markets altogether has exceeded the same period of last year by 27.5%, and is also 24% higher than in the previous quarter. The Hungarian loan intermediation activity closed a very strong quarter. The total intermediated loan volume breaking a new record- exceeded last year s same period by nearly 22%, and was nearly 23% higher than in the previous quarter. Poland also presented a record volume loan intermediation. The growth, compared to the same period of the previous yearexceeded even the growth in Hungary with its 36%. That is 25% higher than in the previous quarter. The difference between the intermediated loan volume in Q2 and numbers presented on May 26, 2017 as estimates, is not significant 16
17 FINANCIAL PRODUCT INTERMEDIARY SERVICES SEGMENT Changes in intermediated home savings volume mhuf Development in intermediated home savings volume by quarters Q2 2016Q3 2016Q4 2017Q1 2017Q2 Hungary Intermediation of home savings products, which falls under the financial intermediary services, also closed a very strong quarter. The intermediated home savings volume in Q exceeded the volume in the same period of the previous year by nearly 60%, and was nearly 39% higher than in the previous quarter. Although the special deal offered in June by one of the major market players influenced the result, the growth would have reached both the volume intermediated in the same period of the previous year, as well as that in the previous quarter even without calculating with the effect of the special offer Volume of intermediated home savings in Q2 has exceeded the estimate published on May 26, 2017 by HUF 531 Million. 17
18 FINANCIAL PRODUCT INTERMEDIARY SERVICES SEGMENT SEGMENT LEVEL RESULTS (data in thhuf) FINANCIAL PRODUCT INTERMEDIARY SERVICES SEGMENT Variance Variance Variance Variance (thhuf) (%) (thhuf) (%) The financial intermediary services segment on revenue side closed an outstanding quarter both on the Hungarian and the Polish market. Q2 of 2017 is the first period when the 2% commission cap is valid in the comparative period as well. Net sales revenue % % Direct expenses % % Gross profit % % Gross profit margin (%) 38% 30% 39% 45% As a result, the significant revenue growth is the result of the outstanding volume growth of the intermediated loan and home savings volume. The improving contribution margin is due to the performance achieved on the Polish market, as well as to other one-time effects such as the home savings special offer in June, during which our Company reached an outstanding result Depreciation and impairment % % Indirect expenses % % Operating income (EBIT) % % EBIT margin (%) 31% 22% 60% 29% 37% -12% 18
19 FINANCIAL PRODUCT INTERMEDIARY SERVICES SEGMENT HUNGARIAN HOUSING LOAN TRENDS The Housing loan portfolio intermediated countrywide and by Duna House in the past periods (mrdhuf) , ,5 66, ,2 59, ,1 231,1 178,7 124,3 150,2 9,8 13,5 17,6 12,7 14,3 10,6 7,4 10,2 17,4 20,3 27,7 2,41 2,11 2,93 2, January February 240,0 358,2 467,2 40,4 36,8 46, March 43, April 3,3 3, May June Portfolio of the intermediated housing loan out of it by Duna House 19
20 Complementary services segment


21 COMPLEMENTARY SERVICES SEGMENT COMPLEMENTARY SERVICES SEGMENT Complementary services segment at present includes 4 activities: Comprehensive property management services Operation of empty and inhabited premises Property rent out and sales Cleaning, renovation, furnishing Deep knowledge of property market transactions significant additional, upto-date and detailed information and data. Property valuation is carried out by independent professionals throughout the country. Serving both individuals and business entities: Quality services provisioned by Pannónia Általános Biztosító Independent energy certificate preparing professionals Countrywide presence Fund Manager belonging to the Holding MNB cert.no: H-EN-III-130/2016 Date of registry: April Currently managed fund: ILBA, open end, public 21
22 IMPACT FUND MANAGER COMPLEMENTARY SERVICES SEGMENT 10% 5% 0% Generated yield from the beginning by Impact Residential Property Investment Fund mhuf Net asset value development from the beginning by Impact Residential Property Investment Fund The Management is indeed satisfied with the return achieved in the Impact Residential Property Investment Fund. At the time of publishing the present report, the 1-year return is net 9.2%, which is the highest yearly return among all property funds in Hungary. Although the managed asset volume of Impact Fund has risen significantly by 80%- since its registration last August, it is not considered of a high account when compared to the asset volume managed by the major property funds registered in Hungary. At the same time, according to the Management, the above mentioned outstanding annual return in the forthcoming periods can lead to a significant scale growth and capital inflow. Accordingly, it is the short-term goal of the Management to ensure that the distribution channels enabling extensive sales of Impact Fund s investment units are established. 22
23 COMPLEMENTARY SERVICES SEGMENT CHANGES IN SEGMENT SALES REVENUE BY QUARTERS thhuf Q1 2016Q2 2016Q3 2016Q4 2017Q1 2017Q2 23
24 SEGMENT LEVEL RESULTS COMPLEMENTARY SERVICES SEGMENT COMPLEMENTARY SERVICES SEGMENT (data in thhuf) Variance Variance Variance Variance (thhuf) (%) (thhuf) (%) Net sales revenue % % Direct expenses % % Gross profit % % Gross profit margin (%) 67% 57% 65% 59% Starting in January 2017 the fund management activity of Impact Asset Management Plc. ( Impact ) is indicated under the Complementary services segment, which, in the comparative period, is found under Other and consolidation segment. The gross contribution margin is higher than in the comparative period in all areas covered by the four segments, still the HUF 9 Million growth of the gross margin is mainly resulted by Impact. It is also due to Impact activity that operation costs, compared to Q2 2016, are HUF 10.5 Million higher, resulting in a HUF 1.7 Million lower operating income when compared to the same period last year Depreciation and impairment % % Indirect expenses % % Operating income (EBIT) % % EBIT margin (%) 14% 18% -53% 4% 18% -122% 24
25 Property investments segment
26 SEGMENT LEVEL RESULTS PROPERTY INVESTMENTS SEGMENT (data in thhuf) PROPERTY INVESTMENT SEGMENT Variance Variance Variance Variance (thhuf) (%) (thhuf) (%) Net sales revenue % % Direct expenses % % Gross profit % % Gross profit margin (%) 95% 28% 91% 36% Depreciation and impairment % % Indirect expenses % % Operating income (EBIT) % % EBIT margin (%) 81% 67% 65% 63% 60% 59% *profit/loss difference related to revaluation of investment purpose properties is indicated among indirect operating costs **in the past, result of MyCity companies activity was indicated under Share of profit of a joint venture in the consolidated income statement. The HUF 481 Million profit indicated in the comparative period is Duna House Plc. s proportional part of the value increase of construction lands registered as investment purpose property prior to the start of development activity Staring in Q2 2017, i.e the acquisition of MyCity group, result of the property development activity through MyCity companies is indicated under this segment. ** The significant revenue fallback of the property investments segment is connected to the decrease of the investment purpose property portfolio which begun in Q2 2016, as well as to the related focus shift of the Management in means of property development activity. No investment purpose property was sold during the given quarter, thus the realized revenue in the segment includes only rental fee related revenue. Realization of the revenue from the sales of property developments within MyCity is possible only following the receipt of the residence permits, thus Q2 results don indicate any such revenue. The HUF -1.9 Million balance of the indirect operation costs is mainly due to the HUF 16.5 Million operation cost of MyCity companies, and the compensating, nearly HUF 22 Million profit arising from the value growth of the existing investment purpose portfolio, also to other indirect costs related to the segment. The segment s profitability, valued at operating income level, is outstanding, exceeding 80%. which is the result of rental activity 26
27 PROPERTY INVESTMENTS SEGMENT VOLUME* AND VALUE OF INVESTMENT AND OPERATIVE PROPERTIES 31 March June 2017 (data in thhuf) Number (pcs) ** Carrying amount Number (pcs) ** Carrying amount Investment properties Properties Total ** properties owned by MyCity group not included ** number of properties doesn t include the number of parking spaces, storage rooms. We appraise investment purpose properties on market value. Market appraisal is carried out every six months, next time on December 31,

28 PROPERTY DEVELOPMENT ACTIVITY PROPERTY INVESTMENTS SEGMENT Duna House Holding, under MyCity brand, manages the development of 430 residential properties -4 projects-, as follows: Forest Hill Budapest III. district Reviczky Liget Budapest XVIII. district Írisz Ház Budapest XIII. district MyCity Residence Budapest III. district Duna House Group s share in Project 100% 100% 100% 50% Landsize (m2) Sellable area (m2) Number of Apartements (pcs.) 196* Average price (thhuf/ m2)** Average Apartements size (m2) 80 54,3 60,4 68,8 65,9 Actual status of Projects Construction permit Construction is ongoing - - Active presale started - TOTAL 148 flats with building permits at present ** based on average MyCity sales prices 28
29 PROPERTY DEVELOPMENT ACTIVITY PROPERTY INVESTMENTS SEGMENT In case of MyCity property development projects, the significant increase of construction costs was reasonably compensated for by the major sales price increase, thus the Management s profit-forecast in relation of property development activity has not changed significantly. Construction of the Reviczky Liget project in District 18. is proceeding in accordance with the plans; according to the Management, the Q4 takeover of the flats is reasonable. Out of the 87 flats included in the project, 57 are already sold with a strong interest towards the remaining properties. Construction and sales of the Forest Hill project in District 3., is proceeding in accordance with the plans. Selection of the main constructor in the MyCity Residence project in District 3 is in its final phase; construction can begin in October-November According to Management opinion, the performance of property development projects within MyCity is positive and in accordance with the set goals. 29

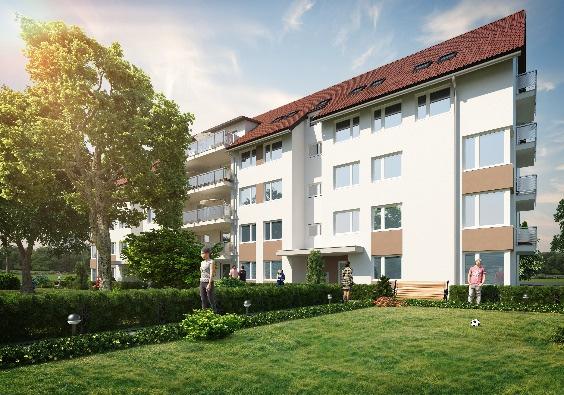


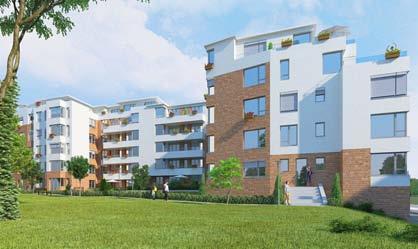
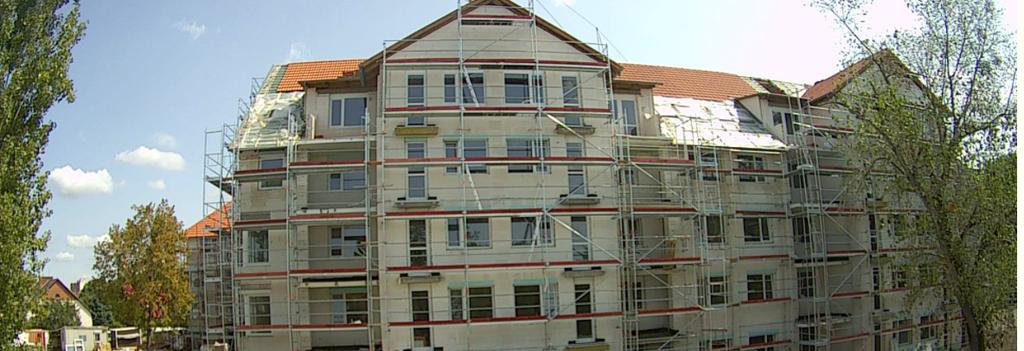
30 ON-GOING PROJECTS PROPERTY INVESTMENTS SEGMENT Forest Hill Reviczky Liget Írisz Ház MyCity Residence 30
31 Other-and consolidation segment
32 SEGMENT LEVEL RESULTS OTHER- AND CONSOLIDATION SEGMENT (data in thhuf) OTHERS- AND CONSOLIDATION SEGMENT Variance Variance Variance Variance (thhuf) (%) (thhuf) (%) Under the Other and consolidation segment, the result of Duna House Holding Plc. s ( Holding ) supporting holding activity and consolidated returns and expenditures arisen during the Holding s consolidation are indicated (the result effect of these in total is zero). Net sales revenue % % Direct expenses % % Gross profit % % Gross profit margin (%) 36% 123% 50% 114% In addition, in the comparative period the Impact Asset Management Plc. had been under the current segment (which is, in the current period indicated under the Complementary services segment), and presented no operative activity. Q2 operating result of the Holding primarily consists BÉT and KELER fees, as well as the proportional part of accounting fees in relation of the Holding s annual separate and consolidated reports. Depreciation and impairment % % Indirect expenses % % Operating income (EBIT) % % EBIT margin (%) 11% 20% 3% 11% 13% 4% 32
33 Consolidated financial statements
34 CONSOLIDATED BALANCE SHEET Consolidated balance sheet data in thhuf 30. June 2017 (not audited) 31. December (audited) Variance thhuf % Other intangible assets % Goodwill % Investment property % Property, plant % Equipment % Investment in a joint venture % Deferred tax assets % Other financial assets % Non-current assets % Inventories % Trade receivables % Receivables from affiliates % Other receivables % Current tax asset % Other assets % Consolidated balance sheet data in thhuf 30. June 2017 (not audited) 31. December 2016 (audited) Variance thhuf % Share capital % Share premium % Other reserves % Retained earnings % Equity attributable to the owners of the Company % Non-controlling interests % Total equity % Borrowings % Deferred tax liabilities % Other non-current liabilities % Non-current liabilities % Borrowings % Trade payables % Payables to affiliates % Cash and cash equivalents % Current assets % Other liabilities % Current tax liabilities % Accrued expenses % Current liabilities % Total assets % Total equity and liabilites %
35 CONSOLIDATED INCOME STATEMENT Consolidated income statement Variance Variance (data in thhuf, except earnings per share) (not audited) (not audited) thhuf % (not audited) (audited) thhuf % Net sales revenue % % Other operating income % % Changes in stocks of finished products and work in progress % % Consumables used % % Cost of goods and services sold % % Services purchased % % Personnel expenses % % Depreciation and impairment % % Other operating expenses % % Operating income (EBIT) % % Finance income % % Finance costs % % Share of the profit (losses) of a joint venture % % Profit before tax % % Income tax expense % % Profit after tax % % Currency translation difference % % Other comprehensive income % % Total comprehensive income % % attributable to Shareholders of the Company % % Non-controlling interest % % Earnings per share (basic and diluted) % % 35
36 CONSOLIDATED CASH FLOW STATEMENT Consolidated cash flow statement (not audited) (audited) Consolidated cash flow statement (not audited) (audited) data in thhuf Cash flows from operating activities Profit after tax Adjustments: Depreciation Deferred tax expense Fair value adjustments of investment properties Badwill Share of profit of a joint venture Movements of working capital Increase in inventories Increase in trade- and other receivables Decrease of other assets Increase of trade payables Increase of other short term liabilities Increase in accruals Net cash generated by operating activities Cash flows from investing activities Payments for property, plant and equipment Proceeds from the sale of properties Net cash outflow on acqusition of subsidiaries Net cash used in investing activities Cash flows from financing activities Proceeds from borrowings Proceeds from shareholders for capital increase Dividends paid Securities sold Net cash generated from financing activities Net increase in cash and cash equivalents Cash and cash equivalents at the beginning of the year Cash and cash equivalents at the end of the year
37 STATEMENT OF CHANGES IN EQUITY Share capital Share premium Attributable to the Foreign currency translation reserve Retained earnings shareholders of the Company Attributable to non-controlling interests Total equity data in thhuf 31. December Dividend paid Aquisition of Subsidiary Total comprehensive income December Dividend paid Capital increase Total comprehensive income June
38 REVENUE, OPERATING AND AFTER TAX INCOME BY COUNTRIES Data in thhuf HUNGARY POLAND CZECH REPUBLIC DUNA HOUSE TOTAL 2017Q2 2017Q1 2017Q2 2017Q1 2017Q2 2017Q1 2017Q2 2017Q1 Net sales revenue Operating income (EBIT) Profit after tax
39 HOLDING LEVEL OPERATING AND AFTER TAX INCOME WITHOUT MYCITY Data in thhuf Duna House Group [w/o MyCity*] 2017Q2 2017Q1 2017H1 Management forecast for the year 2017 Operating income (EBIT) Profit after tax *= Excluding the individual performance of MyCity group (MyCity Residential Development Kft., Pusztakúti 12 Kft., Revicky 6-10 Kft., Zsinór 39 Projekt Kft., Hunor utca 24 Ingatlanfejlesztő Kft.), but taking into account the performance of transactions arising from the Holding s cooperation with MyCity, and as a result of the control over MyCity group aqcuired in March 2017, the Holding sustained a badwill. Sales revenue related to the real estate development projects within MyCity group -in accordance with current accounting standards with relevance to the sector- is realized following project closure. Indirect (operational) costs arising before sales revenue realization have a negative impact on profitability.. 39
40 Annex 1 Time-series report of the different operational segments for the previous four quarters is attached to the interim report as a separate file.. Duna House Holding Nyrt 2017Q2 negyedeves HUN_1.sz.melleklet.xlsx 40
41 DECLARATION Undersigned, members of the Board of Directors of DUNA HOUSE HOLDING Plc. (seated H-1016 Budapest, Gellérthegy str 17. Hungary; Company Reg. No ) ; hereinafter Company ) declare that the present quarterly report has been prepared with our best knowledge and conviction, and with the aim to present an extensive look at the financial state of the Company, including statements and estimates referred to for the present. All statements and estimates are based on estimates and forecasts up-dated with our best knowledge and conviction, and in relation to which we shall not be held responsible for publicly up-dating any of the statements or estimates based on any future information, or events. Statements referring to the present bear a certain level of risk and uncertainty in themselves, thus factual results in some cases may significantly differ from forecast-type statements. We believe that the present quarterly interim report presents a trustworthy and real picture regarding the assets, liabilities, financial state, as well as the profit and loss of the Company and joint ventures included in the consolidation. The report also presents a trustworthy picture of the state, development and performance of the Company and joint ventures included in the consolidation. Simultaneously, we shall call attention to the financial statements presented in the interim report not being subject of an accounting audit, and in its present form not being in full compliance with all requirements of the International Financial Reporting Standards implemented by the European Union. The audited annual report of the Company, prepared in compliance with the regulations of International Financial Reporting Standards shall be published following the approval of the ordinary General Meeting of the Company planned to take place in April Budapest, August 25, 2017 Duna House Holding Plc. Board of Directors Represented by: Doron Dymschiz, Chairman of the Board of Directors 41


42
2018. Q2 Quarterly report. August 27, 2018
 2018. Q2 Quarterly report August 27, 2018 Table of contents Executive summary.... 3. Consolidated financial statements..... 5. Revenue, operating income and profit after tax by countries....... 11. Consolidated
DUNA HOUSE HOLDING NYRT.
 CONSOLIDATED BUSINESS REPORT ON THE 2018 H1 ACTIVITIES OF THE GROUP 1. Group profile A Duna House Holding Nyrt. hereinafter referred to as "Company" or "Group" was founded in 2003; its main activity are
DUNA HOUSE GROUP Highlights. March 2018
 DUNA HOUSE GROUP 2017 Highlights March 2018 DISCLAIMER This presentation shall not be considered as an offer or an invitation to tender concerning the purchase, subscription or any other transaction of
DUNA HOUSE HOLDING NYRT. s
 DUNA HOUSE HOLDING NYRT. s CONSOLIDATED BUSINESS REPORT ON THE GROUP S BUSINESS ACTIVITY IN THE FIRST HALF OF 2017 1. Group description Duna House Holding Nyrt. hereinafter: the Company or the Group was
DUNA HOUSE HOLDING NYRT. ACCORDING TO INTERNATIONAL FINANCIAL REPORTING STANDARDS 30 JUNE 2017
 DUNA HOUSE HOLDING NYRT. ACCORDING TO INTERNATIONAL FINANCIAL REPORTING STANDARDS 1 Table of Contents 1.... 4 1. General Information... 9 1.1 Introduction of the Company... 9 1.2 Basis of financial statements...
DUNA HOUSE GROUP. Investor presentation. 20 March 2018
 DUNA HOUSE GROUP Investor presentation 20 March 2018 WE ARE THE LEADING RESIDENTIAL REAL ESTATE BROKER IN CEE WE SERVE PEOPLE. REAL ESTATE IS OUR PASSION. Real estate brokerage Financial intermediation
Remuneration Policy of the Employee Stock Ownership Plan defined by Duna House Holding Public Limited Company
 This document is the English translation of the draft Remuneration Policy of the Employee Stock Ownership Plan of Duna House Holding Plc. This translation has been prepared for courtesy reasons. Only the
DUNA HOUSE BAROMETER issue. April The latest property market info from Duna House network
 DUNA HOUSE BAROMETER The latest property market info from Duna House network 82. issue 2018. www.dh.hu PRIVACY POLICY Statistical information and estimates published in the Duna House Barometer are the
Profit soars on project completion
 1 CEE Equity Research Hungary Real Estate 28 May 2018 Duna House Recommendation: Buy Target price (12M): HUF 4,751 Hun. Core HUF million 2018 Q1 2017 Q1 Ch (%) Revenues 2,618 1,081 242% EBITDA 790 188
DUNA HOUSE BAROMETER April month. 70. issue THE LATEST PROPERTY MARKET INFO FROM DUNA HOUSE NETWORK
 DUNA HOUSE BAROMETER 70. issue 2017. April month THE LATEST PROPERTY MARKET INFO FROM DUNA HOUSE NETWORK www.dh.hu PRIVACY POLICY Statistical information and estimates published in the Duna House Barometer
duna house Barometer issue May The latest property market info from Duna House network
 duna house Barometer The latest property market info from Duna House network 83. issue 2018. www.dh.hu PRIVACY POLICY Statistical information and estimates published in the Duna House Barometer are the
duna house Barometer issue July The latest property market info from Duna House network
 duna house Barometer The latest property market info from Duna House network 85. issue 2018. www.dh.hu PRIVACY POLICY Statistical information and estimates published in the Duna House Barometer are the
duna house Barometer issue NOVEMBER The latest property market info from Duna House network
 duna house Barometer The latest property market info from Duna House network 89. issue 2018. NOVEMBER www.dh.hu PRIVACY POLICY Statistical information and estimates published in the Duna House Barometer
Independent Auditor's Report
 Independent Auditor's Report to the Shareholders of Duna House Holding Nyrt. Opinion We have audited the consolidated financial statements of Duna House Holding Nyrt. and its subsidiaries (the Group )
Duna House. Recommendation: Buy Target price (12M): HUF 4,751 (prev: HUF 4,605) Decent Q4 result, profit is expected triple in 2018
: HUF 4,751 (prev: HUF 4,605) Decent Q4 result, profit is expected triple in 2018") 1 CEE Equity Research Hungary Real Estate 01 March 2018 Duna House Recommendation: Buy Target price (12M): HUF 4,751 (prev: HUF 4,605) HUF million 2017 Q4 2016 Q4 Ch (%) Revenues 1,229 1,160 6% EBITDA
1 CEE Equity Research Hungary Real Estate 01 March 2018 Duna House Recommendation: Buy Target price (12M): HUF 4,751 (prev: HUF 4,605) HUF million 2017 Q4 2016 Q4 Ch (%) Revenues 1,229 1,160 6% EBITDA
DUNA HOUSE BAROMETER QI-2. and JUNE. 72. issue THE LATEST PROPERTY MARKET INFO FROM DUNA HOUSE NETWORK
 DUNA HOUSE BAROMETER 72. issue 2017. QI-2. and 2017. JUNE THE LATEST PROPERTY MARKET INFO FROM DUNA HOUSE NETWORK www.dh.hu PRIVACY POLICY Statistical information and estimates published in the Duna House
CIG PANNÓNIA LIFE INSURANCE PLC.
 CIG PANNÓNIA LIFE INSURANCE PLC. QUARTERLY REPORT ON THE BASIS OF THE CONSOLIDATED FINANCIAL STATEMENTS PREPARED ACCORDING TO THE INTERNATIONAL FINANCIAL REPORTING STANDARDS ADOPTED BY THE EU Q2 2017 22
DUNA HOUSE BAROMETER. MAY issue THE LATEST PROPERTY MARKET INFO FROM DUNA HOUSE NETWORK
 DUNA HOUSE BAROMETER 71. issue MAY 2017. THE LATEST PROPERTY MARKET INFO FROM DUNA HOUSE NETWORK www.dh.hu PRIVACY POLICY Statistical information and estimates published in the Duna House Barometer are
CIG Pannónia Life Insurance Plc.
 CIG Pannónia Life Insurance Plc. Quarterly report On the basis of the consolidated financial statements prepared according to the International Financial Reporting Standards adopted by the EU Q4 2018 19
CIG Pannónia Life Insurance Plc.
 CIG Pannónia Life Insurance Plc. Quarterly report On the basis of the consolidated financial statements prepared according to the International Financial Reporting Standards adopted by the EU Q2 2018 22
CIG PANNÓNIA GROUP INSURERS
 CIG PANNÓNIA GROUP INSURERS QUARTERLY INFORMATION Q4 2017 20 February 2018 1. Summary The purpose of this information is to publish the data of CIG Pannónia Life Insurance Plc. and CIG Pannónia First Hungarian
CIG PANNÓNIA LIFE INSURANCE PLC.
 CIG PANNÓNIA LIFE INSURANCE PLC. QUARTERLY REPORT ON THE BASIS OF THE CONSOLIDATED FINANCIAL STATEMENTS PREPARED ACCORDING TO THE INTERNATIONAL FINANCIAL REPORTING STANDARDS ADOPTED BY THE EU Q1 2016 24
Quarterly report containing the interim financial statements of the Group for Q3 of the financial year of
 Quarterly report containing the interim financial statements of the Group for Q3 of the financial year of 2016-2017 covering the period from 01-07-2016 to 31-03-2017 Publication date: 16 May 2017 TABLE
CIG PANNÓNIA GROUP INSURERS
 CIG PANNÓNIA GROUP INSURERS QUARTERLY INFORMATION Q3 2017 21 November 2017 1. Summary The purpose of this information is to publish the data of CIG Pannónia Life Insurance Plc. and CIG Pannónia First Hungarian
Quarterly report containing interim financial statements of the Capital Group for Q3 of the financial year of
 Quarterly report containing interim financial statements of the Capital Group for Q3 of the financial year of 2013-2014 covering the period from 01-01-2014 to 31-03-2014 Publication date: 15 May 2014 TABLE
PANNERGY NYRT. CONSOLIDATED FINANCIAL STATEMENTS 31 DECEMBER 2009
 CONSOLIDATED FINANCIAL STATEMENTS PANNERGY NYRT. CONSOLIDATED FINANCIAL STATEMENTS 31 DECEMBER Dénes Gyimóthy Acting General and Finance Director Budapest, 31 March 2010 TABLE OF CONTENTS CONSOLIDATED
RESOLUTION FUND ANNUAL REPORT 2014
 A N N UA L RE P ORT RESOLUTION FUND ANNUAL REPORT F U N D F U N D R E S O L U T I O N R E S O L U T I O N A N N U A L A N N U A L R E P O R T R E P O R T 2 0 1 4 2 0 1 4 I NDEPENDEN T AUDI TOR S REP ORT
Recommendation: Buy Target price (12M): HUF 4,751 Equity Note Real estate market shows no sign of slowing down
: HUF 4,751 Equity Note Real estate market shows no sign of slowing down") 1 CEE Equity Research Hungary Real Estate 09 April 2018 Duna House Recommendation: Buy Target price (12M): HUF 4,751 Equity Note Real estate market shows no sign of slowing down Equity Analyst Gellert
1 CEE Equity Research Hungary Real Estate 09 April 2018 Duna House Recommendation: Buy Target price (12M): HUF 4,751 Equity Note Real estate market shows no sign of slowing down Equity Analyst Gellert
Working Party No. 2 on Competition and Regulation
 For Official Use DAF/COMP/WP2/WD(2007)11 DAF/COMP/WP2/WD(2007)11 For Official Use Organisation de Coopération et de Développement Economiques Organisation for Economic Co-operation and Development 08-Feb-2007
Quarterly report containing the interim financial statements of the Capital Group for Q3 of the financial year of
 Quarterly report containing the interim financial statements of the Capital Group for Q3 of the financial year of 2015-2016 covering a period from 01 July 2015 to 31 March 2016 Publication date: 16 May
GRAPHISOFT PARK SE PARENT COMPANY ANNUAL REPORT 2017
 PARENT COMPANY ANNUAL REPORT 2017 BUSINESS REPORT 2017 Business Report Overview Graphisoft Park SE carries out its real estate development, leasing and operation activity, being the sole activity of the
AAA Auto Group N.V. Interim Statement November 2011
 AAA Auto Group N.V. Interim Statement November 2011 Material events in the second half of 2011 so far and their impact on AAA AUTO Group Among the main factors that had an influence on the financial results
As Re-stated Note
 Group Income Statement For the year ended 30 April 2014 Note Revenue - continuing 2 114,188 98,537 Cost of sales - operating (84,563) (77,904) - impairment charge on inventories 3 (162) (3,539) Gross profit
TOTAL ASSETS 417,594, ,719,902
 WABERER'S International NyRt. CONSOLIDATED STATEMENT OF FINANCIAL POSITION data in EUR Description Note FY 2014 FY 2015 restated NON-CURRENT ASSETS Property 8 15,972,261 17,995,891 Construction in progress
Accounting Title 2014/3/ /12/ /3/31 Balance Sheet
 Financial Statement Balance Sheet Accounting Title 2014/3/31 2013/12/31 2013/3/31 Balance Sheet Assets Current assets Cash and cash equivalents Total cash and cash equivalents 7,974,989 6,997,862 6,433,466
CI GAMES GROUP CONSOLIDATED QUARTERLY REPORT Q3 2013
 CI GAMES GROUP Q3 2013 Warsaw, November 14, 2013 2 CONTENTS I. CONSOLIDATED FINANCIAL DATA - CI GAMES GROUP 4 II. SEPARATE FINANCIAL DATA - CI GAMES S.A. 13 III. FINANCIAL HIGHLIGHTS 22 IV. NOTES TO THE
Recommendation: Buy Target price (12M): HUF 4,585 Equity Note Credit intermediation segment was strong again
: HUF 4,585 Equity Note Credit intermediation segment was strong again") 1 CEE Equity Research Hungary Real Estate 09 January 2018 Duna House Recommendation: Buy Target price (12M): HUF 4,585 Equity Note Credit intermediation segment was strong again Equity Analyst Gellert
1 CEE Equity Research Hungary Real Estate 09 January 2018 Duna House Recommendation: Buy Target price (12M): HUF 4,585 Equity Note Credit intermediation segment was strong again Equity Analyst Gellert
PANNÓNIA GROUP INSURERS
 PANNÓNIA GROUP INSURERS QUARTERLY INFORMATION Q2 2017 22 August 2017 1. Summary The purpose of this information is to publish the data of CIG Pannónia Life Insurance Plc., CIG Pannónia First Hungarian
Financial Statement Balance Sheet
 Financial Statement Balance Sheet Provided by: RUENTEX INDUSTRIES LIMITED Finacial year: Yearly Unit: NT$ thousand Accounting Title 2016/12/31 2015/12/31 Balance Sheet Assets Current assets Cash and cash
Naturhouse Health S.A. Financial Statements for the financial year ending 31 December 2016 Management Report
 Naturhouse Health S.A. Financial Statements for the financial year ending 31 December 2016 Management Report CONTENTS Page Balance Sheet at 31 December 2016 Profit and Loss Account for the 2016 financial
LPP SA Capital Group Consolidated 2012 half-year report
 Including: 1. Statement of the Management Board in accordance with the provisions of the Regulation of the Council of Ministers of 19 February 2009 on current and interim information provided by issuers
AS Harju Elekter Interim report 1-9/ 2004 Unaudited, consolidated
 Interim report 1-9/ 2004 Unaudited, consolidated Business name Main business area: AS Harju Elekter designing, production and marketing of various electrical engineering and telecommunication systems Commercial
CIG PANNÓNIA LIFE INSURANCE PLC.
 CIG PANNÓNIA LIFE INSURANCE PLC. QUARTERLY REPORT ON THE BASIS OF THE CONSOLIDATED FINANCIAL STATEMENTS PREPARED ACCORDING TO THE INTERNATIONAL FINANCIAL REPORTING STANDARDS ADOPTED BY THE EU Q2 2015 18
ANNUAL REPORT IMPEXMETAL S.A.
 ANNUAL REPORT IMPEXMETAL S.A. FOR 2016 IMPEXMET POLISH FINANCIAL SUPERVISION AUTHORITY Annual report R 2016 (according to 82 para. 1 of the Minister of Finance Regulation of 19 February 2009 - Journal
CIG PANNÓNIA LIFE INSURANCE PLC. QUARTERLY INFORMATION Q3 2011
 CIG PANNÓNIA LIFE INSURANCE PLC. QUARTERLY INFORMATION Q3 2011 16 th November 2011 1. Summary CIG Pannónia Life Insurance Plc. (hereinafter: Issuer) publishes its quarterly information on this day. The
ARCUS Spółka Akcyjna
 ARCUS Spółka Akcyjna www.arcus.pl Consolidated interim report of Arcus S.A. 1 January 2016-31 March 2016 prepared in accordance with the International Financial Reporting Standards Table of contents 1
GRAPHISOFT PARK SE. Half-year Report First Half August 8, 2011
 GRAPHISOFT PARK SE Half-year Report First Half 2011 August 8, 2011 BUSINESS REPORT FIRST HALF 2011 Financial highlights IFRS, consolidated, thousand EUR 3 months ended 6 months ended June 30, June 30,
Submissions. to RÁBA Automotive Holding Plc. s (RÁBA Plc) Annual General Meeting. to be held on April 6, 2012
 Annual General Meeting. to be held on April 6, 2012") Submissions to RÁBA Automotive Holding Plc. s (RÁBA Plc) Annual General Meeting to be held on April 6, 2012 Győr, March 14, 2012 H-9027 Győr, Martin u. 1. Postal address: H- 9002 Győr, POB 50 Telephone:
Submissions to RÁBA Automotive Holding Plc. s (RÁBA Plc) Annual General Meeting to be held on April 6, 2012 Győr, March 14, 2012 H-9027 Győr, Martin u. 1. Postal address: H- 9002 Győr, POB 50 Telephone:
Unappropriated retained earnings (accumulated deficit) Total unappropriated retained earnings (accumulated deficit) 676, ,797 Total retained ear
 Total unappropriated retained earnings (accumulated deficit) 676, ,797 Total retained ear") Financial Statement Balance Sheet Accounting Title 2014/12/31 2013/12/31 Balance Sheet Assets Current assets Cash and cash equivalents Total cash and cash equivalents 1,183,185 1,177,682 Current bond investment
Financial Statement Balance Sheet Accounting Title 2014/12/31 2013/12/31 Balance Sheet Assets Current assets Cash and cash equivalents Total cash and cash equivalents 1,183,185 1,177,682 Current bond investment
POU CHEN CORPORATION AND SUBSIDIARIES
 CONSOLIDATED BALANCE SHEETS March 31, 2013 December 31, 2012 March 31, 2012 January 1, 2012 ASSETS Amount % Amount % Amount % Amount % CURRENT ASSETS Cash and cash equivalents (Notes 4 and 6) $ 29,346,249
Interim consolidated statement of financial position as of 30 September 2018 (Amounts expressed in Turkish Lira ( TL ) unless otherwise indicated.
 unless otherwise indicated.") Interim consolidated statement of financial position as of 30 September ASSETS Unaudited Audited Notes 30 September 31 December Current assets: Cash and cash equivalents 4 531.105.722 227.960.860 Financial
Interim consolidated statement of financial position as of 30 September ASSETS Unaudited Audited Notes 30 September 31 December Current assets: Cash and cash equivalents 4 531.105.722 227.960.860 Financial
STATISTICAL REFLECTIONS
 STATISTICAL REFLECTIONS 29 January 2016 Contents Introduction...1 Changes in property transactions...1 Annual price indices...1 Quarterly pure price index...2 Factors of overall price in the market of
OTP Bank Rt. First Quarter 2001 Stock Exchange Report
 OTP Bank Rt. First Quarter 2001 Stock Exchange Report Budapest, May 15, 2001 OTP Bank s first quarter 2001 Stock Exchange Report contains the HAR non consolidated and consolidated first quarter 2001 balance
2007 FOURTH QUARTER AND FULL YEAR PRELIMINARY RESULTS OF DANUBIUS HOTELS GROUP
 FOURTH QUARTER AND FULL YEAR PRELIMINARY RESULTS OF DANUBIUS HOTELS GROUP Danubius Hotels Plc, today announced its fourth quarter and full year preliminary, unaudited results. This report contains consolidated
M K B B a n k Z r t. TERVEZET Unconsolidated Interim Report
 M K B B a n k Z r t. 10 011 922 641 911 400 Statistic code TERVEZET Unconsolidated Interim Report Prepared under HUNGARIAN ACCOUNTING RULES Budapest 29th August, 2011 June 30, 2011 1/12 The Board of Directors
Instructions for completing financial reporting forms published by the banks
 Appendix 10 Approved by The Central Bank of the Republic of Armenia Board Decision No. 205 N of July 10, 2007 Chairman of the Central Bank of the Republic of Armenia Tigran Sargsyan July 17, 2007 Approved
GEDEON RICHTER CONSOLIDATED FINANCIAL STATEMENTS GEDEON RICHTER CONSOLIDATED FINANCIAL STATEMENTS
 GEDEON RICHTER CONSOLIDATED FINANCIAL STATEMENTS GEDEON RICHTER CONSOLIDATED FINANCIAL STATEMENTS 1 Table of Contents Consolidated Income Statement 10 Consolidated Statement of Comprehensive Income 10
KCE Electronics Public Company Limited and its subsidiaries
 Statements of financial position Consolidated financial Separate financial 31 December 31 December 31 December 31 December Assets Note 2014 2013 2014 2013 Current assets Cash and cash equivalents 7 463,016,990
Orco Property Group - Q financial information
 Press Release 24 November 2011 Orco Property Group - Q3 2011 financial information Third Quarter financial highlights (in EUR Million): Quarter on quarter revenues at 43.8 compared to 40.4 Year on year
ARCUS Spółka Akcyjna
 ARCUS Spółka Akcyjna www.arcus.pl Consolidated financial statement of Arcus S.A. Capital Group for the financial 31 December 2015 Warsaw, 21 March 2016 1 1 Data regarding the annual financial statement
BUDAPEST STOCK EXCHANGE LTD. Financial Statements under IFRS as adopted by the EU and Independent Auditor s Report
 BUDAPEST STOCK EXCHANGE LTD. Financial Statements under IFRS as adopted by the EU and Independent Auditor s Report Table of Contents Page Independent Auditor s Report 1 Financial Statements Statement of
Financial review Refresco Financial review 2017
 Financial review 2017 Financial review 2017 Financial review 2017 1 69 Consolidated income statement For the year ended December 31, 2017 (x 1 million euro) Note December 31, 2017 December 31, 2016 Revenue
CIG PANNÓNIA LIFE INSURANCE PLC. 20 MARCH 2018 GABRIELLA KÁDÁR, CEO MIKLÓS BARTA, COO
 CIG PANNÓNIA LIFE INSURANCE PLC. 20 MARCH 2018 GABRIELLA KÁDÁR, CEO MIKLÓS BARTA, COO CIG PANNÓNIA LIFE INSURANCE PLC. ABOUT CIG PANNÓNIA GROUP THE CIG GROUP AND PARTNERSHIP CIG Pannónia Life Insurance
Quarterly Report containing interim financial statements of the AB Group for Q1 of the financial year
 Quarterly Report containing interim financial statements of the AB Group for Q1 of the financial year 2016-2017 covering the period from 01-07-2016 to 30-09-2016 Publication date: 14 November 2016 TABLE
D R A F T T E R M S O F T R A N S F O R M A T I O N
 D R A F T T E R M S O F T R A N S F O R M A T I O N The draft terms of transformation contains the draft of the merger by acquisition on the one hand of CIG Pannonia Life Insurance Plc. (registered seat:
Date of Announcement: 24 June 2014 Reference: 59/2014
 Date of Announcement: 24 June 2014 Reference: 59/2014 The following is a Company Announcement issued by (the Company ) pursuant to the Malta Financial Services Authority Listing Rules. Quote At a meeting
LPP S.A. Group Interim condensed financial statements for the third quarter of 2010
 LPP S.A. Group Gdańsk November 2010 1. Selected Consolidated Financial Data of LPP S.A. Capital Group in PLN III quarter of 2010 thousand III quarter of III quarter of III quarter of 2009 2010 2009 Selected
Accounting Title 2016/3/ /12/ /3/31 Balance Sheet
 Financial Statement Balance Sheet Accounting Title 2016/3/31 2015/12/31 2015/3/31 Balance Sheet Assets Current assets Cash and cash equivalents Total cash and cash equivalents 626,334 624,357 540,732 Current
I. Independent Auditor s Report 3
 PannErgy Plc. Parent Company s Financial Statement and Annual Report (prepared in accordance with International Financial Reporting Standard as adopted by the EU.) 2017. including Independent Auditor s
Duna House. Recommendation: Buy Target price (12M): HUF 4,750 Equity Note
: HUF 4,750 Equity Note") 1 CEE Equity Research Hungary Real Estate 09 July 2018 Duna House Recommendation: Buy Target price (12M): HUF 4,750 Equity Note Equity Analyst Gellert Gaal +361 489 2228 g.gaal@con.hu 50 Alkotás Street,
1 CEE Equity Research Hungary Real Estate 09 July 2018 Duna House Recommendation: Buy Target price (12M): HUF 4,750 Equity Note Equity Analyst Gellert Gaal +361 489 2228 g.gaal@con.hu 50 Alkotás Street,
SCANFIL GROUP S INTERIM REPORT 1 JANUARY 30 SEPTEMBER 2015
 SCANFIL GROUP S INTERIM REPORT 1 JANUARY 30 SEPTEMBER 2015 28 OCTOBER 2015 9.50 A.M. July September - Turnover totalled EUR 135.8 million (Q3 2014: 56.7), up to 140.0% - Operating profit EUR 5.2 million
Interim Report Q Self Storage Group ASA
 Interim Report Q2 2018 Self Storage Group ASA Contents Highlights 2 Key Figures 2 Subsequent events 2 Financial development 3 Strategy 6 Corporate developments 8 Risks and uncertainty factors 8 Outlook
Duna House Barometer 03. August outlook: age specifications
 Duna House Barometer 03. August 2011 + outlook: age specifications Table of contents: Executive Summary 3. Transaction numbers and Demand Index 4. Home price data - August 5. Interest in the districts
GEDEON RICHTER CONSOLIDATED FINANCIAL STATEMENTS
 GEDEON RICHTER CONSOLIDATED FINANCIAL STATEMENTS Table of Contents Consolidated Income Statement 12 Consolidated Statement of Comprehensive Income 12 Consolidated Balance Sheet 13 Consolidated Statement
Regus plc. Interim Report. Six months ended June 2003
 18069_E21932_BRO_V2.qxd 15/9/2003 Regus plc Interim Report Six months June 2003 9:44 am Page a2 2 Interim Report 2003 Chairman s Statement The Regus Group continued to make steady progress during the first
Continuing difficult trading conditions in Hungary offset by resilient profit contribution by subsidiaries.
 Danubius Hotels Plc, today announced its full year and fourth quarter preliminary, unaudited results. This report contains consolidated financial statements for the period ended 31 December as prepared
DANUBIUS HOTELS NYRT.
 DANUBIUS HOTELS NYRT. 2006 CONSOLIDATED FINANCIAL STATEMENTS ACCORDING TO IFRS Danubius Hotel and Spa Nyrt. and Subsidiaries Consolidated Financial Statements December 31, 2006 with Report of the Independent
Swiss GAAP FER 2017 Checklist for application and disclosure. Audit & Assurance
 Swiss GAAP FER 2017 Checklist for application and disclosure Audit & Assurance Foreword This checklist shall support in applying the Swiss GAAP FER standards as well as in reviewing the completeness of
Interim Report January March
 2018 Interim Report January March KPIs In CHF million, except where indicated 31.3.2018 31.3.2017 Change Revenue and results Net revenue 1 2,885 2,831 1.9% Operating income before depreciation and amortisation
For personal use only
 AUSTRALIAN FINANCE GROUP LIMITED ABN 11 066 385 822 Appendix 4E Preliminary Final Report for the year ended 30 June 2015 Contents Page Results for announcement to market 2 Discussion and analysis of the
Gedeon Richter CONSOLIDATED FINANCIAL STATEMENTS 2015
 Gedeon Richter CONSOLIDATED FINANCIAL STATEMENTS Consolidated Financial Statements I Gedeon Richter Table of Contents Consolidated Income Statement 6 Consolidated Statement of Comprehensive Income 6 Consolidated
KCE Electronics Public Company Limited and its subsidiaries
 Statements of financial position Consolidated Separate financial financial 31 December 31 December Assets Note 2012 2011 2012 2011 Current assets Cash and cash equivalents 7 397,177,878 535,535,464 94,974,827
CIG PANNONIA LIFE INSURANCE PLC.
 CIG PANNONIA LIFE INSURANCE PLC. CONSOLIDATED FINANCIAL STATEMENTS AND CONSOLIDATED BUSINESS REPORT FOR THE YEAR 2013, PREPARED ACCORDING TO THE INTERNATIONAL FINANCIAL REPORTING STANDARDS ACCEPTED BY
Swiss GAAP FER 2017 Checklist for application and disclosure. Audit & Assurance
 Swiss GAAP FER 2017 Checklist for application and disclosure Audit & Assurance Foreword This checklist shall support in applying the Swiss GAAP FER standards as well as in reviewing the completeness of
Group annual financial statements
 61 Group annual financial statements The consolidated annual financial statements include all of s subsidiaries. They have been produced in accordance with International Financial Reporting Standards (IFRS)
MKB Bank Zrt. Interim Financial Report
 MKB Bank Zrt. 10 011 922 641 911 401 Reg. number Interim Financial Report according to Hungarian Accounting Rules Budapest, 31 August, 2017 June 30, 2017 MKB Bank Zrt. Data: in HUF' mill. NON-CONSOLIDATED
HUNGARY: 10% TAX RATE
 HUNGARY: 10% TAX RATE The main intention of the present booklet is to provide a brief guide to foreign individuals, entrepreneurs or corporations considering to establish a company in Hungary. 1- HUNGARY
CONSOLIDATED FINANCIAL STATEMENTS AS AT 31 DECEMBER 2016
 CONSOLIDATED FINANCIAL STATEMENTS AS AT 31 DECEMBER 2016 CONSOLIDATED INCOME STATEMENT (*) (THOUSAND EUROS) NOTE 2016 2015 Revenues 5 780,739 705,601 Other income 19,579 15,643 Purchases 6 (16,969) (14,049)
3. CONSOLIDATED QUARTERLY FINANCIAL STATEMENTS
 3. CONSOLIDATED QUARTERLY FINANCIAL STATEMENTS (1) Consolidated Quarterly Balance Sheets September 30, 2013 and March 31, 2013 March 31, 2013 September 30, 2013 Assets Current assets Cash and deposits
GROUP PROFIT AND LOSS ACCOUNT
 GROUP PROFIT AND LOSS ACCOUNT Continuing Continuing activities Goodwill activities before goodwill Amortisation before Operating Unaudited amortisation & operating Audited operating exceptional Total &
Press Release Corporate News Vienna, 2 August 2013
 Press Release Corporate News Vienna, 2 August 2013 IMMOFINANZ Group confirms upward trend in operations during 2012/13 property sales at record high, net profit lower due to decline in positive valuation
I. Consolidated Balance Sheet
 I. Consolidated Balance Sheet At 30 June At 31 December ASSETS Non-current assets Property, plant and equipment 375,932 352,949 Investment real estates 14,909 7,876 Goodwill 44,061 44,061 Other intangible
Quarterly Financial Report 2014 Logwin AG
 Quarterly Financial Report 2014 Logwin AG Key Figures 1 January 31 March 2014 Group In thousands of EUR 2014 2013 Revenues 278,533 320,696 Change on 2013-13.1% Operating result (EBIT) 8,048 8,016 Margin
st IFRS Consolidated Financial Statements
 2461 2018 1st IFRS Consolidated Financial Statements Balance Sheet Balance Sheet Unit: NT$ thousand Accounting Title 2018/03/31 2017/12/31 2017/03/31 Assets Current assets Cash and cash equivalents 1,552,283
Investment policy related to national security
 Organisation for Economic Co-operation and Development DIRECTORATE FOR FINANCIAL AND ENTERPRISE AFFAIRS INVESTMENT COMMITTEE DAF/INV/RD(2019)2 English text only 21 February 2019 Investment policy related
ENEFI Energyefficiency Plc. ARTICLES OF ASSOCIATION
 ENEFI Energyefficiency Plc. ARTICLES OF ASSOCIATION (Consolidated in a uniform structure) 1 ARTICLES OF ASSOCIATION Articles of Association of ENEFI Energyefficiency Plc. (hereinafter: the Company) consolidated
STATISTICAL REFLECTIONS
 STATISTICAL REFLECTIONS 7 November 2016 Housing prices, housing price index, Quarter 2 2016* Contents Introduction...1 Changes in property transactions...1 Annual price indices...2 Quarterly pure price
Pannonia. Rating: Neutral (unch.) Price target (12-m): HUF 470 (HUF 452) Current share price: HUF 460
 Price target (12-m): HUF 470 (HUF 452) Current share price: HUF 460") CEE Equity Research Insurance Hungary 24 May 2018 Pannonia Rating: Neutral (unch.) Price target (12-m): HUF 470 (HUF 452) Current share price: HUF 460 HUF million 2016 2017F 2018F 2019F GWP 18 941 26 933
CEE Equity Research Insurance Hungary 24 May 2018 Pannonia Rating: Neutral (unch.) Price target (12-m): HUF 470 (HUF 452) Current share price: HUF 460 HUF million 2016 2017F 2018F 2019F GWP 18 941 26 933
Financial statement of LIVECHAT Software SA
 Financial statement of LIVECHAT Software SA for the period from April 1st, 2015 until March 31st, 2016 drawn up in accordance with the Accounting Act Wrocław, June 10 th, 2016. CONTENTS STATEMENT OF THE
I. Consolidated Balance Sheet
 I. Consolidated Balance Sheet At 31 At 31 ASSETS Non-current assets Property, plant and equipment 387,459 352,949 Investment real estates 15,359 7,876 Goodwill 44,061 44,061 Other intangible assets 70,214