I N V E S T O R P R E S E N T A T I O N
|
|
|
- Terence Barker
- 5 years ago
- Views:
Transcription

1 I N V E S T O R P R E S E N T A T I O N J U N E 1 5,
2 IMPORTANT INFORMATION ABOUT RYERSON HOLDING CORPORATION These materials do not constitute an offer or solicitation to purchase or sell securities of Ryerson Holding Corporation (the Company ) and no investment decision should be made based upon the information provided herein. Ryerson strongly urges you to review its filings with the Securities and Exchange Commission, which can be found at ir.ryerson.com/financial-info/sec-filings/. This site also provides additional information about Ryerson. SAFE HARBOR PROVISION Certain statements made in this presentation and other written or oral statements made by or on behalf of the Company constitute forward-looking statements within the meaning of the federal securities laws, including statements regarding our future performance, as well as management s expectations, beliefs, intentions, plans, estimates or projections relating to the future. Such statements can be identified by the use of forward-looking terminology such as believes, expects, may, estimates, will, should, plans or anticipates or the negative thereof or other variations thereon or comparable terminology, or by discussions of strategy. The Company cautions that any such forward-looking statements are not guarantees of future performance and may involve significant risks and uncertainties, and that actual results may vary materially from those in the forward-looking statements as a result of various factors. Among the factors that significantly impact the metals distribution industry and our business are: the cyclicality of our business; the highly competitive and fragmented market in which we operate; fluctuating metal prices; our substantial indebtedness and the covenants in instruments governing such indebtedness; the integration of acquired operations; regulatory and other operational risks associated with our operations located inside and outside of the United States; work stoppages; obligations regarding certain employee retirement benefit plans; the ownership of a majority of our equity securities by a single investor group; currency fluctuations; and consolidation in the metals producer industry. Forward-looking statements should, therefore, be considered in light of various factors, including those set forth above and those set forth under Risk Factors in our annual report on Form 10-K for the year ended December 31, 2015 and in our other filings with the Securities and Exchange Commission. Moreover, we caution against placing undue reliance on these statements, which speak only as of the date they were made. The Company does not undertake any obligation to publicly update or revise any forward-looking statements to reflect future events or circumstances, new information or otherwise. NON-GAAP MEASURES Certain measures contained in these slides or the related presentation are not measures calculated in accordance with generally accepted accounting principles (GAAP). They should not be considered a replacement for GAAP results. Non-GAAP financial measures appearing in these slides are identified in the footnotes. A reconciliation of these non-gaap measures to the most directly comparable GAAP financial measures is included in the Appendix. 2

3 B U S I N E S S O V E R V I E W M I K E B U R B A C H P R E S I D E N T, N O R T H - W E S T R E G I O N
4 Ryerson: Scale and Network One of North America s largest metals processors and distributors, with 2015 sales of $3.2 billion Approximately 100 interconnected locations in North America and China Founded in 1842; listed on NYSE since 2014 Distribute 65,000 products to 40,000 active customers 4


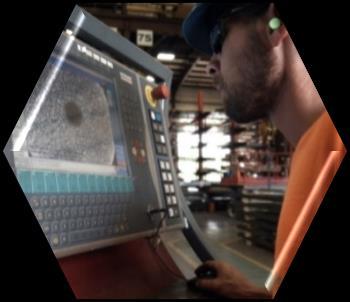
5 Metal Service Center Supply Chain S U P P L I E R S Manufacture metals Produce & ship large volumes Have long lead times with high variance delivery times R Y E R S O N S E R V I C E C E N T E R S Purchase in scale; ship smaller quantities Distribute more than 65,000 carbon, stainless, and aluminum products Process 75% of products sold Deliver same/next day Provide product and end-market expertise C U S T O M E R S Purchase smaller quantities Require a variety of products and services Can leverage Ryerson to reduce processing and inventory investment needs 5
6 Ryerson s Differentiated Model: What Customers Value ONE RYERSON Single franchise / one brand Great customer experiences GEOGRAPHIC SCALE Service largest metals markets to meet our customers needs RYERSON Leveraging Scale and Integrated Network CONNECTIVITY Technical knowledge Processing & fabrication Logistics Inventory MULTI-CHANNEL SALES Local sales and service Customer service prospecting centers Ryerson.com / e-commerce 6
7 Highlights: Excellent Execution Amidst Bottoming Secular Trends Macro Environment Stabilizing and improving industrial metal commodity prices Pressure for secular demand improvement building as underinvestment is prevalent Ryerson s Execution Proven expense and working capital management Ryerson business model and execution building momentum Market share gains Cash generation and reducing leverage 7
8 Price index to Jun Commodity Prices: Global Capacity Surplus Rebalancing Carbon Recovery With Range-Bound Nickel and Aluminum CRU HRC LME Nickel Midwest Aluminum 2016 Prices Chg. Jun '14 vs. Dec '15 Chg. Dec '15 vs. May '16 CRU HRC (USD/st) -47% 66% LME Nickel Cash Average (USD/lb) -53% 0% Midwest Aluminum (USD/lb) -25% 2% Source: Bloomberg 8
9 PMI Trends: Slowly Improving From A Bottoming Over The Past Three Quarters U. S. M A N U F A C T U R I N G P M I MAY-15 JUN-15 JUL-15 AUG-15 SEP-15 OCT-15 NOV-15 DEC-15 JAN-16 FEB-16 MAR-16 APR-16 MAY-16 Source: Bloomberg 9
10 Tons in Thousands Macro Trends: Promising Over The Longer-Term With Underinvestment Notable Since ,000 U. S. C A R B O N a n d S T A I N L E S S S T E E L S H I P M E N T S 5,500 5,000 4,500 Average Tons Jan. '93 - Oct. '08 = 4,200 Average Tons Nov. '08 - Present = 3,200 4,000 3,500 3,000 2,500 2,000 Source: Metals Service Center Institute 10


11 End Market Mix, Recovery and Growth Oil & Gas 7% Food Processing & Ag. 7% S A L E S M I X All Other 7% Commercial Ground Transportation 18% Shading based on Q vs. Q tonnage change: GROWING STABLE DECLINING Construction Equipment 8% Metal Fabrication and Machine Shops 18% HVAC 8% Consumer Durable 10% Industrial Machinery and Equipment 17% 11

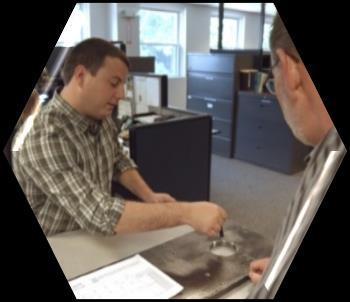
12 A Ryerson for All Seasons with Competitive Advantages Built Around Speed, Scale, Value-Add, Culture and Analytics Industry-leading expense and working capital management NATHAN NORMAN SERVICE CENTER OPERATOR ELDRIDGE, IOWA Enhancing margins with greater value-add Building sustainable competitive advantages to fuel growth Excellent execution and market share gains Generating strong cash flows and reducing debt balances 12

13 INDUSTRY-LEADING PERFORMANCE OPERATIONAL EFFICIENCY Expense and working capital leadership Significant operating leverage Best practice talent management Speed MARGIN EXPANSION Optimize product and customer mix Value-added processing Value-driven pricing Supply chain innovation, architecture and leadership PROFITABLE GROWTH Leveraging scale in highly fragmented market Multi-channel sales and distribution platform Investment in capabilities Bolt-on acquisitions Unleashing analytics Our culture: contributing meaningfully to our customers success 13
14 Impressive U.S. Carbon and Stainless Market Share Gains T O N N A G E M A R K E T S H A R E 3.75% 3.41% 3.46% 3.51% 3.53% Q1 '15 Q2 '15 Q3 '15 Q4 '15 Q1 '16 Source: Metals Service Center Institute 14


15 Optimizing Mix to Improve Gross Margin Dollars S A L E S M I X Fabrication 6.7% Cut Long & Plate 2.9% S A L E S M I X Fabrication 10.4% Cut Long & Plate 4.2% Cut to Length Sheet 67.8% As-Is Long & Plate 18.7% Cut to Length Sheet 63.1% As-Is Long & Plate 20.3% Expand value-added processing: More than 75% of metal gets processed to customer specifications with growth in high margin fabrication Understand margins, cost to serve, asset efficiency and industry math 15
16 Proven Operational Efficiency and Industry Leadership DAYS OF SUPPLY % EXPENSE PERCENTAGE EXCLUDING D&A AND ONE-TIME ITEMS 17.5% 17.6% 19.1% 20.5% % 12.5% 11.9% 12.9% 14.0% Q Q Expense % excluding D&A and one-time items is a non-gaap financial measure. A reconciliation of this non-gaap financial measure to the comparable GAAP measure is included in the Appendix. Competitor averages are based on Ryerson s analysis of financial information disclosed in competitors SEC filings. Competitor averages include Reliance Steel & Aluminum, Olympic Steel, Kloeckner Metals, Russel Metals and A.M. Castle. Ryerson Competitor Averages 16

17 F I N A N C I A L O V E R V I E W J I M C L A U S S E N R E G I O N C F O

18 Ryerson Financial Priorities Maintain operational efficiency Manage working capital Maximize liquidity position Propel growth, invest in high return capital projects and bolt-on acquisitions 18

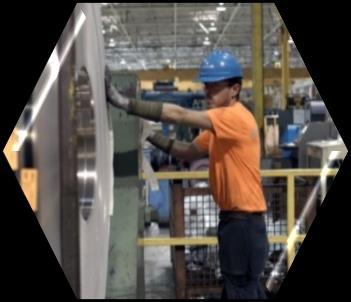
19 2016 Q1 Performance Highlights Earnings Net income of $13.5M Earnings per share of $0.42, or $0.26 on an adjusted basis Gross margin increased 370 bps to 21.0% vs. Q1 15 Gross margin, excluding LIFO increased 300 bps to 18.9% vs. Q1 15 Adjusted EBITDA, excluding LIFO of $37M Market Share Gains Ryerson volume up 0.4% year-over-year vs. MSCI decline of 8.5% Expense Reductions Expenses down $7M, or 6%, versus Q1 15 Working Capital, Cash Flow & Liquidity Cash flow from Operating Activities of $47M Net debt was $286M (24%) lower than year-end 2014 Total liquidity of $313M improved by $40M compared to 2015 year-end ANGEL ALFARO OPERATIONS SUPERVISOR ELGIN, ILLINOIS 19
20 Quarterly Financial Highlights: Managing Well Through a Downturn TONS SHIPPED (000'S) AVERAGE SELLING PRICE PER TON ,824 1,722 1,606 1,517 1,470 Q1 '15 Q2 '15 Q3 '15 Q4 '15 Q1 '16 Q1 '15 Q2 '15 Q3 '15 Q4 '15 Q1 '16 GROSS MARGIN GROSS MARGIN EXCL. LIFO 17.3% 19.7% 19.0% 15.2% 21.0% 15.9% 15.3% 16.3% 16.8% 18.9% Q1 '15 Q2 '15 Q3 '15 Q4 '15 Q1 '16 Q1 '15 Q2 '15 Q3 '15 Q4 '15 Q1 '16 20
21 Quarterly Financial Highlights: Managing Well Through a Downturn NET INCOME ($M) ADJ. EBITDA EXCL. LIFO ($M) $16 $7 $14 ($3) ($21) Q1 '15 Q2 '15 Q3 '15 Q4 '15 Q1 '16 $36 $29 $30 $37 $14 Q1 '15 Q2 '15 Q3 '15 Q4 '15 Q1 '16 21
 Reduced Debt")

22 Ongoing Debt Reduction Through an Industry Downturn N E T D E B T ( $ M ) Reduced Debt $286M $1,188 $1,127 $1,070 $1,043 $958 $902 Q4 '14 Q1 '15 Q2 '15 Q3 '15 Q4 '15 Q1 '16 22

23 Investing in the Business More than $100 million in growth capex since 2010, expanding value-added capabilities Developed and enhanced intelligent systems for connecting people, supply chains, inventory, fixed assets and logistics for exceptional customer experiences Six bolt-on acquisitions since 2010 Accretive to earnings and margins Focus on value-added processing Broaden transactional customer portfolio Enhance supply chain network and service points JASON CHONTOS, MAC BHAGWANDINE OPERATIONS SUPERVISOR, LINE PACKAGER BURNS HARBOR, ILLINOIS 23

24 C O N C L U S I O N M I K E B U R B A C H P R E S I D E N T, N O R T H - W E S T R E G I O N


25 Conclusion Industry-leading expense and working capital management Enhancing margins with greater value-add Building sustainable competitive advantages to fuel growth Excellent execution and market share gains Generating strong cash flows and reducing debt balances Rising prices expected to impact operating trends starting in 2Q 16 SHAWN ZUK SLITTER OPERATOR BURNS HARBOR, ILLINOIS 25

26 A P P E N D I X


27 Ryerson s DNA ANALYTICS SPEED CULTURE VALUE-ADD SCALE 27

28 Ryerson s Periodic Table : How We Deliver Value to Customers FAB BURN/CUT AS IS FAB CARBON STAINLESS ALUMINUM AS IS BURN/CUT FLAT LONG PLATE METAL SHAPE PROCESSING 28

29 Leveraging Scale and Integrated Network BENEFITS Better asset utilization: Service Center 12 Multi-Markets Ryerson Integrated Network of Approximately 100 Locations Shared and optimized inventory Shared processing equipment Shared human resources More responsive customer service and prospecting: Local service center Ryerson.com / e-commerce After hours call centers 29
30 Tailwinds Forming in our End Markets End Market Customer Recent End Market Commentary Industry Growth Outlook HVAC Commercial Ground Transportation Metal Fabrication and Machine Shops Industrial Machinery and Equipment Strong performance in 2015; Continued improvement expected throughout 2016 Steady growth expected going forward after a 2016 reset due to previously strong environment Strong performance in 2015; Continued improvement expected throughout % ( Americas HVAC Market Revenue CAGR) Construction Equipment Transportation bill expected to drive infrastructure spend 5.8% ( U.S. Non-res. Construction Put in Place CAGR) 4.3% ( U.S. Medium and Heavy Truck Volume CAGR) 3.5% ( U.S. Fabricated Metal Production Shipments CAGR) Consumer Durables Improvements driven by consumer spending 3.1% ( U.S. Major Household Appliance Demand CAGR) Agricultural Equipment Food Processing Oil & Gas Sources: Wall Street Research. Steady growth expected going forward after a 2016 reset due to previously strong environment Tied to strong consumer spending levels Maintains consistent growth profile 2.0% ( U.S. Machinery Market Value CAGR) Declines continued throughout 2015; Long-term stabilization and growth expected 3.1% ( U.S. Agricultural Machinery Volume CAGR) 2.7% ( U.S. Food, Beverage and Tobacco Processing Equipment Value CAGR) Return to growth in 2017 (North America E&P Capex Spend) 30
31 Ryerson Expects to Benefit from Commodity Price Increases Beginning in 2Q 2016 Trade Cases Carbon sheet case rulings Recently filed actions on stainless by US producers against China Newly filed case on coiled carbon plate against 12 countries ENFORCE Act & TPA better trade case accountability EU & India also targeting Chinese overcapacity with trade cases Overall environment shifting to a domestic offshore rebalancing 31
32 Counter-Cyclical Cash Flow: $281M Generated Over 13 Quarters Cash Flow from Operations ($M) $259 $162.9 $48 $47 ($73) Q1 '16 32
33 Adequate Availability and Liquidity to Finance RYI s Business Plan $ $ Q4-15 Q1-16 North American Availability Foreign Availability Cash & Equivalents 33
34 Non-GAAP Reconciliation EBITDA represents net income before interest and other expense on debt, provision for income taxes, depreciation and amortization. Adjusted EBITDA gives further effect to, among other things, impairment charges on assets, reorganization expenses and the payment of management fees. We believe that the presentation of EBITDA, Adjusted EBITDA, Adjusted EBITDA, excluding LIFO expense (income), and other non-gaap numbers included in the presentation provides useful information to investors regarding our operational performance because they enhance an investor s overall understanding of our core financial performance and provides a basis of comparison of results between current, past and future periods. We also disclose the metric adjusted EBITDA, excluding LIFO expense (income), to provide a means of comparison amongst our competitors who may not use the same basis of accounting for inventories. EBITDA, Adjusted EBITDA and Adjusted EBITDA, excluding LIFO expense (income), are three of the primary metrics management uses for planning and forecasting in future periods, including trending and analyzing the core operating performance of our business without the effect of U.S. generally accepted accounting principles, or GAAP, expenses, revenues and gains (losses) that are unrelated to the day to day performance of our business. We also establish compensation programs for our executive management and regional employees that are based upon the achievement of pre-established EBITDA, Adjusted EBITDA and Adjusted EBITDA, excluding LIFO expense (income), targets. We also use EBITDA, Adjusted EBITDA and Adjusted EBITDA, excluding LIFO expense (income), to benchmark our operating performance to that of our competitors., EBITDA, Adjusted EBITDA and Adjusted EBITDA, excluding LIFO expense (income) do not represent, and should not be used as a substitute for, net income or cash flows from operations as determined in accordance with generally accepted accounting principles, and neither EBITDA, Adjusted EBITDA and Adjusted EBITDA, excluding LIFO expense (income), is necessarily an indication of whether cash flow will be sufficient to fund our cash requirements. This presentation also presents gross margin, excluding LIFO expense (income), which is calculated as gross profit plus LIFO expense (or minus LIFO income), divided by net sales. We have excluded LIFO expense (income) from the gross margin and Adjusted EBITDA as a percentage of net sales metrics in order to provide a means of comparison amongst our competitors who may not use the same basis of accounting for inventories as we do. We also have disclosed the metric warehousing, delivery, selling, general and administrative expenses excluding depreciation and amortization and IPO expenses to provide a means of comparison to our prior periods that do not include IPO-related expenses. Our definitions of EBITDA, Adjusted EBITDA, Adjusted EBITDA, excluding LIFO expense (income), gross margin, excluding LIFO expense (income), and Adjusted EBITDA, excluding LIFO expense (income), as a percentage of sales may differ from that of other companies. Net income (loss) and earnings (loss) per share excluding impairment charges on assets and gain on debt retirement is presented to provide a means of comparison with periods that do not include impairment charges on assets and gain on debt retirement. 34
35 Non-GAAP Reconciliation ($M) Net Sales 3, , , , , ,167.2 Gross Profit LIFO Expense (Income) (63.1) (33.0) 42.3 (59.5) Gross Profit, excluding LIFO Gross Margin, excluding LIFO 15.2% 15.0% 16.1% 16.9% 17.6% 16.0% Warehousing, delivery, selling, general and administrative expenses IPO-related expenses Depreciation and amortization expense Warehousing, delivery, selling, general and administrative expenses excluding Depreciation and Amortization and IPO-related expenses Expense excluding Depreciation and Amortization, impairment, restructuring, and IPO-related expenses % of Net Sales 12.0% 10.5% 11.5% 12.5% 11.9% 12.9% Net Income (loss) attributable to Ryerson Holding (104.0) (8.1) (25.7) (0.5) Interest and other expense on debt Provision (benefit) for income taxes 13.1 (11.0) (5.5) (112.3) (0.7) 3.7 Depreciation and amortization expense EBITDA Reorganization Gain on sale of assets (1.8) (1.9) Gain on settlements (2.6) (0.4) (4.4) Advisory service fee Loss of retirement of debt (0.3) Foreign currency transaction (gains) losses (3.7) (5.3) (1.5) Impairment charges on fixed assets and goodwill Gain on bargain purchase - (5.8) Purchase consideration and other transaction costs Other adjustments (0.8) Adjusted EBITDA LIFO Expense (Income) (63.1) (33.0) 42.3 (59.5) Adjusted EBITDA, excluding LIFO Adjusted EBITDA Margin, excluding LIFO 3.4% 4.7% 5.0% 4.9% 6.0% 3.4% 35
36 Non-GAAP Reconciliation RYERSON HOLDING CORPORATION AND SUBSIDIARY COMPANIES Reconciliation of Net Income (Loss) and Earnings (Loss) per Share Excluding Impairment Charges on Assets and Gain on Debt Retirement (Dollars and Shares in Millions, Except Per Share Data) First Quarter Dollars and Shares in Millions, Except per Share Data Q1 '16 Q1 '15 Net Income (loss) attributable to Ryerson Holding Corporation $ 13.5 $ (2.5) Earnings (loss) per share, basic and diluted $0.42 ($0.08) Impairment charges on assets and gain on debt retirement to exclude: Impairment charges on assets Gain on debt retirement (8.2) - Provision (benefit) for income taxes 2.9 (4.9) Net income (loss) attributable to Ryerson Holding Corporation, excluding impairment charges on assets and gain on debt retirement $ 8.2 $ 4.9 Earnings (loss) per share, excluding impairment charges on assets and gain on debt retirement - basic and diluted $ 0.26 $ 0.15 Shares outstanding - basic and diluted Note: Net income (loss) and Earnings (loss) per share excluding impairment charges on assets and gain on debt retirement is presented to provide a means of comparison with periods that do not include impairment charges on assets and gain on debt retirement. 36
37 Non-GAAP Reconciliation ($M) Q1 '15 Q2 '15 Q3 '15 Q4 '15 Q1 '16 Net income (loss) attributable to Ryerson Holding Corporation (2.5) (20.5) 13.5 Interest and other expense on debt Provision (benefit) for income taxes (0.2) (12.4) 8.1 Depreciation and amortization expense EBITDA (1.3) 54.5 Reorganization Gain on sale of assets (1.9) - Gain on settlements (4.4) - (Gain) loss on retirement of debt (1.0) - (8.2) Foreign currency transaction (gains) losses (1.6) 0.5 (0.1) (0.3) 2.9 Impairment charges on assets Purchase consideration and other transaction costs Other adjustments - (0.1) (0.1) Adjusted EBITDA LIFO expense (income), net (12.0) (37.0) (21.3) 10.8 (14.8) Adjusted EBITDA, excluding LIFO expense (income), net Net sales Adjusted EBITDA, excluding LIFO expense (income), net, as a percentage of net sales 4.1% 3.5% 3.8% 2.1% 5.3% Gross profit LIFO expense (income), net (12.0) (37.0) (21.3) 10.8 (14.8) Gross profit, excluding LIFO expense (income), net Gross margin, excluding LIFO expense (income), net 15.9% 15.3% 16.3% 16.8% 18.9% 37
38 Net Debt Calculation ($M) Q4 '14 Q1 '15 Q2 '15 Q3 '15 Q4 '15 Q1 '16 Total Debt 1, , , , , Less: Cash and cash equivalents Less: Marketable securities Net Debt 1, , , ,
39
Loop Capital Metals & Mining Conference. March 2017
 Loop Capital Metals & Mining Conference March 2017 1 IMPORTANT INFORMATION ABOUT RYERSON HOLDING CORPORATION These materials do not constitute an offer or solicitation to purchase or sell securities of
BANK OF AMERICA MERRILL LYNCH 2015 LEVERAGED FINANCE CONFERENCE. D e c e m b e r 3,
 BANK OF AMERICA MERRILL LYNCH 2015 LEVERAGED FINANCE CONFERENCE D e c e m b e r 3, 2 0 1 5 IMPORTANT INFORMATION ABOUT RYERSON HOLDING CORPORATION These materials do not constitute an offer or solicitation
KeyBanc Capital Markets Basic Materials and Packaging Conference. September 2017
 KeyBanc Capital Markets Basic Materials and Packaging Conference September 2017 1 Important Information About Ryerson Holding Corporation These materials do not constitute an offer or solicitation to purchase
BAML Leveraged Finance Conference. November 2017
 BAML Leveraged Finance Conference November 2017 1 Important Information About Ryerson Holding Corporation These materials do not constitute an offer or solicitation to purchase or sell securities of Ryerson
J P M O R G A N J P M O R G A N G L O B A L H I G H Y I E L D C O N F E R E N C E
 J P M O R G A N GLO BAL H I GH YIELD AND LEVERAGED FINANCE CONFERENCE February 29, 2016 1 1 IMPORTANT INFORMATION ABOUT RYERSON HOLDING CORPORATION These materials do not constitute an offer or solicitation
Jefferies Steel & Metals Summit. June 2018
 Jefferies Steel & Metals Summit June 2018 1 Important Information About Ryerson Holding Corporation These materials do not constitute an offer or solicitation to purchase or sell securities of Ryerson
2018 SECOND QUARTER FINANCIAL RESULTS
 2018 SECOND QUARTER FINANCIAL RESULTS July 30, 2018 0 SAFE HARBOR STATEMENT The 2018 second quarter news release, conference call webcast, and the following slides contain forward-looking statements. The
1Q 2017 EARNINGS PRESENTATION MAY 10, 2017
 1Q 2017 EARNINGS PRESENTATION MAY 10, 2017 Real Industry, Inc. 17 State Street, Suite 3811, New York, NY 10004 www.realindustryinc.com Real Alloy, Inc. 3700 Park East Dr., Suite 300, Beachwood, OH 44122
Financial Results: Fourth Quarter & Fiscal October 24, 2017
 Financial Results: Fourth Quarter & Fiscal 2017 October 24, 2017 Safe Harbor SAFE HARBOR Statements and information included in this presentation by Schnitzer Steel Industries, Inc. (the "Company") that
Rent-A-Center today is
 INVESTOR PRESENTATION FIRST QUARTER 2014 Safe Harbor This presentation contains forward-looking statements that involve risks and uncertainties. Such forward-looking statements generally can be identified
FOURTH QUARTER 2017 EARNINGS PRESENTATION FEBRUARY 8, 2018
 FOURTH QUARTER 2017 EARNINGS PRESENTATION FEBRUARY 8, 2018 REGARDING FORWARD-LOOKING STATEMENTS Statements contained in this press release that are not historical facts are forward-looking statements.
November 7, Q 2017 Earnings Presentation
 November 7, 2017 3Q 2017 Earnings Presentation Forward Looking Statements 2 This presentation contains certain statements that may be deemed forward-looking statements within the meaning of Section 21E
EARNINGS PRESENTATION
 EARNINGS PRESENTATION Fourth Quarter & Full Year 2017 Aleris Corporation March 19, 2018 Forward-Looking and Other Information IMPORTANT INFORMATION This information is current only as of its date and may
Fourth Quarter & Full Year 2016 Earnings Call
 Fourth Quarter & Full Year 2016 Earnings Call February 23, 2017 Rob Wagman President & Chief Executive Officer Nick Zarcone Executive Vice President & Chief Financial Officer Joe Boutross Director, Investor
INVESTOR PRESENTATION SEPTEMBER 2015
 INVESTOR PRESENTATION SEPTEMBER 2015 FORWARD LOOKING STATEMENTS This Presentation contains certain statements that are, or may be deemed to be, forwardlooking statements within the meaning of the Private
Investor Presentation
 Investor Presentation May 2018 SAFE HARBOR STATEMENT & NON-GAAP MEASURES Forward-Looking Statements Statements in this presentation concerning the Company s goals, strategies, and expectations for business
Horizon Global First Quarter 2016 Earnings Presentation
 Horizon Global First Quarter 2016 Earnings Presentation May 3, 2016 1 Safe Harbor Statement Forward-Looking Statements This presentation may contain "forward-looking statements" as defined in the Private
Third Quarter 2015 Earnings Call October 29, 2015
 Third Quarter 2015 Earnings Call October 29, 2015 Rob Wagman President & Chief Executive Officer Nick Zarcone Executive Vice President & Chief Financial Officer Joe Boutross Director, Investor Relations
We Distribute Products That Deliver Energy to the World. NOW Inc., Fourth Quarter and Full-Year 2017 Review & Key Takeaways
 We Distribute Products That Deliver Energy to the World NOW Inc., Fourth Quarter and Full-Year 2017 Review & Key Takeaways Forward Looking Statements Statements made in the course of this presentation
3 rd Quarter 2013 Earnings Presentation
 Click to edit Master title style 3 rd Quarter 203 Earnings Presentation November 6 th, 203 Click Disclaimers to edit Master title style IMPORTANT INFORMATION This information is current only as of its
Financial Results: Third Quarter Fiscal June 26, 2018
 Financial Results: Third Quarter Fiscal 2018 June 26, 2018 Safe Harbor SAFE HARBOR Statements and information included in this presentation by Schnitzer Steel Industries, Inc. (the "Company") that are
BMC STOCK HOLDINGS, INC. Second Quarter 2018 Earnings Presentation July 30, BMC. All Rights Reserved.
 BMC STOCK HOLDINGS, INC. Second Quarter 2018 Earnings Presentation July 30, 2018 2018 BMC. All Rights Reserved. CLICK Disclaimer TO EDIT TITLE This presentation contains "forward-looking statements" within
A. M. CASTLE & CO. A. M. CASTLE & CO. REPORTS FIRST QUARTER 2015 RESULTS
 A. M. CASTLE & CO. 1420 Kensington Road Suite 220 Oak Brook, IL 60523 P: (847) 455-7111 F: (847) 241-8171 For Further Information: - At ALPHA IR - Analyst Contact: Chris Hodges or Monica Gupta (312) 445-2870
2 nd Quarter 2013 Earnings Presentation
 Click to edit Master title style 2 nd Quarter 203 Earnings Presentation August st, 203 Click Disclaimers to edit Master title style IMPORTANT INFORMATION This information is current only as of its date
SunCoke Energy, Inc. Q Earnings Conference Call January 30, 2014
 SunCoke Energy, Inc. Q4 2013 Earnings Conference Call January 30, 2014 TM Forward-Looking Statements This slide presentation should be reviewed in conjunction with the Fourth Quarter 2013 earnings releases
Investor Presentation
 Investor Presentation November 2018 Nasdaq: SCHN Safe Harbor SAFE HARBOR Statements and information included in this presentation by Schnitzer Steel Industries, Inc. (the "Company") that are not purely
PROPOSED COMBINATION OF KRATON PERFORMANCE POLYMERS, INC. WITH THE SBC BUSINESS OF LCY CHEMICAL CORP.
 UPDATE CALL PROPOSED COMBINATION OF KRATON PERFORMANCE POLYMERS, INC. WITH THE SBC BUSINESS OF LCY CHEMICAL CORP. KRATON PERFORMANCE POLYMERS, INC. KEVIN M. FOGARTY, PRESIDENT AND CHIEF EXECUTIVE OFFICER
Fourth Quarter and Full Year Earnings Call March 1, 2019
 Fourth Quarter and Full Year Earnings Call March 1, 2019 Safe Harbor & Non-GAAP Financial Measures Cautionary Notice Statements in this news release and the schedules hereto that are not purely historical
Daseke, Inc. Consolidating North America s Flatbed & Specialized Logistics Market
 Daseke, Inc. Consolidating North America s Flatbed & Specialized Logistics Market Investor Presentation September 2017 Important Disclaimers Non-GAAP Financial Measures This presentation includes non-gaap
FINANCIAL RESULTS AND COMPANY OVERVIEW Second-Quarter Performance
 FINANCIAL RESULTS AND COMPANY OVERVIEW 08 Second-Quarter Performance September 5 th, 08 Disclaimer Forward-Looking Statements and Preliminary Results This presentation includes forward-looking statements
Investor Presentation
 Investor Presentation November 2018 SAFE HARBOR STATEMENT & NON-GAAP MEASURES Statements in this presentation include forward-looking statements within the meaning of the Private Securities Litigation
First Quarter 2017 Results & Outlook for May 2, 2017
 First Quarter 2017 Results & Outlook for 2017 May 2, 2017 Forward-Looking Statements and Risk Factors This presentation contains statements which constitute forward-looking statements, within the meaning
2018 Second Quarter Earnings Call. May 8, 2018
 2018 Second Quarter Earnings Call May 8, 2018 Forward Looking Statements / Non-GAAP Measures This presentation contains information about management's view of the Company's future expectations, plans and
2016 Third Quarter Earnings Conference Call
 November 1, 2016 NYSE: GLT 2016 Third Quarter Earnings Conference Call Dante C. Parrini, Chairman & CEO John P. Jacunski, EVP, CFO & President, Specialty Papers Forward-Looking Statements and Use of Non-GAAP
Veritiv Corporation Fourth Quarter and Full Year 2018 Financial Results February 28, 2019
 Veritiv Corporation Fourth Quarter and Full Year 2018 Financial Results February 28, 2019 Tom Morabito Director of Investor Relations 2 Safe Harbor Provision Certain statements contained in this presentation
2018 RBC Capital Markets Global Industrials Conference September 8, 2018
 2018 RBC Capital Markets Global Industrials Conference September 8, 2018 Safe Harbor and Non-GAAP Financial Metrics Certain statements in this presentation may be deemed to be forward-looking. These statements
Veritiv Corporation Second Quarter 2016 Financial Results August 9, 2016
 Veritiv Corporation Second Quarter 2016 Financial Results August 9, 2016 Tom Morabito Director of Investor Relations 2 Safe Harbor Provision Certain statements contained in this presentation regarding
Q4 & FY 2017 EARNINGS PRESENTATION MARCH 13, 2018
 Q4 & FY 2017 EARNINGS PRESENTATION MARCH 13, 2018 FORWARD-LOOKING STATEMENTS & NON-GAAP FINANCIAL INFORMATION 2 FORWARD-LOOKING STATEMENTS This presentation contains, and management may make on our call
NCI Building Systems CFO Commentary on Fourth Quarter 2015 Fiscal Year Results
 NCI Building Systems CFO Commentary on Fourth Quarter 2015 Fiscal Year Results Summary The fourth quarter 2015 results compared to last year s fourth quarter were as follows: Revenue of $459.8 million
Forward-Looking Statements
 William Blair & Company 27 th Annual Growth Stock Conference June 20, 2007 0 Forward-Looking Statements This presentation contains forward-looking statements that are subject to a number of risks and uncertainties,
Copyright 2018 CPI Card Group. Fourth Quarter & FY 2017 Earnings Conference Call March 12, 2018
 Fourth Quarter & FY 2017 Earnings Conference Call March 12, 2018 Safe Harbor Forward-Looking Statements Statements in this presentation that are not statements of historical fact are forward-looking statements
Daseke, Inc. Consolidating the Open Deck Specialized Logistics Market Q Earnings May 2017
 Daseke, Inc. Consolidating the Open Deck Specialized Logistics Market Q1 2017 Earnings May 2017 Important Disclaimers Forward-Looking Statements This presentation includes forward-looking statements within
Veritiv Corporation First Quarter 2018 Financial Results May 8, 2018
 Veritiv Corporation First Quarter 2018 Financial Results May 8, 2018 Tom Morabito Director of Investor Relations 2 Safe Harbor Provision Certain statements contained in this presentation regarding Veritiv
HORIZON GLOBAL DRIVEN TO DELIVER. 28 th Annual Roth Conference March 2016 NYSE: HZN
 HORIZON GLOBAL DRIVEN TO DELIVER 28 th Annual Roth Conference March 2016 1 Safe Harbor Statement Forward-Looking Statements This presentation may contain "forward-looking statements" as defined in the
Glatfelter (NYSE: GLT) 2014 Second Quarter Earnings Conference Call July 29, 2014
 2014 Second Quarter Earnings Conference Call July 29, 2014") Glatfelter (NYSE: GLT) 2014 Second Quarter Earnings Conference Call July 29, 2014 Dante C. Parrini Chairman & Chief Executive Officer John P. Jacunski Executive Vice President & Chief Financial Officer
Glatfelter (NYSE: GLT) 2014 Second Quarter Earnings Conference Call July 29, 2014 Dante C. Parrini Chairman & Chief Executive Officer John P. Jacunski Executive Vice President & Chief Financial Officer
FOURTH QUARTER 2018 REVIEW FEBRUARY 7, 2019
 FOURTH QUARTER 2018 REVIEW FEBRUARY 7, 2019 REGARDING FORWARD LOOKING STATEMENTS Statements contained in this press release that are not historical facts are forward looking statements. Forward looking
September Colliers International Group Inc. Investor Presentation
 September 2018 Colliers International Group Inc. Investor Presentation Basis Of Presentation All amounts in millions of US Dollars unless otherwise noted. Adjusted EBITDA ( AEBITDA ) and Adjusted EPS (
Fourth-Quarter 2009 Earnings Presentation
 Fourth-Quarter 2009 Earnings Presentation Ursula Burns Chief Executive Officer Larry Zimmerman Vice Chairman & CFO January 21, 2010 Forward-Looking Statements This presentation contains "forward-looking
4Q 2017 Presentation. February 27, 2018
 4Q 2017 Presentation February 27, 2018 SAFE HARBOR Statements contained in this presentation that are not historical and reflect our views about future periods and events, including our future performance,
THIRD QUARTER FISCAL YEAR 2018 Earnings Conference Call & Presentation. August 7, 2018 at 9:00 a.m. CT (10:00 a.m. ET)
") THIRD QUARTER FISCAL YEAR 2018 Earnings Conference Call & Presentation August 7, 2018 at 9:00 a.m. CT (10:00 a.m. ET) 1 Third Quarter Fiscal Year 2018 Welcome to Nexeo s Earnings Conference Call and Presentation
THIRD QUARTER FISCAL YEAR 2018 Earnings Conference Call & Presentation August 7, 2018 at 9:00 a.m. CT (10:00 a.m. ET) 1 Third Quarter Fiscal Year 2018 Welcome to Nexeo s Earnings Conference Call and Presentation
3Q 18 Earnings Call Presentation NOVEMBER 1, 2018
 3Q 18 Earnings Call Presentation NOVEMBER 1, 2018 1 Important Disclaimer This presentation contains certain statements and information that may constitute forward-looking statements within the meaning
Non-GAAP Reconciliations Third Quarter 2016 Published November 9, 2016
 Non-GAAP Reconciliations Third Quarter 2016 Published November 9, 2016 We supplement our financial information prepared in accordance with GAAP with certain non-gaap measures including Adjusted EBITDA
William Blair Growth Stock Conference June 15, Member FINRA/SIPC
 William Blair Growth Stock Conference June 15, 2011 Member FINRA/SIPC Safe Harbor Disclosure The following information contains forward-looking statements. Forward-looking statements include statements
Veritiv Corporation Fourth Quarter and Fiscal Year 2017 Financial Results March 1, 2018
 Veritiv Corporation Fourth Quarter and Fiscal Year 2017 Financial Results March 1, 2018 Tom Morabito Director of Investor Relations 2 Safe Harbor Provision Certain statements contained in this presentation
CME Group 3Q 2015 Earnings Conference Call
 CME Group 3Q 2015 Earnings Conference Call October 29, 2015 Forward Looking Statements Statements in this presentation that are not historical facts are forward-looking statements. These statements are
Financial Results for Third Quarter Ended Sep 30, Pilgrim s Pride Corporation (NASDAQ: PPC)
") Financial Results for Third Quarter Ended Sep 30, 2018 Pilgrim s Pride Corporation (NASDAQ: PPC) Cautionary Notes and Forward-Looking Statements Statements contained in this presentation that share our
Financial Results for Third Quarter Ended Sep 30, 2018 Pilgrim s Pride Corporation (NASDAQ: PPC) Cautionary Notes and Forward-Looking Statements Statements contained in this presentation that share our
2016 Second Quarter Earnings Conference Call
 August 2, 2016 NYSE: GLT 2016 Second Quarter Earnings Conference Call Dante C. Parrini, Chairman & CEO John P. Jacunski, EVP, CFO & President, Specialty Papers Forward-Looking Statements and Use of Non-GAAP
Manning & Napier Investor Presentation June 2014
 Manning & Napier Investor Presentation June 2014 The Manning & Napier Fund, Inc. is managed by Manning & Napier Advisors, LLC ( Manning & Napier ). Manning & Napier Investor Services, Inc. and affiliate
Veritiv Corporation Third Quarter 2017 Financial Results November 7, 2017
 Veritiv Corporation Third Quarter 2017 Financial Results November 7, 2017 Tom Morabito Director of Investor Relations 2 Safe Harbor Provision Certain statements contained in this presentation regarding
NCI Building Systems Reports Strong Second Fiscal Quarter 2016 Results
 NEWS RELEASE NCI Building Systems Reports Strong Second Fiscal Quarter 2016 Results HOUSTON, May 31, 2016 NCI Building Systems, Inc. (NYSE: NCS) ( NCI or the Company ) today reported financial results
2016 Fourth-Quarter and Fiscal Year Performance
 206 Fourth-Quarter and Fiscal Year Performance Financial Results and Company Highlights March 4, 207 Disclaimers Forward-Looking Statements and Preliminary Results This presentation includes forward-looking
Q EARNINGS CALL JULY 26, 2018
 Q2 2018 EARNINGS CALL JULY 26, 2018 IMPORTANT INFORMATION Forward Looking Statements These slides contain (and the accompanying oral discussion will contain) forward looking statements. All statements
Presented by: David Little Chairman, President & CEO. Kent Yee Senior Vice President & CFO NASDAQ: DXPE AUGUST 2017
 Presented by: David Little Chairman, President & CEO Kent Yee Senior Vice President & CFO Mac McConnell Senior Vice President & CAO NASDAQ: DXPE AUGUST 2017 FORWARD LOOKING STATEMENTS This presentation
Horizon Global Third Quarter 2017 Earnings Presentation
 Horizon Global Third Quarter 2017 Earnings Presentation October 31, 2017 Q1 2016 Earnings 1 Safe Harbor Statement Forward-Looking Statements This presentation may contain "forward-looking statements" as
WESCO International John Engel Chairman, President and CEO. William Blair & Company 36 th Annual Growth Stock Conference June 14, 2016
 WESCO International John Engel Chairman, President and CEO William Blair & Company 36 th Annual Growth Stock Conference June 14, 2016 Safe Harbor Statement Note: All statements made herein that are not
Investor Presentation. J.P. Morgan ATI Conference March 14, 2018 New York, NY
 Investor Presentation J.P. Morgan ATI Conference March 14, 2018 New York, NY Safe Harbor Statement This Presentation contains or incorporates by reference statements that are not historical in nature and
AMD Reports 2016 Fourth Quarter and Annual Results - CFO Commentary January 31, 2017
 AMD Reports 2016 Fourth Quarter and Annual Results - CFO Commentary January 31, 2017 Reconciliation for all non-gaap financial measures discussed in this commentary to the most directly comparable GAAP
MSCI. J.P. Morgan Global High Yield & Leveraged Finance Conference Kathleen Winters, CFO. February 28, 2017
 MSCI J.P. Morgan Global High Yield & Leveraged Finance Conference Kathleen Winters, CFO February 28, 2017 2017 MSCI Inc. All rights reserved. Please refer to the disclaimer at the end of this document.
American Railcar Industries, Inc.
 American Railcar Industries, Inc. Exhibit 99.2 Q4 2017 Supplemental Information Investor Contact: 636.940.6000 Website: americanrailcar.com Forward Looking Disclaimer Safe Harbor Statement This presentation
FINANCIAL REVIEW. R. Steve Kinsey. Chief Financial Officer and Chief Administrative Officer
 FINANCIAL REVIEW R. Steve Kinsey Chief Financial Officer and Chief Administrative Officer Information Regarding Forward-Looking Statements Statements contained in this press release that are not historical
Non-GAAP Reconciliations Second Quarter 2017 Published August 2, 2017
 Non-GAAP Reconciliations Second Quarter 2017 Published August 2, 2017 We supplement our financial information prepared in accordance with GAAP with certain non-gaap measures including Adjusted EBITDA (earnings
2018 First Quarter Earnings Call. February 8, 2018
 2018 First Quarter Earnings Call February 8, 2018 Forward Looking Statements / Non-GAAP Measures This presentation contains information about management's view of the Company's future expectations, plans
Investor Presentation. Second Quarter 2018 NASDAQ: BECN BECN
 Investor Presentation Second Quarter 2018 BECN 1 Disclosures Forward Looking Statements and Non-GAAP Measures This presentation contains forward-looking statements within the meaning of the Private Securities
INFORMATION PACKAGE FOR INVESTOR CONFERENCE CALL AUGUST 10, 2018
 INFORMATION PACKAGE FOR INVESTOR CONFERENCE CALL AUGUST 10, 2018 INFORMATION PACKAGE FOR INVESTOR CONFERENCE CALL AUGUST 10, 2018 I N D E X Cautionary Statement on Forward-Looking Information... 3 Notes...
2018 FOURTH QUARTER EARNINGS CALL
 NORTH AMERICA S LEADING BUILDING MATERIALS DISTRIBUTOR RESIDENTIAL COMMERCIAL INTERIOR SOLAR 2018 FOURTH QUARTER EARNINGS CALL Forward Looking Statements / Non-GAAP Measures This presentation contains
A Leading National Provider of Post-Acute Services
 A Leading National Provider of Post-Acute Services February 2016 Safe Harbor Statement Certain statements in this presentation regarding the expected benefits of the Skilled Healthcare transaction, future
Second Quarter 2012 Earnings Conference Call August 7, 2012
 Momentive Performance Materials Inc. Second Quarter 2012 Earnings Conference Call August 7, 2012 1 Forward-Looking Statements Momentive Performance Materials Inc. (MPM) Certain statements in this presentation
INFORMATION PACKAGE FOR INVESTOR CONFERENCE CALL NOVEMBER 8, 2018
 INFORMATION PACKAGE FOR INVESTOR CONFERENCE CALL NOVEMBER 8, 2018 INFORMATION PACKAGE FOR INVESTOR CONFERENCE CALL NOVEMBER 8, 2018 I N D E X Cautionary Statement on Forward-Looking Information... 3 Notes...
Powering healthcare provider success
 Powering healthcare provider success Now and in the future Investor Information September 2018 TRANSFORMING HEALTHCARE TOGETHER Premier Inc. 2018 1 Forward-looking statements and non-gaap financial measures
Safe Harbor Statement N A S D A Q : H E A R
 Safe Harbor Statement Forward-Looking Information This presentation includes forward-looking statements within the meaning of the federal securities laws. These forward-looking statements are statements
MYERS INDUSTRIES, INC. MARCH 9, 2017 FOURTH QUARTER & FULL YEAR EARNINGS PRESENTATION
 MYERS INDUSTRIES, INC. MARCH 9, 2017 FOURTH QUARTER & FULL YEAR EARNINGS PRESENTATION SAFE HARBOR STATEMENT Statements in this presentation concerning the Company s goals, strategies, and expectations
Innophos Holdings, Inc. Reports Fourth-Quarter and Full-Year 2017 Results
 Innophos Holdings, Inc. Reports Fourth-Quarter and Full-Year 2017 Results February 21, 2018 Significant Progress Advancing Vision 2022 Strategy 2017 Revenue and Earnings In-Line with Expectations Sets
Fourth-Quarter 2015 Earnings Supporting Information. January 28, 2016
 Fourth-Quarter 2015 Earnings Supporting Information January 28, 2016 Forward-looking statements and non-gaap financial information This presentation includes forward-looking statements within the meaning
Veritiv Announces First Quarter 2018 Financial Results
 Veritiv Announces First Quarter 2018 Financial Results Reports First Quarter Net Sales of $2.1 Billion, Net Loss of $(15.8) Million, Basic and Diluted Loss per Share of $(1.00), and Adjusted EBITDA of
Forward Looking Disclaimer
 Exhibit 99.1 1 Forward Looking Disclaimer Forward Looking Disclaimer Safe Harbor Statement This presentation contains statements relating to our expected financial performance, objectives, long-term strategies
WESCO International John Engel Chairman, President and CEO. EPG Conference May 16, 2016
 WESCO International John Engel Chairman, President and CEO Safe Harbor Statement Note: All statements made herein that are not historical facts should be considered as forwardlooking statements within
IPG Investor Presentation
 IPG Investor Presentation September 2015 2 Safe Harbor Statement Certain statements and information included in this presentation constitute "forward-looking information" within the meaning of applicable
Novelis Q4 and Fiscal Year 2016 Earnings Conference Call
 Novelis Q4 and Fiscal Year 2016 Earnings Conference Call May 10, 2016 Steve Fisher President and Chief Executive Officer Steve Pohl Vice President and Interim Chief Financial Officer 1 Safe Harbor Statement
Investor Teleconference Presentation Third Quarter October 25, 2006
 Investor Teleconference Presentation October 25, 10/25/06 2 Earnings Teleconference Forward Looking Statements This document contains forward-looking statements within the meaning of the Private Securities
Non-GAAP Reconciliations Third Quarter 2017 Published November 7, 2017
 Non-GAAP Reconciliations Third Quarter 2017 Published November 7, 2017 We supplement our financial information prepared in accordance with GAAP with certain non-gaap measures including Adjusted EBITDA
4Q 2017 Highlights and Operating Results
 4Q 2017 Highlights and Operating Results January 30, 2018 1 4Q 2017 Highlights and Operating Results Table of Contents Page(s) 1 Sales Overview 4-8 2 Financial Performance Trends 9-16 3 Leverage Metrics
MSCI THIRD QUARTER 2016
 MSCI THIRD QUARTER 2016 Earnings Presentation October 27, 2016 2016 MSCI Inc. All rights reserved. Please refer to the disclaimer at the end of this document. FORWARD-LOOKING STATEMENTS Forward-Looking
Second-Quarter 2018 Earnings & Investor Presentation. July 26, 2018
 Second-Quarter 2018 Earnings & Investor Presentation July 26, 2018 Forward-looking statements and non-gaap financial information This presentation includes forward-looking statements within the meaning
Exhibit Q Supplemental Information
 Exhibit 99.2 Q2 2018 Supplemental Information 1 Forward Looking Disclaimer Forward Looking Disclaimer Safe Harbor Statement This presentation contains statements relating to our expected financial performance,
THIRD QUARTER 2018 FINANCIAL RESULTS OCTOBER 24, AMD Q FINANCIAL RESULTS OCTOBER 24, 2018
 THIRD QUARTER 2018 FINANCIAL RESULTS OCTOBER 24, 2018 1 AMD Q3 2018 FINANCIAL RESULTS OCTOBER 24, 2018 This presentation contains forward-looking statements concerning Advanced Micro Devices, Inc. (AMD)
RBC Midwest NDR NASDAQ: HEES. John Engquist CHIEF EXECUTIVE OFFICER Kevin Inda VICE PRESIDENT OF INVESTOR RELATIONS. Company Participants
 Company Participants John Engquist CHIEF EXECUTIVE OFFICER Kevin Inda VICE PRESIDENT OF INVESTOR RELATIONS NASDAQ: HEES August 15-16, 2018 2 Legal Disclaimers Forward-Looking Information This presentation
1Q 2018 Highlights and Operating Results
 1Q 2018 Highlights and Operating Results April 26, 2018 1 Table of Contents Page(s) 4 Announced Agreements to Acquire Australia and New Zealand Security Businesses 5-9 Sales Overview 10-17 Financial Performance
TMS International Corp. Reports Fourth Quarter. and Fiscal Year 2012 Results
 TMS International Corp. Reports Fourth Quarter and Fiscal Year 2012 Results PITTSBURGH, PA, February 14, 2013 TMS International Corp. (NYSE: TMS), the parent company of Tube City IMS Corporation, a leading
Bank of America Merrill Lynch NDR - NYC
 - NYC Company Participants Bank of America Merrill Lynch NDR - NYC John Engquist CHIEF EXECUTIVE OFFICER Brad Barber PRESIDENT AND CHIEF OPERATING OFFICER Kevin Inda VICE PRESIDENT OF INVESTOR RELATIONS
SENSATA FOURTH QUARTER AND FULL YEAR 2017 EARNINGS PRESENTATION FEBRUARY 1, 2018
 SENSATA FOURTH QUARTER AND FULL YEAR 2017 EARNINGS PRESENTATION FEBRUARY 1, 2018 Forward-Looking Statements This earnings presentation contains "forward-looking statements" within the meaning of Section