Investor Presentation
|
|
|
- Neal Morris
- 5 years ago
- Views:
Transcription


1 Investor Presentation November 2018 Nasdaq: SCHN
2 Safe Harbor SAFE HARBOR Statements and information included in this presentation by Schnitzer Steel Industries, Inc. (the "Company") that are not purely historical are forward-looking statements within the meaning of Section 21E of the Securities Exchange Act of 1934 and are made pursuant to the safe harbor provisions of the Private Securities Litigation Reform Act of Except as noted herein or as the context may otherwise require, all references to we, our, us, Company, Schnitzer, and SSI refer to the Company and its consolidated subsidiaries. Forward-looking statements in this presentation include statements regarding future events or our expectations, intentions, beliefs and strategies regarding the future, which may include statements regarding trends, cyclicality and changes in the markets we sell into; the Company's outlook, growth initiatives or expected results or objectives, including pricing, margins, sales volumes and profitability; strategic direction or goals; targets; changes to manufacturing and production processes; the cost of and the status of any agreements or actions related to our compliance with environmental and other laws; expected tax rates, deductions and credits and the impact of federal tax reform; the impact of tariffs, quotas and other trade actions; the realization of deferred tax assets; planned capital expenditures; liquidity positions; ability to generate cash from continuing operations; the potential impact of adopting new accounting pronouncements; obligations under our retirement plans; benefits, savings or additional costs from business realignment, cost containment and productivity improvement programs; and the adequacy of accruals. Forward-looking statements by their nature address matters that are, to different degrees, uncertain, and often contain words such as outlook, target, aim, believes, expects, anticipates, intends, assumes, estimates, evaluates, may, will, should, could, opinions, forecasts, projects, plans, future, forward, potential, probable, and similar expressions. However, the absence of these words or similar expressions does not mean that a statement is not forward-looking. We may make other forward-looking statements from time to time, including in reports filed with the Securities and Exchange Commission, press releases, presentations and on public conference calls. All forward-looking statements we make are based on information available to us at the time the statements are made, and we assume no obligation to update any forward-looking statements, except as may be required by law. Our business is subject to the effects of changes in domestic and global economic conditions and a number of other risks and uncertainties that could cause actual results to differ materially from those included in, or implied by, such forward-looking statements. Some of these risks and uncertainties are discussed in Item 1A. Risk Factors in Part I of our most recent Annual Report on Form 10-K, as supplemented by our subsequently filed Quarterly Reports on Form 10-Q. Examples of these risks include: potential environmental cleanup costs related to the Portland Harbor Superfund site or other locations; the cyclicality and impact of general economic conditions; changing conditions in global markets including the impact of tariffs, quotas and other trade actions; volatile supply and demand conditions affecting prices and volumes in the markets for both our products and raw materials we purchase; imbalances in supply and demand conditions in the global steel industry; the impact of goodwill impairment charges; the impact of long-lived asset and cost and equity method investment impairment charges; inability to sustain the benefits from productivity and restructuring initiatives; difficulties associated with acquisitions and integration of acquired businesses; customer fulfillment of their contractual obligations; increases in the relative value of the U.S. dollar; the impact of foreign currency fluctuations; potential limitations on our ability to access capital resources and existing credit facilities; restrictions on our business and financial covenants under our bank credit agreement; the impact of consolidation in the steel industry; inability to realize expected benefits from investments in technology; freight rates and the availability of transportation; the impact of equipment upgrades, equipment failures and facility damage on production; product liability claims; the impact of legal proceedings and legal compliance; the adverse impact of climate change; the impact of not realizing deferred tax assets; the impact of tax increases and changes in tax rules; the impact of one or more cybersecurity incidents; environmental compliance costs and potential environmental liabilities; inability to obtain or renew business licenses and permits or renew facility leases; compliance with climate change and greenhouse gas emission laws and regulations; reliance on employees subject to collective bargaining agreements; and the impact of the underfunded status of multiemployer plans in which we participate. NON-GAAP FINANCIAL MEASURES This presentation contains certain non-gaap financial measures as defined under SEC rules. Reconciliations of the non-gaap financial measures contained in this presentation to the most directly comparable U.S. GAAP measure are provided in the Appendix. These non-gaap financial measures should be considered in addition to, but not as a substitute for, the most directly comparable U.S. GAAP measures. 2

 Sourcing Scrap 52 auto parts stores purchase more than 400,000 salvage vehicles annually 44 metals recycling facilities collect")
 3.")
 Producer of Finished Steel and Recycled Metals Steel manufacturing facility in Oregon with effective annual production capacity of 580 thousand tons Long product")

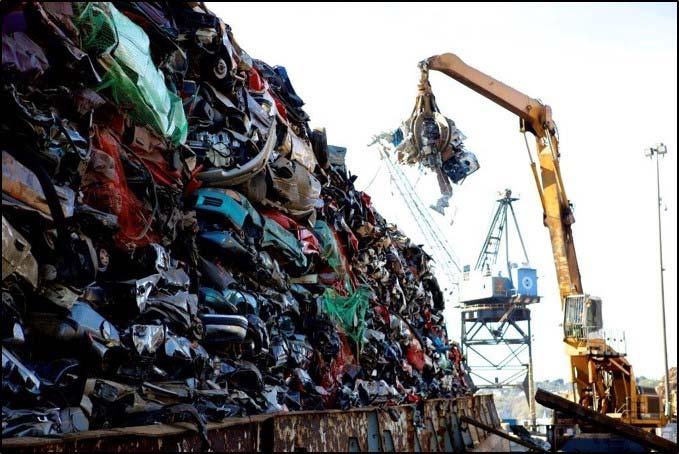
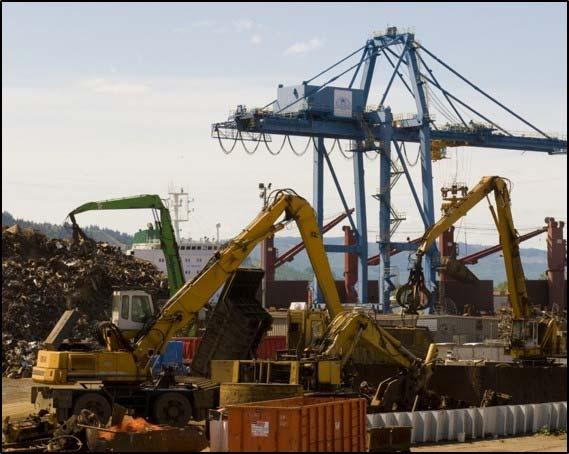
3 Company Overview Schnitzer Steel Industries, Inc. (SSI) is a leading North American Auto and Metals Recycler and West Coast Steel Manufacturer 4.3 million long tons of ferrous metal processed annually by SSI* 7 deep water ports on East and West Coasts, Hawaii and Puerto Rico serve domestic and global steel manufacturers Integrated operating platform includes auto parts stores with approximately 5 million annual retail visits Steel manufacturing operations produce finished steel products Auto and Metals Recycling (AMR) Sourcing Scrap 52 auto parts stores purchase more than 400,000 salvage vehicles annually 44 metals recycling facilities collect obsolete machinery and equipment, railroad cars and tracks, automobiles, home appliances, consumer goods, manufacturing, construction and demolition metal Processing Scrap Metal (Ferrous and Nonferrous) 3.7 million long tons of ferrous* and 572 million pounds of nonferrous metal annually for use in steel and other manufacturing globally Cascade Steel & Scrap (CSS) Electric Arc Furnace (EAF) Producer of Finished Steel and Recycled Metals Steel manufacturing facility in Oregon with effective annual production capacity of 580 thousand tons Long product producer of rebar and wire rod from recycled scrap for construction markets on the West Coast and Western Canada Also includes metals recycling and deep water export operation in Portland, OR with 4 metals recycling yards, selling externally and delivering to our steel mill approx. 0.6 million long tons of ferrous* metal annually Company data based on fiscal 2018 *Total SSI volumes are 4.3 million long tons of ferrous in fiscal 2018, including volumes sold externally by AMR and CSS and delivered to our steel mill for finished steel production. 3


 Domestic")
4 Geographic Platform Enables Worldwide Access Sourcing scrap through 96 auto parts and metals recycling facilities in North America and providing processed recycled metals to customers around the world Asia Americas EAME Southwest and Hawaii 29 AMR Northwest 15 AMR 5 CSS Midwest and South 18 AMR Northeast 11 AMR Southeast and Puerto Rico 19 AMR FY18 Ferrous Sales Volume Destinations Schnitzer export facilities Export destinations CSS Steel Mill (1) Europe, Africa and Middle East (2) Domestic includes CSS, brokerage and other 4
5 FY18 Financial Highlights Consolidated Adjusted Operating Income ($M) $147 Adjusted EPS* $5.39 $28 $ % $0.69 $ % FY16 FY17 FY18 FY16 FY17 FY18 3,289 SSI Volumes Ferrous (000s LT) 3,628 4, % 510 SSI Volumes Nonferrous (M LB) % FY16 FY17 FY18 FY16 FY17 FY18 Operating Cash Flow ($M) $160 $99 $ % $166 Net Debt ($M) $138 $103-38% FY16 FY17 FY18 FY16 FY17 FY18 Strategic initiatives to increase volumes and expand margins, supported by positive market conditions, have been delivering steady growth Note: For a reconciliation to U.S. GAAP of adjusted operating income and adjusted EPS from continuing operations, see appendix. *FY18 adjusted EPS includes discrete income tax benefits of $1.58 from the release of valuation allowances on deferred tax assets and tax reform. 5
6 Leading U.S. Economic Trends Industrial Production (Monthly % Δ YOY) Personal Consumption Expenditures & Consumer Confidence Housing Starts (000s) 50,000 Appliance Shipments 20 Light Vehicle Sales (Autos in M) ,000 40,000 35,000 Vehicle Sales Average Age 30, US Light Vehicle Sales Ms (LHS) Average Age in Years* (RHS) Source: Federal Reserve, US Census Bureau, Whirlpool Corporation estimates of US appliance shipments, Conference Board, KeyBanc Research estimates, AHAM, BTS *2018 Average Age in Years is a forecast amount 6

7 Metal Market Trends Ferrous Market Price Trends Iron Ore & Met Coal Price Trends 4Q17 ($/ton) 4Q18 4Q17 ($/ton) 4Q18 Aluminum vs. Zorba Market Price Trends 4Q17 4Q Chinese Steel Export & Utilization Trends 37% decrease from % 85% 65 80% % 5 70% TTM** Chinese Steel Exports mmt LHS Chinese Utilization Rate % RHS Sources: Platts, Argus, AMM.com, Worldsteel.org, OECD CFR price includes loading and transportation costs to the destination port; FOB price only includes loading and transportation costs to the named location. *Aluminum based on 3 Mo LME Aluminum, and Aluminum Scrap Zorba is CIF China prices. **Trailing 12 months ended August 31,
 Import prices exclude tariffs and other duties Import prices* 4Q18 800 600 400 200 US Imports of Rebar Products (000s of tons) Announcement of Section 232")
8 Steel Market Trends $775 $675 $575 $475 $375 $275 Rebar Market Price Trends 4Q17 Jan 17 Feb 17 Mar 17 Apr 17 May 17 Jun 17 Jul 17 Aug 17 Sep 17 Oct 17 Nov 17 Dec 17 Jan 18 Feb 18 Mar 18 Apr 18 May 18 Jun 18 Jul 18 Aug 18 Domestic prices* ($/ST) Import prices exclude tariffs and other duties Import prices* 4Q US Imports of Rebar Products (000s of tons) Announcement of Section 232 tariffs with temporary exemptions U.S. Department of Commerce initiated Section 232 investigation 1Q 2Q 3Q 4Q 1Q 2Q 3Q 4Q 1Q 2Q 3Q 4Q 1Q 2Q 3Q 4Q 1Q 2Q 3Q 4Q 1Q 2Q 3Q 4Q 1Q 2Q 3Q 4Q FY12 FY13 FY14 FY15 FY16 FY17 FY18 Fiscal Year Historical Rebar and Domestic Scrap Prices ($/ST) Average 4Q18 domestic rebar market prices were up $178/short ton or 34%, YoY Increases in selling prices outpaced increases in the cost of steelmaking raw materials Recent import prices (including duties/tariffs) tracking higher than domestic prices, further reflecting the impact of Section 232 measures Rebar prices approximate FY11 levels Rebar to scrap spread higher than previous peak in 1Q16 Sources: Platts, US Census Bureau, SBB *Domestic and import prices based on US Midwest and Houston import prices, respectively. 8
 SSI ferrous volume organic growth target of 4.")


9 Strategic Growth Initiatives 4.3 million tons ferrous volume FY19 target achieved early SSI Ferrous Volumes (000s LT) SSI ferrous volume organic growth target of 4.3 million tons achieved in FY18, one year ahead of schedule Accelerated SSI ferrous volume organic growth target to 5 million tons by FY20 AMR Adjusted Operating Income Per Ton SSI FY18 Ferrous Sales Volume Diversification AMR FY18 adjusted operating income per ferrous ton of $45 is similar to FY11, at which time SSI volumes and ferrous prices were approximately 25% higher Our products were shipped to 25 countries in FY18 - the strength, flexibility and breadth of our sales platform enables us to access demand wherever it is greatest Note: For a reconciliation to U.S. GAAP of adjusted operating income, see appendix. (1) Europe, Africa and Middle East (2) Domestic includes CSS, brokerage and other 9
10 50% 45% 40% 35% 30% 25% 20% 15% 10% 5% 0% Nonferrous Operations & Strategy SSI Total Nonferrous Volumes by Destination Domestic 46% China All others 39% 41% 38% 34% 35% 24% 28% 15% FY17 FY18 4Q18 FY17 FY18 4Q18 FY17 FY18 4Q18 SSI Total FY18 Nonferrous Product Mix by Volume Nonferrous from shredder production 36% 5% 2% 2% 13% 30% 12% Nonferrous Other Demonstrated ability to diversify sales destinations 76% of nonferrous sales volumes to destinations other than China in 4Q18 Broad-based global demand for scrap aluminum Nonferrous Operating Priorities Increasing sales destinations Volume Growth Expanding supply channels Sales Diversification Productivity benefits of $10M Commercial Initiatives Increased annual yields by 4%* Productivity Improvements Increased NF separation New wire choppers New Technology FY19 technology investments Focused nonferrous business strategy Increase efficiency of our processes in order to produce a quality product for customers on a costeffective basis Recover higher nonferrous volumes from shredding process Invest in additional processing technologies to increase throughput, lower processing costs, increase recovery rates, and create products with the metallic content sought by our customers *Yield improvement of 4.4% per annum since FY16 10
11 $ 2 50 $ 2 0 $ 1 50 $ 1 0 $ 5 0 $ % % % % % 8.0 % 6.0 % 4.0 % 2.0 % 0.0 % Strong Operating Performance & Returns Adjusted EBITDA ($M) $198 Increased EBITDA driven by improved performance in both operating businesses $84 $105 AMR adjusted operating income increased 86% from $90 million in FY17 to $168 million in FY18 CSS adjusted operating income increased 706% from $5 million in FY17 to $38 million in FY18 FY16 FY17 FY18 Strong operating performance with higher YoY adjusted operating income in each quarter of FY18 driven by: Return on Capital Employed* 15.5% Expanded metals spreads, increased sales volumes and higher selling prices Continued focus on productivity and commercial initiatives, including measures to increase supply flows 7.3% Return on Capital Employed* of 15.5% in FY18 3.8% Significantly exceeding the cost of capital Excludes discrete tax benefits FY16 FY17 FY18 Note: For a reconciliation to U.S. GAAP of adjusted EBITDA, see appendix. *Return on Capital Employed = Adjusted net income from continuing operations attributable to SSI, excluding interest expense (net of tax) and for FY18 excluding discrete tax benefits of $45M, divided by average adjusted capital (average of the last day of the fiscal year and the four preceding fiscal quarters of SSI's consolidated total assets less consolidated total liabilities other than debt and capital lease obligations). 11
12 AMR Volume & Operating Trends Adjusted Operating Income Per Ferrous Ton $28 $25 +18% YoY $33 $35 (in $) $29 $27 +58% YoY $45 4Q17 4Q18 FY17 FY18 Adjusted Operating Income per Ton $44 Adjusted Operating Income Excluding Inventory Accounting per Ton Improved YoY quarterly AMR operating performance 4Q18 adjusted operating income per ton of $33, up 18% YoY Ferrous sales volumes and average net selling prices were up YoY 19% and 23% in 4Q18, respectively Nonferrous sales volumes and average net selling prices were up YoY 11% and 8% in 4Q18, respectively Strong operating performance driven by expanded metal spreads, higher ferrous and nonferrous volumes, and focus on productivity including nonferrous processing improvements 4Q18 negative impact from average inventory accounting of $2/ton Ferrous Volumes and Average Prices Nonferrous Volumes and Average Prices Volume +19% YoY 864 1,032 $262 $321 3,145 $242 Volume +18% YoY 3,708 $317 4Q17 4Q18 FY17 FY18 Fe Volumes 000s LT Average Selling Price $/LT, net of freight $600 $500 $400 $300 $200 $100 $ Volume 11% YoY $0.64 $ $0.63 Volume +6% YoY 572 $0.72 4Q17 4Q18 FY17 FY18 NFe Volumes M Lbs Average Selling Price $/Lb, net of freight $1.00 $0.90 $0.80 $0.70 $0.60 $0.50 $0.40 Note: For a reconciliation to U.S. GAAP of adjusted operating income, including quarterly estimated impact of average inventory accounting, see appendix. 12

 -14% YoY 127 496 +5% YoY 519 Average Finished Steel Sales Prices* ($/ST) +31% YoY +25% YoY 4Q17 4Q18 FY17 FY18 Note: For a reconciliation to U.S. GAAP of adjusted operating income (loss), see appendix.")
13 CSS Volume & Operating Trends CSS Adjusted Operating Income (Loss) ($ Millions) 4Q18 financial performance improved significantly YoY 4Q18 adjusted operating income of $14 million, an increase of $7 million YoY Selling prices up 31% YoY in 4Q18 reflecting reduced pressure from imports and impact of higher raw material costs Continued benefits from integration synergies and productivity improvements Finished steel sales volumes lower by 14% YoY due to lower production as a result of planned maintenance, including rolling mill upgrades aimed at improving productivity 147 Finished Steel Sales Volumes (000s ST) -14% YoY % YoY 519 Average Finished Steel Sales Prices* ($/ST) +31% YoY +25% YoY 4Q17 4Q18 FY17 FY18 Note: For a reconciliation to U.S. GAAP of adjusted operating income (loss), see appendix. Amounts may not add due to rounding. *Average selling prices are net of freight 13
14 Capital Structure $400 $350 $300 $250 $200 $150 $100 $50 $368 $294 Net Debt ($ Millions) $205 $166 $138 $103 $180 $160 $140 $120 $100 $80 $60 $40 $20 $- $39 Operating Cash Flows ($ Millions) $141 $145 $99 $100 $160 FY13 FY14 FY15 FY16 FY17 FY18 FY13 FY14 FY15 FY16 FY17 FY18 Net Debt to Adjusted EBITDA 3.6 x 2.6 x 2.5 x 2.0 x 1.3 x 0.5 x FY13 FY14 FY15 FY16 FY17 FY18 Cash Flows & Liquidity Strong Balance Sheet Capital Allocation Priorities FY18 operating cash flows of $160M driven by profitability and strong working capital management Amended $700M credit facility provides additional financial flexibility; maturity date extended to 2023 Net debt to adj. EBITDA ratio of 0.5x Net leverage ratio of 13% Capital expenditures of $78M in FY18 Net debt reduction of 26% in FY18 Dividends paid of $21 million in FY18 Share repurchases of $17 million, or almost 2% of total outstanding shares, in FY18 Transactional growth Note: Net debt is total debt, net of cash. For a reconciliation to U.S. GAAP of net debt, net debt leverage to adjusted EBITDA, and net debt to net capital ratio, see appendix. 14

15 Delivering Sustainable Growth Sustainable Growth Expand Margins Improving nonferrous yields Enhancing product quality Productivity initiatives Increasing automation Optimizing asset utilization Realize Operating Leverage Increase Volumes Supply channel initiatives Expanding access to domestic and export markets Refining logistics capabilities Capturing increase in end-of-life vehicles in auto parts franchise Strong Balance Sheet Operational Excellence Capital Investment Nonferrous processing technology Grow auto parts and metals recycling platforms Reinvesting in capital equipment Innovation & Technology Investments Environmental Stewardship Strong FY18 Operating Performance Delivering on Growth Targets Market Conditions Key Growth Enablers & FY19 Priorities SSI ferrous volume growth of 19% YoY AMR adjusted operating income of $45 per ton in FY18 Strong CSS performance FY18 operating cash flow of $160M On track for 5M ton ferrous volume target Increasing operating leverage as we add more tons towards our FY20 volume goal Leading macro-economic and industry indicators trending positively, subject to impact of trade and other regulatory actions Productivity initiatives Operating leverage from volume growth Focus on nonferrous processing technology Enhanced commercial analytics Balanced capital allocation strategy Transactional growth opportunities Note: For a reconciliation to U.S. GAAP of adjusted operating income (loss), see appendix. 15
16 APPENDIX Fiscal 2018
17 Non-GAAP Financial Measures This presentation contains performance based on adjusted net income (loss) and adjusted diluted earnings (loss) per share from continuing operations attributable to SSI; adjusted consolidated, AMR and CSS operating income (loss); adjusted EBITDA; net debt, net debt leverage ratio, and net debt to adjusted EBITDA leverage ratio; and adjusted operating income excluding average inventory accounting, which are non-gaap financial measures as defined under SEC rules. As required by SEC rules, the Company has provided reconciliations of these measures for each period discussed to the most directly comparable U.S. GAAP measure. Management believes that providing non-gaap financial measures provides a meaningful presentation of our results from business operations excluding adjustments for goodwill impairment, other asset impairment charges net of recoveries, restructuring charges and other exit-related activities, recoveries related to the resale or modification of certain previously contracted shipments, the non-cash write-off of debt issuance costs, and the income tax expense (benefit) allocated to these adjustments, items which are not related to underlying business operational performance, and improves the period-to-period comparability of our results from business operations. Adjusted operating results in fiscal 2015 excluded the impact from the resale or modification of the terms, each at significantly lower prices due to sharp declines in selling prices, of certain previously contracted bulk shipments for delivery during fiscal Recoveries resulting from settlements with the original contract parties, which began in the third quarter of fiscal 2016 and concluded in the first quarter of fiscal 2018, are reported within selling, general and administrative expense in the quarterly statements of income and are also excluded from these measures. Further, management believes that debt, net of cash is a useful measure for investors because, as cash and cash equivalents can be used, among other things, to repay indebtedness, netting this against total debt is a useful measure of our leverage. Management believes that the ratio of total debt to total capital, both net of cash and cash equivalents, is also a useful measure of our leverage. These non-gaap financial measures should be considered in addition to, but not as a substitute for, the most directly comparable U.S. GAAP measures. Further, management believes that: Adjusted EBITDA is a useful measure of the Company s financial performance and liquidity; Net Debt to Adjusted EBITDA Ratio is a useful measure of the Company s liquidity; and Adjusted operating income excluding estimated impacts of average inventory accounting is a useful indicator of the Company s financial performance because it excludes the impact of the rapid changes in purchase prices compared to our cost of goods sold which adjusts more slowly due to use of average inventory accounting and provides a measure of operating performance excluding the differential. These non-gaap financial measures should be considered in addition to, but not as a substitute for, the most directly comparable U.S. GAAP measures. 17
18 Non-GAAP Financial Measures The following is a reconciliation of each of these measures to the most directly comparable U.S. GAAP measure: Consolidated Operating Income Quarter Fiscal Year (1) ($ in thousands) 4Q18 3Q18 2Q18 1Q18 4Q17 3Q17 2Q17 1Q Operating income $ 37,973 $ 51,234 $ 33,358 $ 26,423 $ 22,108 $ 19,147 $ 14,171 $ 587 $ 148,988 $ 56,013 Other asset impairment charges (recoveries), net 532 (1,465) - (88) (74) (1,044) (1,021) (717) Restructuring charges and other exit-related activities (922) (494) 201 (661) (109) Contract resale or modification, net of recoveries (417) (417) (171) (417) (139) (417) (1,144) Consolidated adjusted operating income (1) $ 37,583 $ 49,839 $ 33,449 $ 26,018 $ 21,707 $ 18,025 $ 13,260 $ 1,050 $ 146,889 $ 54,043 AMR Operating Income Quarter Fiscal Year (1) ($ in thousands) 4Q18 3Q18 2Q18 1Q18 4Q17 3Q17 2Q17 1Q Operating income $ 33,836 $ 54,980 $ 45,132 $ 35,172 $ 23,992 $ 29,520 $ 25,288 $ 12,606 $ 169,120 $ 91,405 Other asset impairment charges (recoveries), net 532 (1,465) (1,044) - - (933) (184) Contract resale or modification, net of recoveries (417) (417) (171) (417) (139) (417) (1,144) Adjusted AMR operating income (1) $ 34,368 $ 53,515 $ 45,132 $ 34,755 $ 24,435 $ 28,305 $ 24,871 $ 12,467 $ 167,770 $ 90,077 CSS Operating Income (Loss) Quarter Fiscal Year (1) ($ in thousands) 4Q18 3Q18 2Q18 1Q18 4Q17 3Q17 2Q17 1Q Operating income (loss) $ 13,604 $ 10,793 $ 5,413 $ 8,476 $ 8,019 $ 1,163 $ (1,279) $ (2,628) $ 38,286 $ 5,275 Other asset impairment charges (recoveries), net (88) (934) (88) (533) Adjusted CSS operating income (loss) (1) $ 13,604 $ 10,793 $ 5,413 $ 8,388 $ 7,085 $ 1,163 $ (1,279) $ (2,227) $ 38,198 $ 4,742 (1) May not foot due to rounding. 18
19 Non-GAAP Financial Measures The following is a reconciliation of each of these measures to the most directly comparable U.S. GAAP measure: Consolidated Operating Income (Loss) (in millions) Fiscal Year Operating income (loss) $ 149 $ 56 $ (8) $ (196) $ 24 Goodwill impairment charge Other asset impairment charges (recoveries), net (1) (1) Restructuring charges and other exit-related activities (1) Contract resale or modification, net of recoveries - (1) (1) 7 - Consolidated adjusted operating income (1) $ 147 $ 54 $ 28 $ 11 $ 33 Diluted EPS from continuing operations attributable to SSI ($ per share) Fiscal Year Net income (loss) per share attributable to SSI $ 5.47 $ 1.58 $ (0.71) $ (7.29) $ 0.22 Income (loss) per share from discontinued operations attributable to SSI 0.01 (0.01) (0.05) (0.27) (0.10) Net income (loss) per share from continuing operations attributable to SSI (1) $ 5.46 $ 1.60 $ (0.66) $ (7.03) $ 0.32 Goodwill impairment charge Other asset impairment charges (recoveries), net (0.04) (0.03) Restructuring charges and other exit-related activities (0.02) Contract resale or modification, net of recoveries (0.01) (0.04) (0.03) Non-cash write-off of debt issuance costs Income tax expense (benefit) allocated to adjustments (0.47) (0.05) Adjusted diluted EPS from continuing operations attributable to SSI (1) $ 5.39 $ 1.53 $ 0.69 $ 0.13 $ 0.58 (1) May not foot due to rounding. 19
20 Non-GAAP Financial Measures The following is a reconciliation of each of these measures to the most directly comparable U.S. GAAP measure: Net Income (Loss) from Continuing Operations Attributable to SSI Quarter Fiscal Year (1) (in thousands) 4Q18 3Q18 2Q18 1Q18 4Q17 3Q17 2Q17 1Q Net income (loss) from continuing operations attributable to SSI $ 59,396 $ 37,458 $ 40,852 $ 18,399 $ 18,349 $ 16,692 $ 11,132 $ (1,273) $ 156,105 $ 44,901 Goodwill impairment charge Other asset impairment charges (recoveries), net 532 (1,465) - (88) (74) (1,044) (1,021) (717) Restructuring charges and other exit-related activities (922) (494) 201 (661) (109) Contract resale or modification, net of recoveries (417) (417) (171) (417) (139) (417) (1,144) Income tax expense (benefit) allocated to adjustments (2) (171) 86 (41) 131 (9) 3 46 (40) 5 - Adjusted net income (loss) from continuing operations attributable to SSI (1) $ 58,835 $ 36,149 $ 40,902 $ 18,125 $ 17,939 $ 15,573 $ 10,267 $ (850) $ 154,011 $ 42,931 Diluted EPS from continuing operations attributable to SSI Quarter Fiscal Year (1) ($ per share) 4Q18 3Q18 2Q18 1Q18 4Q17 3Q17 2Q17 1Q Net income (loss) per share attributable to SSI $ 2.09 $ 1.31 $ $ 0.64 $ 0.60 $ 0.40 $ (0.05) $ 5.47 $ 1.58 Income (loss) per share from discontinued operations attributable to SSI (0.01) Net income (loss) per share from continuing operations attributable to SSI (1) $ 2.08 $ 1.31 $ 1.42 $ 0.64 $ 0.65 $ 0.60 $ 0.40 $ (0.05) $ 5.46 $ 1.60 Other asset impairment charges (recoveries), net 0.02 (0.05) (0.04) (0.04) (0.03) Restructuring charges and other exit-related activities (0.03) (0.02) 0.01 (0.02) - Contract resale or modification, net of recoveries (0.01) (0.01) (0.01) (0.01) (0.01) (0.01) (0.04) Income tax expense (benefit) allocated to adjustments (2) (0.01) Adjusted diluted EPS from continuing operations attributable to SSI (1) $ 2.06 $ 1.26 $ 1.42 $ 0.63 $ 0.63 $ 0.56 $ 0.37 $ (0.03) $ 5.39 $ 1.53 (1) May not foot due to rounding (2) Income tax allocated to adjustments reconciling reported and adjusted net income (loss) from continuing operations attributable to SSI and diluted earnings per share from continuing operations attributable to SSI is determined based on a tax provision calculated with and without the adjustments. 20
21 Non-GAAP Financial Measures Adjusted EBITDA Adjusted EBITDA Earnings before interest, taxes, depreciation, amortization, goodwill impairments and other asset impairments net of recoveries, restructuring charges and other exit-related activities, net income attributable to noncontrolling interests, discontinued operations, and contract resale or modification, net of recoveries. The following is a reconciliation of net income (loss) attributable to SSI and Adjusted EBITDA: Adjusted EBITDA Quarter (in thousands) 4Q18 3Q18 2Q18 1Q18 4Q17 3Q17 2Q17 1Q17 Net Income (loss) attributable to SSI $ 59,669 $ 37,402 $ 41,016 $ 18,364 $ 18,235 $ 16,565 $ 11,037 $ (1,326) Plus net income attributable to noncontrolling interests 532 1, Plus interest expense 2,160 2,483 2,281 2,059 2,112 2,131 2,097 1,741 Plus tax expense (benefit) (23,620) 10,650 (10,577) 5, (62) Plus depreciation & amortization 12,663 12,327 12,160 12,522 12,381 12,318 12,598 12,543 Plus other asset impairment charges (recoveries), net 532 (1,465) - (88) (74) (1,044) Plus restructuring charges and other exit-related activities (922) (494) 201 Plus (gain) loss from discontinued operations, net of tax (273) 56 (164) Plus contract resale or modification, net of recoveries (417) (417) (171) (417) (139) Total Adjusted EBITDA $ 50,741 $ 62,569 $ 45,710 $ 39,389 $ 33,527 $ 30,867 $ 26,215 $ 14,030 21
22 Non-GAAP Financial Measures Net Debt Leverage Ratio Debt, net of cash is the difference between (i) the sum of long-term debt and short-term debt (i.e., total debt) and (ii) cash and cash equivalents. The leverage ratio of net debt to net capital is the net debt as a percentage of net debt plus total equity. The following is a reconciliation of the net debt leverage ratio: Leverage Ratio ($ in thousands) 4Q18 3Q18 2Q18 1Q18 4Q17 3Q17 2Q17 1Q17 4Q16 3Q16 2Q16 1Q16 8/31/2018 5/31/2018 2/28/ /30/2017 8/31/2017 5/31/2017 2/28/ /30/2016 8/31/2016 5/31/2016 2/29/ /30/2015 Total Debt $ 107,376 $ 172,691 $ 210,824 $ 184,882 $ 145,124 $ 184,443 $ 209,477 $ 187,645 $ 192,518 $ 202,718 $ 197,839 $ 203,546 Less Cash (4,723) (10,090) (15,007) (9,194) (7,287) (15,209) (9,830) (8,100) (26,819) (7,018) (8,940) (18,925) Net Debt $ 102,653 $ 162,601 $ 195,817 $ 175,688 $ 137,837 $ 169,234 $ 199,647 $ 179,545 $ 165,699 $ 195,700 $ 188,899 $ 184,621 Total Debt $ 107,376 $ 172,691 $ 210,824 $ 184,882 $ 145,124 $ 184,443 $ 209,477 $ 187,645 $ 192,518 $ 202,718 $ 197,839 $ 203,546 Total Equity 670, , , , , , , , , , , ,448 Total Capital $ 777,486 $ 792,253 $ 797,920 $ 736,499 $ 682,617 $ 702,001 $ 712,161 $ 681,712 $ 693,950 $ 691,648 $ 674,911 $ 727,994 Less Cash (4,723) (10,090) (15,007) (9,194) (7,287) (15,209) (9,830) (8,100) (26,819) (7,018) (8,940) (18,925) Net Capital $ 772,763 $ 782,163 $ 782,913 $ 727,305 $ 675,330 $ 686,792 $ 702,331 $ 673,612 $ 667,131 $ 684,630 $ 665,971 $ 709,069 Total Debt to Capital Ratio 13.8% 21.8% 26.4% 25.1% 21.3% 26.3% 29.4% 27.5% 27.7% 29.3% 29.3% 28.0% Impact excluding cash from both Total Debt and Total Capital -.5% -1.0% -1.4% -.9% -.8% -1.6% -1.0% -.9% -2.9% -.7% -.9% -1.9% Net Debt Leverage Ratio 13.3% 20.8% 25.0% 24.2% 20.4% 24.6% 28.4% 26.7% 24.8% 28.6% 28.4% 26.0% 22
23 Non-GAAP Financial Measures Net Debt to Adjusted EBITDA Ratio The following is a reconciliation of cash flows from operating activities to adjusted EBITDA; debt to debt, net of cash; the debt to cash flows from operating activities ratio; and the net debt to adjusted EBITDA ratio: Net Debt to Adjusted EBITDA Ratio ($ in thousands) Fiscal Year Cash Flows from Operating Activities $ 159,676 $ 100,370 $ 99,240 $ 144,628 $ 141,252 $ 39,289 Exit-related gains, asset impairments and accelerated depreciation, net 1, (1,790) (6,502) (566) - Write-off of debt issuance costs - - (768) Inventory write-down (38) - (710) (3,031) - - Deferred income taxes 37,995 (2,278) (507) 1,988 3,815 59,102 Undistributed equity in earnings of joint ventures 1,953 3, ,490 1,196 1,183 Share-based compensation expense (18,965) (10,847) (10,437) (10,481) (14,506) (11,475) Excess tax benefit from share-based payment arrangements Gain (loss) on disposal of assets (56) (448) 465 2,875 1,126 (131) Unrealized foreign exchange gain (loss), net 104 (361) 109 1,909 (240) (1,583) Bad debt (expense) recoveries, net (323) (126) (131) 264 (449) (584) Change in current assets and current liabilities 34,081 10,666 (19,317) (76,736) (39,011) 53,654 Changes in other operating assets and liabilities (6,987) (4,958) (405) 2,252 (2,550) (2,699) Interest expense 8,983 8,081 8,889 9,191 10,595 9,623 Tax expense (benefit) (17,590) 1, (12,615) 2,583 (56,943) Restructuring charges and other exit-related activities (661) (109) 6,782 13,008 6,830 7,906 Loss (gain) from discontinued operations, net of tax (346) 390 1,348 7,227 2,809 4,242 Depreciation and amortization from discontinued operations (821) (1,335) (861) Contract resale or modification, net of recoveries (417) (1,144) (694) 6, Adjusted EBITDA $ 198,409 $ 104,639 $ 83,628 $ 81,917 $ 111,743 $ 101,066 Debt 107, , , , , ,837 Cash and cash equivalents (4,723) (7,287) (26,819) (22,755) (25,672) (13,481) Net Debt $ 102,653 $ 137,837 $ 165,699 $ 205,401 $ 293,693 $ 368,356 Debt to Cash Flows from Operating Activities Ratio Net Debt to Adjusted EBITDA Ratio
24 Non-GAAP Financial Measures Adjusted Operating Income Excluding Estimated Average Inventory Accounting Estimated Effect of Average Inventory Accounting We account for the cost of our inventory using the average cost method. In periods of rising or falling selling prices for our products, we seek to adjust the purchase price paid for raw materials. However, the cost of our inventory changes more slowly than the purchase prices due to the effect of the average cost method. As a result, changes in the average inventory cost recorded through our cost of goods sold lag the changes in purchase prices, thus generally impacting our operating results positively in periods of rising market prices and negatively in periods of falling market prices. The following is a presentation of the estimated impact of average inventory accounting during the comparable periods: AMR Adjusted Operating Income Excluding Quarter Fiscal Year (1) Estimated Average Inventory Accounting Impact ($ in thousands, except per ton) 4Q18 3Q18 2Q18 1Q18 4Q17 3Q17 2Q17 1Q Adjusted operating income $ 34,368 $ 53,515 $ 45,132 $ 34,755 $ 24,435 $ 28,305 $ 24,871 $ 12,467 $ 167,770 $ 90,077 $ 47,730 Estimated average inventory accounting impact (2,224) 1,558 4, ,854 (793) 4,065 (1,698) 4,088 4,428 (4,474) Adjusted operating income excluding estimated average inventory accounting (1) $ 36,592 $ 51,957 $ 40,541 $ 34,592 $ 21,581 $ 29,098 $ 20,806 $ 14,165 $ 163,682 $ 85,649 $ 52,204 Ferrous volumes (LT) 1,031, , , , , , , ,765 3,708,077 3,145,429 2,898,789 Adjusted operating income per ton $ $ 45 $ 29 $ 16 Adjusted operating income per ton excluding estimated average inventory accounting $ $ 44 $ 27 $ 18 Consolidated Adjusted Operating Income Excluding Quarter Fiscal Year (1) Estimated Average Inventory Accounting Impact (in thousands) 4Q18 3Q18 2Q18 1Q18 4Q17 3Q17 2Q17 1Q Consolidated adjusted operating income $ 37,583 $ 49,839 $ 33,449 $ 26,018 $ 21,707 $ 18,025 $ 13,260 $ 1,050 $ 146,889 $ 54,043 $ 27,772 AMR estimated average inventory accounting impact (2,224) 1,558 4, ,854 (793) 4,065 (1,698) 4,088 4,428 (7,890) Adjusted operating income excluding estimated average inventory accounting (1) $ 39,807 $ 48,281 $ 28,858 $ 25,855 $ 18,853 $ 18,818 $ 9,195 $ 2,748 $ 142,801 $ 49,615 $ 35,662 (1) May not foot due to rounding. 24
25 Historical Segment Data The following provides recast values of segment data for AMR and CSS following the completed reorganization in 4Q17: Recast Segment Financials ($000s) Quarter Fiscal Year (1) Auto and Metals Recycling 4Q18 3Q18 2Q18 1Q18 4Q17 3Q17 2Q17 1Q Reported operating income $ 33,836 $ 54,980 $ 45,132 $ 35,172 $ 23,992 $ 29,520 $ 25,288 $ 12,606 $ 169,120 $ 91,405 Adjusted operating income 34,368 53,515 45,132 34,755 24,435 28,305 24,871 12, ,770 90,077 Cascade Steel and Scrap 4Q18 3Q18 2Q18 1Q18 4Q17 3Q17 2Q17 1Q Reported operating income (loss) $ 13,604 $ 10,793 $ 5,413 $ 8,476 $ 8,019 $ 1,163 $ (1,280) $ (2,628) $ 38,286 $ 5,275 Adjusted operating income (loss) 13,604 10,793 5,413 8,388 7,085 1,163 (1,280) (2,227) 38,198 4,742 Consolidated 4Q18 3Q18 2Q18 1Q18 4Q17 3Q17 2Q17 1Q Reported operating income $ 37,973 $ 51,234 $ 33,358 $ 26,423 $ 22,108 $ 19,147 $ 14,171 $ 587 $ 148,988 $ 56,013 Adjusted operating income 37,583 49,839 33,449 26,018 21,707 18,025 13,260 1, ,889 54,043 Recast Segment Volumes Quarter Fiscal Year (1) Auto and Metals Recycling 4Q18 3Q18 2Q18 1Q18 4Q17 3Q17 2Q17 1Q Ferrous volumes (000s LT) (2) 1, ,708 3,145 Nonferrous volumes (000s LB) (2) 166, , , , , , , , , ,791 Car purchase volumes (000s) Cascade Steel and Scrap 4Q18 3Q18 2Q18 1Q18 4Q17 3Q17 2Q17 1Q Ferrous volumes (000s LT) Nonferrous volumes (000s LB) 21,907 17,180 14,997 12,412 14,441 11,964 8,703 10,673 66,496 45,782 Finished steel volumes (ST) 127, , , , , , , , , ,516 SSI Total Volumes (3) 4Q18 3Q18 2Q18 1Q18 4Q17 3Q17 2Q17 1Q Ferrous volumes (000s LT) 1,206 1,119 1, ,299 3,628 Nonferrous volumes (000s LB) 188, , , , , , , , , ,785 (1) May not foot due to rounding. (2) Includes transfers to CSS. (3) Ferrous and nonferrous volumes sold ex ternally by AMR and CSS and delivered to our steel mill for finished steel production. 25
26 Historical Segment Operating Statistics The following provides recast values of segment data for AMR and CSS following the completed reorganization in 4Q17: (Unaudited) YTD Fiscal Year Fiscal Year 1Q18 2Q18 3Q18 4Q Q17 2Q17 3Q17 4Q Q16 2Q16 3Q16 4Q Auto and Metals Recycling Ferrous selling prices ($/LT) (1) Domestic $ 259 $ 278 $ 314 $ 303 $ 291 $ 169 $ 237 $ 263 $ 257 $ 236 $ 167 $ 155 $ 206 $ 214 $ 188 Export $ 306 $ 327 $ 347 $ 328 $ 328 $ 203 $ 252 $ 255 $ 263 $ 244 $ 180 $ 175 $ 218 $ 207 $ 196 Average $ 292 $ 314 $ 337 $ 321 $ 317 $ 194 $ 247 $ 258 $ 262 $ 242 $ 176 $ 169 $ 214 $ 209 $ 193 Ferrous sales volume (LT) Domestic 237, , , ,974 1,085, , , , , , , , , , ,612 Export 559, , , ,834 2,622, , , , ,168 2,197, , , , ,642 2,040,177 Total 796, , ,342 1,031,808 3,708, , , , ,098 3,145, , , , ,384 2,898,789 Nonferrous average price ($/LB) (1)(2) $ 0.73 $ 0.72 $ 0.74 $ 0.69 $ 0.72 $ 0.58 $ 0.64 $ 0.65 $ 0.64 $ 0.63 $ 0.61 $ 0.58 $ 0.59 $ 0.60 $ 0.60 Nonferrous sales volume (000s LB) (2) 129, , , , , , , , , , , , , , ,737 Car purchase volume (000s) (3) Auto stores at end of quarter Cascade Steel and Scrap Finished steel average sales price ($/ST) (1) $ 599 $ 619 $ 703 $ 741 $ 666 $ 492 $ 517 $ 545 $ 565 $ 534 $ 554 $ 504 $ 501 $ 528 $ 522 Sales volume (ST) Rebar 84,243 79,718 91,603 81, ,746 73,903 69,136 84,166 96, ,528 85,899 71,935 84,193 88, ,618 Coiled products 40,928 43,056 46,673 43, ,535 23,934 34,371 54,629 48, ,283 32,482 33,742 42,168 29, ,283 Merchant bar and other 2,049 1,937 1,945 1,950 7,881 3,038 2,482 2,426 2,759 10,705 4,757 3,974 6,490 4,080 19,301 Finished steel products sold 127, , , , , , , , , , , , , , ,202 Rolling mill utilization (4) 95% 83% 91% 83% 88% 65% 89% 85% 95% 83% 68% 61% 53% 71% 63% (1) Price information is shown after a reduction for the cost of freight incurred to deliver the product to the customer. (2) Excludes PGM metals in catalytic converters. (3) Cars purchased by auto stores only. (4) Rolling mill utilization is based on effective annual production capacity under current conditions of 580 thousand tons of finished steel products. 26
Financial Results: Third Quarter Fiscal June 26, 2018
 Financial Results: Third Quarter Fiscal 2018 June 26, 2018 Safe Harbor SAFE HARBOR Statements and information included in this presentation by Schnitzer Steel Industries, Inc. (the "Company") that are
Financial Results: Fourth Quarter & Fiscal October 24, 2017
 Financial Results: Fourth Quarter & Fiscal 2017 October 24, 2017 Safe Harbor SAFE HARBOR Statements and information included in this presentation by Schnitzer Steel Industries, Inc. (the "Company") that
1Q 2017 EARNINGS PRESENTATION MAY 10, 2017
 1Q 2017 EARNINGS PRESENTATION MAY 10, 2017 Real Industry, Inc. 17 State Street, Suite 3811, New York, NY 10004 www.realindustryinc.com Real Alloy, Inc. 3700 Park East Dr., Suite 300, Beachwood, OH 44122
Third Quarter 2015 Earnings Call October 29, 2015
 Third Quarter 2015 Earnings Call October 29, 2015 Rob Wagman President & Chief Executive Officer Nick Zarcone Executive Vice President & Chief Financial Officer Joe Boutross Director, Investor Relations
EARNINGS PRESENTATION
 EARNINGS PRESENTATION Fourth Quarter & Full Year 2017 Aleris Corporation March 19, 2018 Forward-Looking and Other Information IMPORTANT INFORMATION This information is current only as of its date and may
Stifel 2017 Industrials Conference
 Stifel 2017 Industrials Conference NYSE: CVA JUNE 2017 Cautionary Statements All information included in this earnings presentation is based on continuing operations, unless otherwise noted. Forward-Looking
Fourth Quarter 2015 Earnings Call
 Fourth Quarter 2015 Earnings Call February 25, 2016 Rob Wagman President & Chief Executive Officer Nick Zarcone Executive Vice President & Chief Financial Officer Joe Boutross Director, Investor Relations
Schnitzer Steel Industries, Inc. Fourth Quarter Fiscal 2018 Earnings Call October 24, 2018
 P a g e 1 Schnitzer Steel Industries, Inc. Fourth Quarter Fiscal 2018 Earnings Call October 24, 2018 Operator Good day, ladies and gentlemen, and welcome to Schnitzer Steel's fourth quarter 2018 earnings
SCHNITZER STEEL INDUSTRIES, INC. (Exact name of registrant as specified in its charter)
") UNITED STATES SECURITIES AND EXCHANGE COMMISSION WASHINGTON, D.C. 20549 FORM 10-K (Mark One) ANNUAL REPORT PURSUANT TO SECTION 13 OR 15(d) OF THE SECURITIES EXCHANGE ACT OF 1934 For the fiscal year ended
UNITED STATES SECURITIES AND EXCHANGE COMMISSION WASHINGTON, D.C. 20549 FORM 10-K (Mark One) ANNUAL REPORT PURSUANT TO SECTION 13 OR 15(d) OF THE SECURITIES EXCHANGE ACT OF 1934 For the fiscal year ended
2017 Robert W. Baird Global Industrial Conference
 2017 Robert W. Baird Global Industrial Conference NYSE: CVA NOVEMBER 2017 Cautionary Statements All information included in this earnings presentation is based on continuing operations, unless otherwise
2016 Investor Presentation Bank of America Merrill Lynch - Global Metals & Mining Conference 11 May ASX: SGM USOTC: SMSMY
 2016 Investor Presentation Bank of America Merrill Lynch - Global Metals & Mining Conference 11 May 2016 ASX: SGM USOTC: SMSMY www.simsmm.com Business Highlights Company Global leader in metals and electronics
Loop Capital Metals & Mining Conference. March 2017
 Loop Capital Metals & Mining Conference March 2017 1 IMPORTANT INFORMATION ABOUT RYERSON HOLDING CORPORATION These materials do not constitute an offer or solicitation to purchase or sell securities of
Fourth Quarter & Full Year 2016 Earnings Call
 Fourth Quarter & Full Year 2016 Earnings Call February 23, 2017 Rob Wagman President & Chief Executive Officer Nick Zarcone Executive Vice President & Chief Financial Officer Joe Boutross Director, Investor
3 rd Quarter 2013 Earnings Presentation
 Click to edit Master title style 3 rd Quarter 203 Earnings Presentation November 6 th, 203 Click Disclaimers to edit Master title style IMPORTANT INFORMATION This information is current only as of its
I N V E S T O R P R E S E N T A T I O N
 2 0 1 6 I N V E S T O R P R E S E N T A T I O N J U N E 1 5, 2 0 1 6 IMPORTANT INFORMATION ABOUT RYERSON HOLDING CORPORATION These materials do not constitute an offer or solicitation to purchase or sell
Financial Results Half year ended 31 December February 2016
 Financial Results Half year ended 31 December 2015 19 February 2016 Improving the business and returns for shareholders Rapid deployment of business resetting actions $57 million in controllable costs
First Quarter 2018 Earnings Conference Call
 First Quarter 2018 Earnings Conference Call NYSE: CVA Cautionary Statements All information included in this earnings presentation is based on continuing operations, unless otherwise noted. Forward-Looking
SCHNITZER STEEL INDUSTRIES, INC.
 (Mark One) UNITED STATES SECURITIES AND EXCHANGE COMMISSION WASHINGTON, D.C. 20549 FORM 10-K [ x ] ANNUAL REPORT PURSUANT TO SECTION 13 OR 15(d) OF THE SECURITIES EXCHANGE ACT OF 1934 For the fiscal year
BANK OF AMERICA MERRILL LYNCH 2015 LEVERAGED FINANCE CONFERENCE. D e c e m b e r 3,
 BANK OF AMERICA MERRILL LYNCH 2015 LEVERAGED FINANCE CONFERENCE D e c e m b e r 3, 2 0 1 5 IMPORTANT INFORMATION ABOUT RYERSON HOLDING CORPORATION These materials do not constitute an offer or solicitation
Cliffs Natural Resources Inc. Reports Fourth-Quarter and Full-Year 2014 Results
 NEWS RELEASE Cliffs Natural Resources Inc. Reports Fourth-Quarter and Full-Year 2014 Results Reports Fourth-Quarter Adjusted EBITDA 1 of $297 million Reports U.S. Iron Ore Realized Pricing of $99 Per Ton
Third Quarter 2018 Earnings Call
 Third Quarter 2018 Earnings Call October 25, 2018 Nick Zarcone President & Chief Executive Officer Varun Laroyia Executive Vice President & Chief Financial Officer Joe Boutross Vice President, Investor
Cliffs Natural Resources Inc. Reports Third-Quarter Results. Reports Realized Pricing of $101 Per Ton in U.S. Iron Ore in Q3 2014
 NEWS RELEASE Cliffs Natural Resources Inc. Reports Third-Quarter Results Reports Adjusted EBITDA 1 of $233 million and Adjusted Earnings 2 of $0.21 per diluted share Reports Realized Pricing of $101 Per
Third Quarter 2018 Results November 8, 2018
 Third Quarter 2018 Results November 8, 2018 Safe Harbor Caution Regarding Forward Looking Statements This presentation any other oral or written statements made by us or on our behalf may include forward-looking
Investor Presentation. ASX: SGM USOTC: SMSMY
 Investor Presentation ASX: SGM USOTC: SMSMY www.simsmm.com Business Highlights Company Global leader in metals and electronics recycling with $4.7 billion in annual sales revenue Operations in 20 countries
Novelis Q4 and Fiscal Year 2016 Earnings Conference Call
 Novelis Q4 and Fiscal Year 2016 Earnings Conference Call May 10, 2016 Steve Fisher President and Chief Executive Officer Steve Pohl Vice President and Interim Chief Financial Officer 1 Safe Harbor Statement
First Quarter 2017 Results & Outlook for May 2, 2017
 First Quarter 2017 Results & Outlook for 2017 May 2, 2017 Forward-Looking Statements and Risk Factors This presentation contains statements which constitute forward-looking statements, within the meaning
KeyBanc Capital Markets Basic Materials and Packaging Conference. September 2017
 KeyBanc Capital Markets Basic Materials and Packaging Conference September 2017 1 Important Information About Ryerson Holding Corporation These materials do not constitute an offer or solicitation to purchase
Third Quarter 2018 Earnings Conference Call
 Third Quarter 2018 Earnings Conference Call NYSE: CVA Cautionary Statements All information included in this earnings presentation is based on continuing operations, unless otherwise noted. Forward-Looking
BAML Leveraged Finance Conference. November 2017
 BAML Leveraged Finance Conference November 2017 1 Important Information About Ryerson Holding Corporation These materials do not constitute an offer or solicitation to purchase or sell securities of Ryerson
2 nd Quarter 2013 Earnings Presentation
 Click to edit Master title style 2 nd Quarter 203 Earnings Presentation August st, 203 Click Disclaimers to edit Master title style IMPORTANT INFORMATION This information is current only as of its date
Q EARNINGS 8/1/2018 CONFERENCE CALL. Copyright 2017 ARRIS Enterprises, LLC. All rights reserved
 Q2 2018 EARNINGS 8/1/2018 CONFERENCE CALL Copyright 2017 ARRIS Enterprises, LLC. All rights reserved Safe Harbor FORWARD-LOOKING STATEMENTS Statements made in this presentation, including those related
Fourth Quarter & Full Year 2017 Earnings Call
 Fourth Quarter & Full Year 2017 Earnings Call February 22, 2018 Nick Zarcone President & Chief Executive Officer Varun Laroyia Executive Vice President & Chief Financial Officer Joe Boutross Vice President
April 22, Second Quarter Fiscal 2015 Earnings
 April 22, 2015 Second Quarter Fiscal 2015 Earnings Safe harbor This presentation and the conference call it accompanies contain forward-looking statements that are inherently subject to risks and uncertainties,
Fourth Quarter 2017 Earnings Conference Call
 Fourth Quarter 2017 Earnings Conference Call NYSE: CVA Photos courtesy of LCSWMA. Cautionary Statements All information included in this earnings presentation is based on continuing operations, unless
Fourth Quarter and Full Year Earnings Call March 1, 2019
 Fourth Quarter and Full Year Earnings Call March 1, 2019 Safe Harbor & Non-GAAP Financial Measures Cautionary Notice Statements in this news release and the schedules hereto that are not purely historical
Second Quarter 2018 Results July 31, 2018
 Second Quarter 2018 Results July 31, 2018 Eddie Edwards President and Chief Executive Officer Alex Pease Executive Vice President and Chief Financial Officer Safe harbor Caution Regarding Forward Looking
NOVELIS Q2 FISCAL 2018 EARNINGS CONFERENCE CALL
 NOVELIS Q2 FISCAL 2018 EARNINGS CONFERENCE CALL November 2, 2017 Steve Fisher President and Chief Executive Officer Devinder Ahuja Senior Vice President and Chief Financial Officer SAFE HARBOR STATEMENT
PROPOSED COMBINATION OF KRATON PERFORMANCE POLYMERS, INC. WITH THE SBC BUSINESS OF LCY CHEMICAL CORP.
 UPDATE CALL PROPOSED COMBINATION OF KRATON PERFORMANCE POLYMERS, INC. WITH THE SBC BUSINESS OF LCY CHEMICAL CORP. KRATON PERFORMANCE POLYMERS, INC. KEVIN M. FOGARTY, PRESIDENT AND CHIEF EXECUTIVE OFFICER
Driving Value Through Culture, Innovation and Results
 Driving Value Through Culture, Innovation and Results THIRD QUARTER 2018 EARNINGS PRESENTATION November 2, 2018 1 Agenda Introduction Business Overview Financial Overview Roger Hendriksen Director, Investor
CommScope Reports Fourth Quarter 2017 Results
 CommScope Reports Fourth Quarter 2017 Results Fourth Quarter 2017 Performance o Sales of $1.12 billion, consistent with guidance o GAAP operating income of $92 million and non-gaap adjusted operating income
Fourth Quarter and Full Year 2017 Financial Results February 19, 2018
 Fourth Quarter and Full Year 2017 Financial Results February 19, 2018 Trademark of Trinseo S.A. or its affiliates Introductions & Disclosure Rules Introductions Chris Pappas, President & CEO Barry Niziolek,
2018 SECOND QUARTER FINANCIAL RESULTS
 2018 SECOND QUARTER FINANCIAL RESULTS July 30, 2018 0 SAFE HARBOR STATEMENT The 2018 second quarter news release, conference call webcast, and the following slides contain forward-looking statements. The
J P M O R G A N J P M O R G A N G L O B A L H I G H Y I E L D C O N F E R E N C E
 J P M O R G A N GLO BAL H I GH YIELD AND LEVERAGED FINANCE CONFERENCE February 29, 2016 1 1 IMPORTANT INFORMATION ABOUT RYERSON HOLDING CORPORATION These materials do not constitute an offer or solicitation
Second Quarter 2018 Earnings Call
 Second Quarter 2018 Earnings Call July 26, 2018 Nick Zarcone President & Chief Executive Officer Varun Laroyia Executive Vice President & Chief Financial Officer Joe Boutross Vice President, Investor Relations
Albemarle Corporation Second Quarter 2018 Earnings and Non-GAAP Reconciliations Conference Call/Webcast Wednesday, August 8 th, :00am ET
 Albemarle Corporation Second Quarter 2018 Earnings and Non-GAAP Reconciliations Conference Call/Webcast Wednesday, August 8 th, 2018 9:00am ET Forward-Looking Statements Some of the information presented
CommScope Reports Fourth Quarter 2017 Results
 February 15, 2018 CommScope Reports Fourth Quarter 2017 Results Fourth Quarter 2017 Performance Sales of $1.12 billion, consistent with guidance GAAP operating income of $92 million and non-gaap adjusted
First Quarter 2018 Financial Results May 2, 2018
 First Quarter 2018 Financial Results May 2, 2018 Trademark of Trinseo S.A. or its affiliates Introductions & Disclosure Rules Introductions Chris Pappas, President & CEO Barry Niziolek, Executive Vice
Schnitzer Steel Industries, Inc. Third Quarter Fiscal 2018 Earnings Call June 26, 2018
 P a g e 1 Schnitzer Steel Industries, Inc. Third Quarter Fiscal 2018 Earnings Call June 26, 2018 Operator Good day, ladies and gentlemen, and welcome to Schnitzer Steel's third quarter 2018 earnings release
INVESTOR PRESENTATION
 INVESTOR PRESENTATION April 30, 2015 Safe Harbor Forward-Looking Statements. This presentation contains "forward-looking statements" within the meaning of the Private Securities Litigation Reform Act of
1Q 2018 Highlights and Operating Results
 1Q 2018 Highlights and Operating Results April 26, 2018 1 Table of Contents Page(s) 4 Announced Agreements to Acquire Australia and New Zealand Security Businesses 5-9 Sales Overview 10-17 Financial Performance
CommScope Reports Fourth Quarter and Full Year 2018 Results
 CommScope Reports Fourth Quarter and Full Year 2018 Results February 21, 2019 Fourth Quarter 2018 Performance Sales of $1.06 billion GAAP operating income of $49 million Non-GAAP adjusted operating income
October 26, Earnings Summary Third Quarter FY 2016
 October 26, 2016 Earnings Summary Third Quarter FY 2016 SAFE HARBOR Certain information contained in this presentation may constitute forward-looking statements within the meaning of the Private Securities
2018 Second Quarter Earnings Call. May 8, 2018
 2018 Second Quarter Earnings Call May 8, 2018 Forward Looking Statements / Non-GAAP Measures This presentation contains information about management's view of the Company's future expectations, plans and
NOVELIS Q1 FISCAL 2019 EARNINGS CONFERENCE CALL
 NOVELIS Q1 FISCAL 2019 EARNINGS CONFERENCE CALL August 7, 2018 Steve Fisher President and Chief Executive Officer Devinder Ahuja Senior Vice President and Chief Financial Officer SAFE HARBOR STATEMENT
LIOLIOS GROUP - GATEWAY CONFERENCE SEPTEMBER 9-10, 2015
 Real Industry, Inc. 15301 Ventura Boulevard, Suite 400, Sherman Oaks, CA 91403 www.realindustryinc.com LIOLIOS GROUP - GATEWAY CONFERENCE SEPTEMBER 9-10, 2015 CAUTIONS ABOUT FORWARD-LOOKING STATEMENTS
THIRD QUARTER FISCAL YEAR 2018 Earnings Conference Call & Presentation. August 7, 2018 at 9:00 a.m. CT (10:00 a.m. ET)
") THIRD QUARTER FISCAL YEAR 2018 Earnings Conference Call & Presentation August 7, 2018 at 9:00 a.m. CT (10:00 a.m. ET) 1 Third Quarter Fiscal Year 2018 Welcome to Nexeo s Earnings Conference Call and Presentation
THIRD QUARTER FISCAL YEAR 2018 Earnings Conference Call & Presentation August 7, 2018 at 9:00 a.m. CT (10:00 a.m. ET) 1 Third Quarter Fiscal Year 2018 Welcome to Nexeo s Earnings Conference Call and Presentation
Horizon Global Third Quarter 2017 Earnings Presentation
 Horizon Global Third Quarter 2017 Earnings Presentation October 31, 2017 Q1 2016 Earnings 1 Safe Harbor Statement Forward-Looking Statements This presentation may contain "forward-looking statements" as
November 7, Q 2017 Earnings Presentation
 November 7, 2017 3Q 2017 Earnings Presentation Forward Looking Statements 2 This presentation contains certain statements that may be deemed forward-looking statements within the meaning of Section 21E
2 nd Quarter CMC Business Model. Overview. North America. Vertical Integration. Product Diversification Global Geographic Dispersion
 CMC Business Model Vertical Integration 2 nd Quarter 2009 Product Diversification Global Geographic Dispersion Current Market Conditions & Outlook Overview Current Market Conditions & Outlook North America
Marvell Technology Group Ltd. Third Quarter of Fiscal Year 2018 November 28, 2017
 Marvell Technology Group Ltd Third Quarter of Fiscal Year 2018 November 28, Forward-Looking Statements under the Private Securities Litigation Reform Act of 1995 This press release contains forward-looking
Warrior Met Coal. Third Quarter 2018 Results October 31, 2018
 Warrior Met Coal Third Quarter 2018 Results October 31, 2018 Forward looking statements Page 1 These slides contain, and the Company s officers and representatives may from time to time make, forward-looking
Albemarle Corporation Second Quarter 2017 Earnings Appendix & Non-GAAP Reconciliations Conference Call/Webcast Tuesday, August 8 th, :00am ET
 Albemarle Corporation Second Quarter 2017 Earnings Appendix & Non-GAAP Reconciliations Conference Call/Webcast Tuesday, August 8 th, 2017 9:00am ET Forward-Looking Statements Some of the information presented
Q Earnings Presentation
 TUBULAR & ENERGY SERVICES CONSTRUCTION PRODUCTS RAIL PRODUCTS & SERVICES www.lbfoster.com Q2 2017 Earnings Presentation August 3, 2017 Safe Harbor Statement This presentation and oral statements regarding
Fourth Quarter 2018 Earnings Conference Call
 Fourth Quarter 2018 Earnings Conference Call NYSE: CVA Cautionary Statements All information included in this earnings presentation is based on continuing operations, unless otherwise noted. Forward-Looking
Third Quarter 2017 Financial Results November 2, 2017
 Third Quarter 2017 Financial Results November 2, 2017 Trademark of Trinseo S.A. or its affiliates Introductions & Disclosure Rules Introductions Chris Pappas, President & CEO Barry Niziolek, Executive
FISCAL YEAR 2018 FIRST QUARTER EARNINGS PRESENTATION
 FISCAL YEAR 2018 FIRST QUARTER EARNINGS PRESENTATION Jay Craig CEO & President Kevin Nowlan Senior Vice President & CFO January 31, 2018 Proprietary Meritor, Inc. 2017 Forward-Looking Statements This presentation
Fourth Quarter 2016 Results
 Fourth Quarter 2016 Results February 23, 2017 Eddie Edwards President and Chief Executive Officer Mark Olson Executive Vice President and Chief Financial Officer 1 Safe Harbor Caution Regarding Forward
2Q 2017 Highlights and Operating Results
 2Q 2017 Highlights and Operating Results July 25, 2017 1 2Q 2017 Highlights and Operating Results Table of Contents Page(s) 1 Sales Overview and Highlights 4-5 2 NSS Overview 6-7 3 EES Overview 8-9 4 UPS
SCHNITZER STEEL INDUSTRIES, INC.
 (Mark One) UNITED STATES SECURITIES AND EXCHANGE COMMISSION WASHINGTON, D.C. 20549 FORM 10-K [ x ] ANNUAL REPORT PURSUANT TO SECTION 13 OR 15(d) OF THE SECURITIES EXCHANGE ACT OF 1934 For the fiscal year
Jefferies Steel & Metals Summit. June 2018
 Jefferies Steel & Metals Summit June 2018 1 Important Information About Ryerson Holding Corporation These materials do not constitute an offer or solicitation to purchase or sell securities of Ryerson
November 5, Fourth Quarter and Fiscal 2014 Earnings
 November 5, 2014 Fourth Quarter and Fiscal 2014 Earnings Safe harbor This presentation and the conference call it accompanies contain forward-looking statements that are inherently subject to risks and
ANN JOO RESOURCES BERHAD 22 ND ANNUAL GENERAL MEETING DATO LIM HONG THYE, GROUP MANAGING DIRECTOR 30 MAY 2018
 ANN JOO RESOURCES BERHAD 22 ND ANNUAL GENERAL MEETING DATO LIM HONG THYE, GROUP MANAGING DIRECTOR 30 MAY 2018 INDUSTRY OVERVIEW INDUSTRY PERFORMANCE STEEL BAR PRICES (SOUTHEAST ASIA) 2004-2008 Commodities
Second Quarter 2014 Results. July 24, 2014
 Second Quarter 2014 Results July 24, 2014 Forward Looking Information Both these slides and the accompanying oral presentation contain certain forward-looking statements within the meaning of the United
Investor Contact: Will Gabrielski Vice President, Investor Relations
 Press Release Investor Contact: Will Gabrielski Vice President, Investor Relations 213.593.8208 William.Gabrielski@aecom.com Media Contact: Brendan Ranson-Walsh Vice President, Global Communications &
EMERSON REPORTS FIRST QUARTER 2019 RESULTS AND RAISES FULL YEAR GUIDANCE
 Investor Contact: Tim Reeves (314) 553-2197 Media Contact: Casey Murphy (314) 982-6220 EMERSON REPORTS FIRST QUARTER 2019 RESULTS AND RAISES FULL YEAR GUIDANCE Net sales of $4.1 billion increased 9 percent,
Fourth Quarter 2018 Earnings Call John Plant Chairman and Chief Executive Officer Ken Giacobbe Chief Financial Officer
 Fourth Quarter 2018 Earnings Call John Plant Chairman and Chief Executive Officer Ken Giacobbe Chief Financial Officer February 8, 2019 Important Information Forward Looking Statements This presentation
Urban Mining for a Sustainable World. Schnitzer Steel Industries, Inc. Annual Report 2011
 Urban Mining for a Sustainable World Schnitzer Steel Industries, Inc. Annual Report 2011 Financial Highlights For The Year Ended August 31, 2011 2010 2009 2008 2007 Performance (in millions) Revenues $
Third Quarter 2018 Financial Results
 Third Quarter 2018 Financial Results October 26, 2018 C r e a t i n g I n n o v a t i v e S t e e l S o l u t i o n s AK Steel Executive Management Team Roger Newport Kirk Reich Jaime Vasquez Chief Executive
ALCOA CORPORATION REPORTS SECOND QUARTER 2018 RESULTS
 FOR IMMEDIATE RELEASE: ALCOA CORPORATION REPORTS SECOND QUARTER 2018 RESULTS Net income of $75 million, or $0.39 per share Excluding special items, adjusted net income of $286 million, or $1.52 per share
Veritiv Corporation Fourth Quarter and Fiscal Year 2017 Financial Results March 1, 2018
 Veritiv Corporation Fourth Quarter and Fiscal Year 2017 Financial Results March 1, 2018 Tom Morabito Director of Investor Relations 2 Safe Harbor Provision Certain statements contained in this presentation
First Quarter 2015 Earnings Presentation. May 1, 2015
 First Quarter 2015 Earnings Presentation May 1, 2015 Agenda Strategic Review Financial Review Questions and Answers Edward Tilly Chief Executive Officer Alan Dean Executive Vice President, CFO and Treasurer
NOVELIS Q3 FISCAL 2019 EARNINGS CONFERENCE CALL
 NOVELIS Q3 FISCAL 2019 EARNINGS CONFERENCE CALL February 5, 2019 Steve Fisher President and Chief Executive Officer Dev Ahuja Senior Vice President and Chief Financial Officer SAFE HARBOR STATEMENT Forward-looking
Twelve Months Ended December 31 (In thousands, except per share amounts)
") CONSOLIDATED STATEMENTS OF OPERATIONS (Unaudited) Three Months Ended (In thousands, except per share amounts) 2012 2011 2012 2011 from continuing operations: Service revenues $ 571,581 $ 640,736 $ 2,340,996
CONSOLIDATED STATEMENTS OF OPERATIONS (Unaudited) Three Months Ended (In thousands, except per share amounts) 2012 2011 2012 2011 from continuing operations: Service revenues $ 571,581 $ 640,736 $ 2,340,996
Investment Community Conference Call
 DieboldNixdorf.com Investment Community Conference Call Second Quarter, 2018 Earnings August 1, 2018 Use of Non-GAAP Financial Information To supplement our condensed consolidated financial statements
FOR IMMEDIATE RELEASE
 Investor Contact Media Contact David Martin Kenneth Julian 717.612.5628 717.730.3683 damartin@harsco.com kjulian@harsco.com FOR IMMEDIATE RELEASE REPORTS SECOND QUARTER 2014 RESULTS Adjusted Operating
Copyright 2018 CPI Card Group. Fourth Quarter & FY 2017 Earnings Conference Call March 12, 2018
 Fourth Quarter & FY 2017 Earnings Conference Call March 12, 2018 Safe Harbor Forward-Looking Statements Statements in this presentation that are not statements of historical fact are forward-looking statements
Investment Community Conference Call
 DieboldNixdorf.com Investment Community Conference Call Third Quarter, 2018 Earnings October 31, 2018 Use of non-gaap Financial Information To supplement our condensed consolidated financial statements
Second Quarter 2016 Earnings Call
 Second Quarter 2016 Earnings Call July 28, 2016 Rob Wagman President & Chief Executive Officer Nick Zarcone Executive Vice President & Chief Financial Officer Joe Boutross Director, Investor Relations
INFORMATION PACKAGE FOR INVESTOR CONFERENCE CALL NOVEMBER 8, 2018
 INFORMATION PACKAGE FOR INVESTOR CONFERENCE CALL NOVEMBER 8, 2018 INFORMATION PACKAGE FOR INVESTOR CONFERENCE CALL NOVEMBER 8, 2018 I N D E X Cautionary Statement on Forward-Looking Information... 3 Notes...
For personal use only
 Financial Results Half year ended 31 December 2016 15 February 2017 Agenda Results Overview Galdino Claro, Group CEO Financial Results Fred Knechtel, Group CFO Strategic Progress & Outlook Galdino Claro,
Earnings Call. December 19, 2017
 Earnings Call December 19, Safe Harbor This document contains forward-looking statements made pursuant to the safe harbor provisions of the Private Securities Litigation Reform Act of 1995, including forward-looking
Investor Presentation. March 2018
 Investor Presentation March 2018 Forward Looking Statements This presentation contains forward-looking statements within the meaning of the Private Securities Litigation Reform Act of 1995, including but
3Q 2018 Highlights and Operating Results. Products. Technology. Services. Delivered Globally.
 3Q 2018 Highlights and Operating Results Products. Technology. Services. Delivered Globally. Table of Contents Page 3 Safe Harbor Statement and Non-GAAP Financial Measures 4 Sales Overview 9 Overview of
Q Investor Highlights. May 8, 2018
 Q1 2018 Investor Highlights May 8, 2018 Forward Looking Statements This document contains, and our other public communications may contain, forward-looking statements, that is, information related to future,
Marvell Technology Group Ltd. First Quarter of Fiscal Year 2019 May 31, 2018
 Marvell Technology Group Ltd First Quarter of Fiscal Year 2019 May 31, Forward-Looking Statements under the Private Securities Litigation Reform Act of 1995 This document and the accompanying press release
First Quarter 2018 Earnings Call
 First Quarter 2018 Earnings Call April 26, 2018 Nick Zarcone President & Chief Executive Officer Varun Laroyia Executive Vice President & Chief Financial Officer Joe Boutross Vice President, Investor Relations
1Q 2018 Supplemental Information for Earnings Conference Call
 1Q 2018 Supplemental Information for May 3, 2018 Aggregates Essential Material Valuable Asset I M P O R TA N T D I S C L O S U R E S F o r w a r d L o o k i n g S t a t e m e n t s This document contains
Q Investor Highlights. August 8, 2018
 Q2 2018 Investor Highlights August 8, 2018 Forward Looking Statements This document contains forward-looking statements, that is, information related to future, not past, events. Such statements generally
4Q 2017 Highlights and Operating Results
 4Q 2017 Highlights and Operating Results January 30, 2018 1 4Q 2017 Highlights and Operating Results Table of Contents Page(s) 1 Sales Overview 4-8 2 Financial Performance Trends 9-16 3 Leverage Metrics
RESOLUTE FOREST PRODUCTS Q RESULTS
 RESOLUTE FOREST PRODUCTS Q2 2018 RESULTS AUGUST 2, 2018 CAUTIONARY STATEMENTS REGARDING FORWARD-LOOKING INFORMATION Statements in this presentation that are not reported financial results or other historical