1 Executive Summary Main figures Relevant facts 5. 2 Consolidated Financial Statements 6
|
|
|
- Edgar Little
- 5 years ago
- Views:
Transcription
1
2 INDEX 1 Executive Summary Main figures Relevant facts 5 2 Consolidated Financial Statements Income Statement Sales and Backlog Operating Results Financial Results Net Profit Attributable to the Parent Company Consolidated Balance Sheet Non-Current Assets Working Capital Net Debt Net Worth Net Cash Flows Operating Activities Investments Other Cash Flows 14 3 Areas of Activity Evolution Construction Industrial Services Services 19 4 Relevant facts after the end of the period 20 5 Description of the main risks and opportunities 20 6 Corporate Social Responsibility 21 7 Information on affiliates 22 8 Annex Main figures per area of activity Share data Exchange rate effect Main Awards of the Period Construction Industrial Services Services 27 9 organisational structure Glossary 29 Non audited figures. The interim financial information has been subject to a limited review report available on the company's website and the CNMV 2
3 1 Executive Summary 1.1. Main figures Key operating & financial figures Euro Million 6M16 6M17 Var. Turnover ,7% Backlog ,9% Months EBITDA (1) ,2% Margin 7,0% 7,0% EBIT (1) ,6% Margin 5,4% 5,2% Attributable Net Profit ,2% EPS 1,27 1,33 +5,4% Net Investments (77) 224 n.a. Investments Disposals Total Net Debt ,8% Businesses' Net Debt Project Financing Note: Urbaser is restated as discontinued operation in the financial accounts of the comparable period after its sale in the last quarter of Data presented according to management criteria. (1) Includes Joint Ventures Net Results (companies executing projects managed with partners) not fully consolidated. - Sales in the period accounted for 17,386 million, an increase of 11.7% compared to the same period of the previous year. The growth pattern which started in the second half of 2016 is confirmed by positive sale evolution in general, and the particular strong performance in CIMIC which grew by nearly 30% in the second quarter of Backlog accounted for 65,200 million, growing by 5.9% despite the negative impact from the USD exchange rate. Both to the positive evolution of commercial activity during the first half of the year and the integration of the newly acquired businesses confirm the growth trend in contracting activity. - EBITDA of the Group accounted for 1,224 million, a 12.2% increase due mainly to the positive evolution of the construction activity. EBITDA margin stands at 7.0% remaining stable versus the comparable period. - EBIT accounted for 900 million and grew by 7.6%. EBIT margin stood at 5.2% with a slight variation due to change in the business mix. 3
4 Main figures details Euro Million 6M16 6M17 Var. Backlog 61,551 65, % Direct 54,008 60, % Proportional* 7,543 4, % Work Done 16,782 18, % Direct 15,569 17, % Proportional* 1, % EBITDA 1,091 1, % Direct 1,014 1, % Proportional* % EBIT % Direct % Proportional* % * Refers to the proportional stake of the operating Joint Ventures and projects not fully consolidated in the Group - Net profit of accounted for 416 million which represents a 7.2% increase compared to the same period of the prior year. GRUPO ACS Net Profit Euro Million 6M16 6M17 Var. Net Profit Construction % Net Profit Industrial Services % Net Profit Services % Net Profit Corporation (17) (12) -31.1% Net Profit % - Net debt stood at 1,654 million, 2,087 million lower than the outstanding balance 12 months ago backed, by a strong operating cash generation and the sale of Urbaser. Indebtedness evolution Group indebtedness evolution ,928 2,982 5,965 4, ,508 3, ,654 Jun-13 Jun-14 Jun-15 Jun-16 Jun-17 Net Debt AHS Debt 4
5 1.2. Relevant facts a) Dividends - On December 22 nd, 2016, exercising the powers granted by resolution of the General Shareholder s Meeting of the Company held on May 5 th, 2016, the Board of Directors approved the distribution of the interim dividend for 2016 through the scrip dividend system. To this end, it was agreed to proceed to the second execution of the capital increase against reserves up to 142 million (equivalent to around 0.45 per share), in order that shareholders could choose between continuing to receive remuneration in cash or either in shares of the Company. This simultaneous capital increase and reduction has been made in February Likewise, the Shareholder Annual General Meeting held on May 4 th 2017 approved the distribution of a complementary dividend of per share, which has been paid by July 2017, through the script dividend system. b) Corporate Governance - On February 28 th 2017, ACS Board of Directors agreed to appoint Mrs. Carmen Fernández Rozado as independent Board Director as well as Chairman and member of the Audit Committee. - On May 4 th 2017, General Shareholder s Meeting approved the appointment of Mr. Marcelino Fernández Verdes as Board of Director of ACS. Subsequently, the Board of Director proceeded to appoint him as Chief Executive Officer of ACS on May 11 th c) Corporation - On May 8 th 2017, ACS, Actividades de Construcción y Servicios, S.A. obtained an investment grade credit rating of BBB in a long term basis and A-2 in a short term basis, with a stable outlook, from Standard & Poor s agency. Likewise, on May 10 th, HOCHTIEF and CIMIC obtained the same credit rating. d) Mergers, adquisitions and transmission of shares - On June 21 th 2017,, proceeded to execute the sale of 80% stake in its indirect holdings in three hospitals in the Balearic Islands, through its subsidiary Iridium Concesiones S.A. The Company EV of the three assets was 418 million and the sale price 43.3 million, generating a capital gain of 7 million. e) Loans, credits and other financial operations - On June 28 th 2017, and a syndicate of banks consisting of forty-three Spanish and foreign institutions entered into a novation financing agreement (issue date, 13 February 2015 and renovated 31 December 2016) totalling 2,150 million, divided into two tranches (Tranche A consisting of a loan of 1,200 million and Tranche B consisting of a liquidity facility of 950 million) maturing on 13 June 2022 and reduction of margins as a result of the rating obtained by the company. 5
6 2 Consolidated Financial Statements 2.1 Income Statement Income statement Euro Million 6M16 6M17 Var. Net Sales 15, % 17, % +11.7% Other revenues % % -42.1% Joint Ventures Net Results* % % -54.3% Total Income 15, % 17, % +10.7% Operating expenses (11,460) (73.6 %) (12,455) (71.6 %) +8.7% Personnel expenses (3,285) (21.1 %) (3,852) (22.2 %) +17.3% Operating Cash Flow (EBITDA) 1, % 1, % +12.2% Fixed assets depreciation (241) (1.6 %) (309) (1.8 %) +28.2% Current assets provisions (12) (0.1 %) (14) (0.1 %) +13.0% Ordinary Operating Profit (EBIT) % % +7.6% Impairment & gains on fixed assets (14) (0.1 %) (17) (0.1 %) Other operating results (105) (0.7 %) (64) (0.4 %) Operating Profit % % +14.0% Financial income % % +11.8% Financial expenses (259) (1.7 %) (233) (1.3 %) -10.2% Ordinary Financial Result (166) (1.1 %) (129) (0.7 %) -22.6% Foreign exchange results (1) (0.0 %) (14) (0.1 %) Changes in fair value for finacial instruments (22) (0.1 %) % Impairment & gains on finacial instruments % % Net Financial Result (101) (0.6 %) (74) (0.4 %) -27.0% Results on equity method* % % n.a. PBT of continued operations % % +20.2% Corporate income tax (196) (1.3 %) (215) (1.2 %) +9.6% Net profit of continued operations % % +25.0% Profit after taxes of the discontinued operations % % n.a. Consolidated Result % % +14.8% Minority interest (83) (0.5 %) (124) (0.7 %) +50.3% Minority interest from discontinued operations (3) 0 Net Profit Attributable to the Parent Company % % +7.2% * The Joint Ventures Net Results, which are those companies that are executing projects but managed with partners, has been included in the Total Income figure, whilst the Results on Equity Method includes the net results of the rest of affiliated companies 6
7 2.1.1 Sales and Backlog - Net sales accounted for 17,386 million, 11.7% more than those registered in the same period of the prior year, mainly due to the positive evolution of the construction activities. - Sales breakdown by geographical areas demonstrates the diversification of the Group s revenue sources, where North America represents 43.7% of the sales, Asia Pacific 28.5%, Spain 12.6% and the remaining regions 15.2%. Sales per Geographical Areas Euro Million 6M16 % 6M17 % Var. Spain 2, % 2, % -1.7% Rest of Europe 1, % 1, % +6.5% North America 7, % 7, % +5.4% South America % 1, % +11.3% Asia Pacific 3, % 4, % +30.4% Africa % % +71.6% TOTAL 15,569 17, % Sales per Geographical Area (inter area of activity adjustments excluded) Construction Industrial Services Services Euro Million 6M16 6M17 % 6M16 6M17 % 6M16 6M17 % Spain % % % Rest of Europe 943 1, % % % North America 6,380 6, % % 0 0 n.a. South America % % 0 0 n.a. Asia Pacific 3,307 4, % % 0 0 n.a. Africa 2 0 n.a % 1 0 n.a. TOTAL 11,344 13, % 3,455 3, % % - In Construction, it is worth noting the activity rebound in Asia Pacific which grew by 32.9% thanks to the positive evolution in CIMIC backed by the integration of UGL. Activity in North America, with the larger contribution, maintains its solid growth of around 8.2%. Likewise, South America and Europe show positive growth rates except for Spain which experienced a reduction of 1.8%. - In Industrial Services, the activity fall in North America due to the production adjustment in Mexico is offset by the positive evolution of the rest of the international activity, particularly in Africa, Asia Pacific and Europe with a double digit growth. Domestic activity recovers by 3.0%. - Services sales decreased by 10.2% due to the sale of Sintax at the end of 2016, thus the only activity remaining in this area is Clece. - Group s backlog stood at 65,200 million and grew by 5.9% in the last twelve months thanks to the positive evolution of the contracting activities in the international market, particularly in North America and Asia Pacific. 7
8 Backlog per Geographical Areas Euro Million Jun-16 % Jun-17 % Var. Spain 6, % 6, % -0.4% Rest of Europe 5, % 5, % +5.8% North America 22, % 22, % +0.1% South America 3, % 4, % +31.4% Asia Pacific 22, % 25, % +10.6% Africa 1, % % -22.5% TOTAL 61,551 65, % Backlog per Geographical Area Construction Industrial Services Services Euro Million Jun-16 Jun-17 % Jun-16 Jun-17 % Jun-16 Jun-17 % Spain 3,000 2, % 1,981 2, % 1,650 1, % Rest of Europe 4,697 5, % % % North America 20,287 20, % 1,906 1, % 0 0 n.a. South America 2,076 2, % 1,668 2, % 0 0 n.a. Asia Pacific 20,947 23, % 1,859 1, % 0 0 n.a. Africa % % 0 0 n.a. TOTAL 51,252 54, % 8,572 8, % 1,727 1, % - It is worth noting the evolution of Construction s backlog in Asia Pacific which grew by 14.5%, backed by the integration of UGL and the solid recovery of the European market which grew by 7.3%. Domestic backlog is reduced by 12.3%. North America is affected by the depreciation of the USD in the last twelve months; excluding this impact, backlog growth in this region would stand at 3.4%. - Industrial Services experienced solid growth in its backlog of 3.9%, thanks to the positive evolution of the order intakes in the last twelve months, driven by the transmission lines awards in Brazil during the second half of 2016, as well as the recent energy projects. It is worth noting the recovery of the domestic backlog which grew by 4.8% with respect to that of the comparable period. - Clece s backlog increased by 15.3% thanks to the positive evolution of the domestic backlog Operating Results Operating Results Euro Million 6M16 6M17 Var. EBITDA 1,091 1, % EBITDA Margin 7.0% 7.0% Depreciation (241) (309) +28.2% Construction (208) (280) Industrial Services (20) (17) Services (14) (12) Corporation (0) (0) Current assets provisions (12) (14) +13.0% EBIT % EBIT Margin 5.4% 5.2% 8
9 - EBITDA accounted for 1,224 million, showing an increase of 12.2% compared to June EBIT accounted for 900 million, growing by 7.6% with respect to the prior period Financial Results Financial Results Euro Million 6M16 6M17 Var. Financial income % Financial expenses (259) (233) -10.2% Ordinary Financial Result (166) (129) -22.6% Construction (72) (64) -11.4% Industrial Services (28) (28) +0.6% Services (7) (4) -39.6% Corporation (59) (33) -44.9% - The ordinary financial result decreased by 22.6%. Financial expenses dropped by 10.2% as a result of the reduction of the average gross debt by 9.9%. Financial Results Euro Million 6M16 6M17 Var. Ordinary Financial Result (166) (129) -22.6% Foreign exchange Results (1) (14) n.a Impairment non current assets results (22) 50 n.a Results on non current assets disposals % Net Financial Result (101) (74) -27.0% - The net financial result includes the effect of financial derivatives, such as the impact of the stock option plan which matured last April 2017, and the and pre-tax income from impairment and disposal of financial assets. This last item includes in 2016 the capital gains from the prepaid forward sale of Iberdrola shares while in 2017 it includes the capital gains from the sale of Sintax and the Hospitals in the Balearic islands as well as the revaluation of certain financial assets Net Profit Attributable to the Parent Company - Construction Net Profit grew by 24.9% underpinned by the excellent performance of HOCHTIEF and its subsidiaries whose net profit increased by 34.8%. - Industrial Services Net Profit area grew by 4.6% as a result of the international activity boost and the recovery in domestic activity. - Services net profit decreased 52.8% due to the sale of Urbaser and Sintax at year end, thus with no contribution in this period. Clece s net profit increased by 0.5%. - Corporation results improve by 31.1% down to negative 12 million thanks to the reduction of the financial expenses. 9
10 GRUPO ACS Net Profit Euro Million 6M16 6M17 Var. Net Profit Construction % Net Profit Industrial Services % Net Profit Services % Net Profit Corporation (17) (12) -31.1% Net Profit % - Net Profit in the first half of 2017 reached 416 million, 7.2% higher than the prior year. This growth would be of 18.4% not taking into account the contribution of Urbaser in the prior period nor the impact in exchange rates variation. - The effective corporate tax rate stands at 30.3%, which represents a significant reduction compared to that of the prior period which stood at 36.3% 10
11 2.2 Consolidated Balance Sheet Consolidated balance sheet Euro Million Dec-16 Jun-17 Intangible Fixed Assets 4, % 4, % -1.7% Tangible Fixed Assets 1, % 1, % -6.6% Investments accounted by Equity Method 1, % 1, % -4.7% Long Term Financial Investments 2, % 2, % -7.7% Long Term Deposits % % +0.4% Financial Instruments Debtors % % -12.9% Deferred Taxes Assets 2, % 2, % -4.3% Fixed and Non-current Assets 12, % 12, % -4.5% Non Current Assets Held for Sale % % -23.1% Inventories 1, % 1, % -11.7% Accounts receivables 10, % 10, % -0.0% Short Term Financial Investments 1, % 1, % -7.9% Financial Instruments Debtors % % +77.5% Other Short Term Assets % % -21.5% Cash and banks 5, % 5, % -6.4% Current Assets 20, % 19, % -3.7% TOTAL ASSETS 33, % 32, % -4.0% Shareholders' Equity 3, % 3, % +5.1% Adjustments from Value Changes % (80) (0.2 %) n.a. Minority Interests 1, % 1, % -3.0% Net Worth 4, % 5, % +1.0% Subsidies % % -16.3% Long Term Financial Liabilities 4, % 5, % +3.9% Deferred Taxes Liabilities 1, % 1, % -6.0% Long Term Provisions 1, % 1, % -7.3% Financial Instruments Creditors % % -31.5% Other Long Term Accrued Liabilities % % +6.7% Non-current Liabilities 7, % 7, % -0.2% Liabilities from Assets Held for Sale % % -20.2% Short Term Provisions 1, % % -7.6% Short Term Financial Liabilities 3, % 3, % -6.8% Financial Instruments Creditors % % +66.4% Trade accounts payables 14, % 13, % -7.9% Other current payables % % +36.5% Current Liabilities 20, % 19, % -6.7% TOTAL EQUITY & LIABILITIES 33, % 32, % -4.0% Var. NOTE: 2016 figures have been restated according to the accounting rules as a result of the termination of the PPA resulting from the acquition of UGL 11
12 2.2.1 Non-Current Assets - Intangible assets which amount to 4,338 million include goodwill from past strategic transactions, of which 1,389 million come from the acquisition of HOCHTIEF in 2011 and 743 million from ACS s merger with Dragados in The balance of the investments held by equity method includes various holdings in associated companies from HOCHTIEF, Saeta Yield and several Iridium Concessions Working Capital Working Capital evolution* Euro Million Jun-16 Sep-16 Dec-16 Mar-17 Jun-17 Construction (1,169) (1,172) (2,562) (1,764) (2,077) Industrial Services (912) (898) (1,167) (940) (939) Services (13) Corporation (20) TOTAL (2,115) (2,013) (3,681) (2,613) (2,769) *Ex Urbaser - In the last 12 months, the net working capital has increased its credit balance by 654 million. This variation is mainly due to changes in perimeter as a result of the acquisition of businesses in the Construction area during 2016, the accrued dividends which have been paid in July included in Corporation and the variation in the operating working capital which has improved in 218 million. - The operating working capital variation as of June 2017 remains practically stable compared to that of March 2017, inherent the seasonality effect of the period. - The balance of factoring and securitization end of the period amounted to 881 million Net Debt Net Debt ( mn) Industrial Corporation / Construction Services June 30, 2017 Services Adjustments LT loans from credit entities ,222 2,527 ST loans from credit entities 1, ,294 Debt with Credit Entities 2,076 1, ,441 4,821 Bonds 1, ,643 3,375 Non Recourse Financing Other financial liabilities* (375) 203 Total Gross Financial Debt 4,323 1, ,709 8,623 ST* & other financial investments ,676 Cash & Equivalents 3,642 1, ,293 Total cash and equivalents 4,554 1, ,969 NET FINANCIAL DEBT (231) (575) 206 2,255 1,654 NET FINANCIAL DEBT previous year 242 (618) 1,036 3,081 3,741 (*) Debt and credit with associates are included in "Other financial liabilities" and "ST financial investments" - Net debt stood at 1,654 million, 2,087million lower than the outstanding balance 12 months ago thanks to the positive evolution of the funds from operations and backed by sale of Urbaser. - Net debt linked to assets held for sale amounted to 203 million. 12
13 2.2.4 Net Worth Net Worth Euro Million Dec-16 Jun-17 Var. Shareholders' Equity 3,563 3, % Adjustment s from Value Changes 11 (80) n.a Minority Interests 1,393 1, % Net Worth 4,968 5, % - ACS Net worth accounts for 5,018 million by period-end, showing an increase of 1.0% since December The balance of minority interests includes both the equity participation of minority shareholders of HOCHTIEF as well as minority interests included in the balance of the German company, mainly related to minority shareholders of CIMIC Holdings. 2.3 Net Cash Flows Net Cash Flow Euro Million 6M16 6M17 TOTAL HOT ACS exhot TOTAL HOT ACS exhot Cash Flow from Operating Activities before Working Capital Operating working capital variation (1,254) (444) (809) (1,015) (305) (710) Net CAPEX (115) (66) (48) (223) (151) (72) Net Operating Cash Flow from continuing activities (509) (123) (385) (331) 80 (410) Net Operating Cash Flow from discontinued operations (*) (31) 0 (31) Financial Investments/Disposals 314 (255) 569 (1) (51) 50 Other Financial Sources (31) (6) (25) (5) (2) (3) Free Cash Flow (257) (385) 129 (337) 27 (364) Dividends paid (168) (189) 21 (72) (7) (65) Intra group Dividends Treasury stock acquisition (120) (78) (41) (76) 0 (76) Total Cash Flow generated / (Consumed) (545) (652) 108 (485) 21 (506) *Correspond to Urbaser Operating Activities - Cash Flow from Operating Activities before working capital amount to 907 million, improving by 5.5% respect to June The recovery in the construction activity as well as the improvement of financial expenses have contributed to the positive evolution of the operating cash flow. - Operating working capital has an impact of 1,015 million of cash outflow in this period coming remaining stable with respect to the prior quarter. Despite seasonality effect of the period, the operating working capital variation has a credit balance 19% lower than that of June Variation of the operating working capital in the last twelve months implies a cash inflow of 218 million mainly coming from HOCHTIEF while remaining practically neutral for the rest of the activities. 13
14 2.3.2 Investments Euro Million Operating Investments Operating divestments NET CAPEX Project / Financial Investments Financial Divestments Investments breakdown Net Project / Financial invesments Total Net Investments Construction 206 (28) (32) Dragados 34 (7) 27 0 (0) 0 27 Hochtief 172 (21) Iridium (50) (43) (43) Services 14 (1) 13 8 (57) (49) (36) Industrial Services 35 (3) (17) Corporation & others (2) (2) (2) TOTAL 254 (32) (109) The total investments of the ACS Group amounted to 364 million, while divestments amounted to 140 million, resulting in a net positive cash flow balance for investing activities of 224 million. a) Construction - Operating CAPEX in the construction business corresponds mainly to the acquisition of machinery for contract mining in CIMIC. - Total investment in concession projects and financial investments in Construction business reached 39 million which practically corresponds to UGL s minorities acquisition. Financial divestments in HOCHTIEF correspond, on one hand, to the sale of certain HOCHTIEF Europe s financial holdings and, on the other, to the tax payment resulting from the sale of Nextgen last year which revert the inflows from this item. The divestment of 47 million in Iridium mainly correspond to the sale of 80% stake in the Hospitals in the Balearic Islands. b) Industrial Services - In Industrial Services area, financial investments amounted to 61 million corresponding to investments in energy projects which include transmission lines in Brazil and gas projects in Mexico. On the other side, divestments correspond to the sale of two wind farms. - Net operating CAPEX in Industrial Services amounted to 32 million. c) Services - Financial divestments in Services correspond mainly to the sale of Sintax which was signed by 2016 year end and completed in February 2017 for a total amount of 55 million Other Cash Flows - The Group has paid 72 million of dividends in cash which practically corresponds to ACS scrip dividend paid last February. - Likewise, 76 million have been devoted to the acquisition of treasury stock for the scrip dividend paid in July. 14
15 3 Areas of Activity Evolution 3.1 Construction Construction Euro Million 6M16 6M17 Var. Turnover 11,344 13, % EBITDA % Margin 6.3% 6.4% EBIT % Margin 4.5% 4.2% Net Profit % Margin 1.4% 1.5% Backlog 51,252 54, % Months Net Investments n.s Working Capital (1,169) (2,077) +77.6% - Construction sales accounted for 13,102 million representing an increase of 15.5%. This evolution is mainly due to the progressive activity recovery in CIMIC, both in construction and contract mining activities as well as the integration of the UGL business, and also backed by the positive evolution of the rest of HOCHTIEF and Dragados. Construction Sales per geographical areas Euro Million 6M16 6M17 Var. Spain % Rest of Europe 943 1, % North America 6,380 6, % South America % Asia Pacific 3,307 4, % Africa 2 0 n.a. TOTAL 11,344 13, % - EBITDA accounted for 834 million, increasing by 17.1% compared to June EBIT accounted for 546 million, and grew by 6.9%. The depreciation of assets from the acquisition of HOCHTIEF (PPA) accounted for 36.2 million in the period, the same figure as that of the comparable period. - Construction Net Profit reached 196 million which implies a 24.9% increase due to the factors above mentioned. - Backlog at the end of the period stood at 54,303 million, 6.0% higher compared to the figure recorded 12 months ago. This is backed by the order intakes in Asia Pacific as well as the integration of UGL in CIMIC by 2016 year-end and despite the negative impact of the USD in the last twelve months. 15
16 Construction Euro Million Construction Backlog per geographical areas Euro Million Jun-16 Jun-17 Var. Spain 3,000 2, % Rest of Europe 4,697 5, % North America 20,287 20, % South America 2,076 2, % Asia Pacific 20,947 23, % Africa % TOTAL 51,252 54, % Dragados Iridium HOCHTIEF (ACS contr.) Adjustments 6M16 6M17 Var. 6M16 6M17 Var. 6M16 6M17 Var. 6M16 6M17 6M16 6M17 Var. Sales 1,946 2, % % 9,366 11, % ,344 13, % EBITDA % % % 0 (0) % Margin 8.0% 8.1% n.a n.a 5.9% 6.0% 6.3% 6.4% EBIT % 1 (4) n/a % (36) (36) % Margin 6.3% 6.3% n.a n.a 4.5% 4.2% 4.5% 4.2% Net Financial Results (27) (27) (1) (0) (42) (21) 0 0 (69) (47) Equity Method (0) (0) (0) 4 9 Other Results & Fixed Assets (2) (0) (1) (2) (83) (54) 0 (0) (86) (56) EBT % % % (37) (37) % Taxes (25) (28) (0) 2 (111) (120) (125) (135) Minorities 0 (1) (0) 0 (88) (130) (77) (120) Net Profit % % % (14) (14) % Margin 3.5% 3.5% n.a n.a 1.1% 1.2% 1.4% 1.5% Backlog 12,438 11, % ,813 42, % 51,252 54, % Months Note: The column Adjustments includes the PPA adjustments, the PPA depreciation and the tax and minorities from both. - Dragados increased its sales by 5.1% and EBITDA margin remains practically stable at 8.1% versus the comparable period. - HOCHTIEF, for its part, showed significant growth across its operating magnitudes thanks to the recovery in CIMIC as well as the positive evolution in HOCHTIEF America and HOCHTIEF Europe, which continue to deliver sustainable growth. It is worth noting the continuous improvement in the operating efficiency where EBITDA margin increased by 70 bp standing at 6.3% and EBIT margin increased by 30bp up 4.3% to despite the higher D&A due to the contract mining activity rebound. - HOCHTIEF 's contribution to net profit of ACS, after deducting minority interests, amounted to 136 million, 34.8% higher compared to the same period of the previous year, in proportion to its average stake in the period which stood at 71.8%. Total HOCHTIEF Euro Million America Asia Pacific Europe Holding Total 6M16 6M17 Var. 6M16 6M17 Var. 6M16 6M17 Var. 6M16 6M17 6M16 6M17 Var. Sales 5,362 5, % 3,248 4, % % ,366 11, % EBIT % % % (20) (24) % Margin 2.2% 2.2% 9.1% 7.2% 4.0% 5.1% 0.0% 0.0% 4.5% 4.2% Net Financial Results (6) (6) (32) (25) (11) (42) (21) Equity Method (0) (0) Other Results & Fixed Assets (5) (1) (66) (22) (7) (31) (3) 0 (83) (54) EBT % % % (16) (15) % Taxes (32) (28) (70) (86) (5) (4) (4) (2) (111) (120) Minorities (12) (19) (36) (58) (0) 0 (0) 0 (49) (76) Net Profit % % % (20) (17) % Margin 1.2% 1.3% 2.8% 2.9% 0.7% 1.0% 1.5% 1.7% 16
17 - By areas of activities of HOCHTIEF, it is worth highlighting: a) Growth in America where sales went up by 7.6% and net profit by 16.2%. The main factors backing this positive behavior are the good performance of the activities of Turner and Flatiron, the increasing demand and measures introduced to improve operating efficiency. b) In Europe, after a long process of transformation and adaptation to the reality of the central European construction market, the positive trend of the margins and results is confirmed with a net profit margin of 1%. c) CIMIC, as already mentioned, experienced a substantial activity recovery growing by 27.8% in local currency (33.8% in EUR), thanks to the significant recovery both in construction and contract mining activities as well as the integration of UGL new business with the according impact in operating results. 3.2 Industrial Services Industrial Services Key Figures Euro Million 6M16 6M17 Var. Turnover 3,455 3, % EBITDA % Margin 10.6% 10.6% EBIT % Margin 9.5% 10.0% Net Profit % Margin 5.8% 5.8% Backlog 8,572 8, % Months Net Investments (57) 77 n.a Working Capital (912) (939) +2.9% - Industrial Services sales accounted for 3,590 million, showing a raise of 3.9% compared to the same period of 2016 thanks to the positive evolution of the international activity and the recovery of the domestic market. Industrial Services Sales per geographical areas Euro Million 6M16 6M17 Var. Spain % Rest of Europe % North America % South America % Asia Pacific % Africa % TOTAL 3,455 3, % - EPC projects grew by 20.0% thank to the development of international project mainly in Middle East and Japan as well as the start of new projects in Mexico while Support Services activities 17
18 decreased by 6.6%, mainly due to the production adjustments in Support Services business in Mexico. - By region, it is worth noting the good performance of the international activity in general except for North America where there are still production adjustments in the Mexican market, particularly in the support services business. Noteworthy is the double digit growth in Asia Pacific and Europe. Domestic market recovers both in the EPC and support services business growing by 3.0%. Industrial Services Turnover breakdown by activity Euro Million 6M16 6M17 Var. Support Services 2,060 1, % Networks % Specialized Products 1,349 1, % Control Systems % EPC Projects 1,373 1, % Renewable Energy: Generation % Consolidation Adjustments (5) (5) TOTAL 3,455 3, % International 2,508 2, % % over total sales 72.6% 72.8% - Backlog grew by 3.9% up to 8,906 million. International backlog represents 76.7% of the total amount. It is worth noting the positive evolution in South America which grew by 69,2% and the progressive recovery of the domestic backlog which reached 4,8% growth with respect to June Also noteworthy is the growth in the EPC and Networks backlogs as well as the reactivation of the renewable energy backlog. Industrial Services Backlog per geographical areas Euro Million Jun-16 Jun-17 Var. Spain 1,981 2, % Rest of Europe % North America 1,906 1, % South America 1,668 2, % Asia Pacific 1,859 1, % Africa % TOTAL 8,572 8, % Industrial Services Backlor per activity Euro Million Jun-16 Jun-17 Var. Support Services 4,962 5, % Networks % Specialized Products 3,200 3, % Control Systems 1,331 1, % EPC Projects 3,583 3, % Renewable Energy: Generation % TOTAL BACKLOG 8,572 8, % International 6,591 6, % % over total backlog 76.9% 76.7% 18
19 - EBITDA accounted for 379 million, 3.9% higher than in June 2016 with a stable margin that stood at 10.6%. - EBIT increased by 8.6% up to 358 million, with a 10.0% margin, 50 bp higher than in June Net profit accounted to 209 million, 4.6% higher than in June Services Services Key figures Euro Million 6M16 6M17 Var. Turnover % EBITDA % Margin 5.2% 5.1% EBIT % Margin 3.2% 3.3% Net Profit % Margin 6.2% 3.2% Backlog 1,727 1, % Months Net Investments 82 (36) Working Capital (13) 5 - Sales decreased by 10.2% mainly due to the sale of Sintax by the end of Without this effect, that is considering only Clece in both periods, sales decreased by 1.5%. - The sale of Sintax (logistic services) was agreed on December 2016 and closed at the beginning of this year with a net cash inflow of 40 million. Services Sales breakdown Euro Million 6M16 6M17 Var. Facility management % Logistics 69 0 n.a TOTAL % - EBITDA accounts for 36 million and declined by 11.5% due to Sintax sale. Considering only Clece, EBITDA increased by 0.4%. - Net profit amounted to 23 million which includes the capital gain from the sale of Sintax last February, decreasing by 52.8% due to the fact that the figure in 2016 includes the contribution of Urbaser as discontinued operations for 39 million. - Services backlog corresponds to Clece and accounts for 1,991 million, equivalent to over 1 year of production and increasing by 15.3% compared to the prior period. Services Backlog per geographical areas Euro Million Jun-16 Jun-17 Var. Spain 1,650 1, % Rest of Europe % TOTAL 1,727 1, % 19
20 4 Relevant facts after the end of the period The Shareholder Annual General Meeting approved the 4th of May the distribution of a complementary dividend of Euros per share, which has been paid by July 2017 using a scrip dividend system. In this period, the purchasing agreement from ACS has been accepted by a 32.37% of shareholders, leading to an acquisition by ACS of 101,861,628 rights for a total amount of 76,498,083 euros. The number of shares issued with a nominal value of 0.5 euros the 22th of July, in the first execution, amounted to 4,344,623. The nominal amount of the capital increase accounted for 2,172,312 euros. Simultaneously, that same number of shares have been amortized to leave the same number of issued shares prior to the payment of the scrip dividend. 5 Description of the main risks and opportunities operates in different sectors, countries and economic and legal environments involving exposure to different levels of risk, inherent in the businesses in which it operates. ACS monitors and controls these risks in order to avoid a decline in the profitability of its shareholders, a danger to its employees or its corporate reputation, a problem for customers or a negative impact for the Group as a whole. To perform this task to control the risk, has instruments to identify and to manage them properly in sufficient time, either by preventing its materialization or minimizing impacts, prioritizing, depending on their importance, as necessary. Notable are those systems related to control the bidding, contracting, planning and management of works and projects, systems of quality management, environmental management and human resources. In addition to the risks specific to the various businesses in which it operates, ACS is exposed to various financial risks, either by changes in interest or exchange rates, liquidity risk or credit risk. a) The risks arising from changes in interest rates on cash flows are mitigated by ensuring the rates of financial instruments to cushion its fluctuation. b) Risk management of exchange rates is done by taking debt in the same functional currency as that of the assets that the Group finances overseas. To cover the net positions in currencies other than euro, the Group arranges various financial instruments in order to reduce such exposure to exchange rate risk. c) The most important aspects impacting the liquidity financial risks of ACS during the period are: ACS, Actividades de Construcción y Servicios, S.A has obtained a long-term BBB and A-2 short-term credit rating with stable outlook from Standard & Poor's. Likewise, Hochtief and Cimic obtained the same credit rating in this period. The renewal of the Euro Commercial Paper program (ECP) for 750 million euros and Euro Medium Term Note Program (EMTN Program) for 1,500 million euros. The renewal of the syndicated loan for an amount of 2,150 million euros and extension until 2022 with a reduction in the financial cost. The issuance by Hochtief of EUR 500 million promissory notes that have been used to refinance the corporate bond due in March 2017 by diversifying the maturity profile of its financial obligations for periods of five, seven and ten years. 20
21 The Integrated Annual Report, which includes Corporate Governance Reports and the Consolidated Financial Statements of ( develop more in detail the risks and the tools for control. Likewise the Annual Report of Hochtief ( details the risks inherent in the German company and its control mechanisms. For the next six months since the date of closure of the accounts referred in this document, Grupo ACS, based on information currently available, does not expect to deal with situations of risk and uncertainty significantly different to those of the last six months of the period closed, particularly those derived from the internationalization of the Group s activities. 6 Corporate Social Responsibility is a worldwide reference in the infrastructure development industry, and it is deeply committed to economic and social progress in the countries where it is present. Corporate Social Responsibility Policy, reviewed and approved by the Board of Directors on their meeting on February 25 th 2016, establishes the basic and specific principles of action in this area, as well as in the Group's relationship with its environment. a) Basic principles of action and its affiliated companies are fully committed to promoting, strengthening and controlling issues related to ethics and integrity, through measures to prevent, detect and eradicate bad practices. The Group has developed and implemented its General Code of Conduct which is applicable to its employees, suppliers and subcontractors. In addition, training initiatives are carried out in order to inform all three groups of the Code, as well as the implementation of the ACS Group Ethics Channel which enables any person to communicate inappropriate conduct or breaches of the Code of Conduct if there were to occur. has a full commitment of rigorousness in the disclosure of information with due respect to the interests of clients and remaining social interlocutors of the company. b) Specific principles of action To tackle the Corporate Social Responsibility policy coordination, taking into consideration its operational decentralization and geographic breadth, the Group has developed project one, which aims at promoting good management practices and the spread of corporate culture through specific homogenous principles across the Group in relation to its stakeholders, customers, employees, suppliers, shareholders and the society in general. The areas of non-financial management in which these principles of action are focused on are: a) the quality of the products and services b) occupational safety c) recruitment and retention of talent d) protection of the environment e) innovation and development f) social action The detail of the results of policies of responsibility Corporate Social Responsibility of is collected and published frequently on the Group s web page ( and in the 21
22 Integrated Annual Report also available on the same web page. Likewise the Annual Report of Hochtief ( details the most relevant aspects regarding the Corporate Social Responsibility of this company and its subsidiaries. 7 Information on related parties Information regarding transactions with related parties is carried out in the relevant section of the annual financial report submitted to the CNMV. All these trade relations with related parties have been made in the ordinary course of business, market conditions and correspond to normal operations of the Group Companies, and have not materially affected the financial position nor results of operations during this period. 22
23 8 Annex 8.1 Main figures per area of activity * TURNOVER Euro Million 6M16 6M17 Var. Construction 11, % 13, % +15.5% Industrial Services 3, % 3, % +3.9% Services % % -10.2% Corporation / Adjustments (16) (13) TOTAL 15,569 17, % EBITDA Euro Million Construction % % +17.1% Industrial Services % % +3.9% Services 41 4 % 36 3 % -11.5% Corporation / Adjustments (27) (25) TOTAL 1,091 1, % EBIT Euro Million Construction % % +6.9% Industrial Services % % +8.6% Services 25 3 % 23 3 % -6.6% Corporation / Adjustments (28) (27) TOTAL % NET PROFIT Euro Million Construction % % +24.9% Industrial Services % % +4.6% Services % 23 5 % -52.8% Corporation / Adjustments (17) (12) TOTAL % NET INVESTMENTS Euro Million Construction n.a Industrial Services (57) 77 n.a Services 82 (36) n.a Corporation / Adjustments (470) (2) n.a TOTAL (77) 224 n.a BACKLOG Euro Million Jun-16 months Jun-17 months Var. Construction 51, , % Industrial Services 8, , % Services 1, , % TOTAL 61, , % NET DEBT Euro Million 6M16 6M16 6M16 6M16 Jun-16 6M17 6M17 6M17 6M17 Jun-17 Construction 242 (231) % Industrial Services (618) (575) -6.9% Services 1, % Corporation / Adjustments 3,081 2, % TOTAL 3,741 1, % Var. Var. Var. Var. Var. * Percentages are calculated according to the sum of the data for each activity 23
24 Closing Price Volume ( 000) 8.2 Share data ACS Shares Data (YTD) 6M16 6M17 Closing price Performance % 38.66% Maximum in the period Maximum Date 3-Jun 19-Jun Minimum in the period Minimum Date 11-Feb 31-Jan Average in the period Total volume ( 000) 127, ,683 Daily average volume ( 000) 1, Total traded effective ( mn) 3,198 3,469 Daily average effective ( mn) Number of shares (mn) Market cap ( mn) 7,676 10, , , , , , ,
25 8.3 Exchange rate effect EXCHANGE RATE EFFECT EXCHANGE RATE EFFECT Average Exchange Rate ( vs. currency) Jun-16 Jun-17 difference % 1 US Dollar (0.0199) -1.8% 1 Australian Dollar (0.0695) -4.6% 1 Mexican Peso % 1 Brazilian Real (0.5709) -14.1% EXCHANGE RATE EFFECT Closing Exchange Rate ( vs. currency) Jun-16 Jun-17 difference % 1 US Dollar % 1 Australian Dollar (0.0045) -0.3% 1 Mexican Peso % 1 Brazilian Real % EXCHANGE RATE EFFECT Euro million USD AUD Others Total Backlog (547) 126 (507) (928) Sales Ebitda 3 23 (3) 23 Ebit 2 15 (3) 14 Net Profit (0) 4 (2) 2 EXCHANGE RATE EFFECT Construction Euro Million USD AUD Others Total Backlog (533) 126 (161) (567) Sales Ebitda Ebit Net Profit EXCHANGE RATE EFFECT Industrial Services Euro Million USD AUD Others Total Backlog (15) 0 (342) (357) Sales Ebitda (1) 0 (5) (5) Ebit (1) 0 (5) (5) Net Profit (1) 0 (3) (4) EXCHANGE RATE EFFECT Euro Million USD Services AUD Others Total Backlog 0 0 (4) (4) Sales 0 0 (2) (2) Ebitda Ebit Net Profit
26 8.4 Main Awards of the Period In blue the new awards corresponding to the last quarter Construction Project Type of Project Region mn Project for the construction of a new metro railway crossing deep under the Sydney Harbour comprising contract to deliver twin 15.5km tunnels and associated civil works on Stage 2 of the Sydney Metro project( Australia) Execution of Zuidasdok project comprinsing the broadening and tunneling of the A10 South in Amsterdam, the road will go underground at the level of the current Amsterdam Zuid station (Amsterdam, Netherlands) Civil Works Asia Pacific Civil Works Europe Contract for mining services in Mount Pleasant coal mine (New South Wales, Australia) Contract mining Asia Pacific Project for the construction of East Kowloon cultural centre in Hong Kong Building Asia Pacific Extension of the contract for mining operation at Yallourn mine (Australia) Contract mining Asia Pacific Project for expanding of the existing Terminal 1 at Hong Kong International Airport Building Asia Pacific Contract for facility management of the Auckland Council's assets (Australia) Services Asia Pacific Project for the construction of the new bridge on the current NC12 road between Pea Island National Wildlife Refuge and the city of Rodanthe (North Carolina, United States) Contract for the highway 427 expansion in Ontario, the contract involves the design, build, finance and maintain (DBFM) of approx km (Canada) Design and construction of Northlink Stage 3 comprising the construction of a free-flowing dual carriageway between Ellenbrook and Muchea (Perth, Asutralia) Civil Works America Civil Works America Civil Works Asia Pacific Project for M1 Pacific Motorway widening (New South Wales, Australia) Civil Works Asia Pacific Construction and development of different subway stations of the Line 3 of the Santiago de Chile subway (Chile) Civil Works Railways 99.6 Contract mining services for Satui and Bayan s Wahana coal mines in Indonesia Contract mining Asia Pacific 96.0 Construction of the highway Ruta Nacional Nº 19 between San Francisco and Río Pomero in Córdoba province (Argentina) Civil Works America 95.2 Project for expansion and upgrade works for Junee prison ( New South Wales, Australia) Building Asia Pacific 94.6 Improvement works in the I95 highway in Miami (Florida, United States) Civil Works America 90.7 Expansion and upgrades works for San Diego s airport terminal 2 (California, United States) Building America 87.0 Construction of Business Garden office building in Wroclaw (Poland) Building Europe 84.7 Renovation works in Stratford high school (Connecticut, United States) Building America 84.0 Works for the replacement of two bridges in the Myrtle Avenue railway line (New York, United States) Design and construction of four new primary schools (three in Auckland and one in Hamilton) as well as operational services of the schools for 25 years (Australia) Works for the construction of zinc- cupper processing plants in Woodland mine (New South Wales, Australia) Civil Works America 76.3 Building Asia Pacific 72.9 Contract mining Asia Pacific
27 8.4.2 Industrial Services Proyect Type of Project Region mn Contract for the installation and maintenance of the photovoltaic plants of Santa María and Orejana with an installed capacity of 166 MW and 125 MW respectively in Chihuahua and Sonora (Mexico) EPC project for the construction of a photovoltaic plant in Matsuzaka with an installed capacity of 100MW (Japan) Design, construction, operation and maintenance of the Gamboa water treatment plant (Panama) Project for the expansion of the potable water treatment capacity of the General Belgrano treatment plant (Buenos Aires, Argentina) Project to optimize the supply of drinking water and sewerage of North Lima (Peru) Award of two contracts for the installation and maintenance of medium and low voltage electrical networks for Enel in the regions of Liguria andpiedmont (Italy) EPC Projects America EPC Projects Asia Pacific EPC Projects America Specialized Products Specialized Products Specialized Products America 64.1 America 52.6 Europe 51.7 Construction and equipment of the new 250 bed hospital of Kuito (Angola) EPC Projects Africa 46.2 EPC project for the construction of Hidromanta hydroelectric power plant with an installed capacity of 19.8 MW (Peru) EPC Projects America 40.5 Contract for point of sale outsourcing in 6,000 Repsol oil service stations in Spain Control Systems Europe 28.0 Design,instalation, operation and maintenance of signaling system of Gaborone public transport (Botswuana) Concession of the electronic collection system for the SITEUR (Urban Electric Train System) in the city of Guadalajara (Jalisco, Mexico) Job Order Contract for the development of various construction and maintenance services at the Rota Naval Base (Spain) Control Systems Africa 25.3 Control Systems America 24.8 Specialized Products Europe Services Project Type of Project Region mn Renewal of the contract for home care services in Jaen (Spain) Cleaning services contract for Miguel Servet Hospital (Zaragoza, Spain) Renewal of the cleaning services contract for Ramón y Cajal and Niño Jesús Hospitals (Madrid, Spain) Contract for the facility management of "El Villar" retirement home in Corella(Navarra, Spain) Cleaning, disinfection, disinfestation and disinfestation services in Ciudad Real (Spain) New contract for home care services in Las Palmas de Gran Canaria (Spain) Services for citizens Services for buildings Services for buildings Services for citizens Services for buildings Services for citizens Spain 42.2 Spain 35.8 Spain 31.2 Spain 30.6 Spain 18.8 Spain
28 9 organisational structure The ACS Group is a reference in the infrastructure sector worldwide. This sector contributes to a great extent to the economic and social development of the different regions of the world in an increasingly competitive, demanding and global market. The main areas of the Group are divided into: a) Construction This area includes the activities of Dragados, Hochtief (including CIMIC) and Iridium and is oriented to the development of all types of projects of Civil Works, Building and activities related to the mining sector (carried out by CIMIC, mainly in Asia Pacific ). The geographic regions with the highest exposure in this area are North America, Asia Pacific and Europe, mainly operating in developed and geopolitical, macroeconomic and legal safe markets. b) Industrial Services The area is dedicated to applied industrial engineering, developing activities of construction, operation and maintenance of energy, industrial and mobility infrastructures through an extensive group of companies headed by Grupo Cobra and Dragados Industrial. This area has a presence in more than 50 countries, with a predominant exposure to the Mexican and Spanish market despite the rapid growth in new Asian and Latin American countries. c) Services After the sale of Urbaser (in December 2016, reclassified as a discontinued activity in the year 2016 and comparable period) and Sintax (February 2017, which is included in the year 2016), this area only includes Clece's facility management activity which comprises maintenance of buildings, public places or organizations, as well as assistance to people. This area is fundamentally based in Spain despite an incipient growth of the European market. Listed in Madrid stock exchange 72% 100% 100% 100% Listed in Frankfurt stock exchange HOCHTIEF AG DRAGADOS ACS SERVICIOS, COMUNICACIONES Y ENERGIA ACS SERVICIOS y CONCESIONES 100% 72% 100% HOCHTIEF America CIMIC HOCHTIEF Europe 100% 100% 100% IRIDIUM GRUPO COBRA DRAGADOS INDUSTRIAL 100% CLECE Turner Flatiron Listed in Sydney stock exchange Construction Industrial Services Services 28
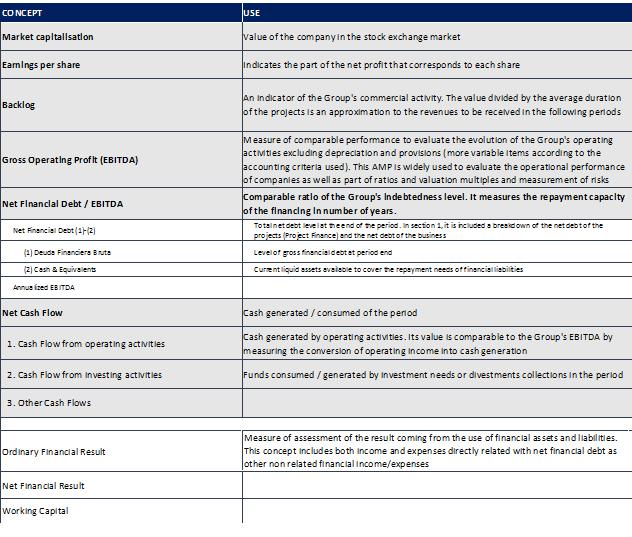
29 10 Glossary ACS Group presents its results in accordance with the International Financial Reporting Standards (IFRS). However, the group makes use of some alternative measures of performance (APM) to provide additional information that promote comparability and understanding of its financial information, and facilitates decision making and evaluation of the performance of the group. Below are the most outstanding APMs. CONCEPT DEFINITION and COHERENCE jun-17 jun-16 Market capitalisation Num of shares at period close x price at period close 10,643 7,676 Earnings per share Net Profit of the period / Average num of shares of the period Net Attributable profit Total Income - Total Expenses of the period - Minority interests result Average num. of shares of the period Daily average outstanding shares in the period adjusted by treasury stock Backlog Value of the contracts awarded and pending to be executed. In section 1.1, a breakdown is made between a direct and proportional portfolio (referring to proportional participation in joint operating companies and projects not consolidated globally in the Group) 65,200 61,551 Gross Operating Profit (EBITDA) Operating Profit excluding (1) D&A y (2) non recurrent operating results and/or which dont imply a cash flow + Net Results from Joint Ventures 1,224 1,091 (+) Operating Profit Operating income - Operating expenses (-) 1.D&A Operating provisions and fix asset depreciation (324) (254) (-) 2. Non recurrent operating results and/or which dont imply a cash flow Impairment & gains on fixed assets + other operating results (82) (119) (+) Net profit from Joint Ventures Profit before Taxes from foreign joint ventures consolidated by Equity method. It is similar to the UTEs regime in Spain, thus it is included in the EBITDA in order to standardize the accounting criteria with the Group's foreign companies Net Financial Debt / EBITDA Net Financial Debt / Annualized EBITDA 0.7x 1.7x Net Financial Debt (1)-(2) Gross external financial debt +Net debt with group companies - Cash & Equivalents 1,654 3,741 (1) Deuda Financiera Bruta Bank debt + Obligations and other negotiable securities + Project finance and non recourse debt + Financial lease + Other l/t non bank debt + Debt with group companies 8,623 10,822 (2) Cash & Equivalents Temporary Financial investments + L/T deposits + Cash & Equivalents 6,969 7,081 Annualized EBITDA EBITDA of the period / num of month within the period x 12 months 2,448 2,182 Net Cash Flow 1. Cash Flow from operating activities (1) Cash Flow from operating activities + (2) Cash Flow from investing activities + (3) Other Cash flows Adjusted Net Profit attributable + Operating working capital variation ex discontinued operations (485) (545) (108) (394) Adjusted Net Profit attributable Net profit attributable (+/-) adjustments of concepts which dont imply an operating cash flow Operating working capital variation 2. Cash Flow from investing activities (-) Payments from investments (+) Collections from divestments 3. Other Cash Flows Working capital variation of the period (+/-) ajustments of non operating concepts (Ej: dividends, interests, taxes, etc) Net investments (paid/collected) ex discontinued operations Payments for operating, project and financial investments. This figure may differ from that shown in section for reasons of deferral (accruals) ex discontinued operations Collections from operating, project and financial divestments. This figure may differ from that shown in section for reasons of deferral (accruals) ex discontinued operations Treasury stock sale/acquisition + Dividend payments + Other financial sources + Cash generated from discontinued operations (1,015) (1,254) (224) 199 (364) (576) (153) (350) Ordinary Financial Result Financial Income - Financial expenses (129) (166) Net Financial Result Ordinary financial result + Foreing exchange results + Impairment non current assets results + Results on non current assets disposals (74) (101) Working Capital Stock + Total accounts receivables - Total accounts payables - other current liabilities (2,769) (2,115) NOTE: All financial indicators and AMPs are calculated under the principles of coherence and homogeneity allowing comparability between periods and in compliance with the applicable accounting rules and standards Data in million of euros 29
30 30
5. The financial management in 2017
 5. The financial management in 2017 5.1. Consolidated FinanCial statements 5.2. Consolidated balance sheet of the acs Group 5.3. net Cash Flows of the acs Group 5.4. areas of activity evolution: ConstruCtion
1 Executive Summary Main figures Relevant facts 5. 2 Consolidated Financial Statements 7
 INDEX 1 Executive Summary 3 1.1. Main figures 3 1.2. Relevant facts 5 2 Consolidated Financial Statements 7 2.1 Income Statement 7 2.1.1 Sales and Backlog 8 2.1.2 Operating Results 10 2.1.3 Financial Results
INDEX 1 Executive Summary Main figures Relevant facts 5. 2 Consolidated Financial Statements 6
 INDEX 1 Executive Summary 3 1.1. Main figures 3 1.2. Relevant facts 5 2 Consolidated Financial Statements 6 2.1 Income Statement 6 2.1.1 Sales and Backlog 7 2.1.2 Operating Results 8 2.1.3 Financial Results
ACS gains 233 million euros, 6% more, in the first quarter of 2017
 ACS gains 233 million euros, 6% more, in the first quarter of 2017 Sales increased by 11.2% up to 8,357 million euros Backlog increases by 15.0% up to 68,092 million euros in March 2017 Net debt decreases
THE FINANCIAL MANAGEMENT
 INTEGRATED REPORT 5 101 THE FINANCIAL MANAGEMENT 5.1 Consolidated Financial Statements 5.2 Consolidated balance sheet of the ACS Group 5.3 Net cash flows of the ACS Group 5.4 Areas of activity evolution:
1 Executive Summary 3. Main figures 3 Relevant facts 5 2 Consolidated Financial Statements 8
 INDEX 1 Executive Summary 3 Main figures 3 Relevant facts 5 2 Consolidated Financial Statements 8 2.1 Income Statement 8 2.1.1 Sales and Backlog 9 2.1.2 Operating Results 11 2.1.3 Financial Results 11
Results Report Results Report 3Q14 3Q14. 13th November, Non Audited Figures 1
 13th November, 2014 Non Audited Figures 1 INDEX 1 Executive Summary 3 1.1 Main figures 3 1.2 Relevant facts 4 2 Consolidated Financial Statements 7 2.1 Income Statement 7 2.1.1 Sales and Backlog 7 2.1.2
RESULTS REPORT 2016 INDEX
 INDEX 1 Executive Summary 3 1.1. Main figures 3 1.2. Relevant facts 5 2 Consolidated Financial Statements 8 2.1 Income Statement 8 2.1.1 Sales and Backlog 9 2.1.2 Operating Results 11 2.1.3 Financial Results
Results Report 1H14 1H14. 29th August, Non Audited Figures 1
 Results Report 29th August, 2014 Non Audited Figures 1 INDEX 1 Executive Summary 3 1.1 Main figures 3 1.2 Relevant facts 4 2 Consolidated Financial Statements 6 2.1 Income Statement 6 2.1.1 Sales and Backlog
1 Executive Summary Main figures Relevant facts 5
 INDEX 1 Executive Summary 3 1.1. Main figures 3 1.2. Relevant facts 5 2 Consolidated Financial Statements 7 2.1 Income Statement 7 2.1.1 Sales and Backlog 8 2.1.2 Operating Results 10 2.1.3 Financial Results
Results Presentation 3Q November 14 th 2017
 Results Presentation 3Q 2017 November 14 th 2017 Executive Summary SUSTAINED TOP LINE GROWTH with improved operating efficiency +26% (AUD) top line growth in CIMIC Stable global operating margins Strong
Con experiencia probada
 Con experiencia probada ECONOMIC AND FINANCIAL REPORT OF ACS GROUP 2012 www.grupoacs.com Con experiencia probada Cover photo: Administrative Building (Salamanca, Spain). ECONOMIC AND FINANCIAL REPORT OF
Results Presentation 1Q May 12 th 2017
 Results Presentation 1Q 2017 May 12 th 2017 Executive Summary OPERATING OUTPERFORMANCE 11% Sales & EBIT recovery in CIMIC & margins stability NET PROFIT GROWTH in the HIGH END TARGET 12.6% like-for-like*
The world s leading infrastructure developer. April 2012
 The world s leading infrastructure developer Investors Presentation Company profile, strategy and key financials April 2012 Grupo ACS The world s leading infrastructure developer Engineering contractor
Ordinary General Shareholders' Meeting of
 Ordinary General Shareholders' Meeting of 8 May 2018 Speech by the CEO Marcelino Fernández Verdes Introduction Fellow shareholders, good morning and many thanks for attending this General Shareholders'
Results Presentation th of February, 2014
 Results Presentation 2013 28 th of February, 2014 Executive Summary Consolidation of Global Leadership Good Operating Results Net Profit > 700 Financial structure reinforced HOCHTIEF Restructuring 2 ACS
1 Executive Summary Main figures Relevant facts 5. 2 Consolidated Financial Statements 6
 INDEX 1 Executive Summary 3 1.1. Main figures 3 1.2. Relevant facts 5 2 Consolidated Financial Statements 6 2.1 Income Statement 6 2.1.1 Sales and Backlog 7 2.1.2 Operating Results 9 2.1.3 Financial Results
7. The acs group s Risk management
 7. The acs group s Risk management dual system of risk Control and supervision The acs group conducts its business activities in a variety of sectors, countries and socio-economic and legal environments
1 Executive Summary Main figures Relevant facts 5. 2 Consolidated Financial Statements 8
 INDEX 1 Executive Summary 3 1.1. Main figures 3 1.2. Relevant facts 5 2 Consolidated Financial Statements 8 2.1 Income Statement 8 2.1.1 Sales and Backlog 9 2.1.2 Operating Results 11 2.1.3 Financial Results
1 Executive Summary Main figures Relevant facts 5. 2 Consolidated Financial Statements Income Statement 7
 INDEX 1 Executive Summary 3 1.1. Main figures 3 1.2. Relevant facts 5 2 Consolidated Financial Statements 7 2.1 Income Statement 7 2.1.1 Sales and Backlog 8 2.1.2 Operating Results 10 2.1.3 Financial Results
ACS gains 388 million euros of net profit in the first half of 2016
 ACS gains 388 million euros of net profit in the first half of 2016 Sales reached 16,387 million euros, 5.3% lower in a like for like basis adjusted by currency impacts and the sale of renewable assets
Grupo ACS net profit in 2011 totals EUR 962 million
 Grupo ACS net profit in 2011 totals EUR 962 million Turnover grew up to EUR 28,472 million, a 98.7% increase. International turnover now accounts for 72.5% of the total. The Grupo ACS ordinary net profit
Net Profit in the first semester of 2014 grew by 10.7% up to 395 Euro million
 Net Profit in the first semester of 2014 grew by 10.7% up to 395 Euro million Sales stand at 18,759 Euro million, 83.8% of them from abroad. Net debt of the Group accounts for 5,812 Euro million, showing
Madrid, February 25 th, 2011
 Madrid, February 25 th, 2011 This document contains forward-looking statements on the intentions, expectations or forecasts of Grupo ACS or its management at the time the document was drawn up and in reference
Presentation to Investors. December 2013
 Presentation to Investors December 2013 Who we are Engineering contractor and greenfield developer Revenues 2012 > 38 bn Current Backlog 67 bn Civil Engineering Industrial Engineering Construction Environment
ACS accounts in the first quarter of 2015 for a net profit of 207 euro million
 ACS accounts in the first quarter of 2015 for a net profit of 207 euro million Sales grow by 6% up to 8,570 euro million. 80.2% of total sales accounted from international activities. Grupo ACS Results
Presentation of the Group
 The world s leading infrastructure developer Presentation of the Group Key figures & Global Strategy July 2012 Grupo ACS The world s leading infrastructure & concessions developer Engineering contractor
ACS accounts in the first nine months of 2015 for a net profit of 574 euro million
 ACS accounts in the first nine months of 2015 for a net profit of 574 euro million Sales reaches 26,366 euro million, up to 3.6% Net debt drops by 34% down to 3,880 euro million. Grupo ACS Results Euro
Q1: HOCHTIEF increases net profit by 40%; EUR 45 billion order backlog up by 23%
 Press Release Embargoed until 7:00 a.m. (CET) on May 10, 2017 Q1: HOCHTIEF increases net profit by 40%; EUR 45 billion order backlog up by 23% EUR 93 million operational net profit (+30% year on year),
1H18 Key figures SALES 17,777 +2,2% +10,1% EBITDA 1, % +8.7% EBIT % +11.9% NET PROFIT % +13.3%
 Key figures Figures in million YoY Var. Like for Like Var. 1 SALES 17,777 +2,2% +10,1% EBITDA 1,248 +2.0% +8.7% EBIT 946 +5.1% +11.9% NET PROFIT 447 +7.4% +13.3% LTM Net Operating Cash Flow 1,605 +24.1%
3Q Results Presentation November 15, 2016
 3Q 2016 Results Presentation November 15 th, 2016 Results Highlights 1 2 Solid results based on: Improved operating efficiency EBIT 1,119mn Reduction of financial expenses L-f-L (+50 bp) Net fin. expenses
1Q18 Key figures SALES 8,671 +3,7% +14,7% EBIT % +16.9% NET PROFIT % +13.4% NET DEBT % BACKLOG 66,677-2,1% +10.
 Key figures Figures in million YoY Var. Like for Like Var. 1 SALES 8,671 +3,7% +14,7% EBIT 473 +7.9% +16.9% NET PROFIT 250 +7.4% +13.4% NET OPERATING CASH FLOW (2) LTM 1,603 +40.9% NET DEBT 359-78.8% BACKLOG
1H / 2005 Results Data Conference. September 1 st, 2005
 1H / 2005 Results Data Conference September 1 st, 2005 1 Índex Executive Summary 1H/2005 Results Balance sheet at June 30 th, 2005 Business lines Conclussions 2 Executive Summary Good operating and financial
13 APRIL WestConnex M4 East, New South Wales. Refer to ASX/Media Release for further information
 ANALYST AND INVESTOR PRESENTATION 1Q17 RESULTS Marcelino Fernández Verdes, Executive Chairman Adolfo Valderas, Chief Executive Officer Angel Muriel, Chief Financial Officer WestConnex M4 East, New South
INDRA POSTED NET PROFIT OF 70 MILLION EUROS IN 2016
 In 2015, Indra posted losses of -641m, due to extraordinary adjustments INDRA POSTED NET PROFIT OF 70 MILLION EUROS IN 2016 It s worth highlighting the strong cash generation ( +184m) thanks to the improvement
For personal use only
 18 OCTOBER 2016 3Q CASH FLOW FROM OPERATING ACTIVITIES UP 7.3% YOY TO $533M, AN EBITDA CONVERSION RATE OF 192% IN LAST 12 MONTHS (LTM), WHICH ADJUSTS FOR SEASONALITY, EBITDA CONVERSION RATE OF 107% 9M16
Strategic Review Financial Highlights. Business opportunities. Results by business
 March 2004 Strategic Review 2003 Financial Highlights Business opportunities Results by business Conclusions A Construction & Services Market Reference # 1 in Spanish Construction # 1 in Industrial Services
2004 RESULTS. February 28 th, 2005
 2004 RESULTS February 28 th, 2005 Year 2004 Summary 2004 Consolidated Results 2004 Consolidated Balance Sheet Business area analysis Conclusions 2004 has been a Relevant Year for the ACS Group OPERATING
Prosegur 1H 2014 Results
 Prosegur 31 st July 2014 20140731ACD INVESTOR RELATIONS 1 Highlights Organic growth Improvement of more than 50% over the same period in 2013 Incremental EBIT improvement Continuing with the trend initiated
2016 Results presentation March 1st 2017
 2016 March 1 st 2017 Results presentation Executive Summary 1. Positive 2016 results Net Profit 751 mn +3.5% 2. 2012-2016 transformation process Operating improvement EBIT margin +30pb FFO 1,397 mn +20%
INDRA INCREASED ITS ORDER INTAKE BY +26% AND ITS REVENUES BY +15% IN 1Q18
 INDRA INCREASED ITS ORDER INTAKE BY +26% AND ITS REVENUES BY +15% IN 1Q18 Both T&D and IT posted growth in 1Q18 Net Order Intake Growth in Revenues is backed by the IT business (contribution of Tecnocom
QUARTERLY REPORT SEPTEMBER 30, 2016
 QUARTERLY REPORT SEPTEMBER 30, 2016 Table of Contents Page Presentation of Financial Information... ii Summary of Financial Information... 1 Business Overview... 3 Factors affecting the comparability of
RESULTS 1Q18 MADRID, MAY 14 TH
 RESULTS 1Q18 MADRID, MAY 14 TH 2018 www.indracompany.com CONTENTS 1. Introduction & Key Figures 3 2. Analysis of the Consolidated Financial Statements (IFRS) 5 3. Analysis by Vertical Markets 8 4. Analysis
Annual Report of ACS Group
 Annual Report of ACS Group www.grupoacs.com Cover photo: Atocha railway station expansion (Madrid, Spain). Economic and Financial Report of ACS Group Economic and Financial Report of ACS Group Directors
MY PROFIT OUR SUSTAINABILITY. Business Results Press Conference February 26, 2015 Marcelino Fernández Verdes, Peter Sassenfeld
 Oli Keinath 1 MY PROFIT OUR SUSTAINABILITY Johnny Greig Business Results Press Conference February 26, 2015 Marcelino Fernández Verdes, Peter Sassenfeld Turner Construction 2 Key developments in 2014 Balance
ACS, Actividades de Construcción y Servicios, S.A. and Subsidiaries 2015
 0 ACS Group Economic-Financial Report ACS, Actividades de Construcción y Servicios, S.A. and Subsidiaries 2015 Condensed Consolidated Financial Statements for the year ended 31 December 2017 Translation
MY OFFICE OUR BUILDING. Interim Report January to September We are building the world of tomorrow.
 Interim Report January to September 2017 MY OFFICE OUR BUILDING 9M 2017: Financial Highlights EUR 320 million operational net profit, +29% yoy; EUR 303 million nominal, +36% EUR 463 million net cash from
Ezentis increases its EBITDA by 142,3% in the first nine months of the year up to 16,4 million Euros
 Results Presentation Ezentis increases its EBITDA by 142,3% in the first nine months of the year up to 16,4 million Euros The revenue of the Company increased by 30% up to 228,5 million Euros thanks to
Creating a Uniquely Global and Integrated Infrastructure Group. October 2017
 Creating a Uniquely Global and Integrated Infrastructure Group 1 October 2017 Agenda 1. Transaction Overview 2. Rationale for the Combination 3. Profile of the New HOCHTIEF 4. Key takeaways for ACS 2 Strategic
-8.7 % +1.5 % -5.3 % % %
 24 A BUSINESS WITH A PURPOSE I 2017 MILESTONES MILESTONES IN 2017 Consolidation of results 2015 SOLID BASIS FOR 2016 SUSTAINED GROWTH CHANGE OF TREND WITH AN INCREASE IN CAPEX OTHER BUSINESSES 7 % 42 %
7 February Canberra Light Rail Stage One PPP, Australian Capital Territory, Pacific Partnerships, CPB Contractors and UGL.
 ANALYST AND INVESTOR PRESENTATION FULL YEAR RESULTS 2017 Marcelino Fernández Verdes, Executive Chairman Michael Wright, Chief Executive Officer Stefan Camphausen, Chief Financial Officer Canberra Light
Your project. our. Interim Report January to September 2015
 Interim Report January to September Your project our partnership HOCHTIEF PPP Solutions: A1 and A6 highway project in the Netherlands Focused Approach Delivering Results Operational net profit up 45% to
Annual General Meeting 2018 May 3, 2018
 CORPORATE HEADQUARTERS Annual General Meeting 2018 May 3, 2018 Page 1 of 12 Marcelino Fernández Verdes Chief Executive Officer (CEO) Embargoed until 10:30 a.m. (CET) on May 3, 2018 Check against delivery.
2016 MILESTONES 352 M 352 M - 8.7% + 0.7% + 8% + 1.5% + 15% - 5.3% Consolidation of results 10% 30% 5,977 M REVENUE 6,544 M REVENUE 6,499 M REVENUE
 16 A BUSINESS WITH A PURPOSE I MILESTONES ACCIONA Integrated Report 17 MILESTONES Consolidation of results Successful execution of the Action Plan 2013- Solid foundations for sustained growth Decisions
Fitter for the Future Strategic Update
 Fitter for the Future Strategic Update 2017-21 Chairman s remarks Global strategic overview Significant market opportunity Basarab Overpass in Bucharest, Romania Naples underground (Toledo Station), Italy
Grupo Isolux Corsán, S.A. and its subsidiaries. Consolidated financial information for the nine month period ended September 30, 2014 (unaudited)
") Consolidated financial information for the nine month period ended September 30, 2014 (unaudited) CONSOLIDATED INTERIM BALANCE SHEET (unaudited) For the period ended September 30, 2014 (Amounts in thousand
Consolidated financial information for the nine month period ended September 30, 2014 (unaudited) CONSOLIDATED INTERIM BALANCE SHEET (unaudited) For the period ended September 30, 2014 (Amounts in thousand
INDRA S NET PROFIT INCREASED BY +23% IN 1H17, TO REACH 38 MILLION EUROS
 Revenues increased by +4% and EBITDA increased by +7% after Tecnocom s integration INDRA S NET PROFIT INCREASED BY +23% IN 1H17, TO REACH 38 MILLION EUROS Revenues in 1H17 totaled 1,379m, growing by +4%
Presentation to Investors. March 2010
 GrupoACS Presentation to Investors March 2010 Grupo ACS key figures Year 2009 Δ Revenues 15,606 mn +2.2 % EBITDA 1,458 mn +5.5 5 % Net Profit 1,952 mn +8.1 % EPS 6.28 +15.6 % Net Debt 9,271 mn 0.9 % Backlog
Prosegur Results Madrid, 25 th February 2010
 Prosegur Results 2009 Madrid, 25 th February 2010 Executive summary Total Growth Growth Profitability +6.6% +14.1% 2,187.0 2,051.7 205.0 234.0 Margin 10.0% 10.7% growth of 6.6% mainly due to the organic
Half-Year Report January to June Our. your. We are building the world of tomorrow.
 Half-Year Report January to June Our energy your supply We are building the world of tomorrow. The HOCHTIEF Group: Key Operational Variables (like-for-like) *Restated for IFRS 5. For details on the restatement,
April 2015 A LEADING TECH COMPANY
 April 2015 A LEADING TECH COMPANY This presentation has been produced by Indra for the sole purpose expressed therein. Therefore, neither this presentation nor any of the information contained herein constitutes
MY TRAVEL OUR CONNECTION. Half-Year Report January to June We are building the world of tomorrow.
 Half-Year Report January to June 2018 MY TRAVEL OUR CONNECTION Financial Highlights Operational net profit up 18% to EUR 237 million; nominal up 21% yoy to EUR 229 million Net cash from op. activities
ACS, Actividades de Construcción y Servicios, S.A. and Subsidiaries
 ACS, Actividades de Construcción y Servicios, S.A. and Subsidiaries Interim Condensed Consolidated Financial Statements for the six months period ended 30 June 2016 Translation of interim condensed consolidated
FY16 Results Presentation
 Muskrat Falls Hydro Plant, Canada FY16 Results Presentation March 14, 2017 Agenda Warsaw subway Line 2, Poland 2016 Highlights Q4 & FY16 results Appendix 2 Fit for the Future our Strategy Plan Sustainable
RESULTS 9M12. MADRID, 14 NOVEMBER
 RESULTS MADRID, 14 NOVEMBER 2012 www.indra.es CONTENTS 1. Introduction - 3 2. Main Figures - 6 3. Analysis of Revenues and Commercial Activity - 7 3.1. Analysis by Segment - 8 3.2. Analysis by Vertical
GENERAL RISK CONTROL AND MANAGEMENT POLICY
 GENERAL RISK CONTROL AND MANAGEMENT POLICY Translation originally issued in Spanish and prepared in accordance with the regulatory applicable to the Group. In the event of a discrepancy, the Spanishlanguage
PRESS RELEASE. Santander Q1 profit reaches EUR billion, 5% less year-on-year and up 8% excluding FX impact RESULTS JANUARY-MARCH 2016
 RESULTS JANUARY-MARCH 2016 Santander Q1 profit reaches EUR 1.633 billion, 5% less year-on-year and up 8% excluding FX impact Our Q1 results are ahead of plan and we continue to deliver on all our commitments.
Our passion. Half-Year Report January to June We are building the world of tomorrow.
 Half-Year Report January to June 2016 My Gotthard Our passion Financial Highlights Operational net profit of EUR 160 million +25% year on year Net cash flow from operating activities EUR 312 million in
MY LEISURE OUR FACILITIES. Quarterly Report January to March We are building the world of tomorrow.
 Quarterly Report January to March 2016 MY LEISURE OUR FACILITIES Financial Highlights Operational net profit of EUR 72 million, + 19% yoy; strong margin increase Nominal net profit of EUR 63 million, +
INDRA S NET PROFIT INCREASED BY +82% IN 2017, TO REACH 127 MILLION EUROS
 EPS also up +73% vs 2016 INDRA S NET PROFIT INCREASED BY +82% IN 2017, TO REACH 127 MILLION EUROS In reported terms, including Tecnocom, Order Intake increased by +18%, revenues by +11% and EBIT by +21%
OUR ROUTE MY TRANSPORTATION. 10. Structured Finance Conference. HOCHTIEF Non Rated Bonds. 12 November 2014
 10. Structured Finance Conference HOCHTIEF Non Rated Bonds 12 November 2014 MY TRANSPORTATION OUR ROUTE HOCHTIEF CZ Carl E. Hoestermann, Head of Corporate Finance plainpicture:ojo Turning Vision into Value.
H FINANCIAL RESULTS. August 30,
 August 30, 2017 1 Disclaimer This presentation contains both historical and forward-looking statements. These forward-looking statements are based on Carrefour management's current views and assumptions.
EARNINGS RELEASE FY April 2018
 EARNINGS RELEASE FY2017 6 April 2018 2 Key highlights BACK TO GROWTH Turnover up 18% YoY to 2,597 Mn, supported by all regions on a comparable basis EBITDA up 19% YoY to 403 Mn with margin increasing 100
Press release August 30, FIRST-HALF 2017 RESULTS Solid sales growth of +6.2% Recurring operating income of 621m
 FIRST-HALF 2017 RESULTS Solid sales growth of +6.2% Recurring operating income of 621m Net sales up +6.2% to 38.5bn, reflecting the combination of a good like-for-like performance and the effect of expansion:
RESULTS FOR FIRST HALF OF August 2015
 RESULTS FOR FIRST HALF OF 2015 31 August 2015 Content Keys to the period Main figures Profit & Loss Account Breakdown of Sales Breakdown of EBITDA The Vuelta de Obligado Project Order Intake and Backlog
Grupo Prosegur - Results Madrid, 26 th February 2009
 Grupo Prosegur - Results 2008 Madrid, 26 th February 2009 Executive Summary Total Growth Growth Profitability +11.4% +27.9% 2,051.7 1,841.8 207.1 Margin 8.8% 10.1% Strong growth trend, mainly due to the
Prosegur. May 7 th, 2014 PROSEGUR. 1Q 2014 Results. 1Q 2014 Results
 Prosegur May 7 th, 2014 20140422ACD INVESTOR RELATIONS 1 Highlights Profitability Increase Margin recovery in all regions Tighter indirect costs control EBIT grows 32% at constant FX rate Exchange Rate
17 April Genex Power s Kidston Solar Farm, Queensland, UGL. Refer to ASX/Media Release for further information
 ANALYST AND INVESTOR PRESENTATION 1Q RESULTS 2018 Marcelino Fernández Verdes, Executive Chairman Michael Wright, Chief Executive Officer Stefan Camphausen, Chief Financial Officer Genex Power s Kidston
Profile of the Group in 2015
 A 0 Profile of the Group in 2015 Obrascón Huarte Lain (OHL) ranks among the leading international concession and construction groups, with more than 100 years of experience and an outstanding presence
on 12/14/2009 at 2:05 PM Labrador a4-bc9f-4b81-89f6-657b075eb230
 on 12/14/2009 at 2:05 PM CONTENTS 1. KEY FINANCIAL FIGURES 2. CONSOLIDATED INCOME STATEMENT 3. RESULTS BY DIVISION 3.1. ACCIONA Energy 3.2. ACCIONA Infrastructures 3.3. ACCIONA Real Estate 3.4. ACCIONA
Good afternoon and welcome to our Business Results Press Conference.
 Business Results Press Conference February 21, 2018 Marcelino Fernández Verdes, CEO Page 1 of 7 Check against delivery. Good afternoon and welcome to our Business Results Press Conference. We would like
English Version 6M16 MANAGEMENT REPORT (JANUARY JUNE)
") English Version 6M16 MANAGEMENT REPORT (JANUARY JUNE) September 28 th, 2016 Table of Contents 1. Selected consolidated data...3 2. Significant events...4 3. Consolidated income statement...5 3.1. Key operating
English Version 6M16 MANAGEMENT REPORT (JANUARY JUNE) September 28 th, 2016 Table of Contents 1. Selected consolidated data...3 2. Significant events...4 3. Consolidated income statement...5 3.1. Key operating
Siemens Gamesa Renewable Energy Q3 18 Results
 Siemens Gamesa Renewable Energy Q3 18 Results 27 July 2018 Disclaimer This material has been prepared by Siemens Gamesa Renewable Energy, and is disclosed solely for information purposes. This document
O&M in the Last Mile Ezentis manages, maintains and deploys infrastructure for telecommunications and utilities companies.
 1 O&M in the Last Mile Ezentis manages, maintains and deploys infrastructure for telecommunications and utilities companies. Focus on Latin America where Ezentis activity represents 91,3% of total Group
Q Results. Strong start in May 3, 2016
 Q1 2016 Results Strong start in 2016 May 3, 2016 Legal Disclaimer Information in this presentation may involve guidance, expectations, beliefs, plans, intentions or strategies regarding the future. These
Infrastructure. Services 3Q2011 EARNINGS REPORT. Energy
 Infrastructure 3Q2011 EARNINGS REPORT Services Energy 1. HIGHLIGHTS 2 2. EXECUTIVE SUMMARY 3 3. SUMMARY BY BUSINESS AREA 4 4. INCOME STATEMENT 6 5. BALANCE SHEET 9 6. CASH FLOW 12 7. BUSINESS PERFORMANCE
2018 Full Year Results 20 November 2018
 2018 Full Year Results 20 November 2018 Disclaimer Certain information included in the following presentation is forward looking and involves risks, assumptions and uncertainties that could cause actual
Earnings Release First Half 2017
 Earnings Release First Half 2017 30 August 2017 Results overview Regional segments Final remarks PAGE 3 PAGE 16 PAGE 27 Europe Africa Latin America 2 Key highlights BACK TO GROWTH Turnover up 15% YoY to
Results 2008 Non audited figures. Results Report Year 2008
 Results Report Year 2008 February 26 th, 2009 1 INDEX EXECUTIVE SUMMARY...3 1.1. Main financial figures...3 1.2. Main figures by activity...4 1.3. Relevant facts occurred until September 2008...5 2. CONSOLIDATED
Business evolution report ABENGOA. Contents
 2 Contents 1.- General information... 3 2.- Evolution and business results... 4 3.- Information on the foreseeable evolution of the Group... 11 4.- Financial risk management... 12 5.- Information on research
FY 2008 Results Presentation 27 th February 2009
 27 th February 2009 Disclaimer This document has been prepared by Acciona, S.A. ( Acciona or the Company ) exclusively for use during the presentation of financial results of the 2008 fiscal year. Therefore
RESULTS PRESENTATION 1 ST QUARTER 2011
 RESULTS PRESENTATION 1 ST QUARTER 2011 HIGHLIGHTS STRUCTURE AND SEGMENT REPORTING MANAGEMENT ANALYSIS - ECONOMIC AND FINANCIAL ANALYSIS - ANALYSIS BY SEGMENT - CAPEX - NET DEBT APPENDICES HIGHLIGHTS HIGHLIGHTS
SACYR REPORTS EBITDA OF 318 MILLION (+33%) AND ITS TURNOVER INCREASES BY 8.5%
 AND ITS TURNOVER INCREASES BY 8.5%") PRESS RELEASE The group achieves net profits of 370 million SACYR REPORTS EBITDA OF 318 MILLION (+33%) AND ITS TURNOVER INCREASES BY 8.5% International construction revenue represents 75% of the total,
PRESS RELEASE The group achieves net profits of 370 million SACYR REPORTS EBITDA OF 318 MILLION (+33%) AND ITS TURNOVER INCREASES BY 8.5% International construction revenue represents 75% of the total,
INFRASTRUCTURE. Management. Report 2008 SERVICES CEMENT ENERGY
 INFRASTRUCTURE Management SERVICES Report 2008 CEMENT ENERGY 1. HIGHLIGHTS 2 2. EXECUTIVE SUMMARY 4 3. SUMMARY BY BUSINESS AREA 5 4. INCOME STATEMENT 7 5. BALANCE SHEET 11 6. CASH FLOW 13 7. BUSINESS PERFORMANCE
Siemens Gamesa Renewable Energy Q Results
 Siemens Gamesa Renewable Energy Q2 208 Results 04 May 208 Disclaimer This material has been prepared by Siemens Gamesa Renewable Energy, and is disclosed solely for information purposes. This document
RESULTS 2017 MADRID, FEBRUARY 27 TH
 RESULTS 2017 MADRID, FEBRUARY 27 TH 2018 www.indracompany.com CONTENTS 1. Introduction & Key Figures 3 2. Analysis of the Consolidated Financial Statements (IFRS) 5 3. Analysis by Vertical Markets 9 4.
Third quarter results. 15 November 2010
 Third quarter results 15 November 2010 1 Period operatives keys Analysis of 3Q10 results Business areas Appendices 2 Period operative keys SyV third quarter results reflect the advancement made in: INTERANTIONAL
FORACO INTERNATIONAL S.A. MANAGEMENT S DISCUSSION & ANALYSIS
 FORACO INTERNATIONAL S.A. MANAGEMENT S DISCUSSION & ANALYSIS Three-month and nine-month periods ended September 30, 2017 FORACO INTERNATIONAL S.A. MANAGEMENT S DISCUSSION AND ANALYSIS The following Management
Financial information for the year ended December 31, 2017
 Financial information as of December 31, 2017 Société Anonyme (corporation) with share capital of 1,516,715,885 Registered office: 13 boulevard du Fort de Vaux - CS 60002 75017 PARIS - France 479 973 513
2014 Results. 18 February 2015 Madrid
 2014 Results 18 February 2015 Madrid Disclaimer/Notice to Recipients This presentation contains forward-looking statements and information relating to Abertis Infraestructuras, S.A. ( Abertis ) and its