INDEX 1 Executive Summary Main figures Relevant facts 5. 2 Consolidated Financial Statements 6
|
|
|
- Norah Shaw
- 5 years ago
- Views:
Transcription
1
2 INDEX 1 Executive Summary Main figures Relevant facts 5 2 Consolidated Financial Statements Income Statement Sales and Backlog Operating Results Financial Results Net Profit Attributable to the Parent Company Consolidated Balance Sheet Non-Current Assets Working Capital Net Debt Net Worth Net Cash Flows Operating Activities Investments Other Cash Flows 14 3 Areas of Activity Evolution Construction Industrial Services Services 20 4 Annex Main figures per area of activity Share data Exchange rate effect Main Awards of the Period Construction Industrial Services Services Glossary 26 Non-Audited Figures 2
3 1 Executive Summary 1.1. Main figures Key operating & financial figures Euro Million 3M16 3M17 Var. Turnover 7,518 8, % Backlog 59,191 68, % Months EBITDA (1) % Margin 7.0% 7.4% EBIT (1) % Margin 5.3% 5.3% Attributable Net Profit % EPS % Net Investments (182) 78 n.a Investments Disposals Total Net Debt 3,840 1, % Businesses' Net Debt 3,298 1,492 Project Financing Note: Urbaser is restated as discontinued operation in the financial accounts of the comparable period after its sale in the last quarter of Data presented according to management criteria. (1) Includes Joint Ventures Net Results (companies executing projects managed with partners) not fully consolidated. Sales in the period accounted for 8,357 million, an increase of 11.2% compared to the same period of the previous year. This positive sale evolution, with a particular good performance of CIMIC which grew by 26%, confirms the upward trend which started in the second half of 2016, especially the construction activity which grows by 14.8%. Backlog accounted for 68,092 million, growing by 15.0% mainly due to the positive evolution of the order intakes in the first quarter of the year, currency tailwinds and backed by the backlog integration of the corporate acquisitions carried out by CIMIC in the prior year, particularly UGL. EBITDA of the Group accounted for 621 million, a 17.4% increase mainly due to the positive evolution of the construction activity. EBITDA margin stands at 7.4% improving by 40 bp due to the progressive improvements in HOCHTIEF during the last quarters. EBIT accounted for 446 million and grew by 11.1%. EBIT margin stood at 5.3% due to an activity increase in capital intensive businesses such as contract mining which implies higher D&A. Non-Audited Figures 3
4 Main figures details Euro Million 3M16 3M17 Var. Backlog 59,191 68, % Direct 51,139 59, % Proportional* 8,051 8, % Work Done 8,138 8, % Direct 7,518 8, % Proportional* % EBITDA % Direct % Proportional* 41 0 n.a EBIT % Direct % Proportional* 41 0 n.a * Refers to the proportional stake of the operating Joint Ventures and projects not fully consolidated in the Group Net profit of accounted for 233 million which represents a 6.0% increase compared to the same period of the prior year. GRUPO ACS Net Profit Euro Million 3M16 3M17 Var. Net Profit Construction % Net Profit Industrial Services % Net Profit Services % Net Profit Corporation % Net Profit % Net debt stood at 1,695 million, 2,146 million lower than the outstanding balance 12 months ago backed, by a strong operating cash generation and the sale of Urbaser. Group indebtedness evolution Indebtedness evolution 3,028 2,982 5,989 4, ,827 3, ,695 Mar-13 Mar-14 Mar-15 Mar-16 Mar-17 Deuda Neta Deuda ligada a Activos Mantenidos para la Venta Non-Audited Figures 4
5 1.2. Relevant facts a) Dividends On December 22 nd, 2016, exercising the powers granted by resolution of the General Shareholder s Meeting of the Company held on May 5 th, 2016, the Board of Directors approved the distribution of the interim dividend for 2016 through the scrip dividend system. To this end, it was agreed to proceed to the second execution of the capital increase against reserves up to 142 million (equivalent to around 0.45 per share), in order that shareholders could choose between continuing to receive remuneration in cash or either in shares of the Company. This simultaneous capital increase and reduction has been made in February b) Corporate Governance On February 28 th 2017, ACS Board of Directors agreed to appoint Mrs. Carmen Fernández Rozado as independent Board Director as well as Chairman and member of the Audit Committee. On May 4 th 2017, General Shareholder s Meeting approved the appointment of Mr. Marcelino Fernández Verdes as Board of Director of ACS. Likewise, the Board of Director has proceeded to appoint him as Chief Executive Officer of ACS during today s meeting (May 11 th ) c) Corporation On May 8 th 2017, ACS, Actividades de Construcción y Servicios, S.A. obtained an investment grade credit rating of BBB in a long term basis and A-2 in a short term basis, with a stable outlook, from Standard & Poor s agency. Likewise, on May 10 th, HOCHTIEF and CIMIC obtained the same credit rating. Non-Audited Figures 5
6 2 Consolidated Financial Statements 2.1 Income Statement Income statement Euro Million 3M16 3M17 Net Sales 7, % 8, % +11.2% Other revenues % % -36.2% Joint Ventures Net Results* % % -99.5% Total Income 7, % 8, % +9.9% Operating expenses (5,547) (73.8 %) (5,879) (70.3 %) +6.0% Personnel expenses (1,598) (21.3 %) (1,931) (23.1 %) +20.8% Operating Cash Flow (EBITDA) % % +17.4% Fixed assets depreciation (120) (1.6 %) (153) (1.8 %) +28.0% Current assets provisions (8) (0.1 %) (23) (0.3 %) % Ordinary Operating Profit (EBIT) % % +11.1% Impairment & gains on fixed assets (4) (0.1 %) (13) (0.2 %) Other operating results (13) (0.2 %) (10) (0.1 %) Operating Profit % % +10.3% Financial income % % +5.1% Financial expenses (135) (1.8 %) (126) (1.5 %) -7.2% Ordinary Financial Result (91) (1.2 %) (79) (0.9 %) -13.2% Foreign exchange results % % Changes in fair value for finacial instruments (21) (0.3 %) % Impairment & gains on finacial instruments % % Net Financial Result (15) (0.2 %) (16) (0.2 %) +6.8% Results on equity method* (1) (0.0 %) (1) (0.0 %) n.a. PBT of continued operations % % +10.5% Corporate income tax (128) (1.7 %) (114) (1.4 %) -10.9% Net profit of continued operations % % +22.0% Profit after taxes of the discontinued operations % % n.a. Consolidated Result % % +13.7% Minority interest (37) (0.5 %) (60) (0.7 %) +59.1% Minority interest from discontinued operations (2) 0 Net Profit Attributable to the Parent Company % % +6.0% Var. * The Joint Ventures Net Results, which are those companies that are executing projects but managed with partners, has been included in the Total Income figure, whilst the Results on Equity Method includes the net results of the rest of affiliated companies Non-Audited Figures 6
7 2.1.1 Sales and Backlog Net sales in the period accounted for 8,357 million, 11.2% more than those registered in the same period of the prior year, mainly due to the positive evolution on the construction activities. Sales breakdown by geographical areas demonstrates the diversification of the Group s revenue sources, where North America represents 42.5% of the sales, Asia Pacific 29.4%, Spain 12.9% and the remaining 15.2%. Sales per Geographical Areas Euro Million 2016 % 3M17 % Var. Spain 1, % 1, % -5.9% Rest of Europe % % +13.6% North America 3, % 3, % +3.5% South America % % +5.6% Asia Pacific 1, % 2, % +34.3% Africa % % +62.0% TOTAL 7,518 8, % Sales per Geographical Area (inter area of activity adjustments excluded) Construction Industrial Services Services Euro Million 3M16 3M17 % 3M16 3M17 % 3M16 3M17 % Spain % % % Rest of Europe % % % North America 2,965 3, % % 0 0 n.a. South America % % 0 0 n.a. Asia Pacific 1,607 2, % % 0 0 n.a. Africa 0 0 n.a % 0 0 n.a. TOTAL 5,362 6, % 1,787 1, % % In construction, it is worth noting the activity rebound in Asia Pacific which grew by 34.7% thanks to the positive evolution in CIMIC. Activity in North America, with the larger contribution, maintains its solid growth of around 7%. Likewise, Europe and Asia Pacific show positive growth rates except for Spain which experienced a reduction of 14.4%. In Industrial Services, the activity fall in North America due to the production adjustment in Mexico is offset by the positive evolution of the rest of the international activity, particularly in Asia Pacific. Domestic activity remains practically stable. Services sales decreased by 8.1% due to the sale of Sintax at the end of 2016, thus the only activity remaining in this area is Clece which grew by 0.7% this quarter. Group s backlog stood at 68,092 million and grew by 15.0% in the last twelve months thanks to the positive evolution of the contracting activities in the international market, particularly in North America and Asia Pacific. Non-Audited Figures 7
8 Backlog per Geographical Areas Euro Million Mar-16 % Mar-17 % Var. Spain 6, % 6, % +1.5% Rest of Europe 5, % 5, % +5.2% North America 20, % 24, % +18.9% South America 3, % 4, % +35.6% Asia Pacific 22, % 26, % +15.4% Africa % % -6.1% TOTAL 59,191 68, % Backlog per Geographical Area Construction Industrial Services Services Euro Million Mar-16 Mar-17 % Mar-16 Mar-17 % Mar-16 Mar-17 % Spain 2,960 2, % 2,020 2, % 1,531 1, % Rest of Europe 4,884 5, % % % North America 18,258 22, % 1,953 1, % 0 0 n.a. South America 2,046 2, % 1,502 2, % 0 0 n.a. Asia Pacific 20,926 24, % 1,768 1, % 0 0 n.a. Africa % % 0 0 n.a. TOTAL 49,182 57, % 8,426 8, % 1,583 1, % It is worth noting the evolution of Construction s backlog in North America, after the good performance of the new order intakes in Dragados, Turner and Flatiron, while domestic backlog is reduced by 11.4% due to the absence of public tenders. The backlog of the rest of Europe shows a slight recovery of 6.2%. Likewise, Asia Pacific s backlog grew by 18.0% mainly due to the integration of UGL at year end. Industrial Services experienced solid growth in its backlog of 3.8%, mainly in South America thanks to the recent award of energy projects. It is worth noting the recovery of the domestic backlog with a slight increase with respect to that of the comparable period. Lastly, Clece s backlog increased by 25.9% thanks to the positive evolution of the domestic backlog which grew by 25.3% as well as the new awards in United Kingdom Operating Results Operating Results Euro Million 3M16 3M17 Var. EBITDA % EBITDA Margin 7.0% 7.4% Depreciation (120) (153) +28.0% Construction (103) (138) Industrial Services (9) (9) Services (7) (6) Corporation (0) (0) Current assets provisions (8) (23) % EBIT % EBIT Margin 5.3% 5.3% Non-Audited Figures 8
9 EBITDA accounted for 621 million, showing an increase of 17.4% compared to EBIT accounted for 446 million, growing by 11.1% with respect to the prior period Financial Results Financial Results Euro Million 3M16 3M17 Var. Financial income % Financial expenses (135) (126) -7.2% Ordinary Financial Result (91) (79) -13.2% Construction (41) (40) -3.2% Industrial Services (16) (15) -7.9% Services (4) (2) -42.8% Corporation (29) (22) -26.2% The ordinary financial result decreased by 13.2%. Financial expenses dropped by 7.2% as a result of the reduction of the gross debt. The net financial result includes the effect of financial derivatives, such as the impact of the stock option plan which matured last April 2017, and the and pre-tax income from impairment and disposal of financial assets. This last item includes in 2016 the capital gains from the prepaid forward sale of Iberdrola shares while in 2017 it includes the capital gains from the sale of Sintax and Ausol as well as the revaluation of certain financial assets. Financial Results Euro Million 3M16 3M17 Var. Ordinary Financial Result (91) (79) -13.2% Foreign exchange Results % Impairment non current assets results (21) 25 n.a Results on non current assets disposals % Net Financial Result (15) (16) +6.8% Net Profit Attributable to the Parent Company The net profit of the Construction business grew by 26.5% underpinned by the excellent performance of HOCHTIEF and its subsidiaries whose net profit increased by 39.4% The net profit of the Industrial Services area grew by 4.6% as a result of the international activity boost and the domestic activity stabilization. Services' net profit decreased 45.1% due to the sale of Urbaser and Sintax at year end, thus with no contribution in this period. Clece s net profit increased by 0.7%. Corporation's results reached 10 million. The net profit of the ACS Group in the first quarter of 2017 reached 233 million, 6.0% higher than the prior year. Non-Audited Figures 9
10 GRUPO ACS Net Profit Euro Million 3M16 3M17 Var. Net Profit Construction % Net Profit Industrial Services % Net Profit Services % Net Profit Corporation % Net Profit % Non-Audited Figures 10
11 2.2 Consolidated Balance Sheet Euro Million Dec-16 Consolidated balance sheet Mar-17 Intangible Fixed Assets 4, % 4, % -0.7% Tangible Fixed Assets 1, % 1, % -2.9% Investments accounted by Equity Method 1, % 1, % -1.6% Long Term Financial Investments 2, % 2, % -5.0% Long Term Deposits % % +0.0% Financial Instruments Debtors % % -12.3% Deferred Taxes Assets 2, % 2, % -1.8% Fixed and Non-current Assets 12, % 12, % -2.3% Non Current Assets Held for Sale % % -15.2% Inventories 1, % 1, % -3.7% Accounts receivables 10, % 11, % +7.1% Short Term Financial Investments 1, % 1, % -7.8% Financial Instruments Debtors % % +31.8% Other Short Term Assets % % -12.1% Cash and banks 5, % 5, % -4.5% Current Assets 20, % 20, % +1.2% TOTAL ASSETS 33, % 33, % -0.1% Shareholders' Equity 3, % 3, % +8.9% Adjustments from Value Changes % % n.a. Minority Interests 1, % 1, % -0.6% Net Worth 4, % 5, % +6.1% Subsidies % % -28.0% Long Term Financial Liabilities 4, % 5, % +8.4% Deferred Taxes Liabilities 1, % 1, % -2.1% Long Term Provisions 1, % 1, % -3.9% Financial Instruments Creditors % % -17.4% Other Long Term Accrued Liabilities % % +10.1% Non-current Liabilities 7, % 8, % +4.0% Liabilities from Assets Held for Sale % % -9.8% Short Term Provisions 1, % 1, % -0.9% Short Term Financial Liabilities 3, % 3, % -8.6% Financial Instruments Creditors % % +31.8% Trade accounts payables 14, % 14, % -1.3% Other current payables % % -24.7% Current Liabilities 20, % 19, % -3.2% TOTAL EQUITY & LIABILITIES 33, % 33, % -0.1% Var. Non-Audited Figures 11
12 2.2.1 Non-Current Assets Intangible assets which amounts to 4,366 million include goodwill from past strategic transactions, of which 1,389 million come from the acquisition of HOCHTIEF in 2011 and 743 million from ACS s merger with Dragados in The balance of the investments held by equity method includes various holdings in associated companies from HOCHTIEF, Saeta Yield and several Iridium Concessions Working Capital Working Capital evolution* Euro Million Mar-16 Jun-16 Sep-16 Dec-16 Mar-17 Construction (1,226) (1,169) (1,172) (2,521) (1,764) Industrial Services (820) (912) (898) (1,167) (940) Services 41 (13) Corporation 39 (20) TOTAL (1,967) (2,115) (2,013) (3,640) (2,613) *Ex Urbaser In the last 12 months, the net working capital has increased its credit balance by 646 million. This variation is mainly due to changes in perimeter as a result of the acquisition and disposal of businesses in The variation in the last quarter is mainly due to the seasonality effect of the operating working capital which has increased its debit balance in 1,013 million while in the last twelve months this variation of the operating working capital has improved by 17 million. The balance of factoring and securitization at the end of the period stood at 732 million, slightly lower than in December Net Debt Net Debt ( mn) Industrial Corporation / Construction Services March 31, 2017 Services Adjustments LT loans from credit entities ,420 2,732 ST loans from credit entities ,907 Debt with Credit Entities 1, ,438 4,639 Bonds 2, ,603 3,727 Non Recourse Financing Other financial liabilities* (372) 204 Total Gross Financial Debt 4,530 1, ,669 8,773 ST* & other financial investments ,679 Cash & Equivalents 3,609 1, ,399 Total cash and equivalents 4,524 1, ,078 NET FINANCIAL DEBT 6 (647) 186 2,150 1,695 (*) Debt and credit with associates are included in "Other financial liabilities" and "ST financial investments" Net debt stood at 1,695 million, 2,146 million lower than the outstanding balance 12 months ago thanks to the positive evolution of the funds from operations and backed by sale of Urbaser. Net debt linked to assets held for sale amounted to 241 million, mainly linked to energy projects. Non-Audited Figures 12
13 2.2.4 Net Worth Net Worth Euro Million Dec-16 Mar-17 Var. Shareholders' Equity 3,571 3, % Adjustment s from Value Changes 11 5 n.a Minority Interests 1,400 1, % Net Worth 4,982 5, % The Net worth of ACS accounts for 5,284 million by period-end, showing an increase of 6.1% since December The balance of minority interests includes both the equity participation of minority shareholders of HOCHTIEF as well as minority interests included in the balance of the German company, mainly related to minority shareholders of CIMIC Holdings. 2.3 Net Cash Flows Net Cash Flow Euro Million 3M16 3M17 Var TOTAL HOT ACS exhot TOTAL HOT ACS exhot TOTAL ACS exhot Cash Flow from Operating Activities before Working Capital % -29.0% Operating working capital variation (1,052) (482) (569) (1,013) (554) (460) Net CAPEX (57) (30) (26) (92) (61) (30) Net Operating Cash Flow from continuing activities (692) (400) (292) (598) (324) (274) -13.5% -6.1% Net Operating Cash Flow from discontinued operations (*) (15) 0 (15) (0) 0 (0) Financial Investments/Disposals 381 (219) (6) 19 Other Financial Sources (26) (4) (23) 2 (2) 4 Free Cash Flow (353) (622) 270 (583) (333) (251) +65.4% n.a. Dividends paid (79) (17) (62) (66) (5) (61) Intra group Dividends Treasury stock acquisition (120) (80) (40) Total Cash Flow generated / (Consumed) (552) (719) 168 (650) (338) (312) +17.8% n.a. *Correspond to Urbaser Operating Activities Cash Flow from Operating Activities before working capital amount to 507 million, improving by 21.6% respect to March The recovery in the construction activity as well as the improvement of financial expenses have contributed to the positive evolution of the operating cash flow. Operating working capital has an impact of 1,013 million of cash outflow in this period coming from both HOCHTIEF as well as the remaining activities, due to the seasonality effect of the period. However operating working capital variation in the last twelve months has been practically neutral with a cash inflow of 17 million distributed among the different activities in an equivalent way, thus confirming the positive trend in the working capital control of the Group. Non-Audited Figures 13
14 2.3.2 Investments Euro Million Operating Investments Operating divestments NET CAPEX Project / Financial Investments Financial Divestments Investments breakdown Net Project / Financial invesments Total Net Investments Construction 104 (28) (20) 9 85 Dragados 18 (3) 15 0 (0) (0) 15 Hochtief 87 (25) (20) 6 68 Iridium Services 7 (1) 6 1 (55) (54) (48) Industrial Services 11 (1) (5) Corporation & others (0) (2) (3) (2) TOTAL 122 (30) (83) (13) 78 The total investments of the ACS Group amounted to 191 million, while divestments amounted to 113 million, resulting in a net positive cash flow balance for investing activities of 78 million. a) Construction Operating CAPEX in the construction business corresponds mainly to the acquisition of machinery for contract mining in CIMIC. Total investment in concession projects and financial investments in Construction business reached 30 million which practically corresponds to UGL s minorities acquisition. Divestments mainly correspond to the sale of certain HOCHTIEF Europe s financial holdings. b) Industrial Services In Industrial Services area, financial investments amounted to 39 million corresponding to investments in energy projects. Net operating investment in Industrial Services amounted to 10 million. c) Services Net operating investments correspond entirely to Clece after the sale of Urbaser in December Financial divestments in Services correspond manily to the sale of Sintax which was signed by 2016 year end and completed in February 2017 for a total amount of 55 million Other Cash Flows The Group has paid 66 million of dividends in cash which practically corresponds to ACS scrip dividend paid last February. Non-Audited Figures 14
15 3 Areas of Activity Evolution 3.1 Construction Construction Euro Million 3M16 3M17 Var. Turnover 5,362 6, % EBITDA % Margin 6.0% 6.6% EBIT % Margin 4.1% 4.2% Net Profit % Margin 1.3% 1.5% Backlog 49,182 57, % Months Net Investments n.s Working Capital (1,226) (1,764) +43.9% Construction sales accounted for 6,158 million representing an increase of 14.8% thanks to the significant activity recovery in CIMIC, particularly of its construction business, and also backed by the positive evolution of the rest of HOCHTIEF and Dragados. Construction Sales per geographical areas Euro Million 3M16 3M17 Var. Spain % Rest of Europe % North America 2,965 3, % South America % Asia Pacific 1,607 2, % Africa 0 0 n.a. TOTAL 5,362 6, % EBITDA accounted for 406 million, increasing by 26.7% compared to March 2016 with a margin improvement of 60 bp thanks to the higher operating efficiency in HOCHTIEF. EBIT accounted for 257 million, and grew by 17.6%, margin improved by 10 bp despite the increase in D&A mainly in HOCHTIEF Asia Pacific as a result of the contract mining activity rebound which is capital intensive. The depreciation of assets from the acquisition of HOCHTIEF (PPA) accounted for 18.1 million in the period, the same figure as that of the comparable period. Construction Net Profit reached 91 million which implies a 26.5% increase due to the factors above mentioned. Backlog at the end of the period stood at 57,349 million, 16.6% higher compared to the figure recorded 12 months ago. This is backed by the growth in America and the positive evolution of the contracting activity in Dragados, as well as the integration of UGL in HOCHTIEF Asia Pacific by 2016 year end. Non-Audited Figures 15
16 Construction Euro Million Construction Backlog per geographical areas Euro Million Mar-16 Mar-17 Var. Spain 2,960 2, % Rest of Europe 4,884 5, % North America 18,258 22, % South America 2,046 2, % Asia Pacific 20,926 24, % Africa % TOTAL 49,182 57, % Dragados Iridium HOCHTIEF (ACS contr.) Adjustments 3M16 3M17 Var. 3M16 3M17 Var. 3M16 3M17 Var. 3M16 3M17 3M16 3M17 Var. Sales % % 4,414 5, % 0 0 5,362 6, % EBITDA % % % 0 (0) % Margin 8.0% 8.0% n.a n.a 5.5% 6.3% 6.0% 6.6% EBIT % 1 (3) n/a % (18) (18) % Margin 6.4% 5.6% n.a n.a 4.0% 4.3% 4.1% 4.2% Net Financial Results (14) (11) (0) 1 (24) (21) (0) 0 (38) (31) Equity Method (3) (0) (0) 2 0 Other Results & Fixed Assets (1) 0 (1) (0) (4) (10) 0 (0) (6) (10) EBT % 1 (0) n/a % (18) (18) % Taxes (13) (10) (0) 1 (62) (64) 6 6 (70) (67) Minorities 1 (0) (0) (0) (41) (62) 6 6 (34) (57) Net Profit % % % (7) (7) % Margin 3.5% 3.5% n.a n.a 1.0% 1.2% 1.3% 1.5% Backlog 12,024 12, % ,158 44, % 49,182 57, % Months Note: The column Adjustments includes the PPA adjustments, the PPA depreciation and the tax and minorities from both. Total Dragados increased its sales by 6.1% and EBITDA margin remains stable at 8.0% versus the comparable period. HOCHTIEF, for its part, showed significant growth across its operating magnitudes thanks to the recovery in CIMIC as well as the positive evolution in HOCHTIEF America and HOCHTIEF Europe, which continue to deliver sustainable growth. It is worth noting the continuous improvement in the operating efficiency where EBITDA margin increased by 70 bp standing at 6.3% and EBIT margin increased by 30bp up 4.3% to despite the higher D&A due to the contract mining activity rebound. HOCHTIEF 's contribution to net profit of ACS, after deducting minority interests, amounted to 63 million, 39.4% higher compared to the same period of the previous year, in proportion to its average stake in the period which stood at 71.8%. HOCHTIEF Euro Million America Asia Pacific Europe Holding Total 3M16 3M17 Var. 3M16 3M17 Var. 3M16 3M17 Var. 3M16 3M17 3M16 3M17 Var. Sales 2,519 2, % 1,576 2, % % ,414 5, % EBIT % % % (12) (10) % Margin 2.2% 2.4% 7.6% 7.4% 4.1% 3.4% 0.0% 0.0% 4.0% 4.3% Net Financial Results (3) (4) (17) (20) (8) (24) (21) Equity Method (3) (0) (0) 0 (0) 1 (3) Other Results & Fixed Assets (2) (1) (2) 2 (1) (11) (0) 0 (4) (10) EBT % % % (8) (10) % Taxes (17) (15) (40) (44) (3) (2) (2) (2) (62) (64) Minorities (5) (7) (17) (29) (0) (0) 0 (0) (23) (37) Net Profit % % 0 2 n/a (10) (11) % Margin 1.2% 1.4% 2.8% 2.9% 0.0% 0.5% 1.4% 1.7% Non-Audited Figures 16
17 By areas of activities of HOCHTIEF, it is worth highlighting: a) Growth in America where sales went up by 3.0% and net profit by 18.5%. The main factors backing this positive behavior are the good performance of the activities of Turner and Flatiron, the increasing demand and measures introduced to improve operating efficiency. b) In Europe, after a long process of transformation and adaptation to the reality of the central European construction market, the positive trend of the margins and results is confirmed. c) CIMIC, as already mentioned, experienced a substantial activity recovery growing by 26%, mainly in the construction business which the according impact in operating results. Non-Audited Figures 17
18 3.2 Industrial Services Industrial Services Key Figures Euro Million 3M16 3M17 Var. Turnover 1,787 1, % EBITDA % Margin 11.4% 11.4% EBIT % Margin 10.4% 10.3% Net Profit % Margin 6.3% 6.4% Backlog 8,426 8, % Months Net Investments (24) 43 n.a Working Capital (820) (940) +14.6% Industrial Services sales accounted for 1,856 million, showing a raise of 3.9% compared to the same period of 2016 thanks to the positive evolution of the international activity and the stabilization of the domestic market. Industrial Services Sales per geographical areas Euro Million 3M16 3M17 Var. Spain % Rest of Europe % North America % South America % Asia Pacific % Africa % TOTAL 1,787 1, % EPC projects grew by 15.8% thank to the development of international project mainly in Middle East and Japan while Support Services activities decreased by 4.1%, mainly due to the slowdown in support services domestic activity. By region, it is worth noting the good performance of the international activity in general except for North America where there are still production adjustments in the Mexican market. Noteworthy is the growth in Asia Pacific and Europe. Domestic market remains stable with respect to March Non-Audited Figures 18
19 Industrial Services Turnover breakdown by activity Euro Million 3M16 3M17 Var. Support Services 1,076 1, % Networks % Specialized Products % Control Systems % EPC Projects % Renewable Energy: Generation % Consolidation Adjustments (15) (15) TOTAL 1,787 1, % International 1,289 1, % % over total sales 72.2% 73.3% Backlog grew by 3.8% up to 8,750 million. International backlog represents 76.4% of the total amount. It is worth noting the positive evolution in South America and the slight recovery of the domestic backlog. Also noteworthy is the growth in the EPC and Networks backlogs as well as the reactivation of the renewable energy backlog. Industrial Services Backlog per geographical areas Euro Million Mar-16 Mar-17 Var. Spain 2,020 2, % Rest of Europe % North America 1,953 1, % South America 1,502 2, % Asia Pacific 1,768 1, % Africa % TOTAL 8,426 8, % Industrial Services Backlor per activity Euro Million Mar-16 Mar-17 Var. Support Services 4,766 5, % Networks % Specialized Products 3,040 3, % Control Systems 1,283 1, % EPC Projects 3,629 3, % Renewable Energy: Generation % TOTAL BACKLOG 8,426 8, % International 6,406 6, % % over total backlog 76.0% 76.4% EBITDA accounted for 211 million, 3.9% higher than in March 2016 with a stable margin that stood at 11.4%. EBIT increased by 3.1% up to 192 million, with a 10.3% margin. Net profit accounted to 119 million, 4.6% higher than in March Non-Audited Figures 19
20 3.3 Services Services Key figures Euro Million 3M16 3M17 Var. Turnover % EBITDA % Margin 5.0% 5.1% EBIT % Margin 2.9% 3.3% Net Profit % Margin 6.0% 3.6% Backlog 1,583 1, % Months Net Investments 37 (48) Working Capital Sales in the area of Services decreased by 8.1% due to the sale of Sintax by the end of 2016, without this effect, that is considering only Clece in both periods, sales remain stable. The Urban Services and Waste Treatment activities which correspond to Urbaser, sold by 2016 year-end, have been restated as discountinued operations in the prior period. The sale of Sintax (logistic services) was agreed on December 2016 and closed at the beginning of this year with a net cash inflow of 40 million. Services Sales breakdown Euro Million 3M16 3M17 Var. Facility management % Logistics % TOTAL % International % % over total sales 5.4% 4.7% EBITDA accounts for 18 million and declined by 6.1% due to Sintax sale. Net profit decreased by 45.1% amounting down to 12 million due to the fact that the figure in 2016 includes the contribution of Urbaser as discontinued operations which amounts to 17.3 million. Services backlog corresponds to Clece and accounts for 1,994 million, equivalent to over 1 year of production and increasing by 25.9% compared to the prior period. Services Backlog per geographical areas Euro Million Mar-16 Mar-17 Var. Spain 1,531 1, % Rest of Europe % TOTAL 1,583 1, % Non-Audited Figures 20
21 4 Annex 4.1 Main figures per area of activity * TURNOVER Euro Million 3M16 3M17 Var. Construction % % +14,8% Industrial Services % % +3,9% Services % % -8,1% Corporation / Adjustments (10) (6) TOTAL ,2% EBITDA Euro Million 3M16 3M17 Var. Construction % % +26,7% Industrial Services % % +3,9% Services 19 3 % 18 3 % -6,1% Corporation / Adjustments (13) (13) TOTAL ,4% EBIT Euro Million 3M16 3M17 Var. Construction % % +17,6% Industrial Services % % +3,1% Services 11 3 % 12 3 % +4,3% Corporation / Adjustments (14) (14) TOTAL ,1% NET PROFIT Euro Million 3M16 3M17 Var. Construction % % +26,5% Industrial Services % % +4,6% Services % 12 6 % -45,1% Corporation / Adjustments TOTAL ,0% NET INVESTMENTS Euro Million 3M16 3M17 Var. Construction n.a Industrial Services (24) 43 n.a Services 37 (48) n.a Corporation / Adjustments (471) (2) n.a TOTAL (182) 78 n.a BACKLOG Euro Million Mar-16 months Mar-17 months Var. Construction ,6% Industrial Services ,8% Services ,9% TOTAL ,0% NET DEBT Euro Million Mar-16 Mar-17 Var. Construction ,3% Industrial Services (561) (647) +15,4% Services ,2% Corporation / Adjustments ,1% TOTAL ,9% * Percentages are calculated according to the sum of the data for each activity Non-Audited Figures 21
22 Closing Price Volume ( 000) 4.2 Share data ACS Shares Data (YTD) 3M16 3M17 Closing price Performance % 21.78% Maximum in the period Maximum Date 30-Mar 31-Mar Minimum in the period Minimum Date 11-Feb 31-Jan Average in the period Total volume ( 000) 72,861 46,779 Daily average volume ( 000) 1, Total traded effective ( mn) 1,707 1,401 Daily average effective ( mn) Number of shares (mn) Market cap ( mn) 8,241 10, , , , , Non-Audited Figures 22
23 4.3 Exchange rate effect EXCHANGE RATE EFFECT EXCHANGE RATE EFFECT Average Exchange Rate ( vs. currency) Mar-16 Mar-17 difference % 1 US Dollar (0.0355) -3.2% 1 Australian Dollar (0.1121) -7.4% 1 Mexican Peso % 1 Brazilian Real (0.9228) -21.7% EXCHANGE RATE EFFECT Closing Exchange Rate ( vs. currency) Mar-16 Mar-17 difference % 1 US Dollar (0.0729) -6.4% 1 Australian Dollar (0.0896) -6.0% 1 Mexican Peso % 1 Brazilian Real (0.7612) -18.6% EXCHANGE RATE EFFECT Euro million USD AUD Others Total Backlog 1,301 1, ,061 Sales Ebitda Ebit Net Profit (0) EXCHANGE RATE EFFECT Euro Million USD AUD Others Total Backlog 1,277 1, ,867 Sales Ebitda Ebit Net Profit EXCHANGE RATE EFFECT Euro Million USD AUD Others Total Backlog Sales Ebitda (1) Ebit (1) 0 1 (0) Net Profit (1) 0 1 (0) EXCHANGE RATE EFFECT Construction Industrial Services Services Euro Million USD AUD Others Total Backlog 0 0 (4) (4) Sales 0 0 (1) (1) Ebitda Ebit Net Profit Non-Audited Figures 23
24 4.4 Main Awards of the Period In blue the new awards corresponding to the last quarter Construction Project Type of Project Region mn Execution of Zuidasdok project comprinsing the broadening and tunneling of the A10 South in Amsterdam, the road will go underground at the level of the current Amsterdam Zuid station (Amsterdam, Netherlands) Project for the construction of the new bridge on the current NC12 road between Pea Island National Wildlife Refuge and the city of Rodanthe (North Carolina, United States) Civil Works Europe Civil Works America Contract for the highway 427 expansion in Ontario, the contract involves the design, build, finance and maintain (DBFM) of approx km (Canada) Design and construction of Northlink Stage 3 comprising the construction of a free-flowing dual carriageway between Ellenbrook and Muchea (Perth, Asutralia) Roads America Civil Works Asia Pacific Project for M1 Pacific Motorway widening (New South Wales, Australia) Civil Works Asia Pacific Construction and development of different subway stations of the Line 3 of the Santiago de Chile subway (Chile) Railways America 99.6 Contract mining services for Satui and Bayan s Wahana coal mines in Indonesia Contract mining Asia Pacific 96.0 Construction of the highway Ruta Nacional Nº 19 between San Francisco and Río Pomero in Córdoba province (Argentina) Roads America 95.2 Construction of the three residential towers Vipul Aarohan residences in Gurgaon (India) Building Asia Pacific 76.5 Works for the replacement of two bridges in the Myrtle Avenue railway line (New York, United States) Design and construction of four new primary schools (three in Auckland and one in Hamilton) as well as operational services of the schools for 25 years (Australia) Railways America 76.3 Building Asia Pacific 72.9 New school building in Jackson Heights (New York, United States) Building America 58.0 Construction of the Schwabinger Carre II residential building in Munich (Germany) Building Europe 54.1 Construction of Lister Dreieck office building (Hannover, Germany) Building Europe 52.8 Construction of the new Hospital of the National Policy of Peru (Lima, Peru) Building America 47.4 Project for the construction of Al Garhoud Towers in Dubai (United Arab Emirates) Building Asia Pacific 45.9 Process upgrade and equipment replacement project at the Woodleigh Waterworks by PUB, Singapore s national water agency (Singapore) Civil Works Asia Pacific 44.8 Improvement and enlargement of the SH 199 highway in Tarrant county (Texas, United States) Civil Works America 43.0 Improvement works at the interchange of State Road 93 (I-75) and State Road 64 in Manatee County (Florida, United States) Roads America 36.8 Non-Audited Figures 24
25 4.4.2 Industrial Services Proyect Type of Project Region mn Design, construction, operation and maintenance of the Gamboa water treatment plant (Panama) EPC project for the construction of Hidromanta hydroelectric power plant with an installed capacity of 19.8 MW (Peru) Contract for point of sale outsourcing in 6,000 Repsol oil service stations in Spain Concession of the electronic collection system for the SITEUR (Urban Electric Train System) in the city of Guadalajara (Jalisco, Mexico) Contract for maintenance works at Enel s electrical substations in Chile EPC America EPC America 40.5 Control systems Europe 28.0 Control systems America 24.8 Networks America 17.7 Works for the conservation of street lighting in the city of Barcelona (Spain) Control systems Europe Services Project Type of Project Region mn Renewal of the contract for home care services in Jaen (Spain) Cleaning services contract for Miguel Servet Hospital (Zaragoza, Spain) Renewal of the cleaning services contract for Ramón y Cajal and Niño Jesús Hospitals (Madrid, Spain) New contract for home care services in Las Palmas de Gran Canaria (Spain) Services for citizens Services for buildings Services for buildings Services for citizens Spain 42.2 Spain 35.8 Spain 31.2 Spain 16.7 Non-Audited Figures 25
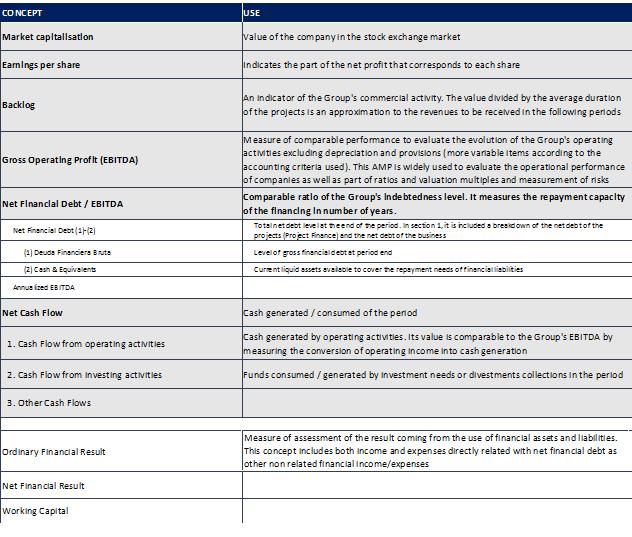
26 9. Glossary ACS Group presents its results in accordance with the International Financial Reporting Standards (IFRS). However, the group makes use of some alternative measures of performance (APM) to provide additional information that promote comparability and understanding of its financial information, and facilitates decision making and evaluation of the performance of the group. Below are the most outstanding APMs. CONCEPT DEFINITION and COHERENCE mar-17 mar-16 Market capitalisation Num of shares at period close x price at period close 10,036 8,241 Earnings per share Net Profit of the period / Average num of shares of the period Net Attributable profit Total Income - Total Expenses of the period - Minority interests result Average num. of shares of the period Daily average outstanding shares in the period adjusted by treasury stock Backlog Value of the contracts awarded and pending to be executed. In section 1.1, a breakdown is made between a direct and proportional portfolio (referring to proportional participation in joint operating companies and projects not consolidated globally in the Group) 68,092 59,191 Gross Operating Profit (EBITDA) Operating Profit excluding (1) D&A y (2) non recurrent operating results and/or which dont imply a cash flow + Net Results from Joint Ventures (+) Operating Profit Operating income - Operating expenses (-) 1.D&A Operating provisions and fix asset depreciation (176) (128) (-) 2. Non recurrent operating results and/or which dont imply a cash flow Impairment & gains on fixed assets + other operating results (23) (18) (+) Net profit from Joint Ventures Profit before Taxes from foreign joint ventures consolidated by Equity method. It is similar to the UTEs regime in Spain, thus it is included in the EBITDA in order to standardize the accounting criteria with the Group's foreign companies 0 41 Net Financial Debt / EBITDA Net Financial Debt / Annualized EBITDA 0.7x 5.1x Net Financial Debt (1)-(2) Gross external financial debt +Net debt with group companies - Cash & Equivalents 1,695 10,759 (1) Deuda Financiera Bruta Bank debt + Obligations and other negotiable securities + Project finance and non recourse debt + Financial lease + Other l/t non bank debt + Debt with group companies 8,773 10,770 (2) Cash & Equivalents Temporary Financial investments + L/T deposits + Cash & Equivalents 7, Annualized EBITDA EBITDA of the period / num of month within the period x 12 months 2,486 2,116 Net Cash Flow 1. Cash Flow from operating activities (1) Cash Flow from operating activities + (2) Cash Flow from investing activities + (3) Other Cash flows Adjusted Net Profit attributable + Operating working capital variation ex discontinued operations (761) (1,102) (507) (635) Adjusted Net Profit attributable Net profit attributable (+/-) adjustments of concepts which dont imply an operating cash flow Operating working capital variation 2. Cash Flow from investing activities (-) Payments from investments (+) Collections from divestments 3. Other Cash Flows Working capital variation of the period (+/-) ajustments of non operating concepts (Ej: dividends, interests, taxes, etc) Net investments (paid/collected) ex discontinued operations Payments for operating, project and financial investments. This figure may differ from that shown in section for reasons of deferral (accruals) ex discontinued operations Collections from operating, project and financial divestments. This figure may differ from that shown in section for reasons of deferral (accruals) ex discontinued operations Treasury stock sale/acquisition + Dividend payments + Other financial sources + Cash generated from discontinued operations (1,013) (1,052) (190) (346) (192) (315) 2 (31) (64) (120) ene-00 ene-00 Ordinary Financial Result Financial Income - Financial expenses (79) (91) Net Financial Result Ordinary financial result + Foreing exchange results + Impairment non current assets results + Results on non current assets disposals (16) (15) Working Capital Stock + Total accounts receivables - Total accounts payables - other current liabilities (2,613) (1,908) NOTE: All financial indicators and AMPs are calculated under the principles of coherence and homogeneity allowing comparability between periods and in compliance with the applicable accounting rules and standards Data in million of euros Non-Audited Figures 26
27 Non-Audited Figures 27
28 DISCLAIMER This document contains forward looking statements on the intentions, expectations or forecasts of or its management at the time the document was drawn up and in reference to various matters including, among others, its customer base, its performance, the foreseeable growth of its business lines and its overall turnover, its market share, the results of and other matters relating to the Group s activities and current position. These forward looking statements or forecasts can in some cases be identified by terms such as expectation, anticipation, proposal, belief or similar, or their corresponding negatives, or by the very nature of predictions regarding strategies, plans or intentions. Such forward looking statements or forecasts in no way constitute, by their very nature, guarantees of future performance but are conditional on the risks, uncertainties and other pertinent factors that may result in the eventual consequences differing materially from those contained in said intentions, expectations or forecasts. ACS, Actividades de Construcción y Servicios, S.A. does not undertake to publicly report on the outcome of any revision it makes of these statements to adapt them to circumstances or facts occurring subsequent to this presentation including, among others, changes in the business of the company, in its strategy for developing this business or any other possible unforeseen occurrence. The points contained in this disclaimer must be taken fully into account by all persons or entities obliged to take decisions or to draw up or to publish opinions on securities issued by and, in particular, by the analysts and investors reading this document. All the aforesaid persons are invited to consult the public documentation and information that reports to or files with the bodies responsible for supervising the main securities markets and, in particular, with the National Securities Market Commission (CNMV in its Spanish initials). This document contains financial information drawn up in accordance with International Financial Reporting Standards (IFRS). The information has not been audited, with the consequence that it is not definitive information and is thus subject to possible changes in the future Translation of this report originally issued in Spanish. In event of discrepancy, the Spanish language version prevails. Investor Relations Department ACS, Actividades de Construcción y Servicios S.A. Av. Pío XII, Madrid irgrupoacs@grupoacs.com Non-Audited Figures 28
ACS gains 233 million euros, 6% more, in the first quarter of 2017
 ACS gains 233 million euros, 6% more, in the first quarter of 2017 Sales increased by 11.2% up to 8,357 million euros Backlog increases by 15.0% up to 68,092 million euros in March 2017 Net debt decreases
5. The financial management in 2017
 5. The financial management in 2017 5.1. Consolidated FinanCial statements 5.2. Consolidated balance sheet of the acs Group 5.3. net Cash Flows of the acs Group 5.4. areas of activity evolution: ConstruCtion
1 Executive Summary Main figures Relevant facts 5. 2 Consolidated Financial Statements 6
 INDEX 1 Executive Summary 3 1.1. Main figures 3 1.2. Relevant facts 5 2 Consolidated Financial Statements 6 2.1 Income Statement 6 2.1.1 Sales and Backlog 7 2.1.2 Operating Results 8 2.1.3 Financial Results
THE FINANCIAL MANAGEMENT
 INTEGRATED REPORT 5 101 THE FINANCIAL MANAGEMENT 5.1 Consolidated Financial Statements 5.2 Consolidated balance sheet of the ACS Group 5.3 Net cash flows of the ACS Group 5.4 Areas of activity evolution:
1 Executive Summary Main figures Relevant facts 5. 2 Consolidated Financial Statements 7
 INDEX 1 Executive Summary 3 1.1. Main figures 3 1.2. Relevant facts 5 2 Consolidated Financial Statements 7 2.1 Income Statement 7 2.1.1 Sales and Backlog 8 2.1.2 Operating Results 10 2.1.3 Financial Results
Results Presentation 1Q May 12 th 2017
 Results Presentation 1Q 2017 May 12 th 2017 Executive Summary OPERATING OUTPERFORMANCE 11% Sales & EBIT recovery in CIMIC & margins stability NET PROFIT GROWTH in the HIGH END TARGET 12.6% like-for-like*
Results Presentation 3Q November 14 th 2017
 Results Presentation 3Q 2017 November 14 th 2017 Executive Summary SUSTAINED TOP LINE GROWTH with improved operating efficiency +26% (AUD) top line growth in CIMIC Stable global operating margins Strong
Results Report Results Report 3Q14 3Q14. 13th November, Non Audited Figures 1
 13th November, 2014 Non Audited Figures 1 INDEX 1 Executive Summary 3 1.1 Main figures 3 1.2 Relevant facts 4 2 Consolidated Financial Statements 7 2.1 Income Statement 7 2.1.1 Sales and Backlog 7 2.1.2
RESULTS REPORT 2016 INDEX
 INDEX 1 Executive Summary 3 1.1. Main figures 3 1.2. Relevant facts 5 2 Consolidated Financial Statements 8 2.1 Income Statement 8 2.1.1 Sales and Backlog 9 2.1.2 Operating Results 11 2.1.3 Financial Results
1 Executive Summary 3. Main figures 3 Relevant facts 5 2 Consolidated Financial Statements 8
 INDEX 1 Executive Summary 3 Main figures 3 Relevant facts 5 2 Consolidated Financial Statements 8 2.1 Income Statement 8 2.1.1 Sales and Backlog 9 2.1.2 Operating Results 11 2.1.3 Financial Results 11
1 Executive Summary Main figures Relevant facts 5. 2 Consolidated Financial Statements 6
 INDEX 1 Executive Summary 3 1.1. Main figures 3 1.2. Relevant facts 5 2 Consolidated Financial Statements 6 2.1 Income Statement 6 2.1.1 Sales and Backlog 7 2.1.2 Operating Results 9 2.1.3 Financial Results
1Q18 Key figures SALES 8,671 +3,7% +14,7% EBIT % +16.9% NET PROFIT % +13.4% NET DEBT % BACKLOG 66,677-2,1% +10.
 Key figures Figures in million YoY Var. Like for Like Var. 1 SALES 8,671 +3,7% +14,7% EBIT 473 +7.9% +16.9% NET PROFIT 250 +7.4% +13.4% NET OPERATING CASH FLOW (2) LTM 1,603 +40.9% NET DEBT 359-78.8% BACKLOG
The world s leading infrastructure developer. April 2012
 The world s leading infrastructure developer Investors Presentation Company profile, strategy and key financials April 2012 Grupo ACS The world s leading infrastructure developer Engineering contractor
Results Presentation th of February, 2014
 Results Presentation 2013 28 th of February, 2014 Executive Summary Consolidation of Global Leadership Good Operating Results Net Profit > 700 Financial structure reinforced HOCHTIEF Restructuring 2 ACS
1 Executive Summary Main figures Relevant facts 5
 INDEX 1 Executive Summary 3 1.1. Main figures 3 1.2. Relevant facts 5 2 Consolidated Financial Statements 7 2.1 Income Statement 7 2.1.1 Sales and Backlog 8 2.1.2 Operating Results 10 2.1.3 Financial Results
Results Report 1H14 1H14. 29th August, Non Audited Figures 1
 Results Report 29th August, 2014 Non Audited Figures 1 INDEX 1 Executive Summary 3 1.1 Main figures 3 1.2 Relevant facts 4 2 Consolidated Financial Statements 6 2.1 Income Statement 6 2.1.1 Sales and Backlog
1H18 Key figures SALES 17,777 +2,2% +10,1% EBITDA 1, % +8.7% EBIT % +11.9% NET PROFIT % +13.3%
 Key figures Figures in million YoY Var. Like for Like Var. 1 SALES 17,777 +2,2% +10,1% EBITDA 1,248 +2.0% +8.7% EBIT 946 +5.1% +11.9% NET PROFIT 447 +7.4% +13.3% LTM Net Operating Cash Flow 1,605 +24.1%
Presentation to Investors. December 2013
 Presentation to Investors December 2013 Who we are Engineering contractor and greenfield developer Revenues 2012 > 38 bn Current Backlog 67 bn Civil Engineering Industrial Engineering Construction Environment
Con experiencia probada
 Con experiencia probada ECONOMIC AND FINANCIAL REPORT OF ACS GROUP 2012 www.grupoacs.com Con experiencia probada Cover photo: Administrative Building (Salamanca, Spain). ECONOMIC AND FINANCIAL REPORT OF
1 Executive Summary Main figures Relevant facts 5. 2 Consolidated Financial Statements 8
 INDEX 1 Executive Summary 3 1.1. Main figures 3 1.2. Relevant facts 5 2 Consolidated Financial Statements 8 2.1 Income Statement 8 2.1.1 Sales and Backlog 9 2.1.2 Operating Results 11 2.1.3 Financial Results
1 Executive Summary Main figures Relevant facts 5. 2 Consolidated Financial Statements Income Statement 7
 INDEX 1 Executive Summary 3 1.1. Main figures 3 1.2. Relevant facts 5 2 Consolidated Financial Statements 7 2.1 Income Statement 7 2.1.1 Sales and Backlog 8 2.1.2 Operating Results 10 2.1.3 Financial Results
3Q Results Presentation November 15, 2016
 3Q 2016 Results Presentation November 15 th, 2016 Results Highlights 1 2 Solid results based on: Improved operating efficiency EBIT 1,119mn Reduction of financial expenses L-f-L (+50 bp) Net fin. expenses
Presentation of the Group
 The world s leading infrastructure developer Presentation of the Group Key figures & Global Strategy July 2012 Grupo ACS The world s leading infrastructure & concessions developer Engineering contractor
ACS gains 388 million euros of net profit in the first half of 2016
 ACS gains 388 million euros of net profit in the first half of 2016 Sales reached 16,387 million euros, 5.3% lower in a like for like basis adjusted by currency impacts and the sale of renewable assets
Madrid, February 25 th, 2011
 Madrid, February 25 th, 2011 This document contains forward-looking statements on the intentions, expectations or forecasts of Grupo ACS or its management at the time the document was drawn up and in reference
Net Profit in the first semester of 2014 grew by 10.7% up to 395 Euro million
 Net Profit in the first semester of 2014 grew by 10.7% up to 395 Euro million Sales stand at 18,759 Euro million, 83.8% of them from abroad. Net debt of the Group accounts for 5,812 Euro million, showing
Ordinary General Shareholders' Meeting of
 Ordinary General Shareholders' Meeting of 8 May 2018 Speech by the CEO Marcelino Fernández Verdes Introduction Fellow shareholders, good morning and many thanks for attending this General Shareholders'
ACS accounts in the first nine months of 2015 for a net profit of 574 euro million
 ACS accounts in the first nine months of 2015 for a net profit of 574 euro million Sales reaches 26,366 euro million, up to 3.6% Net debt drops by 34% down to 3,880 euro million. Grupo ACS Results Euro
ACS accounts in the first quarter of 2015 for a net profit of 207 euro million
 ACS accounts in the first quarter of 2015 for a net profit of 207 euro million Sales grow by 6% up to 8,570 euro million. 80.2% of total sales accounted from international activities. Grupo ACS Results
1H / 2005 Results Data Conference. September 1 st, 2005
 1H / 2005 Results Data Conference September 1 st, 2005 1 Índex Executive Summary 1H/2005 Results Balance sheet at June 30 th, 2005 Business lines Conclussions 2 Executive Summary Good operating and financial
13 APRIL WestConnex M4 East, New South Wales. Refer to ASX/Media Release for further information
 ANALYST AND INVESTOR PRESENTATION 1Q17 RESULTS Marcelino Fernández Verdes, Executive Chairman Adolfo Valderas, Chief Executive Officer Angel Muriel, Chief Financial Officer WestConnex M4 East, New South
Grupo ACS net profit in 2011 totals EUR 962 million
 Grupo ACS net profit in 2011 totals EUR 962 million Turnover grew up to EUR 28,472 million, a 98.7% increase. International turnover now accounts for 72.5% of the total. The Grupo ACS ordinary net profit
Q1: HOCHTIEF increases net profit by 40%; EUR 45 billion order backlog up by 23%
 Press Release Embargoed until 7:00 a.m. (CET) on May 10, 2017 Q1: HOCHTIEF increases net profit by 40%; EUR 45 billion order backlog up by 23% EUR 93 million operational net profit (+30% year on year),
English Version 6M16 MANAGEMENT REPORT (JANUARY JUNE)
") English Version 6M16 MANAGEMENT REPORT (JANUARY JUNE) September 28 th, 2016 Table of Contents 1. Selected consolidated data...3 2. Significant events...4 3. Consolidated income statement...5 3.1. Key operating
English Version 6M16 MANAGEMENT REPORT (JANUARY JUNE) September 28 th, 2016 Table of Contents 1. Selected consolidated data...3 2. Significant events...4 3. Consolidated income statement...5 3.1. Key operating
2016 Results presentation March 1st 2017
 2016 March 1 st 2017 Results presentation Executive Summary 1. Positive 2016 results Net Profit 751 mn +3.5% 2. 2012-2016 transformation process Operating improvement EBIT margin +30pb FFO 1,397 mn +20%
For personal use only
 18 OCTOBER 2016 3Q CASH FLOW FROM OPERATING ACTIVITIES UP 7.3% YOY TO $533M, AN EBITDA CONVERSION RATE OF 192% IN LAST 12 MONTHS (LTM), WHICH ADJUSTS FOR SEASONALITY, EBITDA CONVERSION RATE OF 107% 9M16
INDRA POSTED NET PROFIT OF 70 MILLION EUROS IN 2016
 In 2015, Indra posted losses of -641m, due to extraordinary adjustments INDRA POSTED NET PROFIT OF 70 MILLION EUROS IN 2016 It s worth highlighting the strong cash generation ( +184m) thanks to the improvement
Creating a Uniquely Global and Integrated Infrastructure Group. October 2017
 Creating a Uniquely Global and Integrated Infrastructure Group 1 October 2017 Agenda 1. Transaction Overview 2. Rationale for the Combination 3. Profile of the New HOCHTIEF 4. Key takeaways for ACS 2 Strategic
2004 RESULTS. February 28 th, 2005
 2004 RESULTS February 28 th, 2005 Year 2004 Summary 2004 Consolidated Results 2004 Consolidated Balance Sheet Business area analysis Conclusions 2004 has been a Relevant Year for the ACS Group OPERATING
QUARTERLY REPORT SEPTEMBER 30, 2016
 QUARTERLY REPORT SEPTEMBER 30, 2016 Table of Contents Page Presentation of Financial Information... ii Summary of Financial Information... 1 Business Overview... 3 Factors affecting the comparability of
INDRA INCREASED ITS ORDER INTAKE BY +26% AND ITS REVENUES BY +15% IN 1Q18
 INDRA INCREASED ITS ORDER INTAKE BY +26% AND ITS REVENUES BY +15% IN 1Q18 Both T&D and IT posted growth in 1Q18 Net Order Intake Growth in Revenues is backed by the IT business (contribution of Tecnocom
RESULTS 1Q18 MADRID, MAY 14 TH
 RESULTS 1Q18 MADRID, MAY 14 TH 2018 www.indracompany.com CONTENTS 1. Introduction & Key Figures 3 2. Analysis of the Consolidated Financial Statements (IFRS) 5 3. Analysis by Vertical Markets 8 4. Analysis
ACS, Actividades de Construcción y Servicios, S.A. and Subsidiaries
 ACS, Actividades de Construcción y Servicios, S.A. and Subsidiaries Interim Condensed Consolidated Financial Statements for the six months period ended 30 June 2016 Translation of interim condensed consolidated
Your project. our. Interim Report January to September 2015
 Interim Report January to September Your project our partnership HOCHTIEF PPP Solutions: A1 and A6 highway project in the Netherlands Focused Approach Delivering Results Operational net profit up 45% to
RESULTS 9M12. MADRID, 14 NOVEMBER
 RESULTS MADRID, 14 NOVEMBER 2012 www.indra.es CONTENTS 1. Introduction - 3 2. Main Figures - 6 3. Analysis of Revenues and Commercial Activity - 7 3.1. Analysis by Segment - 8 3.2. Analysis by Vertical
Annual Report of ACS Group
 Annual Report of ACS Group www.grupoacs.com Cover photo: Atocha railway station expansion (Madrid, Spain). Economic and Financial Report of ACS Group Economic and Financial Report of ACS Group Directors
Ezentis increases its EBITDA by 142,3% in the first nine months of the year up to 16,4 million Euros
 Results Presentation Ezentis increases its EBITDA by 142,3% in the first nine months of the year up to 16,4 million Euros The revenue of the Company increased by 30% up to 228,5 million Euros thanks to
Strategic Review Financial Highlights. Business opportunities. Results by business
 March 2004 Strategic Review 2003 Financial Highlights Business opportunities Results by business Conclusions A Construction & Services Market Reference # 1 in Spanish Construction # 1 in Industrial Services
MY PROFIT OUR SUSTAINABILITY. Business Results Press Conference February 26, 2015 Marcelino Fernández Verdes, Peter Sassenfeld
 Oli Keinath 1 MY PROFIT OUR SUSTAINABILITY Johnny Greig Business Results Press Conference February 26, 2015 Marcelino Fernández Verdes, Peter Sassenfeld Turner Construction 2 Key developments in 2014 Balance
(Free translation from the original in Spanish, in event of discrepancy, the Spanish-language version prevails)
") t w e n t y (Free translation from the original in Spanish, in event of discrepancy, the Spanish-language version prevails) Results report Main highlights of the January-March 2018 results: 187.8 million
t w e n t y (Free translation from the original in Spanish, in event of discrepancy, the Spanish-language version prevails) Results report Main highlights of the January-March 2018 results: 187.8 million
INDRA S NET PROFIT INCREASED BY +23% IN 1H17, TO REACH 38 MILLION EUROS
 Revenues increased by +4% and EBITDA increased by +7% after Tecnocom s integration INDRA S NET PROFIT INCREASED BY +23% IN 1H17, TO REACH 38 MILLION EUROS Revenues in 1H17 totaled 1,379m, growing by +4%
ACS, Actividades de Construcción y Servicios, S.A. and Subsidiaries 2015
 0 ACS Group Economic-Financial Report ACS, Actividades de Construcción y Servicios, S.A. and Subsidiaries 2015 Condensed Consolidated Financial Statements for the year ended 31 December 2017 Translation
RESULTS FOR FIRST HALF OF August 2015
 RESULTS FOR FIRST HALF OF 2015 31 August 2015 Content Keys to the period Main figures Profit & Loss Account Breakdown of Sales Breakdown of EBITDA The Vuelta de Obligado Project Order Intake and Backlog
Prosegur 1H 2014 Results
 Prosegur 31 st July 2014 20140731ACD INVESTOR RELATIONS 1 Highlights Organic growth Improvement of more than 50% over the same period in 2013 Incremental EBIT improvement Continuing with the trend initiated
MY OFFICE OUR BUILDING. Interim Report January to September We are building the world of tomorrow.
 Interim Report January to September 2017 MY OFFICE OUR BUILDING 9M 2017: Financial Highlights EUR 320 million operational net profit, +29% yoy; EUR 303 million nominal, +36% EUR 463 million net cash from
Interim Report 9m Investors and Analysts Conference Call on November 10, 2009 Herbert Bodner, CEO
 Interim Report 9m 2009 Investors and Analysts Conference Call on November 10, 2009 Herbert Bodner, CEO 9m 2009: Highlights Increased earnings in services business Risk provision in Civil Outlook confirmed
INDRA S NET PROFIT INCREASED BY +82% IN 2017, TO REACH 127 MILLION EUROS
 EPS also up +73% vs 2016 INDRA S NET PROFIT INCREASED BY +82% IN 2017, TO REACH 127 MILLION EUROS In reported terms, including Tecnocom, Order Intake increased by +18%, revenues by +11% and EBIT by +21%
Infrastructure. Services 3Q2011 EARNINGS REPORT. Energy
 Infrastructure 3Q2011 EARNINGS REPORT Services Energy 1. HIGHLIGHTS 2 2. EXECUTIVE SUMMARY 3 3. SUMMARY BY BUSINESS AREA 4 4. INCOME STATEMENT 6 5. BALANCE SHEET 9 6. CASH FLOW 12 7. BUSINESS PERFORMANCE
Press release August 30, FIRST-HALF 2017 RESULTS Solid sales growth of +6.2% Recurring operating income of 621m
 FIRST-HALF 2017 RESULTS Solid sales growth of +6.2% Recurring operating income of 621m Net sales up +6.2% to 38.5bn, reflecting the combination of a good like-for-like performance and the effect of expansion:
April 2015 A LEADING TECH COMPANY
 April 2015 A LEADING TECH COMPANY This presentation has been produced by Indra for the sole purpose expressed therein. Therefore, neither this presentation nor any of the information contained herein constitutes
Prosegur. May 7 th, 2014 PROSEGUR. 1Q 2014 Results. 1Q 2014 Results
 Prosegur May 7 th, 2014 20140422ACD INVESTOR RELATIONS 1 Highlights Profitability Increase Margin recovery in all regions Tighter indirect costs control EBIT grows 32% at constant FX rate Exchange Rate
MY LEISURE OUR FACILITIES. Quarterly Report January to March We are building the world of tomorrow.
 Quarterly Report January to March 2016 MY LEISURE OUR FACILITIES Financial Highlights Operational net profit of EUR 72 million, + 19% yoy; strong margin increase Nominal net profit of EUR 63 million, +
Q SALES AND RESULTS
 Q1 2018 SALES AND RESULTS 9 th May 2018 1 Q1 2018 Main Financial Aspects Solid revenue growth of +4.9% (+6.8% at constant exchange rates) reaching 345m (+ 16m) in the first quarter of the year. In the
on 12/14/2009 at 2:05 PM Labrador a4-bc9f-4b81-89f6-657b075eb230
 on 12/14/2009 at 2:05 PM CONTENTS 1. KEY FINANCIAL FIGURES 2. CONSOLIDATED INCOME STATEMENT 3. RESULTS BY DIVISION 3.1. ACCIONA Energy 3.2. ACCIONA Infrastructures 3.3. ACCIONA Real Estate 3.4. ACCIONA
Results Presentation H1 2015
 Results Presentation H1 2015 Madrid, 29 July 2015 This version of our presentation is a free translation of the original, which was prepared in Spanish. All possible care has been taken to ensure that
Free translation from the original in Spanish, in event of discrepancy, the Spanish-language version prevails)
") Free translation from the original in Spanish, in event of discrepancy, the Spanish-language version prevails) Results note Main highlights of the October-December 2018 results: Acquisition of Globus companies
Free translation from the original in Spanish, in event of discrepancy, the Spanish-language version prevails) Results note Main highlights of the October-December 2018 results: Acquisition of Globus companies
SACYR REPORTS EBITDA OF 318 MILLION (+33%) AND ITS TURNOVER INCREASES BY 8.5%
 AND ITS TURNOVER INCREASES BY 8.5%") PRESS RELEASE The group achieves net profits of 370 million SACYR REPORTS EBITDA OF 318 MILLION (+33%) AND ITS TURNOVER INCREASES BY 8.5% International construction revenue represents 75% of the total,
PRESS RELEASE The group achieves net profits of 370 million SACYR REPORTS EBITDA OF 318 MILLION (+33%) AND ITS TURNOVER INCREASES BY 8.5% International construction revenue represents 75% of the total,
Results 2008 Non audited figures. Results Report Year 2008
 Results Report Year 2008 February 26 th, 2009 1 INDEX EXECUTIVE SUMMARY...3 1.1. Main financial figures...3 1.2. Main figures by activity...4 1.3. Relevant facts occurred until September 2008...5 2. CONSOLIDATED
PROSEGUR COMPAÑÍA DE SEGURIDAD, S.A. AND SUBSIDIARIES INTERIM FINANCIAL INFORMATION - QUARTERLY REPORT
 COMPAÑÍA DE SEGURIDAD, S.A. AND SUBSIDIARIES INTERIM FINANCIAL INFORMATION - QUARTERLY REPORT Interim financial report for the first quarter of 2018 (Translation from the original in Spanish. In the event
ALTERNATIVE PERFORMANCE MEASURES (APM) DECEMBER 2017
 DECEMBER 2017") APPENDIX A 1 ALTERNATIVE PERFORMANCE MEASURES (APM) DECEMBER 2017 T The company presents its results in accordance with generally accepted accounting standards (IFRS). Management also provides other financial
APPENDIX A 1 ALTERNATIVE PERFORMANCE MEASURES (APM) DECEMBER 2017 T The company presents its results in accordance with generally accepted accounting standards (IFRS). Management also provides other financial
Half-Year Report January to June Our. your. We are building the world of tomorrow.
 Half-Year Report January to June Our energy your supply We are building the world of tomorrow. The HOCHTIEF Group: Key Operational Variables (like-for-like) *Restated for IFRS 5. For details on the restatement,
MY TRAVEL OUR CONNECTION. Half-Year Report January to June We are building the world of tomorrow.
 Half-Year Report January to June 2018 MY TRAVEL OUR CONNECTION Financial Highlights Operational net profit up 18% to EUR 237 million; nominal up 21% yoy to EUR 229 million Net cash from op. activities
RESULTS 9M17 MADRID, NOVEMBER 7 TH
 RESULTS 9M17 MADRID, NOVEMBER 7 TH 2017 www.indracompany.com CONTENTS 1. Introduction & Key Figures 3 2. Analysis of the Consolidated Financial Statements (IFRS) 5 3. Analysis by Vertical Markets 8 4.
RESULTS 2017 MADRID, FEBRUARY 27 TH
 RESULTS 2017 MADRID, FEBRUARY 27 TH 2018 www.indracompany.com CONTENTS 1. Introduction & Key Figures 3 2. Analysis of the Consolidated Financial Statements (IFRS) 5 3. Analysis by Vertical Markets 9 4.
Interim Report 6m Investors and Analysts Conference Call on August 13, 2009 Herbert Bodner, CEO
 Interim Report 6m 2009 Investors and Analysts Conference Call on August 13, 2009 Herbert Bodner, CEO 6m 2009: Highlights Growth in output volume and orders received Strong increase in earnings Solid financial
PROSEGUR COMPAÑÍA DE SEGURIDAD, S.A. AND SUBSIDIARIES
 COMPAÑÍA DE SEGURIDAD, S.A. AND SUBSIDIARIES QUARTERLY FINANCIAL INFORMATION Interim Statement for first quarter of financial year 2014 RESULTS FOR PERIOD JANUARY TO MARCH 2014 Millions of euros CONSOLIDATED
RESULTS 1Q17 MADRID, MAY 11 TH
 RESULTS 1Q17 MADRID, MAY 11 TH 2017 www.indracompany.com CONTENTS 1. Introduction & Key Figures 3 2. Analysis of the Consolidated Financial Statements (IFRS) 4 3. Analysis by Vertical Markets 7 4. Analysis
Our passion. Half-Year Report January to June We are building the world of tomorrow.
 Half-Year Report January to June 2016 My Gotthard Our passion Financial Highlights Operational net profit of EUR 160 million +25% year on year Net cash flow from operating activities EUR 312 million in
Q Results. Strong start in May 3, 2016
 Q1 2016 Results Strong start in 2016 May 3, 2016 Legal Disclaimer Information in this presentation may involve guidance, expectations, beliefs, plans, intentions or strategies regarding the future. These
Codere Q and Full Year 2015 Results
 Codere Q4 2015 and Full Year 2015 Results February 26, 2016 Highlights Herein, adjusted EBITDA refers to EBITDA excluding non-recurring items incurred in the financial restructuring process during 2014
Siemens Gamesa Renewable Energy Q Results
 Siemens Gamesa Renewable Energy Q2 208 Results 04 May 208 Disclaimer This material has been prepared by Siemens Gamesa Renewable Energy, and is disclosed solely for information purposes. This document
RESULTS FOR THIRD QUARTER October 2015
 RESULTS FOR THIRD QUARTER 2015 29 October 2015 Content Keys to the period Main figures Profit & Loss Account Breakdown of Sales Breakdown of EBITDA Order Intake and Backlog Breakdown of Backlog Pipeline
Prosegur Results Madrid, 25 th February 2010
 Prosegur Results 2009 Madrid, 25 th February 2010 Executive summary Total Growth Growth Profitability +6.6% +14.1% 2,187.0 2,051.7 205.0 234.0 Margin 10.0% 10.7% growth of 6.6% mainly due to the organic
Grupo Prosegur - Results Madrid, 26 th February 2009
 Grupo Prosegur - Results 2008 Madrid, 26 th February 2009 Executive Summary Total Growth Growth Profitability +11.4% +27.9% 2,051.7 1,841.8 207.1 Margin 8.8% 10.1% Strong growth trend, mainly due to the
Grupo Isolux Corsán, S.A. and its subsidiaries. Consolidated financial information for the nine month period ended September 30, 2014 (unaudited)
") Consolidated financial information for the nine month period ended September 30, 2014 (unaudited) CONSOLIDATED INTERIM BALANCE SHEET (unaudited) For the period ended September 30, 2014 (Amounts in thousand
Consolidated financial information for the nine month period ended September 30, 2014 (unaudited) CONSOLIDATED INTERIM BALANCE SHEET (unaudited) For the period ended September 30, 2014 (Amounts in thousand
Highlights in the second quarter of 2014
 Mission To create value for our customers, shareholders, employees and communities by operating as a sustainable steel business. Vision To be a global organization and a benchmark in any business we conduct.
Earnings Release First Half 2017
 Earnings Release First Half 2017 30 August 2017 Results overview Regional segments Final remarks PAGE 3 PAGE 16 PAGE 27 Europe Africa Latin America 2 Key highlights BACK TO GROWTH Turnover up 15% YoY to
Presentation to Investors. March 2010
 GrupoACS Presentation to Investors March 2010 Grupo ACS key figures Year 2009 Δ Revenues 15,606 mn +2.2 % EBITDA 1,458 mn +5.5 5 % Net Profit 1,952 mn +8.1 % EPS 6.28 +15.6 % Net Debt 9,271 mn 0.9 % Backlog
7. The acs group s Risk management
 7. The acs group s Risk management dual system of risk Control and supervision The acs group conducts its business activities in a variety of sectors, countries and socio-economic and legal environments
Fourth Quarter 2015 Performance Summary
 Fourth Quarter 2015 Performance Summary Operational and Financial Highlights - 2015 Grifols revenues grow by 17.3% to Euros 3,935 million, and net profit grows by 13.2% reaching Euros 532 million of the
2018 Q1 Results Presentation. 16 th May 2018
 2018 Q1 Results Presentation 16 th May 2018 Forward Looking Statements This presentation contains forward-looking statements (within the meaning of the U.S. Private Securities Litigation Reform Act of
EARNINGS RELEASE FY April 2018
 EARNINGS RELEASE FY2017 6 April 2018 2 Key highlights BACK TO GROWTH Turnover up 18% YoY to 2,597 Mn, supported by all regions on a comparable basis EBITDA up 19% YoY to 403 Mn with margin increasing 100
LafargeHolcim accelerates growth momentum; Revenue increased 6.2% in Q2. Strong revenue growth of 6.2% in Q2 and 4.8% in first half on a like-forlike
 Zurich, 07:00, 27 July 2018 LafargeHolcim accelerates growth momentum; Revenue increased 6.2% in Q2 Strong revenue growth of 6.2% in Q2 and 4.8% in first half on a like-forlike basis Recurring EBITDA up
SALES AND RESULS 2017
 SALES AND RESULS 2017 28 th February 2018 1 2017 Main Financial Aspects Solid revenue growth of +6.5% (+7.0% at constant exchange rates) reaching 1,571m (+ 97m) in the year. In the like-for-like ("LFL")
Siemens Gamesa Renewable Energy Q3 18 Results
 Siemens Gamesa Renewable Energy Q3 18 Results 27 July 2018 Disclaimer This material has been prepared by Siemens Gamesa Renewable Energy, and is disclosed solely for information purposes. This document
2016 MILESTONES 352 M 352 M - 8.7% + 0.7% + 8% + 1.5% + 15% - 5.3% Consolidation of results 10% 30% 5,977 M REVENUE 6,544 M REVENUE 6,499 M REVENUE
 16 A BUSINESS WITH A PURPOSE I MILESTONES ACCIONA Integrated Report 17 MILESTONES Consolidation of results Successful execution of the Action Plan 2013- Solid foundations for sustained growth Decisions
2018 Full Year Results 20 November 2018
 2018 Full Year Results 20 November 2018 Disclaimer Certain information included in the following presentation is forward looking and involves risks, assumptions and uncertainties that could cause actual
Fomento de Construcciones y Contratas, S.A. and Subsidiaries
 Fomento de Construcciones y Contratas, S.A. and Subsidiaries Consolidated Financial Statements for the year ended 31 December 2014 and Consolidated Directors Report, together with Independent Auditor's
-8.7 % +1.5 % -5.3 % % %
 24 A BUSINESS WITH A PURPOSE I 2017 MILESTONES MILESTONES IN 2017 Consolidation of results 2015 SOLID BASIS FOR 2016 SUSTAINED GROWTH CHANGE OF TREND WITH AN INCREASE IN CAPEX OTHER BUSINESSES 7 % 42 %
SACYR REPORTS EBITDA OF 155 MILLION (+50%) IN THE FIRST HALF
 IN THE FIRST HALF") PRESS RELEASE Debt down 3,600 million following sale of Testa SACYR REPORTS EBITDA OF 155 MILLION (+50%) IN THE FIRST HALF International construction revenue represents 72% of the total, while the Group
PRESS RELEASE Debt down 3,600 million following sale of Testa SACYR REPORTS EBITDA OF 155 MILLION (+50%) IN THE FIRST HALF International construction revenue represents 72% of the total, while the Group