DQ 2015 Results Presentation January 15, 2016
|
|
|
- Ethan Brown
- 5 years ago
- Views:
Transcription
1 DQ 2015 Results Presentation January 15,
2 Safe Harbor Statement This Release / Communication, except for the historical information, may contain statements, including the words or phrases such as expects, anticipates, intends, will, would, undertakes, aims, estimates, contemplates, seeks to, objective, goal, projects, should and similar expressions or variations of these expressions or negatives of these terms indicating future performance or results, financial or otherwise, which are forward looking statements. These forward looking statements are based on certain expectations, assumptions, anticipated developments and other factors which are not limited to, risk and uncertainties regarding fluctuations in earnings, market growth, intense competition and the pricing environment in the market, consumption level, ability to maintain and manage key customer relationship and supply chain sources and those factors which may affect our ability to implement business strategies successfully, namely changes in regulatory environments, political instability, change in international oil prices and input costs and new or changed priorities of the trade. The Company, therefore, cannot guarantee that the forward looking statements made herein shall be realized. The Company, based on changes as stated above, may alter, amend, modify or make necessary corrective changes in any manner to any such forward looking statement contained herein or make written or oral forward looking statements as may be required from time to time on the basis of subsequent developments and events. The Company does not undertake any obligation to update forward looking statements that may be made from time to time by or on behalf of the Company to reflect the events or circumstances after the date hereof. 2
3 Agenda 1 Strategy 2 Business Context 3 Current Quarter Performance 4 Nine Months Results 5 Looking Ahead 3


4 Clear and Compelling Strategy Strategic Framework Sustainable Living Plan Goals Consistent Growth Competitive Growth Profitable Growth Responsible Growth 4
5 DQ 2015 Context Business environment challenging Market growth moderates on Rural slow down Growth continues to be led by volumes Commodity costs soften further Competitive activity remains high 5
6 Commodity costs soften further PFAD Exchange Rate Brent Crude $618 $ $ $62 $482 $432 $50 $44 DQ'14 JQ'15 SQ'15 DQ'15 $/ Ton INR/ Kgs DQ'14 JQ'15 SQ'15 DQ'15 INR / USD DQ'14 JQ'15 SQ'15 DQ'15 $/ Barrel INR(000)/ Barrel Source: Bloomberg data and internal estimates INR numbers arrived at by applying the average exchange rate of the quarter to the average USD cost of the commodity 6
7 DQ 2015 Profitable volume-led growth sustained Reported Domestic Consumer growth at 3%, underlying volume growth at 6% Impact of phase out of Excise Duty benefits on topline -80 bps Impact of up-stocking in view of transport strike at end of previous quarter ~50 bps Continued negative price growth arising from - Benefit of lower commodity costs passed on to consumers Phase out of Excise Duty benefits Operating Profit (PBIT) at Rs.1349 crores, up 7%; margin expands +60 bps Impact of phase out of Excise Duty benefits on PBIT -35 bps COGS lower by 290 bps; driven by lower input costs and savings programs Competitive spends maintained; A&P up Rs. 160 crores (16%); 14.5% of sales (+165 bps) PAT (bei) at Rs crores, up 7%, Net Profit at Rs. 971 crores Net Profit impacted by - Sale of properties of Rs. 407 crores in base quarter Provision for restructuring and select contested matters in current quarter Rs. 117 crores Corporate tax rate at 31% (+175 bps yoy) Domestic Consumer business = Domestic FMCG + Water; COGS Cost of Goods Sold; A&P - Advertising & Promotion; 7
8 Performance led by healthy volumes across segments Segments Reported Sales Growth (%) Growth before impact of phase out of Excise Duty benefits (%) Soaps and Detergents 1 2 Personal Products 5 7 Beverages 7 7 Packaged Foods Domestic Consumer 3 4 Soaps and Detergents: Robust volume growth, offset by continued price degrowth Personal Products: Healthy underlying performance, impacted by delayed winter and one-time realignment of channel spends Beverages: Steady volume led growth Packaged Foods: Ninth successive quarter of double digit growth Sales growth = Segment Turnover growth excluding Other Operational Income 8
9 CATEGORY HIGHLIGHTS


10 Winning with Brands Continued focus on innovations 10


11 Winning with Brands Impactful 360 activation Lifebuoy Help a child reach 5 Haath Muh aur Bum Bimaari Hogi Kam Lakme Bang Baaja Baraat Pond s Dilwale Tie up Cornetto Durga Puja activity Bru Meet and Greet Activity 11


12 Winning with Brands Building a Naturals portfolio 12


13 Skin Cleansing Volume led performance Dove, Pears and Lifebuoy deliver strong volume growth Liquids clock another quarter of double digit growth Continued price deflation due to benign commodity costs Phase out of Excise Duty benefit impacts growth 13


14 Home Care Double digit volume growth Laundry Surf sustains its strong broad based double digit growth momentum Rin delivers double digit volume growth led by bars portfolio Wheel steps up on powders re-launch Comfort registers another robust quarter on sustained market development Household Care Performance led by Vim tubs and liquids formats Continued price deflation due to benign commodity costs Phase out of Excise Duty benefit impacts growth 14


15 Skin Care Healthy underlying performance Growth impacted by delayed winter and one-time realignment of channel spends FAL continues to do well; good response on BB Cream Pond s driven by premium skin lightening Lakme led by premium innovations; strong delivery on CC Cream FAL = Fair and Lovely 15

16 Hair Care Continued strong momentum Volume led double digit growth* Dove leads category performance TRESemmé gains further ground Conditioners grow well on focused market development *Before impact of phase out of Excise Duty benefits 16


17 Oral Care Subdued performance in quarter Close Up growth continues to be led by impactful activation Pepsodent performance muted; Clove & Salt doing well Actions underway to revive growth and competitiveness 17


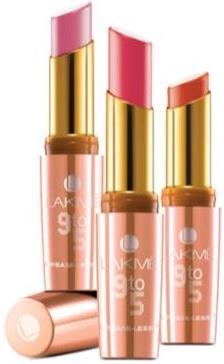
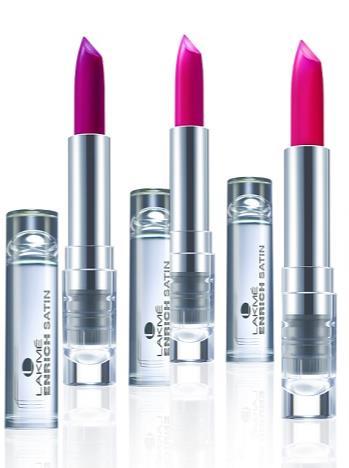
18 Color Cosmetics Strong innovation led growth momentum Lakme delivers another quarter of double digit growth Broad based growth across Core, Absolute and 9 to 5 ranges Absolute Sculpt & 9 to 5 ranges perform strongly whilst driving trends Exciting launch of the Lakme 9 to 5 Weightless Mousse Shade additions made to the Lip portfolio and eyeconic Kajal 18


19 Beverages Steady performance Tea delivers broad based volume led growth driven by impactful activation and market development Red Label led the category performance Taj Mahal continues to build its premium credentials Strong double digit growth in Lipton Green Tea and Natural Care portfolio Bru Coffee registers double digit growth and achieves market leadership 19


 launched at quarter end")


20 Packaged Foods Ninth successive quarter of double digit growth Focus on market development continues Double digit growth in Kissan, Knorr and Kwality Walls Kissan maintains its strong growth momentum across Ketchups and Jams Knorr growth led by Instant Soups; 2 new non-veg variants added o o New range of Knorr Chef s Masalas (8 variants) launched at quarter end Knorr Chinese range of Noodles re-introduced into market Ice Creams deliver another strong quarter through sharper in-market execution focused around Kwality Walls and Magnum 20


21 Pureit Subdued performance in a rapidly changing market Portfolio strategy being refreshed to play in the wider market Entry level RO launched in market Focus remains on building relevance and accessibility E-commerce channel continues to grow rapidly 21
22 DQ 2015 Results: Growth & Margin Rs Crores Particulars DQ'14 DQ'15 Growth % Net Sales* 7,579 7,823 3 PBIT 1,258 1,349 7 PBIT margin (%) bps Reported Domestic Consumer growth at 3%; underlying volume growth at 6% Impact of up-stocking in view of transport strike at end of last quarter ~50 bps Impact of phase out of Excise Duty benefits: Topline (-80bps), PBIT (-35bps) 22
23 DQ 2015 Results: PBIT to Net Profit Rs Crores Particulars DQ 14 DQ 15 Growth % PBIT Add : Other Income Less : Finance Costs 4 0 Exceptional Items Credit / (Charge) PBT Less : Tax (519) (437) Net Profit Other income includes - o o Interest, dividend and net gain on sale of other non-trade current investments of Rs. 94 crore (DQ 14: Rs. 120 crore) Dividend from subsidiary Rs. 46 crore (DQ 14: Rs. Nil) Exceptional items include - o o Profit on sale of surplus properties Rs.37 crore (DQ 14: Rs.407 crore) Provision for restructuring expenses and select contested matters Rs.117 crore (DQ 14: Rs.11 crore) Effective tax rate for the quarter is 31% (DQ'14: 29.3%) 23
24 DQ 2015 Summary Profitable volume-led growth sustained Reported Domestic Consumer growth at 3%, underlying volume growth at 6% o Impacted by Excise Duty benefits phase out, last quarter transport strike upstock PBIT margin expands + 60 bps o Impacted by phase out of Excise Duty benefits o Lower cost of goods sold partially offset by competitive A&P investments 24
25 NINE MONTHS ENDING 31 ST DECEMBER 2015
26 Nine Months ending 31 Dec 2015 Results summary Rs Crores Particulars YTD DQ 14 YTD DQ 15 Growth % Net Sales 22,616 23,616 4 PBIT 3,674 4, PBIT margin (%) bps Exceptional Items Credit / (Charge) PAT bei 2, Net Profit 3, Domestic Consumer grows at 5%, underlying volume growth at 6% o Negative price growth due to lower commodity costs and phase out of Excise Duty benefits Sustained margin improvement after making competitive investments (A&P up +200 bps) Impact of phase out of fiscal benefits: Topline (-115 bps), PBIT (-50 bps), ETR (-90 bps) Net Profit impacted by - o Sale of properties of Rs. 497 crores in base period o Provision for restructuring and select contested matters Rs. 139 crores Effective tax rate for the period is 31.5% (+220 bps yoy) 26
27 Near term outlook Market growth to remain largely volume driven; Rural growth relatively soft Phasing out of fiscal benefits to impact another quarter Channel interventions to be completed during the next quarter Continued focus on driving volume led growth with improvement in operating margin Strategy unchanged: Consistent, Competitive, Profitable, Responsible Growth 27
28 Scheme of Arrangement BACKGROUND Build up of significant reserves through the transfer of profits to the General Reserves Funds represented by such accumulated General Reserves is in excess of needs SCOPE HUL has proposed a Scheme of Arrangement between the Company and its shareholders Proposed transfer of the entire balance of Rs crores from General Reserves to the Profit & Loss Account NEXT STEPS The approval by the Board is the first step to proceed with the requisite formalities The Scheme is subject to the approval of the shareholders, sanction of the Court and such other approvals as are prescribed Upon approval of the Scheme, the transferred amount to be returned to the shareholders as per the terms of the Scheme 28


29 For more information & updates VISIT OUR WEBSITE HUL INVESTOR APP 29
September Quarter 2015 Results Presentation October 14, 2015
 September Quarter 2015 Results Presentation October 14, 2015 1 Safe Harbor Statement This Release / Communication, except for the historical information, may contain statements, including the words or
DQ 14 Results Presentation January 19, 2015
 DQ 14 Results Presentation January 19, 2015 1 Safe Harbor Statement This Release / Communication, except for the historical information, may contain statements, including the words or phrases such as expects,
SQ 14 Results Presentation October 27, 2014
 SQ 14 Results Presentation October 27, 2014 1 Safe Harbor Statement This Release / Communication, except for the historical information, may contain statements, including the words or phrases such as expects,
MQ 2015 & FY Results Presentation May 8, 2015
 MQ 2015 & FY 2014-15 Results Presentation May 8, 2015 1 Safe Harbor Statement This Release / Communication, except for the historical information, may contain statements, including the words or phrases
JQ 14 Results Presentation July 28, 2014
 JQ 14 Results Presentation July 28, 2014 1 Safe Harbor Statement This Release / Communication, except for the historical information, may contain statements, including the words or phrases such as expects,
Results SQ 10. October 26, Investor Presentation
 Results SQ 10 October 26, 2010 Investor Presentation Safe Harbour Statement This Release / Communication, except for the historical information, may contain statements, including the words or phrases such
Hindustan Unilever Limited SQ 17 Results Presentation : 25 th Oct 2017
 Hindustan Unilever Limited SQ 17 Results Presentation : 25 th Oct 2017 1 Safe Harbor Statement This Release / Communication, except for the historical information, may contain statements, including the
RESULTS FOR SEPTEMBER QUARTER % DOMESTIC CONSUMER SALES GROWTH, OPERATING PROFIT (PBIT) UP 11% IN SEPTEMBER QUARTER 2013
 UP 11% IN SEPTEMBER QUARTER 2013") RESULTS FOR SEPTEMBER QUARTER 2013 10% DOMESTIC CONSUMER SALES GROWTH, OPERATING PROFIT (PBIT) UP 11% IN SEPTEMBER QUARTER 2013 Mumbai, October 26 th, 2013: Hindustan Unilever Limited announced its results
RESULTS FOR SEPTEMBER QUARTER 2013 10% DOMESTIC CONSUMER SALES GROWTH, OPERATING PROFIT (PBIT) UP 11% IN SEPTEMBER QUARTER 2013 Mumbai, October 26 th, 2013: Hindustan Unilever Limited announced its results
Safe Harbor Statement
 Hindustan Unilever Limited DQ 17 Results Presentation : 17 th January 2018 1 Safe Harbor Statement This Release / Communication, except for the historical information, may contain statements, including
Hindustan Unilever Limited. MQ 18 & FY Results Presentation : 14 th May 2018
 Hindustan Unilever Limited MQ 18 & FY 17-18 Results Presentation : 14 th May 2018 Safe Harbor Statement This Release / Communication, except for the historical information, may contain statements, including
Hindustan Unilever Limited. SQ 18 Results Presentation : 12 th October 2018
 Hindustan Unilever Limited SQ 18 Results Presentation : 12 th October 2018 Safe Harbor Statement This Release / Communication, except for the historical information, may contain statements, including the
RESULTS FOR THE QUARTER ENDING 31 st MARCH % COMPARABLE* DOMESTIC CONSUMER GROWTH, 11% UNDERLYING VOLUME GROWTH
 RESULTS FOR THE QUARTER ENDING 31 st MARCH 2018 16% COMPARABLE* DOMESTIC CONSUMER GROWTH, 11% UNDERLYING VOLUME GROWTH Mumbai, May 14 th, 2018: Hindustan Unilever Limited announced its results for the
August A Research Report On. By Islami Tijara Research Team. Copyright Reserved
 A Research Report On By Islami Tijara Research Team Hindustan Unilever Limited Hindustan Unilever Limited (HUL) is India's largest Fast Moving Consumer Goods Company; the company was first incorporated
Presentation at Citigroup Smith Barney India Corporate Day. London, June 2003
 Presentation at Citigroup Smith Barney India Corporate Day London, June 2003 HINDUSTAN LEVER LIMITED Contents Economy Overview Strategy FY 2002 MQ 2003 2003 & Beyond.. HINDUSTAN LEVER LIMITED Contents
Hindustan Unilever. Source: Company Data; PL Research
 Levered to play recovery in demand; Accumulate May 09, 2016 Amnish Aggarwal amnishaggarwal@plindia.com +91 22 66322233 Gaurav Jogani gauravjogani@plindia.com +91 22 66322238 Rating Accumulate Price Rs846
RESULTS FOR THE QUARTER ENDING 30 st JUNE % COMPARABLE* DOMESTIC CONSUMER GROWTH, 12% UNDERLYING VOLUME GROWTH
 RESULTS FOR THE QUARTER ENDING 30 st JUNE 2018 16% COMPARABLE* DOMESTIC CONSUMER GROWTH, 12% UNDERLYING VOLUME GROWTH Mumbai, July 16 th, 2018: Hindustan Unilever Limited announced its results for the
BUY HINDUSTAN UNILEVER LTD. Result Update: Q4 FY14. CMP Target Price APRIL 29 th 2014 SYNOPSIS
 BUY CMP 564.50 Target Price 625.00 HINDUSTAN UNILEVER LIMITED Result Update: Q4 FY14 APRIL 29 th 2014 ISIN: INE030A01027 Index Details Stock Data Sector FMCG BSE Code 500696 Face Value 1.00 52wk. High
SQ 02 Results - Snapshot
 SQ 02 Results - Snapshot HPC Power Brands up by 6.8%, driving HPC growth of 4.9% Foods decline by 15.7% leading to flat FMCG sales Operating Profits (PBIT) up 16.6%, Margin Expansion by 390 bps Declining
BUY HINDUSTAN UNILEVER LTD. Result Update: Q3 FY14. CMP Target Price JANUARY 28 th 2014 SYNOPSIS
 BUY CMP 560.00 Target Price 620.00 HINDUSTAN UNILEVER LIMITED Result Update: Q3 FY14 JANUARY 28 th 2014 ISIN: INE030A01027 Index Details Stock Data Sector FMCG BSE Code 500696 Face Value 1.00 52wk. High
Hindustan Unilever (HINLEV) 919
 919") Result Update Rating matrix Rating : Buy Target : 117 Target Period : 12 months Potential Upside : 11% What s changed? Target Changed from 92 to 117 EPS FY16E Changed from 2.8 to 21.2 EPS FY17E Changed
Result Update Rating matrix Rating : Buy Target : 117 Target Period : 12 months Potential Upside : 11% What s changed? Target Changed from 92 to 117 EPS FY16E Changed from 2.8 to 21.2 EPS FY17E Changed
Hindustan Unilever (HINLEV) 789
 789") Result Update Rating matrix Rating : Buy Target : 117 Target Period : 12 months Potential Upside : 29% What s changed? Target Unchanged EPS FY16E Changed from 21. to 2.8 EPS FY17E Changed from 2.9 to 24.8
Result Update Rating matrix Rating : Buy Target : 117 Target Period : 12 months Potential Upside : 29% What s changed? Target Unchanged EPS FY16E Changed from 21. to 2.8 EPS FY17E Changed from 2.9 to 24.8
Hindustan Unilever. Q1FY19 Result Update Maintaining strong volume trajectory on high base is the key. Sector: FMCG CMP: ` 1,644. Recommendation: HOLD
 Hindustan Unilever Q1FY19 Result Update Maintaining strong volume trajectory on high base is the key Sector: FMCG CMP: ` 1, Recommendation: HOLD Market Statistics Current stock price (`) 1, Shares O/S
HUL. Q4FY17 Result Update Healthy performance, rich valuations. Sector: FMCG CMP: ` Recommendation: Hold
 HUL QFY17 Result Update Healthy performance, rich valuations Sector: FMCG CMP: ` 1009 Recommendation: Hold Market Statistics Current stock price (`) 1,009 Shares O/S (cr.) 21. Mcap (`cr) 218,9 52W H/L
Hindustan Unilever (HINLEV) 868
 868") Result Update May 11, 215 Rating matrix Rating : Hold Target : 92 Target Period : 12 months Potential Upside : 4% What s changed? Target EPS FY16E EPS FY17E Rating Unchanged Unchanged Unchanged Unchanged
Result Update May 11, 215 Rating matrix Rating : Hold Target : 92 Target Period : 12 months Potential Upside : 4% What s changed? Target EPS FY16E EPS FY17E Rating Unchanged Unchanged Unchanged Unchanged
Sneha Sharma* Ravi Kumar Bakshi** ABSTRACT
 GROWTH OF FMCG SECTOR CONSUMER GOODS WITH SPECIAL REFRENCE TO HUL AND ITS CORRELATION WITH FMCG INDEX AND SENSEX Sneha Sharma* Ravi Kumar Bakshi** ABSTRACT Purpose: The major focus of this paper is to
Hindustan Unilever. CMP:INR324 TP:INR302 Neutral
 BSE SENSEX S&P CNX 18,197 5,482 29 July 2011 1QFY12 Results Update Sector: FMCG Hindustan Unilever CMP:INR324 TP:INR302 Neutral Bloomberg HUVR IN Equity Shares (m) 2,159.5 52-Week Range (INR) 347/250 1,6,12
Hindustan Unilever (HINLEV) 862
 862") Result Update Rating matrix Rating : Buy Target : 1 Target Period : 12 months Potential Upside : 16% What s changed? Target Unchanged EPS FY17E Changed from 23.2 to 22.1 EPS FY18E Changed from 26.7 to
Result Update Rating matrix Rating : Buy Target : 1 Target Period : 12 months Potential Upside : 16% What s changed? Target Unchanged EPS FY17E Changed from 23.2 to 22.1 EPS FY18E Changed from 26.7 to
Hindustan Unilever Ltd.
 . RESULT UPDATE 25th October 2017 Oct-14 Apr-15 Oct-15 Apr-16 Oct-16 Apr-17 Oct-17 India Equity Institutional Research II Result Update - II 25th October 2017 CMP INR 1273 Target INR 1392 Potential Upside
Hindustan Unilever Ltd.
 Nov-16 Dec-16 Jan-17 Feb-17 Mar-17 Apr-17 May-17 Jun-17 Jul-17 Aug-17 Sep-17 Oct-17 Nov-17. Volume No.. I Issue No. 152 Hindustan Unilever Ltd. December 1, 2017 BSE Code: 500696 NSE Code: HINDUNILVR Reuters
HINDUSTAN LEVER LIMITED
 India HINDUSTAN LEVER LIMITED CLSA Investors Meet Hong Kong, May 2001 Hindustan Lever Leading consumer products company Financials - 2000 - Turnover Rs. 106 bln - Net Profit Rs. 13 bln - EPS Rs. 5.95 -
Hindustan Unilever (HINLEV) 1158
 1158") Result Update Rating matrix Rating : Hold Target : 1180 Target Period : 12 months Potential Upside : 2% What s changed? Target Changed from 1120 to 1180 EPS FY18E Changed from 22.8 to 25.1 EPS FY19E Changed
Result Update Rating matrix Rating : Hold Target : 1180 Target Period : 12 months Potential Upside : 2% What s changed? Target Changed from 1120 to 1180 EPS FY18E Changed from 22.8 to 25.1 EPS FY19E Changed
UNILEVER TRADING STATEMENT THIRD QUARTER 2013 GOOD PROGRESS IN SLOWER MARKETS
 UNILEVER TRADING STATEMENT THIRD QUARTER 2013 GOOD PROGRESS IN SLOWER MARKETS Nine months highlights Underlying sales growth 4.4% with emerging markets up 8.8% Underlying volume growth 2.4% ahead of our
HINDUSTAN UNILEVER Core story intact; wait for better entry point
 RESULT UPDATE HINDUSTAN UNILEVER Core story intact; wait for better entry point India Equity Research Consumer Goods Hindustan Unilever s (HUL) sales were in line while PAT surpassed estimate. Key positives
Hindustan Unilever (HINLEV) 862
 862") Result Update January 24, 2017 Rating matrix Rating : Buy Target : 978 Target Period : 12 months Potential Upside : 13% What s changed? Target Unchanged EPS FY17E Changed from 20.7 to 20.3 EPS FY18E Changed
Result Update January 24, 2017 Rating matrix Rating : Buy Target : 978 Target Period : 12 months Potential Upside : 13% What s changed? Target Unchanged EPS FY17E Changed from 20.7 to 20.3 EPS FY18E Changed
Hindustan Unilever Ltd.
 . RESULT UPDATE 18 th July 2017 Jul-16 Sep-16 Nov-16 Jan-17 Mar-17 May-17 Jul-17 125 105 India Equity Institutional Research II Result Update - FY18 II 18th July, 2017 CMP INR 1158 Target INR 1206 MARKET
HINDUSTAN UNILEVER Volumes skirt deflationary pressures
 RESULT UPDATE HINDUSTAN UNILEVER Volumes skirt deflationary pressures India Equity Research Consumer Goods Hindustan Unilever s (HUL) Q2FY16 numbers came in line with our estimates. Key positives: (i)
Unilever Trading Statement Q Jean-Marc Huët / James Allison. October 23 rd 2014
 Unilever Trading Statement Q3 2014 Jean-Marc Huët / James Allison October 23 rd 2014 Jean-Marc Huët SAFE HARBOUR STATEMENT This announcement may contain forward-looking statements, including forward-looking
The success of a business firm is largely dependent on the efficiency of its liquidity
 Volume - 5, Issue- 6, June 2017 IC Value : 56.46 e-issn : 2347-9671 p- ISSN : 2349-0187 EPRA International Journal of Economic and Business Review SJIF Impact Factor(2016) : 6.484 ISI Impact Factor (2013):
Unilever Q Roadshow
 Unilever Q1 2008 Roadshow INDEX - Unilever Q1 2008 Results Highlights 3 Accelerate Restructuring Programme Simplification 13 Strong Organic Growth 3 Accelerate Restructuring Programme Progress to Date
Soft volume growth, cautious outlook
 BSE Sensex S&P CNX 25,228 7,542 13 June 2014 Annual Report Update Sector: Consumer Hindustan Unilever CMP: INR634 TP: INR600 Sell Soft volume growth, cautious outlook Improved profitability and return
Hindustan Unilever. Institutional Equities. Company Update. Faster And Stronger BUY. Sector: FMCG CMP: Rs1,350 Target Price: Rs1,570 Upside: 16%
 Company Update Institutional Equities Hindustan Unilever Reuters: HLL.BO; Bloomberg: HUVR IN Faster And Stronger We reiterate our positive view on the Home and Personal Care (HPC) space and continue to
Unilever H Results
 Unilever H1 2011 Results Paul Polman CEO Jean-Marc Huët CFO James Allison Head of IR and M&A August 4 th 2011 Safe Harbour Statement This announcement may contain forward-looking statements, including
HOLD. Hindustan Unilever Limited FMCG RETAIL EQUITY RESEARCH. 2 nd August 2018 Q1FY19 RESULT UPDATE. CMP Rs. 1,733 TARGET Rs.
 Q1FY19 RESULT UPDATE Aug-17 Sep-17 Oct-17 Nov-17 Dec-17 Jan-18 Feb-18 Mar-18 Apr-18 GEOJIT RESEARCH May-18 Jun-18 Jul-18 Aug-18 RETAIL EQUITY RESEARCH Hindustan Unilever Limited FMCG BSE CODE: 500696 NSE
Hindustan Unilever. Q4FY18 Result Update Strong volume growth on weak base and uptick in rural. Sector: FMCG CMP: ` 1,516. Recommendation: HOLD
 Hindustan Unilever QFY18 Result Update Strong volume growth on weak base and uptick in rural Sector: FMCG CMP: ` 1,1 Recommendation: HOLD Market Statistics Current stock price (`) 1,1 Shares O/S (cr.)
Unilever - CAGE Conference. Paul Polman CEO Roger Seabrook VP Investor Relations London - 19 th March 2012
 Unilever - CAGE Conference Paul Polman CEO Roger Seabrook VP Investor Relations London - 19 th March 2012 Contents 1 2011 key takeaways 2 Our progress over the last 3 years 3 Your questions addressed 2011
UNILEVER TRADING STATEMENT FIRST QUARTER 2015 GOOD START TO 2015, HELPED BY CURRENCIES
 UNILEVER TRADING STATEMENT FIRST QUARTER 2015 GOOD START TO 2015, HELPED BY CURRENCIES First quarter highlights Turnover increased 12.3% to 12.8 billion including a positive currency impact of 10.6% Underlying
Hindustan Unilever. Institutional Equities. 1QFY19 Result Update
 1QFY19 Result Update Institutional Equities Hindustan Unilever 17 July 218 Reuters: HLL.BO; Bloomberg: HUVR IN Breakout Growth Hindustan Unilever (HUVR) has delivered strong volume led top-line growth
Unilever Q2 and First Half 2008 Results 31 July Unilever Q2 and First Half 2008 Roadshow
 Unilever Q2 and First Half 2008 Results 31 July 2008 Unilever Q2 and First Half 2008 Roadshow Patrick Cescau Group Chief Executive Clearer image to be sourced Jim Lawrence Chief Financial Officer Unilever
Performance Update - 4Q FY16 May 3, 2016
 Performance Update - 4Q FY16 May 3, 2016 PERFORMANCE UPDATE 1 Executive Summary - Key Highlights 2 Business Overview - India 3 Business Overview - International 2 I GCPL I Performance Update 4Q FY16 I
Unilever at Deutsche Bank Conference Paul Polman CEO Paris, June 11 th 2015
 Unilever at Deutsche Bank Conference Paul Polman CEO Paris, June 11 th 2015 SAFE HARBOUR STATEMENT This presentation may contain forward-looking statements, including forward-looking statements within
Unilever Q Trading Statement Paul Polman / Jean-Marc Huët October 24 th 2013
 Unilever Q3 2013 Trading Statement Paul Polman / Jean-Marc Huët October 24 th 2013 SAFE HARBOUR STATEMENT This announcement may contain forward-looking statements, including forward-looking statements
UNILEVER TRADING STATEMENT THIRD QUARTER 2018 IMPROVED GROWTH ACROSS ALL DIVISIONS
 UNILEVER TRADING STATEMENT THIRD QUARTER 2018 IMPROVED GROWTH ACROSS ALL DIVISIONS Performance highlights Underlying performance GAAP measures vs 2017 vs 2017 Third quarter Underlying sales growth (USG)
PRESS RELEASE. Mumbai, May 3, 2016: Godrej Consumer Products Limited (GCPL), a leading emerging
, a leading emerging") PRESS RELEASE 4Q FY 2016 results GCPL delivers a net profit growth of 17% on an organic constant currency net sales growth of 12%. Mumbai, May 3, 2016: Godrej Consumer Products Limited (GCPL), a leading
PRESS RELEASE 4Q FY 2016 results GCPL delivers a net profit growth of 17% on an organic constant currency net sales growth of 12%. Mumbai, May 3, 2016: Godrej Consumer Products Limited (GCPL), a leading
UNILEVER SECOND QUARTER AND HALF YEAR RESULTS 2003 (Unaudited)
") UNILEVER SECOND QUARTER AND HALF YEAR RESULTS 2003 (Unaudited) Outlook for full year earnings confirmed, supported by the sustained benefits of the Path to Growth strategy. FINANCIAL HIGHLIGHTS Millions
UNILEVER SECOND QUARTER AND HALF YEAR RESULTS 2003 (Unaudited) Outlook for full year earnings confirmed, supported by the sustained benefits of the Path to Growth strategy. FINANCIAL HIGHLIGHTS Millions
ITC. Buy. Rs169. 3QFY11 Results Update 19,008 5,697
 Results Update SECTOR: FMCG BSE SENSEX S&P CNX 19,8 5,697 Bloomberg ITC IN Equity Shares (m) 7,75.9 52-Week Range (Rs) 185/112 1,6,12 Rel. Perf. (%) 6/9/3 M.Cap. (Rs b) 1,31.5 M.Cap. (US$ b) 29.3 Rs169
2012 FIRST HALF YEAR RESULTS CONSISTENT PERFORMANCE SUSTAINED DESPITE CHALLENGING MARKETS
 2012 FIRST HALF YEAR RESULTS CONSISTENT PERFORMANCE SUSTAINED DESPITE CHALLENGING MARKETS First half highlights Turnover up 11.5% at 25.4 billion with a positive impact from foreign exchange of 1.9% and
UNILEVER TRADING STATEMENT FIRST QUARTER 2019
 UNILEVER TRADING STATEMENT FIRST QUARTER 2019 Performance highlights Underlying performance GAAP measures vs 2018 vs 2018 Underlying sales growth (USG) (a) 3.1% Turnover 12.4bn (1.6)% Quarterly dividend
2011 FULL YEAR AND FOURTH QUARTER RESULTS STRONG GROWTH DESPITE DIFFICULT MARKETS
 2011 FULL YEAR AND FOURTH QUARTER RESULTS STRONG GROWTH DESPITE DIFFICULT MARKETS Full year highlights Underlying sales growth ahead of our markets at 6.5% with price up 4.8% and volume growth 1.6%. Emerging
Hindustan Unilever. In the Pink of Health ; Accumulate. Source: Company Data; PL Research
 In the Pink of Health ; Accumulate May 14, 2018 Amnish Aggarwal amnishaggarwal@plindia.com +91 22 66322233 Nishita Doshi nishitadoshi@plindia.com +91 22 66322381 Rating Accumulate Price Rs1,505 Target
Financial Management
 Financial Management Code: MB0045 Marks(140) Section-A Time (3 hrs) 1Mark * 40= 40 Marks 1. The modern approach in financial management aims at procurement of least cost funds and its effective utilisation
Nestlé India Limited. 22nd Financial Analysts Meet. Gurgaon 30 th July 2013
 Nestlé India Limited 22nd Financial Analysts Meet Gurgaon 30 th July 2013 Disclaimer This presentation may contain statements which reflect Management s current views and estimates and could be construed
2012 FULL YEAR AND FOURTH QUARTER RESULTS STRONG, BROAD-BASED GROWTH IN Paul Polman: Chief Executive Officer statement
 Page 1 of 11 2012 FULL YEAR AND FOURTH QUARTER RESULTS STRONG, BROAD-BASED GROWTH IN 2012 Full year highlights Turnover increased by 10.5% to 51.3 billion with a positive impact from foreign exchange of
PRESS RELEASE. Mumbai, January 27, 2016: Godrej Consumer Products Limited (GCPL), a leading
, a leading") PRESS RELEASE 3Q FY 2016 results GCPL delivers a net profit growth of 23% on an organic constant currency net sales growth of 9%. Mumbai, January 27, 2016: Godrej Consumer Products Limited (GCPL), a leading
PRESS RELEASE 3Q FY 2016 results GCPL delivers a net profit growth of 23% on an organic constant currency net sales growth of 9%. Mumbai, January 27, 2016: Godrej Consumer Products Limited (GCPL), a leading
Colgate-Palmolive ACCUMULATE. Performance Highlights. 4QFY2010 Result Update I FMCG
 4QFY2010 Result Update I FMCG May 27, 2010 Colgate-Palmolive Performance Highlights ACCUMULATE CMP Target Price Rs715 Rs752 We highlight the fact that the current quarter results are not comparable yoy/qoq,
Safe Harbour Statement
 Jim Lawrence Chief Financial Officer Lehman Back to School Conference 3 September 2008 Safe Harbour Statement This presentation may contain forward-looking statements, including 'forward-looking statements'
Full-year results 2017 Conference. February 15, 2018 Nestlé full-year results 2017
 Full-year results 2017 Conference 1 Disclaimer This presentation contains forward looking statements which reflect Management s current views and estimates. The forward looking statements involve certain
GODREJ INDUSTRIES LIMITED Performance Update Q2& H1 FY I Godrej Industries Limited I Q2 & H1 FY Performance Update Nov 14,2017
 GODREJ INDUSTRIES LIMITED Performance Update Q2& H1 FY 2017-18 1 I Godrej Industries Limited I Q2 & H1 FY 2017-18 Performance Update Nov 14,2017 NOVEMBER 14, 2017 DISCLAIMER Some of the statements in this
Performance and Outlook
 Performance and Outlook November 2017 NSE: AXISBANK BSE: 532215 LSE (GDR): AXB 1 Safe Harbor Except for the historical information contained herein, statements in this release which contain words or phrases
Hindustan Unilever. Institutional Equities. 2QFY19 Result Update
 2QFY19 Result Update Institutional Equities Hindustan Unilever 15 October 2018 Reuters: HLL.BO; Bloomberg: HUVR IN Best Proxy In A VUCA World Hindustan Unilever s (HUVR) overall performance in 2QFY19 was
UNILEVER TRADING STATEMENT THIRD QUARTER 2017 EMERGING MARKETS DRIVING GROWTH IN THE THIRD QUARTER
 UNILEVER TRADING STATEMENT THIRD QUARTER 2017 EMERGING MARKETS DRIVING GROWTH IN THE THIRD QUARTER Performance highlights Underlying performance GAAP measures vs 2016 vs 2016 Nine months Underlying sales
Dabur India Limited. Investor Communication. Quarter and Half Year ended September 30, 2014
 Dabur India Limited Investor Communication Quarter and Half Year ended September 30, 2014 November 3, 2014 Performance Overview : Q2 FY2014-15 Consolidated Sales Consolidated EBITDA EBITDA Margins Consolidated
Unilever Roadshow. Third Quarter & Year to Date 2004 Results
 Unilever Roadshow Third Quarter & Year to Date 2004 Results This presentation may contain forward-looking statements, including forward-looking statements within the meaning of the United States Private
Total Group Zone AMS Zone EMENA Zone AOA
 Press release Vevey, October 19, 2017 Follow today's event live 14:00 CEST Investor call audio webcast Full details: http://www.nestle.com/media/mediaeventscalendar/allevents/nine-month-sales-2017 reports
UNILEVER TRADING STATEMENT THIRD QUARTER 2017 EMERGING MARKETS DRIVING GROWTH IN THE THIRD QUARTER
 Trading Statement 3rd Quarter 2017 Released : 19/10/2017 07:00 RNS Number : 0130U Unilever PLC 19 October 2017 UNILEVER TRADING STATEMENT THIRD QUARTER 2017 EMERGING MARKETS DRIVING GROWTH IN THE THIRD
GODREJ CONSUMER PRODUCTS INVESTOR PRESENTATION
 1 GODREJ CONSUMER PRODUCTS INVESTOR PRESENTATION GODREJ CONSUMER PRODUCTS SNAPSHOT strong positions in core categories largest home grown HPC company US $1.3 billion in sales in FY 14 home care hair care
UNILEVER TRADING STATEMENT FIRST QUARTER 2018 A GOOD START WITH STRONG VOLUME GROWTH
 UNILEVER TRADING STATEMENT FIRST QUARTER 2018 A GOOD START WITH STRONG VOLUME GROWTH Performance highlights Underlying performance GAAP measures vs 2017 vs 2017 Underlying sales growth (USG) (a) 3.4% Turnover
ITC. Q1FY17 Result Update Healthy Operational Performance; Maintain BUY. Sector: FMCG CMP: ` 251. Recommendation: BUY
 ITC Q1FY17 Result Update Healthy Operational Performance; Maintain BUY Sector: FMCG CMP: ` 251 Recommendation: BUY Market statistics Current stock price (`) 251 Shares O/S (cr.) 1207.1 Mcap (` cr) 302,495
Hindustan Lever Limited Economy
 Hindustan Lever Limited February 2002 1 the company 2 H i n d u s t a n L e v e r...leadin consumer products company Financials - Turnover Net Profit EPS (Re 1) Rs110 bln Rs16 bln Rs7.46 Market Capitalisation
Pioneers of laminated tubes in India. Corporate Presentation
 Pioneers of laminated tubes in India Corporate Presentation M17617 Safe Harbour Certain statements in this presentation concerning our future growth prospects are forward-looking statements. The Company
AVI Limited presentation to shareholders & analysts for the year ended 30 June 2014
 AVI Limited presentation to shareholders & analysts for the year ended 30 June 2014 AGENDA Key features and results history Group financial results Performance and prospects Questions and answers KEY FEATURES
Dabur India. Institutional Equities. 4QFY18 Result Update. Growth Volatility Is Still Fairly High ACCUMULATE
 4QFY18 Result Update Institutional Equities Dabur India 3 May 2018 Reuters: DABU.NS; Bloomberg: DABUR IN Growth Volatility Is Still Fairly High Dabur India s (DABUR) consolidated top-line performance in
Equity Research: Unilever Nigeria Plc
 Equity Research: Tuesday, June 23, 2015 Table 1: SELL Current Price N45.50 Fair Value N31.36 The turnover in FY December 2014 decreased by 7.08% to N55.75bn. The company recorded a significant increase
AMOREPACIFIC Group 2014 Earnings Release
 IR AMOREPACIFIC Group 2014 Earnings Release 1 2014 Earnings summary 2 Earnings by Subsidiary 3 4Q 2014 Earnings summary 4 Financial summary As a note, it is suggested to use this material only as a reference,
Performance Update - 3Q FY18 January 30, 2018
 Performance Update - 3Q FY18 January 30, 2018 PERFORMANCE UPDATE 1 Executive Summary - Key Highlights 2 Business Overview - India 3 Business Overview - International 2 I GCPL I Performance Update 3Q FY18
Half-year results July 27, 2017 Nestlé half-year results 2017
 Half-year results 2017 1 Disclaimer This presentation contains forward looking statements which reflect Management s current views and estimates. The forward looking statements involve certain risks and
MARKET PULSE Q OPPORTUNITIES IN A VOLATILE MARKET
 MARKET PULSE Q2 2016 OPPORTUNITIES IN A VOLATILE MARKET GLOBAL GROWTH REMAINS SLUGGISH, EAST ASIA & PACIFIC IS EXPECTED TO EASE MODESTLY Real GDP % Growth Growth prospects weakened throughout the world
Direct Line Insurance Group plc Trading Update for the first quarter of May 2017
 Direct Line Insurance Group plc Trading Update for the first quarter of 3 May Direct Line Group s Trading Update relates to the first quarter ended 31 March, and contains information to the date of publication.
Hindustan Unilever Ltd (HUVR IN) Recovery to be protracted
 Recovery to be protracted") INSTITUTIONAL EQUITY RESEARCH Hindustan Unilever Ltd (HUVR IN) Recovery to be protracted INDIA FMCG Company Update Key highlights of HUL s FY15 annual report and management commentary: Demand environment
INSTITUTIONAL EQUITY RESEARCH Hindustan Unilever Ltd (HUVR IN) Recovery to be protracted INDIA FMCG Company Update Key highlights of HUL s FY15 annual report and management commentary: Demand environment
 Excerpts from Analysts' Reports 2011 Consistent strong sales growth.. Momentum to continue Capex plans firming up Cut in dividend payout ratio to 56% Raw material cost pressure continue No signs of competitive
2010 FIRST QUARTER RESULTS STRONG MOMENTUM: VOLUME GROWTH ACCELERATES TO 7.6%
 2010 FIRST QUARTER RESULTS STRONG MOMENTUM: VOLUME GROWTH ACCELERATES TO 7.6% First Quarter highlights Underlying volume growth 7.6%. Underlying sales growth also accelerated to 4.1%. Underlying price
Hindustan Unilever. Institutional Equities. 3QFY18 Result Update BUY
 3QFY18 Result Update Institutional Equities Hindustan Unilever 18 January 2018 Reuters: HLL.BO; Bloomberg: HUVR IN Robust Performance Maintained Hindustan Unilever or HUL reported a robust set of numbers
Performance and Outlook. November 2016
 Performance and Outlook November 2016 1 Macro Picture Asset Quality Growth Earnings Quality Retail Franchise 2 Growth in industrial production has slowed in recent months Growth in IIP and Components 14%
FY Annual Results. Investor Presentation
 FY 2011-12 Annual Results Investor Presentation Performance Highlights Q4FY12 12M FY12 Net Profit 25% YOY 25% YOY Net Interest Income 26% YOY 22% YOY Fee Income 8% YOY 25% YOY Operating Revenue 18% YOY
PRESS RELEASE. Results at a Glance
 PRESS RELEASE AXIS BANK ANNOUNCES FINANCIAL RESULTS FOR THE QUARTER AND YEAR ENDED 31 st MARCH 2017 Results at a Glance Quarterly Earnings register strong sequential growth: o Net Profit for Q4FY17 grew
2013 FULL YEAR AND FOURTH QUARTER RESULTS GOOD PROGRESS IN TOUGH MARKETS. Paul Polman: Chief Executive Officer statement
 Page 1 of 13 FULL YEAR AND FOURTH QUARTER RESULTS GOOD PROGRESS IN TOUGH MARKETS Full year highlights Turnover down (3.0)% to 49.8 billion with foreign exchange (5.9)% and net acquisitions & disposals
Performance for the. S. Gopalakrishnan Chief Executive Officer and. S. D. Shibulal Chief Operating Officer
 Performance for the Third Quarter ended December 31, 2008 S. Gopalakrishnan Chief Executive Officer and Managing Director S. D. Shibulal Chief Operating Officer Safe Harbour Certain statements in this
Firstsource Solutions Limited Q4 and FY2018 Earnings Update
 Firstsource Solutions Limited Q4 and FY2018 Earnings Update May 07, 2018 Proprietary Notice: This document contains proprietary and confidential statement information of Firstsource. No part of this document
Hindustan Unilever Limited Annual Report & Accounts 07
 078_2724_HLL_Annual Repot_Cover Monday, March 03, 2008 8:33:10 PM Our journey began 75 years ago, in 1933, when the Company, was first incorporated. Today, Hindustan Unilever Limited is a pre-eminent
FINAL VERSION Unilever Trading Statement Third Quarter 2011
 FINAL VERSION Unilever Trading Statement Third Quarter 2011 London 0800, Thursday 3 rd November, 2011 Jean-Marc Huët James Allison Chief Financial Officer Head of IR and Head of M&A CHART 1: Title chart
Investor Update Q July 2017
 Investor Update Q2 2017 31 July 2017 Hexaware Technologies. All rights reserved. www.hexaware.com Safe Harbor Statement Certain statements on this presentation concerning our future growth prospects are