PRESENTATION FOR INVESTORS. September 2018
|
|
|
- Francis Atkinson
- 5 years ago
- Views:
Transcription


1 PRESENTATION FOR INVESTORS 1 September
2 2 LC CORP GROUP SUMMARY 3Q 2018 Housing sector 1397 units sold 1653 units delivered 889 units in the offer Commercialisation sector Increase in the fair value of the Retro Office House property, impact on the gross financial result 29,050 kpln Decrease in the fair value of the Arkady Wrocławskie property, impact on the gross financial result 50,830 kpln Commercialisation of the Retro Office House office building at the level of 98.8% Commercialisation of the Wola Retro office building at the level of 37.4% Activation of the sales process of 4 office buildings for an agreed selling price 275 mln EUR LC Corp Group - results Adjusted consolidated net profit 147,6 mpln (3Q 2018) vs 135,8 mpln (3Q 2017) Consolidated net profit 144,4 mpln (3Q 2018) vs 100,6 mpln (3Q2017) Separate net profit of LC Corp S.A. 130,6 mpln (3Q 2018) vs 36,1 mpln (3Q 2017) Increase in the fair value of investment property in the amount of kpln Increase in the valuation of liabilities on account of loans in EUR in the amount of kpln The cumulative impact of the change in the EUR exchange rate and fair value of real estate on the Group's consolidated financial result in H amounted in total to 6,747 kpln and resulted in an increase in the consolidated gross profit
3 3 AGENDA Residential projects Commercial property Financials Attachments
4 Number of units Flat prices in PLN 4 HOUSING MARKET Flats for sale and sold yearly compared with the offer Average prices of flats for sale a trend Q'2017 2Q'2017 3Q'2017 4Q'2017 1Q'2018 2Q'2018 3Q'2018 Trójmiasto Kraków Łódź Poznań Warszawa Wrocław Flats for sale Flats for sold Offer at the end of quarter Source: REAS, aggregate for main biggest markets (Warsaw, Wrocław, Gdańsk, Sopot, Gdynia, Cracow, Poznań, Łódź) Source: NBP as at 31/12/2017 Source; Bankier.pl, as at 30/09/2018 Number of building permits granted, constructions started and flats delivered by developers on a quarterly basis Average cost of construction of m 2 of usable floor area of a residential building on selected markets (PLN/m 2 ) Construction started Flats delivered Building permits granted Q'2016 4Q'2016 1Q'2017 2Q'2017 3Q'2017 4Q'2017 1Q'2018 2Q'2018 3Q'2018 Source: GUS Warsaw Source: own calculations based on Sekocenbud. Poland

5 Number of quarrters 5 HOUSING MARKET Time of selling flats on offer a trend 5,5 5,0 4,5 4,0 3,5 3,0 2,5 2,0 1,5 1,0 2,4 I II III IV I II III IV I II III IV IV IV IV IV I II III Kraków Wrocław Warszawa Gdańsk Average Increase in payroll dynamics, estimated increase of even 10% y/y Increase in the prices of apartments on the primary market, caused mainly by a small supply of labour, rising personnel costs and an increase in the prices of construction materials Introduced regulatory changes special purpose investment act, planned amendment of the developer act - closed accounts Source: based on data of Emmerson Events on local housing market Housing availability index The current level of index IDM Index line cut off = 100 Change 3Q'2018 of 2Q'2018 Change 3Q'2018 of 3Q'2017 Sales -8,9% -18,9% Placed on the market for sale -3,7% -10,8% Sales in the previous four quarters -4,7% -6,6% Placed on the market in the previous four quarters -2,9% -9,5% Offer at the end of the quarter 3,8% -7,8% Including ready, but not sold -8,1% -31,1% An average price of flats placed on the market in the quarter [gross] -2,1% 4,7% An average price of flats sold in the quarter [gross] 2,3% 6,4% An average price of flats in offer [gross] 1,8% 9,9% Source: ZBP Source: REAS, aggregate for main biggest markets (Warsaw, Wrocław, Gdańsk, Sopot, Gdynia, Cracow, Poznań, Łódź)
6 DEVELOPER INDUSTRY 3Q 2018 vs 3Q 2017 number of premises sold by selected companies listed on the WSE and Catalyst 6 3Q Q 2017 year-to-year change year-to-year change Murapol (***) ,0% ,5% Dom Development ,3% ,3% Robyg (***) ,4% ,3% Atal ,9% ,4% LC Corp ,2% ,0% Archicom ,7% ,9% J.W. Construction (*) ,9% ,5% Budimex Nieruchomości ,6% ,8% Lokum Deweloper ,4% ,1% Polnord (**) ,2% ,8% Echo Investment ,2% ,3% Ronson ,9% ,7% Inpro ,0% ,5% Vantage Development ,7% ,3% Marvipol ,6% ,0% i2 Development ,0% ,0% Wikana ,0% ,0% Suma ,9% ,3% Source: PAP Biznes (as at 10/10/2018) (*) development agreements, preliminary sales agreements and non-refundable reservations in total (**) sales weighted by the Polnord s share in subsidiaries (***) company listed on the Catalyst
7 HOUSING UNITS SOLD IN 3Q 2018 housing sector as at 30/09/ ŁÓDŹ GDAŃSK ŁÓDŹ GDAŃSK KRAKÓW WROCŁAW WARSZAWA KRAKÓW WROCŁAW WARSZAWA CITY 1Q 2Q 3Q 4Q Q 2Q 3Q 4Q 2018 SALE WARSZAWA WROCŁAW KRAKÓW GDAŃSK ŁÓDŹ cumulatively in the year quarter cumulatively year to year +17% +4% -2% 2503 housing units sold and not delivered, including 61 finished housing units


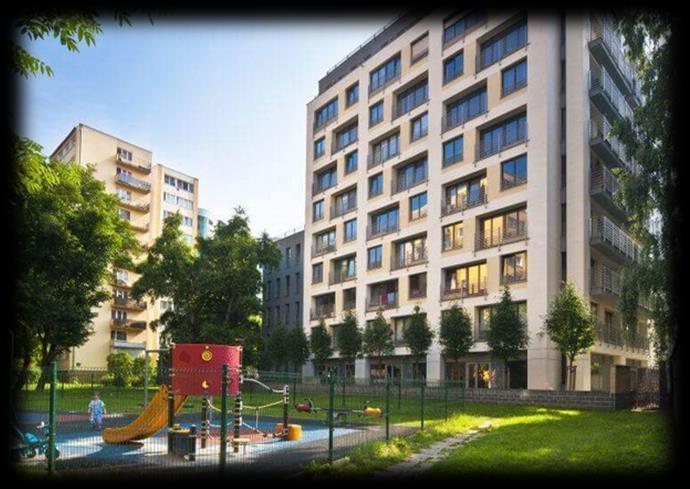
8 SELECTED INVESTMENTS AVAILABLE FOR SALE housing sector as at 30/09/ Warsaw Osiedle na Woli sale in 3Q apartments Gdańsk Bastion Wałowa sale in 3Q apartments Cracow Centralna Park sale in 3Q apartments Wrocław Kamienna sale in 3Q apartments
9 HOUSING UNITS DELIVERED 3Q 2018 housing sector as at 30/09/ ŁÓDŹ GDAŃSK KRAKÓW WROCŁAW WARSZAWA ŁÓDŹ GDAŃSK KRAKÓW WROCŁAW WARSZAWA CITY 1Q 2Q 3Q 4Q Q 2Q 3Q 4Q 2018 DELIVERY WARSZAWA WROCŁAW KRAKÓW GDAŃSK ŁÓDŹ cumulatively in the year quarter cumulatively year to year +40% +55% +9%
10 HOUSING UNITS IN OFFER housing sector as at 30/09/ KATOWICE in offer as at added in to be added in to be added after 2018 ŁÓDŹ GDAŃSK KRAKÓW WROCŁAW WARSZAWA CITY in of f er as at added in 2018 to be added in 2018 to be added af ter 2018 OFFER WARSZAWA WROCŁAW KRAKÓW GDAŃSK ŁÓDŹ 4 KATOWICE 682


11 UNITS TO BE ADDED IN 2018 housing sector as at 30/09/ units to be delivered by the end of 2018 Gdańsk Gdańsk 254 units Warsaw Bastion Wałowa EIII units Bastion Wałowa EIV units Wrocław Warszawa 177 units Na Woli EVIII- 177 units Kamienna units Między Parkami EII units Wrocław 302 units Katowice Kraków 280 units added in 2018
12 CHANGING INVESTMENT PORTFOLIO IN 3Q 2018 as at 30/09/2018; (*) event after the balance sheet date Location acquired / tender won Housing unit usable floor area (sq.m.) Estimated number of units preliminary contract concluded Housing unit usable floor area (sq.m.) Estimated number of units TOTAL Housing unit usable floor area (sq.m.) GDAŃSK KRAKÓW KRAKÓW (*) WROCŁAW WARSZAWA TOTAL (*) event after the balance sheet date acquired / tender won (sq.mq) preliminary contract concluded (sq.mq) Warszawa Gdańsk Wrocław Wrocław Warszawa Kraków Kraków Gdańsk Wrocław Warszawa Monitoring of offers / Seeking new locations Activation of projects from the investment portfolio depending on a market situation Kraków Warszawa Wrocław Land in analysis - potential purchase Location Housing unit usable floor area (sq.m.) Estimated number of units GDAŃSK KRAKÓW WROCŁAW WARSZAWA TOTAL
13 13 AGENDA Residential projects Commercial property Financials Attachments
14 INVESTMENT MARKET Total volume of investment transactions in Q EUR 3,24 billion (the best result for the first half of the year in the history of the Polish market) Total volume of investment transactions in EUR 5.1 billion (the highest ever) Sale of 26 office buildings on regional markets in 2017, 75% of capital invested outside the capital city The length of lease agreements determines the prices of the best assets The best rates of return on the Warsaw office market are approx. 5.2% (the city centre) and approx % outside the city centre. In the main regional cities (Cracow, Wrocław, Tricity, Łódź, Katowice) below 6.0%. Best rates of return on the retail market at the level of approx. 5 % for modern, dominant shopping centres Main investment indicators 2017 Volume of transactions EUR 5.1 billion Rates of return on the best properties Office Warsaw approx. 5.2% Office regional cities approx. 6.0% Commercial buildings approx. 5.0% Warehouses approx. 6.5% 2018 forecasts Seeing Poland as a recognised real estate market with a focus on the status of a core market Forecasted maintenance of market dynamics through GDP growth based on consumption and strong macroeconomic outlook Expected continuation of the trend from 2017 extended by increased interest in less popular cities Value of investment transactions in particular sectors Rates of return on the best properties in particular sectors EUR billion ,5% 8,0% 7,5% 7,0% 6,5% 6,0% 5,5% 5,0% Commercial buildings Offices Warehouses Other 4,5% Biura Offices (Warszawa) (Warsaw) Biura Offices (rynki (regional regionalne) markets) Obiekty Commercial handlowe buildings Source: Colliers International. Source: Colliers International and Knight Frank. 14


![4 % PU[sq.m.]: 33 339 Occupancy: 96.](/docs-images/88/116062855/images/15-5.jpg "8 % Wrocław PU[sq.m.")
![]: 21 937 Occupancy: 98.8 % PU[sq.m.](/docs-images/88/116062855/images/15-6.jpg "]: 52 025 Occupancy: 84,0 % PU[sq.m.")
![]: 38 670 Occupancy: 96.](/docs-images/88/116062855/images/15-7.jpg "8 % Katowice PU[sq.")
![m] EI and EII: 29 110 Occupancy : 96.](/docs-images/88/116062855/images/15-9.jpg "4% Focusing strategy in the commercial")


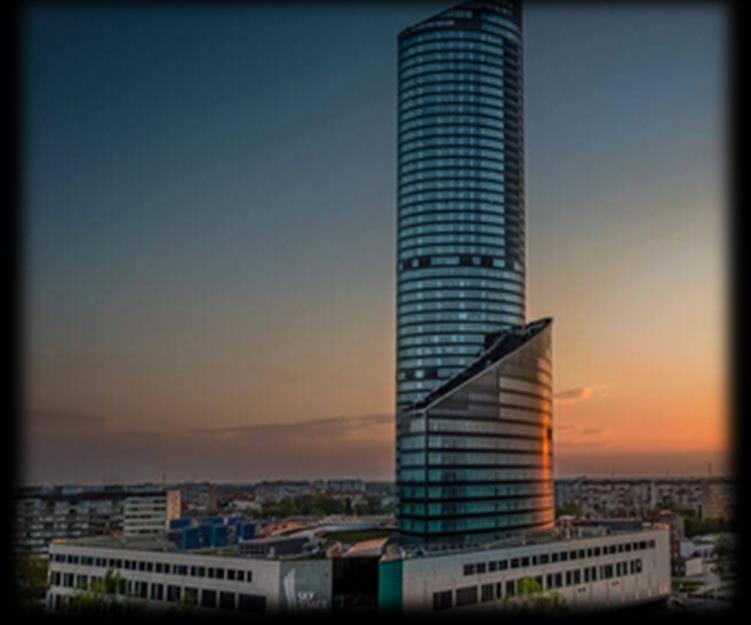
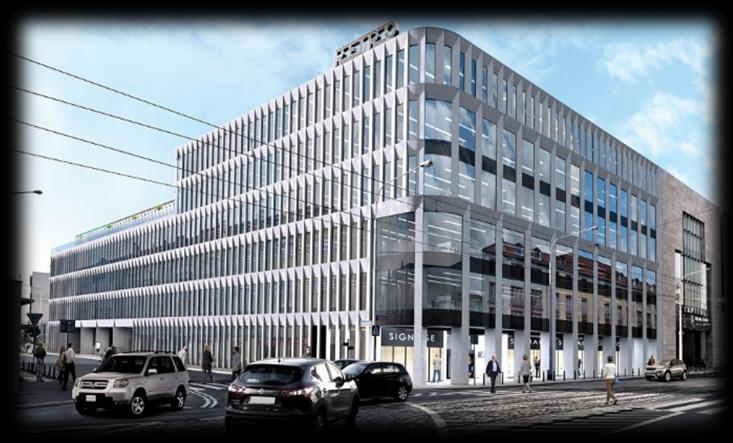
15 INVESTMENT PORTFOLIO as at 30/09/2018 PLN 1.92 billion of carrying amount PLN 1.22 billion NAV PLN 72,3 million NOI for Q completed projects 201,000 sq.m. Usable Flor Area Warsaw PU[sq.m.]: Occupancy: 37.4 % PU[sq.m.]: Occupancy: 96.8 % Wrocław PU[sq.m.]: Occupancy: 98.8 % PU[sq.m.]: Occupancy: 84,0 % PU[sq.m.]: Occupancy: 96.8 % Katowice PU[sq.m] EI and EII: Occupancy : 96.4% Focusing strategy in the commercial real estate sector on construction, commercialisation and sales Reduction in the number of properties having own land and mortgage registers with a smaller portfolio and retained scale of operations for new facilities Change in the structure of cash flow sales revenue instead of lease revenue 15
16 INVESTMENT PORTFOLIO as at 30/09/ CITY PROJECT STATUS Yield [%] GAV [mpln] NAV [mpln] NOI [mpln] Usable Floor Area [sq.m.] Office Usable Floor Area [sq.m.] Retail Usable Floor Area [sq.m.] WROCŁAW center ARKADY WROCŁAWSKIE COMPLETED WROCŁAW office building SKY TOWER COMPLETED potential sale possible services: 6,8 offices: 6,8 services: 6,5 offices B1 & B3: 6,75 offices B2: 7,25 341,7 243,3 15, ,9 314,2 19, (*) in reconstruction 863,6 557,5 34, WARSAW office building WOLA CENTER COMPLETED 5,9 445,9 237,0 23, WARSAW office building WOLA RETRO UNDER CONSTRUCTION - 96,0 96, WROCŁAW office building RETRO OFFICE HOUSE COMPLETED - 238,8 157,4 1, KATOWICE office building SILESIA STAR - Etap I COMPLETED 6,75 147,0 103,9 7, KATOWICE office building SILESIA STAR - Etap II COMPLETED 6,75 124,5 71,1 5, ,3 665,4 37, Retro Office House in Wrocław handed over for operation Commercialisation at a level of 98,8 per cent Retro Office House in Wrocław handed over for operation Commercialisation at a level of 98,8 per cent Progress of works for Wola Retro in Warsaw according to schedule The alteration of Sky Tower 12,400 sq m under alteration, the final date of conversion into office space: 4Q of 2020, projected Usable Floor Area: 33,732 sq m Office Usable Floor Area, 20,495 sq m Retail Usable Floor Area, which means an increase in the area rented by 2,094 sq m The selling price was agreed for selected properties from the investment portfolio TOTAL 1 915, ,9 72,
17 17 AGENDA Residential projects Commercial property Financials Attachments
 (*) development agreements, preliminary sales agreements and non-refundable reservations in total (**)")
) Focused on project effectiveness for years Since 2009, no project budget has been exceeded.")

18 18 MARKET POSITION Sales of apartments in Poland (by number of apartments) Gross margin on sales 32% 30% 27% 27% 31% 28% 25% 16% 17% 14% Source: PAP Biznes (as at 10/10/2018) (*) development agreements, preliminary sales agreements and non-refundable reservations in total (**) company listed on the Catalyst LC Corp Dom Development Ronson Atal Marvipol Cost effectiveness ((selling costs + administrative expenses) / revenue)) Focused on project effectiveness for years Since 2009, no project budget has been exceeded. Since 2009, all projects have been successfully completed, generating higher-than-expected margins. Since 2009, all purchased land has been developed, with the projects yielding higher-than-budgeted revenues. Long-established presence in the key markets (Warsaw, Wrocław, Gdańsk, Kraków) experience in project development and sales.
 Net profit and adjusted net profit 2 (mpln) 23% 9% 31% 1 EBITDA adjusted for: (i) result of property revaluation, (ii)")
19 19 FINANCIAL PERFORMANCES 3Q 2018 Income from sales (mpln) Gross margin on sales (mpln) 449,9 547,0 145,1 706,2 143,5 581,5 107,5 10% 637,50 107,2 12% 131,6 318,3 402,0 562,7 474,0 530, Q Q 2018 Property development Acitivity lease EBITDA 1 (mpln) Net profit and adjusted net profit 2 (mpln) 23% 9% 31% 1 EBITDA adjusted for: (i) result of property revaluation, (ii) write-downs of inventories 2 Net profit adjusted for: (i) result of the revaluation of property and foreign currency loan, (ii) write-downs of inventories, (ii) others
 87,2 105,6 100,4 76,2 72,3 2015 2016 2017")

20 20 HIGH-VALUE AND HIGH-YIELD ASSETS Investment property (mpln NOI of investment property (mpln) 87,2 105,6 100,4 76,2 72, Q Q 2018 Inventory value (mpln) - inventories include land, projects under construction and ready housing units, but not sold yet
21 21 SELECTED FINANCIAL DATA (mpln) Q Q Q 2018/ 3Q 2017 Revenues 449,9 547,0 706,2 581,5 637,5 + 9,6% EBITDA 155,2 204,7 90,3 125,7 215,1 + 71,2% Net profit 108,9 113,1 80,2 100,6 144,4 + 43,6% Adjusted net profit 90,3 118,0 145,5 135,8 147,6 + 8,7% Assets 2 890, , , , ,1 + 6,5% Equity 1 364, , , , ,4 + 1,1% Interest-bearing debt 840,6 850,1 814,1 800,7 785,1-2,0% ROA 3,8% 3,5% 2,4% 3,1% 4,1% + 34,7% ROE 8,0% 8,1% 5,5% 6,9% 9,7% + 41,9% ND/E ratio 61,6% 60,9% 56,2% 54,6% 52,9% - 3,1%
22 22 FINANCIAL SITUATION Debt ratios decrease , , , ,4 0, ,3 0,51 0, , ,7 934,7 0,48 479,9 354,9 344,2 242,1 Net financial debt divided into sectors (mpln) LTV 2 : 21% 614,6 809,2 194,7 LTV 1 : 32% Q2018 Equity Financial liabilities Cash Net debt/equity Commercialisation sector Property development sector 1 Financial liabilities do not include the liabilities connected with the purchase of Sky Tower 1 ( loan and bond debts attributable to the sector cash of the sector)/balance sheet value of investment property 2 ( loan and bond debts attributable to the sector cash of the sector)/balance sheet value of inventories Liabilities connected with the purchase of Sky Tower (mpln) 80,8 Interest-free liabilities. 2 instalments still to be paid off, payable at the end of each year: 2018, In the basic scenario, the Company assumes maintenance of open accounts supplemented by a bank or insurance guarantee, which is in line with the currently proposed amendment
23 23 FINANCIAL SITUATION Maturity structure of bonds and loans (excluding the commercial sector) (million PLN) 200 Total bonds 400 mpln Q Q Q Q Q Q Q 2022 Bonds Loans Bank loans (mln PLN) No Project Balans Total repayment date 1 Arkady Wrocławskie 98, Wola Center 204, Sky Tower 207, Silesia Star etap I 42, Silesia Star etap II 53, Retro Office House - investment loan 80, Retro Office House - k. VAT 0, Investment loan 50, Investment loan 38, TOTAL 776,5
24 24 AGENDA Residential projects Commercial property Financials Attachments
25 CONSOLIDATED STATEMENT OF COMPREHENSIVE INCOME LC CORP GROUP 25 PLN'000 3Q Q 2018 Sales revenue Revenue from sales of services Revenue from sales of goods and products Cost of sales ( ) ( ) Gross profit on sales Gain/(loss) on disposal of non-financial fixed assets (1) 61 Revaluation of investment property (61 104) Write-downs of inventories - (1 153) Selling and distribution cost (11 354) (13 594) General administrative expenses (17 948) (24 466) Other operating income (expenses) (957) (612) Operating profit Financial income Financial expenses (24 112) (43 099) Gross profit Income tax (tax burden) (23 357) (31 431) Net profit
26 CONSOLIDATED STATEMENT OF FINANCIAL POSITION ASSETS LC CORP GROUP 26 PLN'000 3Q Q 2018 A. Fixed assets Intangible assets Property, plant and equipment Tangible assets Tangible assets under construction Non-current receivables Land classified as fixed asset Investment property Long-term prepayments Deferred tax assets B. Current assets Inventory Trade and other receivables Income tax receivable Short-term financial assets Cash and other cash equivalents Short-term prepayments C. Fixed assets held for sale - - Total assets
27 CONSOLIDATED STATEMENT OF FINANCIAL POSITION LIABILITIES LC CORP GROUP 27 PLN'000 3Q Q 2018 A. Equity I. Equity attributable to shareholders of the parent Share capital Other capital Net profits / losses II. Minority interest - - B. Non-current liabilities Non-current financial liabilities Non-current liabilities on account of the acquisition of a subsidiary Provisions Deferred income tax reserve C. Current liabilities Current financial liabilities Current liabilities on account of the acquisition of a subsidiary Current trade and other payables Income tax liabilities Provisions Accrued expenses and revenue Total liabilities
28 CONSOLIDATED STATEMENT OF FINANCIAL POSITION LIABILITIES LC CORP SA 28 PLN'000 3Q Q 2018 Operating income Revenue from sale of services, products and goods Revenue from interest and discounts Revenue from dividend Other financial income Other operating income Operating expenses (52 215) (82 971) Operating expenses value of goods sold (30 815) (57 804) Costs of interest and discounts (17 488) (20 233) Other financial expenses (3 910) (3 100) Other operating expenses (2) (1 835) Gross profit Income tax Net profit / (loss)
29 STATEMENT OF FINANCIAL POSITION ASSETS LC CORP S.A. 29 PLN'000 3Q Q 2018 A. Fixed assets Intangible assets Property, plant and equipment Tangible assets Tangible assets under construction Non-current investments Non-current loans and receivables Long-term prepayments Deferred tax assets B. Current assets Inventory Trade and other receivables Income tax receivable Short-term financial assets Cash and other cash equivalents Short-term prepayments C. Fixed assets held for sale - - Total assets
30 STATEMENT OF FINANCIAL POSITION LIABILITIES LC CORP S.A. 30 PLN'000 3Q Q 2018 A. Equity Share capital Balance of called-up share capital not paid Reserve funds Other reserve funds Other capital Retained profit/(loss carried forward) B. Non-current liabilities Non-current financial liabilities Non-current liabilities on account of the acquisition of a subsidiary Provisions Deferred income tax reserve 0 0 C. Current liabilities Current financial liabilities Current liabilities on account of the acquisition of a subsidiary Current trade and other payables Income tax liabilities Provisions Accrued expenses and revenue Total liabilities

31 31 SHAREHOLDERS 18,22% 46,51% 17,25% 6,38% 11,65% SHARES COUNT NAME % QTY. Nationale-Nederlanden Otwarty Fundusz Emerytalny 18, OFE PZU Złota Jesień 17, Aviva OFE AVIVA BZ WBK 11, Aegon Otwarty Fundusz Emerytalny 6, Remaining shareholders 46, , Shareholders of LC Corp S.A. having more than 5% of shares. The information dated 16th of October 2018.
32 32 DISCLAIMER By taking part in a meeting during which this Presentation will be displayed and by reading slides presented you undertake to comply with the below restrictions. The foregoing applies to the Presentation, information contained herein presented orally by the Company or any person acting on behalf of the Company and any answers to questions relating both to the Presentation and information presented orally. The Presentation does not constitute, or form part of or be treated as proposing to any person, inducing or inviting any person to subscribe for, ensuring or otherwise purchasing any securities of the Company or any of its subsidiaries belonging to its group ( the Group ). Neither this Presentation, nor any part hereof should be a basis for any contract for purchasing or taking up securities of the Company or any member of the Group, nor may this Presentation be relied on in relation to any contract for purchasing or taking up securities of the Company or any member of the Group. Neither this Presentation, nor any part hereof is a basis for any contract or obligation, nor may it be relied on in relation to any contract or obligation. This Presentation does not constitute any recommendation as to any securities of the Company or the Group. This Presentation contains certain statistical and market-related information. The said market-related information has been obtained from sources and/or has been produced on the basis of data provided by third parties referred to herein or where such data has not been linked exclusively to third party sources originating from the Company. Due to the fact that the aforementioned market-related information has been partially prepared on the basis of estimates, assessments, adjustments and opinions which are based on the Company's experience or third party sources, as well as on their knowledge of the sector of economy in which the Company is engaged, and that such estimates, assessments, adjustments and opinions have not been verified by an independent third party, this market-related information is to a certain extent subjective in its nature. Despite the fact that the foregoing estimates, assessments, adjustments and opinions shall be deemed to be reasonable and well-founded, and the market-related information prepared to properly reflect the sector of economy and market in which the Company is engaged, it cannot be ensured that such estimates, assessments, adjustments and opinions are the most suitable for arrangements concerning market-related information or that marketrelated information prepared by other sources will not be considerably different from the market-related information contained herein. Any issues which will be both discussed in this Presentation and presented orally may include forward-looking statements. These statements are other than those related to historical facts. Any statements that contain such words as expects, intends, plans, believes, foresees, anticipates, will be, tends towards, is aimed at, may be, would be, could be, continues or any other similar declarations concerning the future or relating to plans shall be construed as declarations referring to the future. The declarations referring to the future include declarations pertaining to the Company's future financial results, business strategy, plans and goals concerning its future activity (including the Company's development plans). Any forwardlooking statements contained in this Presentation and presented orally refer to issues associated both with known and unknown risks, uncertainties and other factors which may have an impact on the actual performance or results of the Company, and which can be therefore considerably different from those presented in the forward-looking statements and from the past performance and results of the Company. The aforementioned forward-looking statements are based on various assumptions about future events, including a variety of assumptions about the Company's current or future business strategies and the future operating environment. Although the Company believes that the foregoing estimates and assumptions are well-founded, they may prove to be incorrect. The Company and its relevant representatives, employees or advisers do not intend and expressly declare that they are not obliged to make or distribute any supplements, amendments, revisions or corrections to any information, opinions or forward-looking statements contained in this Presentation to the extent in which they reflect the change of events, conditions or circumstances. Neither this Presentation, nor information presented orally constitutes any offer to dispose of securities, nor an invitation to subscribe for or acquire securities of the Company in the United States of America. Neither any Shares, nor any other securities of the Company have been nor will they be registered under the American Securities Act of 1933 ( the American Securities Act ), or by any securities regulatory authority in any state or other jurisdiction of the United States. Neither any Shares, nor any other securities of the Company may be offered or disposed of in the United States of America (subject to specific exceptions) unless registered in accordance with the American Securities Act and applicable state law, or exempted from registration requirements, or traded in a transaction not subject to such registration. The Company does not intend to register either Shares or other securities under the American Securities Act, nor offer its Shares or other securities in the United States. Offers presented outside the United States will be in accordance with the Regulation S issued pursuant to the American Securities Act. The Company's current and periodic reports are the only legally binding documents containing information about the Company and they may contain information other than those presented herein.
33 THANK YOU 33
PRESENTATION FOR INVESTORS. May 2018
 PRESENTATION FOR INVESTORS 1 May 2018 1 2 AGENDA Market environment Financials Residential projects Commercial property Attachments 3 UPWARD TREND ON HOUSING MARKET MAINTAINED Flats for sale and sold yearly
PRESENTATION FOR INVESTORS. March 2018r.
 PRESENTATION FOR INVESTORS 1 March 2018r. 1 2 LC CORP GROUP SUMMARY 2017 Housing sector 2029 units sold 1801 units delivered 2154 units added to the offer Commercialisation sector The first fair value
PRESENTATION FOR INVESTORS. September 2018
 PRESENTATION FOR INVESTORS 1 September 2018 1 2 AGENDA Market environment Financials Residential projects Commercial property Attachments Number of units Flat prices in PLN 3 HOUSING MARKET - ANALYSIS
MANAGEMENT BOARD S REPORT ON THE OPERATIONS OF LC CORP S.A. AND THE GROUP LC CORP S.A. FOR THE YEAR 2017
 MANAGEMENT BOARD S REPORT ON THE OPERATIONS OF LC CORP S.A. AND THE GROUP LC CORP S.A. FOR THE YEAR 2017 Wrocław, 19 March 2018 1 Rules for drawing up the annual consolidated financial statements of LC
LC CORP S.A. SHORT INTERIM FINANCIAL STATEMENTS FOR A PERIOD OF 6 MONTHS ENDED ON 30 JUNE 2016 INCLUDING THE AUDITOR'S REVIEW REPORT
 LC CORP S.A. SHORT INTERIM FINANCIAL STATEMENTS FOR A PERIOD OF 6 MONTHS ENDED ON 30 JUNE 2016 INCLUDING THE AUDITOR'S REVIEW REPORT Short interim statement of financial position 3 Short interim statement
POLNORD INVESTOR PRESENTATION. August 2018
 POLNORD INVESTOR PRESENTATION August 2018 INVESTMENTS THESIS Higher utilization of assets, strategic and organizational changes helped the Group improve its cash flow, business and financing stability
Financial and operating results Q November 2018
 Financial and operating results Q3 2018 29 November 2018 AGENDA Executive summary Operating data Financial data Attachments 2 EXECUTIVESUMMARY 3 Executive summary PLN 185.1 million sales revenue for the
MANAGEMENT'S BOARD REPORT ON THE OPERATIONS OF LC CORP S.A. IN 2015
 MANAGEMENT'S BOARD REPORT ON THE OPERATIONS OF LC CORP S.A. IN 2015 Wrocław, 7 March 2016 Rules for drawing up the annual financial statements of the LC Corp S.A. Pursuant to the provisions of the Accounting
QI 2013 FINANCIAL RESULTS
 Warsaw, May 22 nd 2013 INVESTOR PRESENTATION QI 2013 FINANCIAL RESULTS POLNORD SA CAPITAL GROUP DISCLAIMER This report has been prepared solely for information purposes and is not intended to incite to
Investor Presentation (addressing 4Q 2016 results) 16 th of February 2017
 16 th of February 2017") Investor Presentation (addressing 4Q results) 16 th of February 2017 Disclaimer This presentation does not constitute or form any part of any offer or invitation or inducement to sell or issue, or any
Investor Presentation (addressing 4Q results) 16 th of February 2017 Disclaimer This presentation does not constitute or form any part of any offer or invitation or inducement to sell or issue, or any
Q3&9M 2015 RESULTS INVESTOR PRESENTATION 13 NOVEMBER 2015
 Q3&9M 2015 RESULTS 1 INVESTOR PRESENTATION 13 NOVEMBER 2015 TABLE OF CONTENT 1 Key Highlights Q3 2015 2 Portfolio 3 Operations and Financials 2 1 KEY HIGHLIGHTS Q3 2015 Portfolio and operations Property
NOI MARGIN FFO EPRA NAV NET DEBT NET LTV 779M +27%
 2015 RESULTS GTC EXECUTES ITS GROWTH STRATEGY NOI MARGIN FFO EPRA NAV NET DEBT NET LTV 75% 38M 779M 522M 39% +100bps +38% +27% -25% -146bps EXECUTION OF THE GROWTH STRATEGY Restructuring and repositioning
PRESENTATION OF THE RESULTS FOR THE 1ST QUARTER OF May 2016
 PRESENTATION OF THE RESULTS FOR THE 1ST QUARTER OF 216 19 May 216 Agenda About us The most important events in the 1st quarter of 216. Market environment Financial data Real property portfolio Office projects
POLNORD SA CAPITAL GROUP
 POLNORD SA CAPITAL GROUP CONSOLIDATED QUARTERLY REPORT FOR THE FIRST QUARTER OF 2011 PREPARED IN ACCORDANCE WITH INTERNATIONAL FINANCIAL REPORTING STANDARDS GDYNIA, 16 May 2011 CONTENTS I. GENERAL INFORMATION...
Ronson Europe N.V. Interim Financial Report for the nine months ended 30 September 2015
 Interim Financial Report for the nine months ended 30 September 2015 Interim Financial Report for the nine months ended 30 September 2015 CONTENTS Page Directors report 1 Interim Condensed Consolidated
Ronson Europe N.V. Interim Financial Report for the six months ended 30 June 2017
 Interim Financial Report for the six months ended 30 June 2017 Interim Financial Report for the six months ended 30 June 2017 CONTENTS Page Directors report 1 Interim Condensed Consolidated Financial Statements
Results presentation H1 2017
 Results presentation H1 2017 DISCLAIMER Neither this presentation (the Presentation ), nor any copy of it, nor the information contained herein is being issued or may be distributed directly or indirectly
BZWBK Group. Results 1Q12. April 26 th, 2012
 BZWBK Group Results 1Q12 April 26 th, 2012 2 This presentation as regards the forward looking statements is exclusively informational in nature and cannot be treated as an offering or recommendation to
STRONG GROWTH MOMENTUM 65M +10% 71M +220% 33M +14% 837M +8% 1,544m +17% 9M 2016 RESULTS NOI PROFIT BEFORE TAX FFO EPRA NAV TOTAL PROPERTY
 9M 2016 RESULTS STRONG GROWTH MOMENTUM NOI PROFIT BEFORE TAX FFO EPRA NAV TOTAL PROPERTY 65M +10% 71M +220% 33M +14% 837M +8% 1,544m +17% 9M 2016 HIGHLIGHTS NOI increased by 10% to 65m ( 59m in 9M 2015)
Second quarter & half year results
 Second quarter & half year results 22 August 2011 Platinium Business Park, Warsaw, Poland Highlights Galleria Stara Zagora, Bulgaria 2 Main events 19 Avenue, Belgrade, Serbia Sale of Galeria Mokotów Sale
THE POLSKI HOLDING NIERUCHOMOŚCI SPÓŁKA AKCYJNA GROUP
 THE POLSKI HOLDING NIERUCHOMOŚCI SPÓŁKA AKCYJNA GROUP Selected financial data Wybrane skonsolidowane dane finansowe Period ended in PLN million Period ended Period ended in EUR million Period ended I.
Q3&9M 2018 RESULTS 14 NOVEMBER
 Q3&9M 2018 RESULTS 14 NOVEMBER 2018 1 CONTENTS Key highlights Q3&9M 2018 Portfolio Operations and financials Additional materials 2 DELIVERY OF INCREASING FFO CONTINUES FFO I increased 37% to 46m In 9M
Ronson Development SE. Interim Financial Report for the three months ended 31 March 2018
 Interim Financial Report for the three months ended 31 March 2018 Interim Financial Report for the three months ended 31 March 2018 CONTENTS Page Directors report 1 Interim Condensed Consolidated Financial
This document is a translation of a document originally issued in Polish. The only binding version is the original Polish version.
 PKO Bank Hipoteczny SA Directors Report for the year ended 31 December 2017 Table of Contents 1. INTRODUCTION... 3 2. EXTERNAL OPERATING CONDITIONS... 4 The macroeconomic environment... 4 Residential real
STRONG OPERATING PERFOMANCE ALLOWS TO PROPOSE DIVIDEND OF PLN 0.27 PER SHARE 86M
 2016 RESULTS STRONG OPERATING PERFOMANCE ALLOWS TO PROPOSE DIVIDEND OF PLN 0.27 PER SHARE EPRA NAV/SHARE PLN 8.62 +20% TOTAL PROPERTY 1,624m +23% GROSS MARGIN FROM RENTAL ACTIVITY 86M +10% FFO I 43M +13%
SEPARATE ANNUAL REPORT OF ECHO INVESTMENT S.A.
 2017 SEPARATE ANNUAL REPORT OF ECHO INVESTMENT S.A. CONTENTS Message from CEO 3 CHAPTER 1 5 Separate financial report of Echo Investment S.A. for 2017 5 CHAPTER 2 12 Explanatory notes 12 Explanatory notes
WE BUILD BEYOND EXPECTATIONS SUMMARY OF RESULTS FOR I - III QUARTERS OF 2017
 WE BUILD BEYOND EXPECTATIONS SUMMARY OF RESULTS FOR I - III QUARTERS OF 2017 22ND NOVEMBER 2017 OUR ACHIEVEMENTS IN I III QUARTERS OF 2017: Financial results Consolidated net profit attribute to equity
BZWBK Group. Results 1H12. July 26 th, 2012
 1 BZWBK Group Results 1H12 July 26 th, 2012 2 This presentation as regards the forward looking statements is exclusively informational in nature and cannot be treated as an offering or recommendation to
PRESENTATION OF RESULTS FOR H1/ September 2016
 PRESENTATION OF RESULTS FOR H1/2016 2 September 2016 Agenda About us The most important events in the first six months of 2016. Market environment Financial data Property portfolio Office projects Multi-purpose
Ronson Europe N.V. Interim Financial Report for the three months ended 31 March 2016
 Interim Financial Report for the three months ended 31 March 2016 Interim Financial Report for the three months ended 31 March 2016 CONTENTS Page Directors report 1 Interim Condensed Consolidated Financial
DOM DEVELOPMENT S.A. CAPITAL GROUP
 Dom Development S.A. Capital Group in the first half of 2017 Management Board Report of Activities of DOM DEVELOPMENT S.A. CAPITAL GROUP in the first half of 2017 Warsaw, 23 August 2017 Dom Development
Q2 & H Results. 20 August 2013
 Q2 & H1 2013 Results 20 August 2013 AGENDA Sections 1. Q2 & H1 13 highlights 3 2. Portfolio overview 7 3. Key financial results 9 4. Update on ongoing projects 17 2 Q2 & H1 13 HIGHLIGHTS Q2 & H1 13 FINANCIAL
BUSINESS SERVICES 2018
 BUSINESS SERVICES 2018 SALARY & MARKET TRENDS REPORT POLAND ROBOTICS & RECRUITMENT ROBOTICS & RECRUITMENT 1. THE SECTOR The Business Services Sector in Poland has been growing constantly, reaching over
Disclaimer. This presentation may not be directly or indirectly distributed to or within the United States of America, Australia, Canada or Japan.
 Investor Presentation (addressing 2Q 2014 results) 6 th of August 2014 Disclaimer This presentation does not constitute or form any part of any offer or invitation or inducement to sell or issue, or any
Investor presentation
 Investor presentation 2013 financial results www.budimex.com.pl Budimex Group structure FY 13 sales* (% Group sales) Construction segment 4 141 M PLN 87% FY 13 EBIT* (% Group EBIT) 136 M PLN 41% Developer
GROSS MARGIN FROM RENTAL ACTIVITY 86M +10%
 ANNUAL RESULTS FOR THE YEAR ENDED 31 DECEMBER 2016 HIGHLIGHTS EPRA NAV/SHARE TOTAL PROPERTY GROSS MARGIN FROM RENTAL ACTIVITY FFO I PROFIT FOR THE PERIOD PLN 8.62 1,624m 86M 43M 160M +20% +23% +10% +13%
Disclaimer
 Q2 2017 Disclaimer This presentation is for information purposes only and does not constitute or form part of and should not be construed as an advertisement of securities, an offer or invitation to sell
Investor Presentation FY 18
 Investor Presentation FY 18 Table of Contents 1. Market snapshot 1.1 Market environment top facts 1.2 Macroeconomic forecasts for Poland 1.3 Overview of construction segment 1.4 Labour market 1.5 Prices
MANAGEMENT BOARD REPORT ON THE OPERATIONS OF ROBYG S.A. FOR THE YEAR ENDED 31 DECEMBER 2010
 MANAGEMENT BOARD REPORT ON THE OPERATIONS OF ROBYG S.A. FOR THE YEAR ENDED 31 DECEMBER 2010 Warsaw, 16 March 2011 1 1. BASIC INFORMATION ABOUT THE COMPANY ROBYG S.A., a joint stock company (the Company
DINO POLSKA S.A. FINANCIAL STATEMENTS FOR THE YEAR ENDED 31 DECEMBER 2017 WITH THE AUDIT REPORT OF THE INDEPENDENT AUDITOR
 FINANCIAL STATEMENTS FOR THE YEAR ENDED 31 DECEMBER 2017 WITH THE AUDIT REPORT OF THE INDEPENDENT AUDITOR Krotoszyn, 16 March 2018 Unofficial translation. Only the original Polish text is binding. Introduction
s e n s e o f c r e a t i n g Investor Presentation
 s e n s e o f c r e a t i n g Investor Presentation FY 16 financial results Budimex Group structure FY 16 results summary FY 16 sales (% Group sales) FY 16 EBIT (% Group EBIT) 5 572 M PLN 505 M PLN Internal
DOM DEVELOPMENT S.A. Management Board s Report of Activities of. in the first half of 2018
 DOM DEVELOPMENT S.A. Warsaw, 23 August 2018 CONTENTS APPROVAL BY THE MANAGEMENT BOARD OF THE MANAGEMENT BOARD S REPORT OF ACTIVITIES OF DOM DEVELOPMENT S.A. IN THE FIRST HALF OF 2018... 3 INTRODUCTION...
Radpol S.A. Capital Group
 Radpol S.A. Capital Group REPORT ON THE AUDIT OF THE CONSOLIDATED FINANCIAL STATEMENT AS OF 31.12.2013 Table of contents Page 1. GENERAL PART 1.1 Capital Group's identification data 4 1.2 The legal basis
SEMI-ANNUAL REPORT, JANUARY 1 JUNE 30, 2012
 SEMI-ANNUAL REPORT, JANUARY 1 JUNE 30, 2012 1 Second Quarter, April June 2012 Net sales amounted to 260 645 Euro Operating loss amounted to 277 361 Euro Losses after taxes amounted to 812 866 Euro Losses
DOM DEVELOPMENT S.A. CONSOLIDATED FINANCIAL STATEMENTS FOR THE PERIOD OF 12 MONTHS ENDED ON 31 DECEMBER
 DOM DEVELOPMENT S.A. CONSOLIDATED FINANCIAL STATEMENTS FOR THE PERIOD OF 12 MONTHS ENDED ON 31 DECEMBER 2007 PREPARED IN ACCORDANCE WITH INTERNATIONAL FINANCIAL REPORTING STANDARDS Introduction to the
s e n s e o f c r e a t i n g Investor Presentation
 s e n s e o f c r e a t i n g Investor Presentation 1-3Q 17 financial results Budimex Group structure 1-3Q 17 results summary 1-3Q 17 sales (% Group sales) 1-3Q 17 EBIT (% Group EBIT) 4 553 M PLN 426 M
BEST GROUP. Warsaw, April 2018
 Warsaw, April 2018 Strong business growth and excellent financial performance 59.207 Net profit (PLNm) 82.2 38.8 55.1 Full cash EBITDA** (PLNm) 149.2 Recoveries (PLNm) CAGR -2% CAGR +26% CAGR +32% 184.1
Granbero Holdings Ltd Half year results
 Granbero Holdings Ltd Half year results 30.06.2012 Sustained growth and results from continued development, construction and marketing efforts in core Polish market segments - Net profit for the period
DOM DEVELOPMENT S.A. FINANCIAL STATEMENTS FOR THE YEAR ENDED 31 DECEMBER 2011
 Financial statements DOM DEVELOPMENT S.A. FINANCIAL STATEMENTS FOR THE YEAR ENDED 31 DECEMBER 2011 Prepared in accordance with the International Financial Reporting Standards Warsaw, 29 February 2012 Financial
Ronson Development SE. Interim Financial Report for the six months ended 30 June 2018
 Interim Financial Report for the six months ended 30 June 2018 Interim Financial Report for the six months ended 30 June 2018 CONTENTS Page Directors report 1 Interim Condensed Consolidated Financial Statements
GTC AUGMENTS ACCOMPLISHMENTS THROUGH ACQUISITIONS, DEVELOPMENTS AND ACTIVE ASSET MANAGEMENT 797M
 Q1 2016 RESULTS GTC AUGMENTS ACCOMPLISHMENTS THROUGH ACQUISITIONS, DEVELOPMENTS AND ACTIVE ASSET MANAGEMENT NOI MARGIN FFO EPRA NAV NET DEBT NET LTV 76% 11M 797M 600M 43% +200bps +27% +2% +15% +380bps
DOING BUSINESS IN POLAND. Why Poland?
 DOING BUSINESS IN POLAND Why Poland? Poland is a country in Central East Europe. The total area of Poland is over 120,000 sq mi (9th largest in Europe) with a population of over 38 million people. Poland
INTERIM REPORT 2011 OF BANK ZACHODNI WBK GROUP
 INTERIM REPORT 2011 OF BANK ZACHODNI WBK GROUP 2011 FINANCIAL HIGHLIGHTS PLN k EUR k for reporting period ended: Interim consolidated financial statements I Net interest income 997 103 862 779 251 330
REPORT ON THE ACTIVITIES OF KOMPUTRONIK S.A. CAPITAL GROUP
 Komputronik REPORT ON THE ACTIVITIES OF KOMPUTRONIK S.A. CAPITAL GROUP for the period from 1st April 2014 to 31st March 2015 Poznan, 19th June 2015. Komputronik www.komputronik.com Poznan, 19th June 2015.
ALIOR BANK S.A. 1H 2018 RESULTS PRESENTATION. 9 August 2018
 ALIOR BANK S.A. 1H 2018 RESULTS PRESENTATION 9 August 2018 AGENDA KEY HIGHLIGHTS OPERATIONAL PERFORMANCE 2018 GUIDANCE APPENDIX 2 KEY HIGHLIGHTS (1/3) Q2 18 net profit above market expectations PLN 196
BANK PEKAO S.A. GENERAL PICTURE
 BANK PEKAO S.A. GENERAL PICTURE Disclaimer This presentation (the Presentation ) has been prepared by Bank Polska Kasa Opieki Spółka Akcyjna ( Bank ) for the clients, shareholders and financial analysts.
Q RESULTS FOR THE THREE-MONTH PERIOD ENDED 31 MARCH 2017
 Q1 2017 RESULTS FOR THE THREE-MONTH PERIOD ENDED 31 MARCH 2017 HIGHLIGHTS EPRA NAV/SHARE FFO I/SHARE EARNINGS/ SHARE 2.03 +4% Q1 2017 HIGHLIGHTS 0.026 +18% PORTFOLIO UPDATE 0.07 +96% Development profit
ELEKTROBUDOWA SPÓŁKA AKCYJNA KATOWICE, UL. PORCELANOWA 12 FINANCIAL STATEMENTS FOR THE 2011 FINANCIAL YEAR WITH AUDITOR S OPINION AND AUDIT REPORT
 ELEKTROBUDOWA SPÓŁKA AKCYJNA KATOWICE, UL. PORCELANOWA 12 FINANCIAL STATEMENTS FOR THE 2011 FINANCIAL YEAR WITH AUDITOR S OPINION AND AUDIT REPORT TABLE OF CONTENTS AUDITOR S OPINION... 3 REPORT SUPPLEMENTING
Budimex SA. Condensed financial statements. for I quarter of prepared in accordance with International Financial Reporting Standards
 Budimex SA Condensed financial statements for I quarter of 2014 prepared in accordance with International Financial Reporting Standards Statement of financial position ASSETS 31 March 2014 31 December
REPORT OF BANK ZACHODNI WBK GROUP FOR QUARTER
 REPORT OF BANK ZACHODNI WBK GROUP FOR QUARTER 1 2018 2018 FINANCIAL HIGHLIGHTS PLN k 01.01.2018-01.01.2017-31.03.2018 31.03.2017 Consolidated financial statements of Bank Zachodni WBK Group EUR k 01.01.2018-31.03.2018
CONSOLIDATED ANNUAL REPORT OF ECHO INVESTMENT GROUP
 2017 CONSOLIDATED ANNUAL REPORT OF ECHO INVESTMENT GROUP CONTENTS Message from CEO 3 CHAPTER 1 Consolidated financial statement of Echo Investment Group for 2017 5 CHAPTER 2 Explanatory notes 13 Explanatory
THE BUDIMEX GROUP CONSOLIDATED FINANCIAL STATEMNETS. For the year ended 31 December 2009
 THE BUDIMEX GROUP CONSOLIDATED FINANCIAL STATEMNETS For the year ended 2009 Prepared in accordance with International Financial Reporting Standards Table of contents CONSOLIDATED STATEMENT OF FINANCIAL
Quarterly report containing interim financial statements of the Capital Group for Q3 of the financial year of
 Quarterly report containing interim financial statements of the Capital Group for Q3 of the financial year of 2013-2014 covering the period from 01-01-2014 to 31-03-2014 Publication date: 15 May 2014 TABLE
Report on Compliance with the Corporate Governance Rules by AB S.A.
 Report on Compliance with the Corporate Governance Rules by AB S.A. Table of Contents 1. Indication of corporate governance rules applicable to AB S.A.... 3 2. Indication of corporate governance rules
DOM DEVELOPMENT S.A. Management Board s Report of Activities of. in the first half of 2015
 Management Board s Report of Activities of DOM DEVELOPMENT S.A. Warsaw, 25 August 2015 CONTENTS APPROVAL BY THE MANAGEMENT BOARD OF THE MANAGEMENT BOARD S REPORT OF ACTIVITIES OF DOM DEVELOPMENT S.A. IN
BANK BGŻ BNP PARIBAS GROUP PRESENTATION OF 1H 2017 RESULTS
 BANK BGŻ BNP PARIBAS GROUP PRESENTATION OF 1H 2017 RESULTS Warsaw, 31 August 2017 1 Disclaimer This presentation does not constitute an offer or solicitation of an offer and under no circumstances shall
Supplementary report to the opinion based on audit of financial statement for the year Qumak-Sekom SA
 Supplementary report to the opinion based on audit of financial statement for the year 2011 Qumak-Sekom SA 2 1. Information on the Company Qumak-Sekom SA (Company) was found on 4 th December 1997 as a
Company Report. Atal. Buy (Initiation) Price * Price target Volatility risk
 Price * Price target Volatility risk") Company Report Atal September 24, 215 Real Estate/Poland Buy (Initiation) Price 23.9.15* 21.48 Price target 26.5 Volatility risk medium Year high/low 22.28/2.7 Currency PLN PLN/EUR 4.2 GDR rate n.a. Shares
Company Report Atal September 24, 215 Real Estate/Poland Buy (Initiation) Price 23.9.15* 21.48 Price target 26.5 Volatility risk medium Year high/low 22.28/2.7 Currency PLN PLN/EUR 4.2 GDR rate n.a. Shares
HIGHLIGHTS 46M 828M 41M 1,455 22M +310% +5% +10% +14% +6% TOTAL PROPERTY NOI PROFIT BEFORE TAX FFO EPRA NAV H HIGHLIGHTS PORTFOLIO UPDATE
 INTERIM RESULTS FOR THE SIX MONTHS PERIOD ENDED 30 JUNE 2016 HIGHLIGHTS NOI PROFIT BEFORE TAX FFO EPRA NAV TOTAL PROPERTY 41M 46M 22M 828M 1,455 +5% +310% +14% +6% +10% H1 2016 HIGHLIGHTS NOI increased
Q RESULTS. WARSAW, 15th of NOVEMBER 2017
 Q3 2017 RESULTS WARSAW, 15th of NOVEMBER 2017 1 AGENDA Q1-Q3 2017 OVERVIEW Review of Real Estate Portfolio Financial results for Q3 2017 Strategy review 2 Q1-Q3 2017 OVERVIEW Issue of bonds in total amount
MANAGEMENT BOARD REPORT ON THE OPERATIONS OF ROBYG S.A. FOR THE YEAR ENDED 31 DECEMBER 2013
 MANAGEMENT BOARD REPORT ON THE OPERATIONS OF ROBYG S.A. FOR THE YEAR ENDED 31 DECEMBER 2013 Warsaw, 19 March 2014 1 1. BASIC INFORMATION ABOUT THE COMPANY ROBYG S.A., a joint-stock company (the Company
2013 RESULTS INVESTORS PRESENTATION. 20 March 2014
 2013 RESULTS INVESTORS PRESENTATION 20 March 2014 AGENDA 1. 2013 highlights 3 2. Strategy 7 3. Market overview 9 4. Portfolio overview 12 5. Key financial results 17 6. Additional materials 29 2 2013 HIGHLIGHTS
RESEARCH POLAND OFFICE AND INVESTMENT MARKET Q1 2018
 POLAND OFFICE AND INVESTMENT MARKET Q1 OFFICE MARKET IN WARSAW Take-up (): 202,000 Strong developer activity is still being observed in the Warsaw office market. Since the beginning of 2018, three developments
Chapter II. Section 1. The following text is added at the beginning:
 Appendix 26 approved by the Polish Financial Supervision Authority on September 2nd 2015, to the Base Prospectus of of mbank Hipoteczny S.A. (formerly BRE Bank Hipoteczny S.A.), approved by the Polish
This document is a translation of a document originally issued in Polish. The only binding version is the original Polish version.
 PKO Bank Hipoteczny SA Directors Report for the six-month period ended 30 June 2017 Table of Contents 1. INTRODUCTION... 3 2. EXTERNAL OPERATING CONDITIONS... 4 Macroeconomic environment... 4 Residential
Financial Results for 1Q08
 Financial Results for 1Q2008 Kick-Start of Business Rebuilding Warsaw, May 9, 2008 Page 1 Executive summary Macroeconomic situation financial results Appendices Loan book overview Business development
Polish Real Estate Market Recovery after Financial Crisis
 , Warsaw University of Technology 1. FINANCIAL CRISIS IN POLAND - MACROECONOMY Effects of the global financial crisis has reached the Eastern-European countries, including Poland. However, financial crisis
Ronson Europe N.V. Interim Financial Report
 Interim Financial Report for the three months ended 31 March 2010 Consolidated Quarterly Report for the three months ended 31 March 2010 CONTENTS Page Directors report 1 Interim Condensed Consolidated
GRUPA LOTOS S.A. FINANCIAL HIGHLIGHTS
 FINANCIAL HIGHLIGHTS PLN 000 EUR 000 Dec 31 2015 Dec 31 2014 Dec 31 2015 Dec 31 2014 Revenue 20,482,298 26,243,106 4,894,451 6,264,318 Operating profit/(loss) 183,757 (1,294,183) 43,911 (308,926) Pre-tax
Condensed financial statements for the 3rd quarter of 2017 prepared pursuant to the International Financial Reporting Standards endorsed by EU
 Wawel S.A. 1 Condensed financial statements for the 3rd quarter of 2017 prepared pursuant to the International Financial Reporting Standards endorsed by EU Wawel S.A. 2 I. FINANCIAL STATEMENT state as
ALIOR BANK S.A EOY results presentation
 ALIOR BANK S.A. 2013 EOY results presentation March 6, 2014 AGENDA Highlights Regulatory Update Capital Increase Operational Performance Strategic Initiatives Outlook Appendix 2 AGENDA Highlights Regulatory
Poland. First Half of July 30, 2015
 1 Poland First Half of 2015 July 30, 2015 Disclaimer 2 Bank Zachodni WBK S.A. ("BZ WBK") cautions that this presentation contains forward-looking statements. These forward-looking statements are found
TOWER INVESTMENTS GROUP DEVELOPMENT STRATEGY
 TOWER INVESTMENTS GROUP 2017 2022 DEVELOPMENT STRATEGY WHO WE ARE Market presence since 2005 We are providing END-TO-END REAL PROPERTY DEVELOPMENT SERVICES for retail and service chains Between 2012 and
LIBET S.A. RESULTS FOR Q1, MAY 2014
 LIBET S.A. RESULTS FOR Q1, 2014 22 MAY 2014 Effective Management Thomas Lehmann President of the Board Managing Director Libet S.A. Udział w rynku Ireneusz Gronostaj Member of the Board Financial Director
ALIOR BANK S.A. Q results presentation
 ALIOR BANK S.A. Q1 2015 results presentation May 15, 2015 1 HIGHLIGHTS Continuous and profitable growth Strong earnings growth in Q1 15 PLN 91m net income (+34% YoY) PLN 85m net income ex-meritum (+25%
BANK PEKAO S.A. GENERAL PICTURE.
 BANK PEKAO S.A. GENERAL PICTURE www.pekao.com.pl Disclaimer This presentation (the Presentation ) has been prepared by Bank Polska Kasa Opieki Spółka Akcyjna ( Bank ) for the clients, shareholders and
Polish Construction Companies 2017 Major Players, Key Growth Drivers and Development Prospects
 Polish Construction Companies 2017 Major Players, Key Growth Drivers and Development Prospects Contents Introduction 5 Section 1. Analysis of the largest construction companies 7 1.1. Ranking of the
ALIOR BANK S.A. Q3 17 RESULTS PRESENTATION. 9 November 2017
 ALIOR BANK S.A. Q3 17 RESULTS PRESENTATION 9 November 2017 AGENDA Key Highlights Strategic KPIs BPH Core integration costs and merger synergies Additional information on the strategy implementation plan
Condensed financial statements for the 1st quarter of 2014 prepared pursuant to the International Financial Reporting Standards endorsed by EU
 Wawel S.A. 1 Condensed financial statements for the 1st quarter of 2014 prepared pursuant to the International Financial Reporting Standards endorsed by EU Wawel S.A. 2 I. FINANCIAL STATEMENT state as
Poland. January - September October 29, 2015
 1 Poland January - September 2015 October 29, 2015 Disclaimer 2 Bank Zachodni WBK S.A. ("BZ WBK") cautions that this presentation contains forward-looking statements. These forward-looking statements are
Consolidated and Separate Financial Statements of the Nordea Bank Polska S.A. Group The third quarter of 2006
 Consolidated and Separate Financial Statements of the Nordea Bank Polska S.A. Group The third quarter of 2006 SELECTED FINANCIAL FIGURES keur 3 quarter(s) 3 quarter(s) 3 quarter(s) 3 quarter(s) incrementally
Ceramika Nowa Gala S.A. Ceramiczna Street 1, Końskie
 Tel: +48 22 543 16 00 Fax: +48 22 543 16 01 E-mail: office@bdo.pl www.bdo.pl Polska Ceramika Nowa Gala S.A. Ceramiczna Street 1, 26-200 Końskie Independent Auditor s Opinion on the financial statements
Condensed financial statements for the 1st quarter of 2017 prepared pursuant to the International Financial Reporting Standards endorsed by EU
 Wawel S.A. 1 Condensed financial statements for the 1st quarter of 2017 prepared pursuant to the International Financial Reporting Standards endorsed by EU Wawel S.A. 2 I. FINANCIAL STATEMENT state as
ANALYSIS OF TRANSACTION PRICES AND FORECASTS FOR THE RESIDENTIAL MARKET IN POLAND - PRIMARY AND SECONDARY MARKETS WARSAW, FEBRUARY 2015
 ANALYSIS OF TRANSACTION PRICES AND FORECASTS FOR THE RESIDENTIAL MARKET IN POLAND - PRIMARY AND SECONDARY MARKETS WARSAW, FEBRUARY 2015 INTRODUCTION Dear Readers, We are pleased to present the second edition
Poland. First Quarter April 29, 2014
 1 Poland First Quarter 2014 April 29, 2014 Disclaimer 2 Bank Zachodni WBK S.A. ("BZ WBK") cautions that this presentation contains forward-looking statements. These forward-looking statements are found
Chapter II. Section 1. The following text is added at the beginning:
 Appendix 21 approved by the Polish Financial Supervision Authority on September 4th 2014, to the Base Prospectus of mbank Hipoteczny S.A. (formerly BRE Bank Hipoteczny S.A.), approved by the Polish Financial
Q RESULTS 15 MAY
 Q1 2017 RESULTS 15 MAY 2017 1 CONTENTS Highlights Q1 2017 Portfolio performance Development projects Financials Additional materials 2 HIGHLIGHTS Q1 2017 Development activity and planned acquisitions to
Q3&9M 2018 RESULTS FOR THE THREE AND NINE-MONTH PERIODS ENDED 30 SEPTEMBER 2018 HIGHLIGHTS
 GLOBE TRADE CENTRE SA (Incorporated and registered in Poland with KRS No. 61500) (Share code on the WSE: GTC) (Share code on the JSE: GTC ISIN: PLGTC0000037) ("GTC" or "the Company") Q3&9M 2018 RESULTS
ING Bank Śląski S.A. Group
 Quarterly consolidated report for the 3 quarter 2016 Contents Interim consolidated financial statements of the ING Bank Śląski S.A. Group Selected financial data from financial statements 1 Interim condensed
GTC EXPANDS COMPANY S OPERATIONS AND DEVELOPMENT AND CONTINUE TO SECURE LONG TERM FINANCING THROUGH NEW BONDS, FINANCING AND REFINANCING ACTIVITY 0.
 H1 2017 RESULTS GTC EXPANDS COMPANY S OPERATIONS AND DEVELOPMENT AND CONTINUE TO SECURE LONG TERM FINANCING THROUGH NEW BONDS, FINANCING AND REFINANCING ACTIVITY EPRA NAV/SHARE FFO I/SHARE EARNINGS/ SHARE