BEST GROUP. Warsaw, April 2018
|
|
|
- Marsha Hines
- 5 years ago
- Views:
Transcription


1 Warsaw, April 2018
2 Strong business growth and excellent financial performance Net profit (PLNm) Full cash EBITDA** (PLNm) Recoveries (PLNm) CAGR -2% CAGR +26% CAGR +32% Investments in debt portfolios (PLNm) CAGR +36% MARKET CAPITALIZATION PLN 725m (as at Dec ) EPS: 2.39 EPS growth: 37% adjusted cash EBITDA Kredyt Inkaso FAIR VALUE OF PORTFOLIOS PLN 1bn (at December 31st 2017) not attributable to the BEST Group attributable to BEST Group RECOVERIES FOR THE LAST FIVE YEARS PLN 1bn (owned and third-party accounts, until Dec ) primary market secondary market* INVESTMENTS IN THE LAST FIVE YEARS PLN 1bn (until Dec ) * Net profit adjusted for a PLN 69.3m impairment loss on the investment in Kredyt Inkaso ** Includes Kredyt Inkaso s cash EBITDA based on its available financial statements
3 18 years at the Warsaw Stock Exchange posting steady solid growth based on healthy fundamentals
4 MARKET TRENDS
5 Poland macroeconomic indicators
6 Poland macroeconomic indicators Disposable household income per capita in Poland in (PLN)
7 Poland macroeconomic indicators Lending growth in the banking sector 14% 12% 10% 8% 6% 4% 2% 0% Lending growth (y/y) GDP (y/y)
8 Poland banking sector non-performing loans 10% [PLNbn] 120 5% 0% - 5% Share of NPLs Retail and corporate NPLs 6,891% % - 15% Total NPLs NPLs (retail) Sale transactions in the banking sector - 20% %
9 Poland market of banking sector NPLs SUPPLY 2017 lower volume of primary market transactions following consolidation processes within the industry (relatively more attractive portfolios acquired in the secondary market) 2018 expected supply of banking sector NPLs (retail, excluding mortgage loans) of between PLN 8bn and PLN 10bn supply of mortgage and corporate loan portfolios expected to be gradually growing GROUP S INVESTMENTS: 2018 expected reduction in portfolio prices (more expensive financing, review of earlier transactions, less competition) Banking sector retail NPLs % 12% 14% 12% 12% 9% Nominal value (PLNbn) average prices (% of nominal value) NOMINAL VALUE OF NPL TRANSACTIONS IN 2017 Strengthening the business presence in Italy PLN 8.3bn PLN 1.3bn PLN 2.1bn banking sector retail NPLs banking sector corporate NPLs secondary market
10 Poland size of the non-performing debt market
11 * Getback data for Q ** Consolidated operating expenses /cash collections on purchased portfolios *** Recoveries attributable to the BEST Group. In the case of KI, data based on calendar periods Poland competition key financial metrics Net debt/equity* Operating profit margin* 2,90 2,40 1,90 1,40 0, ,0% 60,0% 50,0% 40,0% 30,0% 66% 63% 64% 59% 57% 41% 45% 37% 48% 48% 44% 40% KRUK GetBack BEST Kredyt Inkaso Expenses/Cash collections* KRUK GetBack BEST Kredyt Inkaso Recoveries growth rate ** 70,0% 71% 50,0% 60,0% 50,0% 40,0% 30,0% 20,0% 54% 52% 45% 47% 44% 43% 45% 38% 39% 31% 25% KRUK GetBack BEST Kredyt Inkaso 40,0% 30,0% 20,0% 10,0% 0,0% -10,0% 34% 16% 16% 30% 20% 0% 38% 32% 18% KRUK GetBack BEST Kredyt Inkaso
12 18 years at the Warsaw Stock Exchange posting steady solid growth based on healthy fundamentals
13 Italy macroeconomic indicators
14 Italy market of banking sector non-performing loans Gross NPLs in the Italian banking sector H % 35% 30% 25% 20% 15% 10% 5% 0% Past Due Unlikely to Pay Bad Loans Bad loans ratio NPL ratio Comparison of markets Italy Poland
15 Italy market growth prospects Transactions in the NPL market, at nominal value (EURbn) Absorption of the NPL supply (EURbn) ~ Unabsorbed supply of NPLs in Italy (EURbn) Value of NPL sale transations in Italy (EURbn) Comparison of markets Italy Poland
16 Italy market growth prospects Key advantages of BEST s presence in the Italian market: Europe s largest NPL market, at an early stage of development EUR 200bn of unabsorbed supply of NPLs BEST s unique know-how that allows us to gain an operational and technological edge geographical diversification allowing the Group to maintain the growth of its business BEST s presence presence through Kredyt Inkaso other markets where the Group looks to gain a foothold Italy will be our second home market


17 Debt trading market cycle


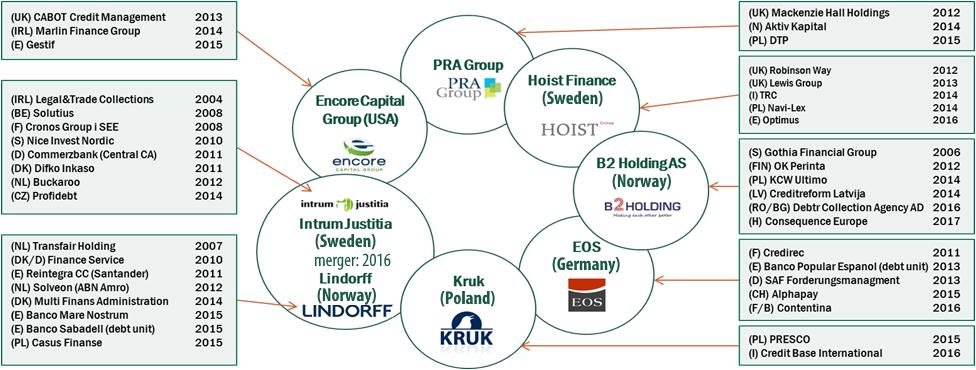
18 Market consolidation across Europe
19 GROWTH PROSPECTS
20 Outlook for the coming quarters FURTHER INVESTMENTS IMPROVING FINANCIAL PERFORMANCE STABLE FINANCING STRUCTURE geographical diversification reasonable prices market niches openness to consolidation within the industry PROCESS OPTIMISATION efficiency gains, e.g. through the use of technologies development of technologies, e.g. based on artificial intelligence and automation expected KPI improvements: recoveries cash EBITDA BUSINESS DEVELOPMENT IN ITALY further investments building the Group s own operational structures favourable bond maturity structure diversified financing sources raising of euro-denominated financing TRANSPARENCY transparent presentation of data regular communication with the market stable shareholder base
 4.")
, warehouse (2,400 sqm) Wrocław Old")


21 Properties for sale Location Property type Kraków Śródmieście (Prądnik Czerwony) 4.5 km of straight line distance from the Main Market Square office building (800 sqm), warehouse (2,400 sqm) Wrocław Old Town 3.5 km of straight line distance from the Main Market Square land property Zoning Area covered by a Local Development Plan (MPZP) Intended use: Services. Application is pending to change its intended use (to residential). Property area ha ha Area covered by a Study of Land Use Conditions and Directions. Residential buildings and services. Work on a Local Development Plan is under way.
22 STABLE FINANCING STRUCTURE
23 Stable financing structure % equity (PLNm) % 39% 34% net debt (PLNm) equity equity ratio steadily growing equity effect of the profit reinvestment policy share capital was increased by PLN 19m through an issue of shares in Q to a fund managed by a financial investor net debt net debt/equity stable level of the key debt ratio (net debt/equity) its rise driven by investments the Group s debt financing as at Dec : PLN 644.8m bonds PLN 83m bank borrowings (total facilities available PLN 142m) PLN 31.5m loan from owners
24 Bond issues are a vital part of financing the Group s business bond issues (PLNm) activity in 2017: PLN 206m of bonds issued in public offerings, EUR 7.6m raised through private placements, PLN 10m of bonds repaid public offerings private placements 30 first issue of euro-denominated bonds: EUR 7.6m of financing raised, for 3.5 years, through a private placement strong demand for public bonds issue of T2 bonds, worth PLN 30m, after the reporting date favourable bond maturity structure moderate redemptions in 2018 and 2019, with more significant repayments starting from 2020 bond redemption schedule (PLNm)
25 COMPETITIVE ADVANTAGES OFFERED BY THE GROUP S BUSINESS MODEL
26 Our business is focused on debt THREE COMPLEMENTARY AREAS INVESTING IN DEBT PORTFOLIOS POLISH MARKET through Polishlaw based securitization funds, in accordance with the Act on Investment Funds, under the PFSA s supervision ITALIAN MARKET through a 130- type SPV as defined in the Italian securitization laws, under the Bank of Italy s supervision Portfolios bought from banks, loan providers, telecom companies, insurers and utility suppliers MANAGEMENT OF DEBT PORTFOLIOS BEST debt management based on a PFSA authorization R.P.U. Rybszleger law office legal debt collection and legal representation INVESTMENT FUND MANAGEMENT BEST TFI investment fund management company management of investment funds and execution of transactions, under the PFSA s supervision
27 Key drivers of success BEST AS A MODERN LEADER OF DEBT MANAGEMENT TRANSACTIONS FINANCING OPERATIONS own investment fund management company (TFI) purchases of debt portfolios guaranteeing a sound profit margin co-investments international expansion diversification of sources flexible bank financing interest rate and FX risk management financial support from shareholders bonds new proprietary operating system refinement and automation of operational processes broad range of products offered as part of amicable solutions modern organizational culture

28 Operations an effective business model COURTS AND BAILIFF OFFICES
29 Operations organizational culture


30 Efficient operations supported by technologies BIOMETRIC SIGNATURE PROPRIETARY CENTRAL SYSTEM SUPPORTING THE ENTIRE DEBT MANAGEMENT PROCESS BI SOLUTION, THE FOUNDATION OF THE GROUP S ANALYTICAL CULTURE SPEECH TO TEXT MACHINE LEARNING, ARTIFICIAL INTELLIGENCE AUTOMATION OF DOCUMENT PROCESSING BEST ONLINE AN ONLINE PLATFORM DEDICATED TO THE GROUP S CUSTOMERS AND CLIENTS MULTI-CHANNEL CONTACT CENTRE
31 SUMMARY OF 2017 PERFORMANCE FIGURES
32 Key business metrics operating income (PLNm) operating profit (PLNm) fair value of portfolios (PLNm) nominal value of debts under management (PLNbn) 1, / / / /2017 attributable to the BEST Group not attributable to the BEST Group 12/ / / /2017 attributable to the BEST Group not attributable to the BEST Group
33 Strongly growing investments in new portfolios investments in new portfolios (PLNm) PLN 258.3m PLN 300.8m (+16% y/y) structure of purchased portfolios (nominal value) % 24% 81% 76% 71% 29% Q1'16 Q2'16 Q3'16 Q4'16 Q1'17 Q2'17 Q3'17 Q4' the Group purchased 17 debt portfolios with a nominal value exceeding PLN 2.6bn (average purchase price: 11.4% of the nominal value) 3 portfolios acquired in the Italian market, with a nominal value of nearly EUR 300m bank other investments in non-banking sector debt have increased significantly NOMINAL VALUE OF PURCHASED NON-BANKING SECTOR DEBT PORTFOLIOS 2017 PLN 1.9bn 2016 PLN 0.5bn 2015 PLN 0.2bn
34 ...translate into growing fair value of the debts fair value of the debt (PLNm) +PLN 244m (+34% y/y) / / / / /2017 BEST I, BEST II, BEST IV i BCI BEST III (50%) the debt portfolio value growth is largely attributable to new portfolio investments as at the end of 2017, the value of the debt portfolio in the Italian market was equal to 6% of the fair value of the debts the nominal value of the debt, including owned and thirdparty accounts, was close to PLN 16bn estimated future recoveries from the portfolio (ERC) (as at Dec ) 2, % 1, % 220% up to 1 year up to 5 years total ERC (PLNm) ERC as % of the portfolio fair value estimated future recoveries from the portfolio attributable to the BEST Group, as at Dec (PLN 966m): PLN 2.1bn nearly PLN 1.4bn of expected recoveries from the current portfolio over the next 5 years (64% of total ERC)
35 Favourable cash EBITDA trends full cash EBITDA* (PLNm) full cash EBITDA* 2017 (PLNm) PLN 148.2m PLN 186.8m (+26% y/y) PLN 186.8m PLN 115.5m (62%) PLN 32.2m (17%) Q1'16 Q2'16 Q3'16 Q4'16 Q1'17 Q2'17 Q3'17 Q4'17 PLN 39.2m (21%) Adjusted cash EBITDA Kredyt Inkaso's contribution to cash EBITDA BEST I, BEST II, BEST IV i BCI BEST III (50%) Kredyt Inkaso (33,04%) * in conformity with the calculation presented on slide 18 recoveries from purchased portfolios will be the key driver of cash EBITDA generation growing recoveries in connection with new investments (in the last 12 months, the Group invested PLN 300m in new debt portfolios) will support further strong growth of performance figures
36 Financial performance figures (PLNm) y/y change Q4 17 Q4 16 y/y change operating income (6)% % income from debt portfolios (BEST I, BEST II, BEST IV, BCI) % (9)% recoveries % % portfolio amortisation (50.2) (33.4) 50% (14.4) (11.6) 24% change in estimation parameters (88)% (9.2) 7.0 >(100)% investments (BEST III, KI) (40)% (22)% other income % >100% operating expenses % % EBIT (32)% (1)% net finance costs % % impairment loss on the investment in KI net profit (loss) % 8.7 (29.9) >100% adjusted cash EBITDA* % % growth in income from debt portfolios (+2% y/y) based on a growth in recoveries at the Group s own funds (+48% y/y) high cash EBITDA (+76% in Q and +29% in 2017 y/y) generated as a result of increased investments in recent quarters and a focus on the Group s operating efficiency other income associated with BEST III (debt portfolio and fund management) and other services * in conformity with the calculation presented on slide 18
37 Summary Key achievements and completed projects Q an investment vehicle set up in Italy and portfolios with a GBV of nearly EUR 300m purchased preventive measures taken with respect to debts at risk of becoming prescribed in connection with proposed amendments to the Polish Civil Code a prospectus for the Group s third public bond issue programme (up to PLN 350m) approved by the PFSA and a private bond issue programme (up to PLN 250m) established record high investments in new debt portfolios PLN 100.7m (-16% y/y) PLN 300.8m (+16% y/y) rapidly growing recoveries attributable to BEST PLN 61.9m (+31% y/y) PLN 238.3m (+32% y/y) activity in the debt market: bond issues bond redemptions PLN 56m (T1 public offering) - PLN 206m (public offering) EUR 7.6m (private placement) PLN 10m (BEST II) Financial performance figures Q operating income PLN 44.5m (+2% y/y) PLN 198.6m (-6% y/y) net profit PLN 8.7m (+>100% y/y) PLN 55.5m (+42% y/y) adjusted cash EBITDA* (excluding KI s contribution) PLN 45.1m (+76% y/y) PLN 147.7m (+29% y/y) * in conformity with the calculation presented on slide 18
38 Thank you Contact for investors: GENESIS PR Phone: BEST Investor Profile to receive key personalized information on the BEST Groupdirectly to your address, please register at in the For Investors -> BEST Investor Profile section. Disclaimer: This analysis has been prepared for information purposes only, and is not a solicitation of an offer to buy or sell any financial instruments. This material is not an advertisement, an offer or an invitation to purchase financial instruments. It is based on information from sources considered by BEST S.A. to be reliable and accurate, but no assurance can be given that such sources are exhaustive or fully reflect the facts. This document may contain some forwardlooking statements, which represent an investment risk or a source of uncertainty and may materially differ from actual performance. BEST S.A. shall not be held liable for the consequences of any decisions made on the basis of this analysis. This analysis should not be considered a source of knowledge sufficient for making investment decisions. Responsibility for using data presented in this analysis rests solely with the user. This document is protected under the Polish Act on Copyright and Neighbouring Rights. Any copying, publication or dissemination of this analysis is subject to BEST S.A. s written consent.
39 Appendix cash EBITDA (PLNm) BEST (BEST I, BEST II i BEST IV, BCI) BEST s interest % % % recoveries other income OPEX (excluding D&A) (49.5) (72.5) (102.0) BEST III BEST s interest 50.00% 50.00% 50.00% cash EBITDA recoveries other income OPEX (23.6) (28.6) (22.1) adjusted cash EBITDA Kredyt Inkaso* BEST s interest 32.99% 32.99% 33.04% cash EBITDA recoveries other income OPEX (excluding D&A)** (14.4) (82.4) (86.1) full cash EBITDA * The differences between the level of cash EBITDA presented in this table and in BEST s consolidated financial reports are attributable to the availability of financial information of Kredyt Inkaso as at the date of publication of the reports. In this presentation, financial information of Kredyt Inkaso has been accounted for in the periods to which it relates. ** Operating expenses plus income tax and profit attributable to non-controlling interests.
40 Appendix consolidated statement of financial position (PLNm) Dec Dec Dec assets, including: cash and cash equivalents purchased debt investments in jointly controlled entities investments in associates investment property equity and liabilities, including: financial liabilities equity net debt net debt/equity
41 Appendix structure of the BEST Group BEST S.A. BEST S.A. shareholder structure (% of share capital held) BEST TFI SA 100% 100% Kancelaria Radcy Prawnego Rybszleger Sp. K. BEST Capital FIZAN 100% 100% 100% BEST I NSFIZ 51% BEST Nieruchomości BEST Capital Italy S.r.l. 5.7% free float 14.1% Marek Kucner 100% BEST II NSFIZ 33% Kredyt Inkaso** 50% BEST III NSFIZ* 50% 61% 100% BEST IV NSFIZ 80.2% Krzysztof Borusowski * jointly controlled entity ** associate
REPORT ON OPERATIONS FOR H1, 2016
 REPORT ON OPERATIONS FOR H1, 2016 Gdynia, 29 August 2016 TABLE OF CONTENTS SUMMARY OF RESULTS IN H1, 2016... 3 I. GENERAL INFORMATION ON THE BEST S.A. CAPITAL GROUP... 4 1.1. STRUCTURE OF THE GROUP...
Chapter II. Section 1. The following text is added at the beginning:
 Appendix 26 approved by the Polish Financial Supervision Authority on September 2nd 2015, to the Base Prospectus of of mbank Hipoteczny S.A. (formerly BRE Bank Hipoteczny S.A.), approved by the Polish
SEPARATE FINANCIAL STATEMENTS FOR 2016
 SEPARATE FINANCIAL STATEMENTS FOR 2016 Gdynia, 11 April 2017 CONTENTS These separate financial statements contain: I. SEPARATE STATEMENT OF FINANCIAL POSITION... 3 II. SEPARATE STATEMENT OF COMPREHENSIVE
CAPITAL GROUP CONSOLIDATED PERIODIC REPORT OF BEST S.A. S CAPITAL GROUP FOR Q1 2016
 CAPITAL GROUP CONSOLIDATED PERIODIC REPORT OF BEST S.A. S CAPITAL GROUP FOR Q1 2016 GDYNIA, 10 MAY 2016 1 CONTENTS I. SELECTED FINANCIAL DATA OF THE CONSOLIDATED PERIODIC REPORT OF BEST S.A. S CAPITAL
Presentation of Q1 Q results KRUK Group
 Presentation of Q1 results KRUK Group October 28th Agenda Introduction Operating activities Financial performance Additional information 2 KRUK s net profit after the first three quarters of represents
CONSOLIDATED FINANCIAL STATEMENTS FOR 2016
 CONSOLIDATED FINANCIAL STATEMENTS FOR 2016 Gdynia, 11 April 2017 CONTENTS These consolidated financial statements contain: I. CONSOLIDATED STATEMENT OF FINANCIAL POSITION... 4 II. CONSOLIDATED STATEMENT
KRUK Group. Presentation of Half-Year 2014 Results. KRUK Group
 KRUK Group Presentation of Half-Year Results KRUK Group September Agenda Introduction Debt collection market Operating activities Debt management market in Germany Financial results Appendices 2 PLN 100m
Santander Consumer Finance
 24 April 2018 Santander Consumer Finance Q1'18 Earnings Presentation Disclaimer Banco Santander, S.A. ("Santander") cautions that this presentation contains forward-looking statements. These forward-looking
Chapter II. Section 1. The following text is added at the beginning:
 Appendix 21 approved by the Polish Financial Supervision Authority on September 4th 2014, to the Base Prospectus of mbank Hipoteczny S.A. (formerly BRE Bank Hipoteczny S.A.), approved by the Polish Financial
Santander Consumer Finance
 25 July 2018 Santander Consumer Finance H1'18 Earnings Presentation Disclaimer Banco Santander, S.A. ("Santander") cautions that this presentation contains forward-looking statements. These forward-looking
Page 2 of the cover. The last paragraph is changed to read as follows:
 Appendix 4 approved by the Polish Financial Supervision Authority on September 7th 2010, to the Base Prospectus of BRE Bank Hipoteczny S.A., approved by the Polish Financial Supervision Authority on October
Presentation of Q results KRUK Group
 Presentation of 2017 results KRUK Group April 27th 2017 Agenda Introduction Operating activities Financial performance Additional information 2 KRUK begins the year with record net profit of PLN 80m, highest
CAPITAL GROUP SPÓŁKA AKCYJNA CONSOLIDATED PERIODIC REPORT OF BEST S.A. CAPITAL GROUP FOR Q1 2015
 CAPITAL GROUP SPÓŁKA AKCYJNA CONSOLIDATED PERIODIC REPORT OF BEST S.A. CAPITAL GROUP FOR Q1 2015 GDYNIA, 14 MAY 2015 CONTENTS: I. SELECTED FINANCIAL DATA OF THE CONSOLIDATED PERIODIC REPORT OF BEST S.A.
Presentation of Q results KRUK Group. May 8th 2016
 Presentation of Q1 2016 results KRUK Group May 8th 2016 Agenda Introduction Operating activities Financial performance Additional information 2 KRUK in Q1 2016: record performance, strong recoveries and
Santander Consumer Finance
 30 January 2019 Santander Consumer Finance 2018 Earnings Presentation Disclaimer Banco Santander, S.A. ("Santander") cautions that this presentation contains forward-looking statements. These forward-looking
PRAGMA GROUP. presentation
 PRAGMA GROUP presentation 1 About Pragma Group Pragma is one of largest polish financial non-banking group that provides services to SME companies. The Group operates in Poland but approaches expansion
Presentation of H results KRUK Group. September 5th 2017
 Presentation of 2017 results KRUK Group September 5th 2017 Agenda Introduction Non performing loans market Operating activities Financial performance Additional information 2 2017 at KRUK: PLN 647m in
Important information
 26 April 2012 1 Important information 2 Banco Santander, S.A. ("Santander") cautions that this presentation contains forward-looking statements. These forward-looking statements are found in various places
OPEN FINANCE GROUP RESULTS AFTER FIRST QUARTER OF Presentation of financial results for investors and analysts
 OPEN FINANCE GROUP RESULTS AFTER FIRST QUARTER OF 213 Presentation of financial results for investors and analysts Warsaw, May 9, 213 BASIC FINANCIAL INFORMATION - OPEN FINANCE GROUP CHANGE DATA AT THE
Presentation of Q1-Q results KRUK Group
 Presentation of results KRUK Group October 29th Agenda Introduction Operating activities Financial performance Additional information 2 In, KRUK delivered PLN 291m in net profit, just under PLN 1bn in
1.1. Corporate governance rules applicable to the Company Indication of provisions abandoned by the Issuer
 Company statement on the application of corporate governance, included in the annual report of BEST S.A. for 2015 (rule I.Z.1.12) I. CORPORATE GOVERNANCE IN THE COMPANY 1.1. Corporate governance rules
4finance Holding SA Investor Presentation for 6 month 2016 results
 4finance Holding SA Investor Presentation for 6 month 2016 results 31 August, 2016 0 Summary of first half 2016 4finance has established a leading business with strong growth prospects European market
26 October 2017 POLAND. January September 2017
 26 October 2017 POLAND January September 2017 Disclaimer Banco Santander, S.A. ("Santander") and Banco Bank Zachodni WBK, S.A. ( BZ WBK ) caution that this presentation contains statements that constitute
Merger of Getin Noble Bank and Idea Bank. January 2019
 Merger of Getin Noble Bank and Idea Bank January 2019 DISCLAIMER This presentation (the Presentation ) has been prepared by Getin Noble Bank S.A. ( GNB ) and Idea Bank S.A. ( IB ) (jointly the Banks )
Company Overview and Financials. Technology Driven Consumer Finance
 Company Overview and Financials Technology Driven Consumer Finance History & Vision Proprietary Process Automation Credissimo developed in-house an innovative technology that introduced automated instant
Company Overview and Financials. Technology Driven Consumer Finance
 Company Overview and Financials Technology Driven Consumer Finance History & Vision Proprietary Process Automation Credissimo developed in-house an innovative technology that introduced automated instant
Bank Millennium Medium Term Strategy for Warsaw, October 29, 2012
 Bank Millennium 1 Half 2011 results Bank Millennium Medium Term Strategy for 2013-2015 Warsaw, October 29, 2012 Disclaimer This presentation (the Presentation ) has been prepared by Bank Millennium S.A.
Interim Results Interim Results. for the half-year ended 30 June Allied Irish Banks, p.l.c.
 Interim Results 2006 Interim Results for the half-year ended 30 June 2006 Allied Irish Banks, p.l.c. 1 Forward looking statements A number of statements we will be making in our presentation and in the
24 April Poland. Q1'18 Earnings Presentation
 24 April 2018 Poland Q1'18 Earnings Presentation Disclaimer Banco Santander. S.A. ("Santander") and Banco Bank Zachodni WBK. S.A. ( BZ WBK ) caution that this presentation contains statements that constitute
Bank Millennium Group
 Bank Millennium Group Bank Millennium Strategy, Summary of L series share issue and Presentation for 2009 results Bank Millennium s General Shareholders Meeting 22 April 2010 Disclaimer This presentation
SANTANDER CONSUMER FINANCE
 26 October 2017 SANTANDER CONSUMER FINANCE January - September 2017 Disclaimer Banco Santander, S.A. ("Santander") cautions that this presentation contains statements that constitute forward-looking statements
Presentation of H results KRUK Group. September 7th 2018
 Presentation of 2018 results KRUK Group September 7th 2018 Agenda Introduction Debt market Operating activities Financial performance Additional information 2 KRUK in 2018: strong cash generation and solid
Bank Millennium Group
 Bank Millennium Group 2008 Results and New Strategy Millennium 2010 Presentation for Bank Millennium s General Meeting of Shareholders 27 March 2009 1 Disclaimer The matters discussed in this presentation
Full year % EBIT margin. Quarter Change, % 31 Dec Change, %
 Year-end report October December Gross cash collections on acquired loan portfolios increased 7 per cent to SEK 1,105m (1,032). Total revenue increased 9 per cent to SEK 676m (622). Reported EBIT was SEK
Acquisition of Core Deutsche Bank Polska & DB Securities S.A. 14 December 2017
 Acquisition of Core Deutsche Bank Polska & DB Securities S.A. 14 December 2017 Disclaimer This presentation (the Presentation ) has been prepared by Bank Zachodni WBK S.A. ( ) solely for information purposes
SANTANDER CONSUMER FINANCE
 26 th April 2017 SANTANDER CONSUMER FINANCE January March 2017 Disclaimer Banco Santander, S.A. ("Santander") cautions that this presentation contains forward-looking statements. These forward-looking
FINANCIAL RESULTS 3Q 2016 Solid results towards full year plan delivery
 FINANCIAL RESULTS 3Q 2016 Solid results towards full year plan delivery Warsaw, 10.11.2016 Disclaimer This presentation (the Presentation ) has been prepared by Bank Polska Kasa Opieki Spółka Akcyjna (
THE GPW GROUP STRATEGY
 THE GPW GROUP STRATEGY # Economic development # SME activation # Innovation catalyst # Accelerated returns # Business lines development # Stable dividend policy # Client-centric products # New trading
Interim report January March 2015
 Interim report January March Gross cash collections SEK 791m Portfolio acquisitions SEK 273m January March (compared with the first quarter ) Gross cash collections increased by 48 per cent to SEK 791m
Presentation of H results KRUK Group. August 28th 2016
 Presentation of H1 2016 results KRUK Group August 28th 2016 Agenda Introduction Debt market Operating activities Financial performance Additional information 2 KRUK in H1 2016: PLN 111m in net profitand
Lindorff. Company Presentation. November 2016
 Lindorff Company Presentation November 06 Disclaimer IMPORTANT INFORMATION Not for distribution in or into the United States, Australia, Canada, Japan or any other jurisdiction in which such distribution
BANK PEKAO S.A. GROUP
 BANK PEKAO S.A. GROUP Financial results after 4Q 2005 Strong results, positive outlook Warsaw, 21 February, 2006 DISCLAIMER Forward looking statements This presentation contains certain forward-looking
INVESTOR PRESENTATION
 INVESTOR PRESENTATION Fourth Quarter 2018 Conference call December 5, 2018 at 11:00 am lbcfg.ca1 Caution Regarding Forward-Looking Statements In this document and in other documents filed with Canadian
BANK BGŻ BNP PARIBAS GROUP PRESENTATION OF 1H 2017 RESULTS
 BANK BGŻ BNP PARIBAS GROUP PRESENTATION OF 1H 2017 RESULTS Warsaw, 31 August 2017 1 Disclaimer This presentation does not constitute an offer or solicitation of an offer and under no circumstances shall
3Q 2006 results. Warsaw, 9 November 2006
 2006 Warsaw, 9 Information for investors Some statements contained in this press release represent future predictions and forecasts. Such statements are based on the current views and assumptions of the
Financial presentation of the Group for H1 2016
 Financial presentation of the for H1 2016 Warsaw, 12 th of August 2016 Getin Holding Macro-situation in foreign business POLAND The projected stable annual GDP growth at 3.2% for the second quarter. 2016
31 January 2017 POLAND. January December 2017
 31 January 2017 POLAND January December 2017 Disclaimer Banco Santander, S.A. ("Santander") and Banco Bank Zachodni WBK, S.A. ( BZ WBK ) caution that this presentation contains statements that constitute
ESB. Debt Investor Presentation Business Update. Pat Fenlon Group Finance Director. Gerry Tallon Group Treasurer
 ESB Debt Investor Presentation Business Update Pat Fenlon Group Finance Director Gerry Tallon Group Treasurer Ted Browne Manager, Investor Relations & Credit Rating December 2017 esb.ie/ir Disclaimer Forward
Preliminary Results Preliminary Results. for the year ended 31 December 2004 Allied Irish Banks, p.l.c.
 Preliminary Results 2004 Preliminary Results for the year ended 31 December 2004 Allied Irish Banks, p.l.c. Forward looking statements A number of statements we will be making in our presentation and in
Financial Results for 2Qs08
 Financial Results for 2Qs 2008 Entry into General Electric Company Warsaw, July 30, 2008 Page 1 Executive summary Macroeconomic situation 2Qs08 financial results Appendices Loan book overview Business
6 th Capital Markets Day 12 December 2008, Vienna
 , Vienna An in-depth look at assets and asset quality Bernhard Spalt, Chief Risk Officer Presentation topics Analysing customer loans Overview CEE loan book in detail Real estate loans in detail Non-performing
Financial Results for IQ 2005
 Meeting Expectations Warsaw, 4 May 25 Page 1 Executive summary Macroeconomic situation Financial results for Appendices Business development Detailed financial data Page 2 Highlights Starting from I Q
Interim report January - June 2015
 Interim report January - June 2015 July 31, 2015 Continued stable earnings and growth Introduction to Hoist Finance Introduction Established in 1994, Hoist Finance is a leading debt restructuring partner
WSE GROUP FINANCIAL RESULTS Q FEBRUARY
 WSE GROUP FINANCIAL RESULTS 24 FEBRUARY 2015-1- Introduction Paweł Tamborski, President of the WSE Management Board -2- In, We Reinforced WSE Group s Foundations Our activities in were aimed at strengthening
31 October Poland. 9M'18 Earnings Presentation
 31 October 2018 Poland 9M'18 Earnings Presentation Disclaimer Banco Santander. S.A. ("Santander") and Banco Bank Zachodni WBK. S.A. ( BZ WBK ) caution that this presentation contains statements that constitute
22 MARCH 2018 NET GAMING EUROPE AB (PUBL) ABG igaming Seminar. Marcus Teilman PRESIDENT & CEO
 ABG igaming Seminar. Marcus Teilman PRESIDENT & CEO") 22 MARCH 2018 NET GAMING EUROPE AB (PUBL) ABG igaming Seminar Marcus Teilman PRESIDENT & CEO NET GAMING IN BRIEF Net Gaming in numbers 130+ NUMBER OF REVENUE WEBSITES 2005 FOUNDED 3 NUMBER OF OFFICES 82
22 MARCH 2018 NET GAMING EUROPE AB (PUBL) ABG igaming Seminar Marcus Teilman PRESIDENT & CEO NET GAMING IN BRIEF Net Gaming in numbers 130+ NUMBER OF REVENUE WEBSITES 2005 FOUNDED 3 NUMBER OF OFFICES 82
24 April Mexico. Q1'18 Earnings Presentation
 24 April 2018 Mexico Q1'18 Earnings Presentation Disclaimer Banco Santander, S.A. ("Santander") cautions that this presentation contains statements that constitute forward-looking statements within the
BANK BGŻ BNP PARIBAS S.A. GROUP
 BANK BGŻ BNP PARIBAS S.A. GROUP PRESENTATION OF FIRST QUARTER 2018 FINANCIAL RESULTS Warsaw, 17 May 2018 Results 1Q 2018 1 I II III IV V VI Essential facts & information Macroeconomic situation Financial
Results of Asseco Group
 Results of Asseco Group H1 2016 25 August 2016 2 Asseco Group in H1 2016 Double-digit revenue growth of the Group sales higher by nearly PLN 0.5 billion than in the comparable period last year. Continued
Portfolio acquisitions. SEK 1.7 bn
 Interim Report January - September Gross cash collections SEK 1.8 bn Portfolio acquisitions SEK 1.7 bn EBIT margin 32% Capital adequacy ratio 12.49% January - September compared to January - September
VTB Group Quality Growth Strategy Highlights
 VTB Group 2014 Quality Growth Strategy Highlights Yulia Chupina / Deputy President and Chairman of VTB Bank Management Board Herbert Moos / Deputy President and Chairman of VTB Bank Management Board April
FY18 Results Presentation Bravura Solutions Limited. 28 August 2018
 FY18 Results Presentation Bravura Solutions Limited 28 August 2018 Important notice and disclaimer The information contained in this document (including this notice) and discussed at this presentation
INVESTMENT FUNDS AND ASSET MANAGEMENT MARKET IN POLAND,
 INVESTMENT FUNDS AND ASSET MANAGEMENT MARKET IN POLAND, 2017 2019 by September 2017 Version: 17.4 Report Order Form / formularz zamówienia We order the following report: Investment Funds and the Asset
Interim report January - March 2015
 Interim report January - March 2015 May 6, 2015 Stable earnings geared for growth Introduction to Hoist Finance Introduction Established in 1994, Hoist Finance is a leading debt restructuring partner to
Press Release DOBANK: NEW GROUP STRUCTURE AND BUSINESS PLAN
 Press Release DOBANK: NEW GROUP STRUCTURE AND 2018-2020 BUSINESS PLAN New Group structure: The Board of Directors has approved the project to transform dobank into a servicing company, allowing a better
Difficult economic situation in Italy and lower future. Swisscom's net income reduced by CHF 1.2 billion. 14 December 2011
 Difficult economic situation in Italy and lower future growth lead to an impairment of Fastweb Swisscom's net income reduced by CHF 1.2 billion 14 December 2011 In brief 2 > The book value of Fastweb has
BZWBK Group. Results 1H12. July 26 th, 2012
 1 BZWBK Group Results 1H12 July 26 th, 2012 2 This presentation as regards the forward looking statements is exclusively informational in nature and cannot be treated as an offering or recommendation to
GETBACK CAPITAL GROUP INTERIM CONDENSED CONSOLIDATED FINANCIAL STATEMENTS FOR THE PERIOD OF 6 MONTHS ENDED /44
 GETBACK CAPITAL GROUP INTERIM CONDENSED CONSOLIDATED FINANCIAL STATEMENTS FOR THE PERIOD OF 6 MONTHS ENDED 30.06.2017 1/44 TABLE OF CONTENTS SELECTED FINANCIAL DATA... 3 INTERIM CONDENSED CONSOLIDATED
in Vattenfall Heat Poland S.A. 23 August 2011
 PGNiG to acquire 99.8% stake in Vattenfall Heat Poland S.A. 23 August 2011 PGNiG has signed preliminary SPA to acquire 99.8% stake in Vattenfall Heat Poland S.A. The Management Board of Polskie Górnictwo
BANK BGŻ BNP PARIBAS GROUP
 BANK BGŻ BNP PARIBAS GROUP PRESENTATION OF RESULTS FOR 3 QUARTERS OF 2017 Warsaw, 9 November 2017 1 Disclaimer This presentation does not constitute an offer or solicitation of an offer and under no circumstances
FITCH AFFIRMS POLAND'S PGE AT 'BBB+'; OUTLOOK STABLE
 FITCH AFFIRMS POLAND'S PGE AT 'BBB+'; OUTLOOK STABLE Fitch Ratings-Warsaw/London-05 August 2016: Fitch Ratings has affirmed PGE Polska Grupa Energetyczna S.A.'s (PGE) Long-Term Foreign and Local Currency
Acquisition of Core Bank BPH
 Acquisition of Core Bank BPH 0 TRANSACTION HIGHLIGHTS Acquisition of 87% of Core Bank BPH from GE with c.pln8.5bn of net loans (excluding, inter alia, entire mortgage portfolio PLN, CHF and other currencies,
Idea Bank S.A. Group Results Q3 2016
 Idea Bank S.A. Group Results Q3 2016 Presentation of the Management Board for Investors October 20, 2016 Q3 2016 Fact Sheet In 3Q 2016 net profit from continued operations amounted to PLN 51.7m. 3Q2016
Eugene Sheehy. Group Chief Executive
 1 Eugene Sheehy Group Chief Executive Forward looking statements A number of statements we will be making in our presentation and in the accompanying slides will not be based on historical fact, but will
This document is a translation of a document originally issued in Polish. The only binding version is the original Polish version.
 PKO Bank Hipoteczny SA Directors Report for the year ended 31 December 2017 Table of Contents 1. INTRODUCTION... 3 2. EXTERNAL OPERATING CONDITIONS... 4 The macroeconomic environment... 4 Residential real
For personal use only
 Wilsons Rapid Insights Conference presentation Amber Stoney, CFO 10 November 2016 The numbers in this presentation have been presented in US dollars (USD), unless otherwise indicated. Who we are We take
Business Update. USPP Conference Miami. Luis Damasceno Group CFO Michael Williams Group Finance Director & Treasurer January 2019
 Business Update USPP Conference Miami Luis Damasceno Group CFO Michael Williams Group Finance Director & Treasurer 23-25 January 2019 www.alsglobal.com IMPORTANT NOTICE AND DISCLAIMER This presentation
Acquisition of Northpoint Commercial Finance A Leading North American Inventory Finance Lender. May 18, 2017
 Acquisition of Northpoint Commercial Finance A Leading North American Inventory Finance Lender May 18, 2017 1 Disclaimer & Prospectus Information This presentation has been prepared by Laurentian Bank
BANK ZACHODNI WBK GROUP 1H 2018 RESULTS 25 JULY 2018
 BANK ZACHODNI WBK GROUP 1H 2018 RESULTS 25 JULY 2018 Bank Zachodni WBK S.A. ("BZ WBK") cautions that this presentation contains forward-looking statements. These forward-looking statements are found in
POSTE ITALIANE - DELIVER 2022
 POSTE ITALIANE - DELIVER 2022 Poste Italiane launches five-year strategic plan Deliver 2022 to unlock the value of Italy s leading distribution network Mail & Parcel turnaround coupled with expanded Financial
Siemens Gamesa Renewable Energy Q Results
 Siemens Gamesa Renewable Energy Q2 208 Results 04 May 208 Disclaimer This material has been prepared by Siemens Gamesa Renewable Energy, and is disclosed solely for information purposes. This document
Investment Funds and Asset Management in Poland,
 Investment Funds and Asset Management in Poland, 2018 2020 by September 2018 Version: 18.3 Report Order Form / formularz zamówienia / We order the following report: Investment Funds and the Asset Management
IIIQ 2018 RESULTS PRESENTATION. 24 października 2017
 IIIQ 2018 RESULTS PRESENTATION 24 października 2017 8 NOVEMBER 2018 AGENDA Financial data Operational data Market environment Regulatory environment Appendix 2 FINANCIAL DATA FINANCIAL DATA Financial consolidated
36.7% EBIT margin. SEK million
 Q1 January March Gross cash collections on acquired loan portfolios increased by 34 per cent to SEK 1,056m (791). Total revenue increased by 27 per cent to SEK 638m (501). Reported EBIT was SEK 234m (159)
PRESENTATION FOR INVESTORS. March 2018r.
 PRESENTATION FOR INVESTORS 1 March 2018r. 1 2 LC CORP GROUP SUMMARY 2017 Housing sector 2029 units sold 1801 units delivered 2154 units added to the offer Commercialisation sector The first fair value
DOM DEVELOPMENT S.A. Management Board s Report of Activities of. in the first half of 2018
 DOM DEVELOPMENT S.A. Warsaw, 23 August 2018 CONTENTS APPROVAL BY THE MANAGEMENT BOARD OF THE MANAGEMENT BOARD S REPORT OF ACTIVITIES OF DOM DEVELOPMENT S.A. IN THE FIRST HALF OF 2018... 3 INTRODUCTION...
For personal use only ANNUAL GENERAL MEETING CEO PRESENTATION 21 NOVEMBER 2017
 ANNUAL GENERAL MEETING CEO PRESENTATION 21 NOVEMBER 2017 2 COMPANY OVERVIEW 3 PERFORMANCE UPDATE 7 MARKET OPPORTUNITY 12 OPERATING & FINANCIAL HIGHLIGHTS 15 SUMMARY & OUTLOOK 18 3 COMPANY OVERVIEW Company
Investor Presentation
 Investor Presentation 1 Disclaimer This document has been prepared by Energy One Limited (EOL) and comprises written materials and slides for a presentation concerning EOL. This presentation is for information
Swiss Re s differentiation drives financial performance
 Swiss Re s differentiation drives financial performance Kepler Cheuvreux Swiss Seminar, 29 March 2017 Gerhard Lohmann, Chief Financial Officer Reinsurance Today s agenda Swiss Re Group at a glance Reinsurance
POP Bank Group Investor Presentation. April 2018
 POP Bank Group Investor Presentation April 2018 Executive Summary Group Alliance POP Bank Group is a Finnish financial group that offers retail banking services to private customers, small companies and
PRESENTATION FOR INVESTORS. September 2018
 PRESENTATION FOR INVESTORS 1 September 2018 1 2 LC CORP GROUP SUMMARY 3Q 2018 Housing sector 1397 units sold 1653 units delivered 889 units in the offer Commercialisation sector Increase in the fair value
This document is a translation of a document originally issued in Polish. The only binding version is the original Polish version.
 PKO Bank Hipoteczny SA Directors Report for the six-month period ended 30 June 2017 Table of Contents 1. INTRODUCTION... 3 2. EXTERNAL OPERATING CONDITIONS... 4 Macroeconomic environment... 4 Residential
Foxtons Preliminary results presentation For the year ended December 2018
 Foxtons Preliminary results presentation For the year ended December 2018 Important information This presentation includes statements that are, or may be deemed to be, forward-looking statements. These
Information on the preliminary financial and operating results for the I half of 2018
 X-TRADE BROKERS DOM MAKLERSKI S.A. (joint stock company with its registered office in Warsaw and address at ul. Ogrodowa 58, 00-876 Warszawa, entered into the Register of Business Entities of the National
Directors Report on the operations of the KRUK Group in 2014
 Directors Report on the operations of the KRUK Group in 2014 Table of contents CEO s letter 4 1. Introduction 7 1.1 General information on the Parent of the KRUK Group 7 1.2 Consolidated financial and
LINDORFF SECOND QUARTER 2015 PAGE 1/29 QUARTERLY REPORT
 LINDORFF SECOND QUARTER 2015 PAGE 1/29 Q1 QUARTERLY REPORT 2017 PAGE 2/29 LINDORFF SECOND QUARTER 2015 LINDORFF FIRST QUARTER 2017 PAGE 3/29 Financial highlights Q1 Net revenue of EUR 179m, up 33% y/y
Vita Group (VTG)! Results Presentation!
! Results Presentation!") Vita Group (VTG) Results Presentation First half FY14 Group highlights Sustained trend of strong profit, dividend growth Underlying EBITDA 1 +18%, underlying NPAT 2 +56%, dividend +66% Areas of strategic
Vita Group (VTG) Results Presentation First half FY14 Group highlights Sustained trend of strong profit, dividend growth Underlying EBITDA 1 +18%, underlying NPAT 2 +56%, dividend +66% Areas of strategic
THE PKO BANK POLSKI SA GROUP DIRECTORS REPORT FOR THE FIRST HALF OF 2011
 THE PKO BANK POLSKI SA GROUP DIRECTORS REPORT FOR THE FIRST HALF OF 2011 Warsaw, August 2011 TABLE OF CONTENTS 1. SELECTED FINANCIAL DATA 3 2. EXTERNAL FACTORS INFLUENCING THE ACTIVITIES AND RESULTS OF
ING Bank Śląski S.A. Financial Results for 4Q Warsaw 20 February
 ING Bank Śląski S.A. Financial Results for 4Q 2007 Warsaw 20 February 2008 www.ingbank.pl Information for investors Some statements contained in this presentation represent future predictions and forecasts.
Quarter ended 30 September Financial results & business update
 Quarter ended 30 September 2013 Financial results & business update 22 October 2013 Disclaimer Any remarks that we may make about future expectations, plans and prospects for the company constitute forward-looking